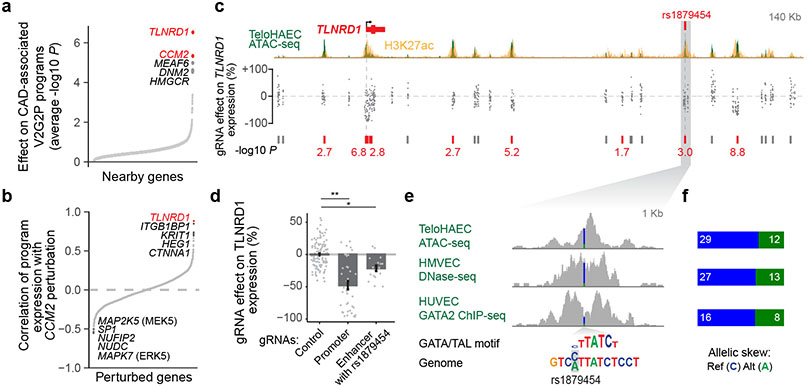
Fig. 4. Linking CAD risk variants at 15q25.1 to TLNRD1.
a. 1,503 perturbed nearby genes to CAD GWAS loci, ordered by effect on the 5 V2G2P programs for CAD (average −log10 p-value, two-sided statistical test from MAST39). Labels: top 5 genes. Red: V2G2P genes.
b. 2,284 perturbed genes ordered by their similarity with CCM2 perturbation (correlation in log2 effects on Program expression). Labels: as in (a).
c. CRISPRi-FlowFISH targeting chromatin accessible elements around TLNRD1. Each point represents the average effect on TLNRD1 gene expression of a single gRNA across 4 replicate FlowFISH experiments. Bars: elements in which CRISPRi leads to either no significant change (gray) or a significant decrease (red) in expression. Red numbers: −log10 FDR (Heteroscedastic two-sided t-test).
d. FlowFISH quantitation for guides targeting the indicated elements. Bar and whiskers: mean ± SEM. Dots: average effects, across 4 replicates, of individual gRNAs (117 negative controls (Control), 37 targeting the promoter of TLNRD1, and 17 targeting the enhancer containing rs1879454). *:FDR 2e-7. **:FDR 0.001.
e. Zoom-in on the enhancer containing rs1879454. Colored bar in signal tracks indicates read coverage of the reference (C, blue) and alternate (A, green) alleles. Bottom shows the position-weight matrix for a composite GATA/TAL motif and the genome sequence with reference and alternate alleles highlighted in gray.
f. Quantitation for allele-specific counts at rs1879454, from (e). Reads were re-aligned to both reference and alternate alleles to avoid bias toward the reference allele (see Methods).

