

Abstract
Use-dependent forms of synaptic plasticity have been extensively characterized at chemical synapses, but a relationship between natural activity and strength at electrical synapses remains elusive. The thalamic reticular nucleus (TRN), a brain area rich in gap-junctional (electrical) synapses, regulates cortical attention to the sensory surround and participates in shifts between arousal states; plasticity of electrical synapses may be a key mechanism underlying these processes. We observed long-term depression resulting from coordinated burst firing in pairs of coupled TRN neurons. Changes in gap-junctional communication were asymmetrical, indicating that regulation of connectivity depends on the direction of use. Modification of electrical synapses resulting from activity in coupled neurons is likely to be a widespread and powerful mechanism for dynamic reorganization of electrically coupled neuronal networks.
The thalamic reticular nucleus (TRN) is a shell comprising a homogenous population of parvalbumin (PV)–positive γ-aminobutyric acid (GABA)–releasing (GABAergic) neurons surrounding the dorsal thalamus (1, 2). These cells provide powerful inhibition to thalamocortical relay neurons (3) upon integration of their corticothalamic and thalamocortical inputs. In addition to its proposed role in focusing the neural spotlight of attention (4, 5), the TRN is strongly involved in regulating states of arousal (6, 7) by means of alternation between burst and tonic modes of firing. Burst firing in the TRN is a prominent component of sleep spindles (8, 9) and absence seizures (9, 10), both of which are marked by dramatic changes in cortical attention and behavioral responsiveness to sensory input.
In central mammalian neurons, electrical (gap-junctional) synapses appear all over the brain (11, 12) and mainly couple GABAergic neurons of similar subtype (13–15). Electrical synapses contribute to synchrony in coupled networks (11, 16–21), although computational studies suggest that the precise role of gap junctions in synchrony can be complex (22–24).
Cells in the TRN are densely and powerfully connected by electrical synapses (17, 18) that persist into adulthood (25) and, as in other areas, participate in its synchronous activity (18). The experimentally isolated TRN generates spindle rhythms in the absence of other inputs (26), suggesting that electrical synapses are likely to be key players in TRN synchrony and in behavioral switching between firing states.
Activity-dependent forms of plasticity have been extensively described at excitatory (glutamatergic) chemical synapses (27, 28) and, to a lesser extent, at inhibitory (GABAergic) chemical synapses (29–31). Although the issue has received far less attention than plasticity of chemical synapses, modifications of electrical synapses have been documented in a handful of reports (32, 33). Because electrical synapses are likely to play a major role in coordinating TRN activity, we sought to investigate the effects of natural forms of activity in coupled neurons on the strength of the electrical synapses between them.
We recorded from pairs of gap junction–coupled TRN neurons (Fig. 1A) within conventional thalamocortical brain slices (34). To measure electrical synaptic strength, we delivered hyperpolarizing current injections into one neuron (cell 1) while recording voltage (V) responses in both neurons, which were maintained at a baseline Vm = −65 mV (Fig. 1B). Using these deflections, we determined the coupling coefficient cc12 = ΔVcell 2/ΔVcell 1, and from injecting current into cell 2, similarly determined cc21 = ΔVcell 1/ΔVcell 2. We also calculated coupling conductance GC (34) in each direction. From a total of 313 paired recordings of coupled TRN neurons, we found an average cc of 0.12 ± 0.08 and GC of 0.80 ± 0.63 nS (mean ± SD) (Fig. 1C), which is in line with the values for previous reports in TRN (17, 18, 33) and of similar size to cc values reported in the cortex and other areas (35–37). Other parameters, such as intraneuronal distance and probability of coupling, were similar to previous reports (18).
Fig. 1.

(A) Magnification 60× infrared image from patch recordings of a coupled pair of TRN neurons. (B) Current injection into one cell (I1) of a coupled pair drives a direct response in that cell (V1) and a gap junction–relayed response in the second cell (V2); cc12 = ΔV2/ΔV1. Scale bars, 5 mV, 0.1 s. (C) Mean electrical synaptic conductance (GC) plotted against mean cc (dots). Open circles are binned averages, with a slope of 7.9 [bin width, 0.02; coefficient of determination (r2) = 0.77]. (D) Directional cc (purple, scaled by 10) and GC (orange) for each pair; 1→2 represents coupling measured by current injection into cell 1, as in (B). (E) Coupling asymmetry was quantified by distribution of ratios (cc12/cc21 and G12/G21, larger value/smaller; bin width, 0.05). (F) Spikes driven by current injection into one cell (gray) caused spikes in the unstimulated coupled cell (black), as shown for three pairs with cc between 0.2 and 0.4 maintained at baseline Vm ≈ −65 mV. Scale bar, 25 mV, 0.1 s. (G) Wide-field image of TRN cells loaded with OGB-Bapta 1AM (Invitrogen, Carlsbad, California). (H) Stimulation of a patched cell (gray) drove bursting and strong calcium responses in that cell and in several neighboring cells (scale bars, 1% ΔF/F, 50 ms and 25 mV, 50 ms for bottom trace). Traces are from the cells labeled by color and number in (G).
Asymmetry of electrical synapses has been observed experimentally (36, 37). In our data, coupling was rarely symmetrical, which is shown by the spread of values when plotting cc21 against cc12 for each pair (Fig. 1D). We quantified asymmetry by the ratio of directional ccs (cc21/cc12) for each pair; for all pairs, the mean ratio of ccs was 1.6 ± 0.6 (n = 313 pairs) (Fig. 1E). Some of the observed asymmetry in cc is due to mismatches in input resistance; however, ratios of directionally measured GC (G21/G12), which are independent of input resistance (34), had a mean of 1.2 ± 0.27 (Fig. 1E).
Like many thalamic neurons, TRN neurons spike in two modes: conventional fast sodium-based tonic spikes and slower low-threshold calcium spikes (LTS), known as bursts, that are crowned by a barrage of fast sodium spikes. In many pairs in the current study, bursts elicited by positive current injection into one neuron were sufficient to drive bursts in its coupled neighbor (Fig. 1F). Imaging experiments revealed that bursting activity driven in a patched cell propagated through a network of coupled cells (Fig. 1, G and H).
To determine the effects of bursting in coupled cells on electrical synaptic strength, we tested coupling strength before and after 5 min of synchronous evoked bursting in pairs of coupled neurons. Bursting was driven by simultaneous current injections of 100 to 300 pA for 50 ms at 2 Hz through the recording electrodes of both neurons, which were maintained at membrane potentials between −65 and −70 mV by means of steady-state current injection (Fig. 2A). After paired bursting, cc was reduced by 12.0 ± 3.6%, and GC was depressed by 13.2 ± 1.8% (P < 0.05, two-tailed unpaired t test, n = 7 pairs) (Fig. 2B). This long-term depression (LTD) persisted for the length of recordings (for at least 30 min after paired bursting), with no apparent signs of diminishing (Fig. 2B). There were no significant changes in input resistance or membrane resting potential (Fig. 2C), ruling out the possibility that the observed changes in electrical synaptic strength reflected changes in the intrinsic properties of the neurons at the whole-cell level. Although pathological changes in internal calcium concentration are known to affect gap-junctional strength (32, 38), our estimates of the calcium influx from the slow rate of bursting used here are much smaller. Bursting rates in vivo are often faster than those used here (19, 26).
Fig. 2.

(A) Paired bursting driven by simultaneous current injections into both cells of coupled pairs. Scale bars, 20 mV, 50 ms. (Inset) Close-up of paired burst event. (B) Mean cc and GC before and after paired bursting (gray bar). (C) Average normalized input resistance (Rin) and membrane potential (Vm) for the neurons summarized in (B). (D) Example paired responses before and after activity pairing as in (A). Scale bars, 100 ms, 2.5 mV (coupled response, in black), 5 mV (direct response, in gray). (E) Bursting driven by current injections into one cell of a coupled pair (gray trace) while the other neuron was quiescent (black trace). Scale bars, 20 mV, 50 ms. (Inset) Close-up of burst in cell 1 and burstlet in cell 2. (F) Mean cc and GC before and after single-cell bursting (gray bar). (G) Average normalized input resistance (Rin) and membrane potential (Vm) for the neurons summarized in (F). (H) Example paired responses before and after activity pairing as in (E). Scale bars, 100 ms, 2.5 mV (coupled response, in black), 5 mV (direct response, in gray).
To determine whether bursting in one neuron alone is sufficient to induce LTD, we repeated the activity paradigm, this time only stimulating bursting in a single neuron of a pair (Fig. 2E) while holding the coupled cell at ~− 70 mV so as to prevent it from bursting. After single-cell bursting, cc was reduced by 15.0 ± 3.4%, and GC was reduced by 13.0 ± 2.3% (P < 0.05, n = 11 pairs) (Fig. 2F). The magnitude of LTD was not significantly different for the single-cell burst paradigm from the paired-bursting paradigm (unpaired t test).
To determine the contribution of sodium spikes to LTD, we repeated the bursting paradigm in both cells using a bath application of 1 μM tetrodotoxin (TTX), which completely and reversibly blocks the quick barrage of sodium-mediated action potentials crowning the calcium-mediated bursts (Fig. 3A). After paired bursting in TTX, cc decreased by 12.3 ± 3.2%, and GC decreased by 11.7 ± 2.6% (P < 0.05, n =9 pairs) (Fig. 3B). We also repeated the bursting paradigm in one cell alone in TTX (Fig. 3D). After single-cell activity in TTX, cc decreased by 6.5 ± 2.3%, and GC was reduced by 6.0 ± 2.0% (P < 0.05, n = 11 pairs) (Fig. 3E). When depolarized to rest just below spiking threshold (~− 40 mV) and stimulated to spike with 50-ms pulses repeated at 2 Hz, in order to emulate spiking during bursting without activating the LTS, coupling decreased by a smaller and delayed amount (ΔGC = −7.2 ± 2.0%, Δcc = −7.0 ± 2.8%; P = 0.03, n = 8 pairs; spike frequency during this paradigm was twice as slow as during LTS bursts) (fig. S2). Of these activity paradigms, the amount of depression from single-cell bursting in TTX was significantly smaller than others [P < 0.05, analysis of variance (ANOVA)] (Fig. 3H).
Fig. 3.
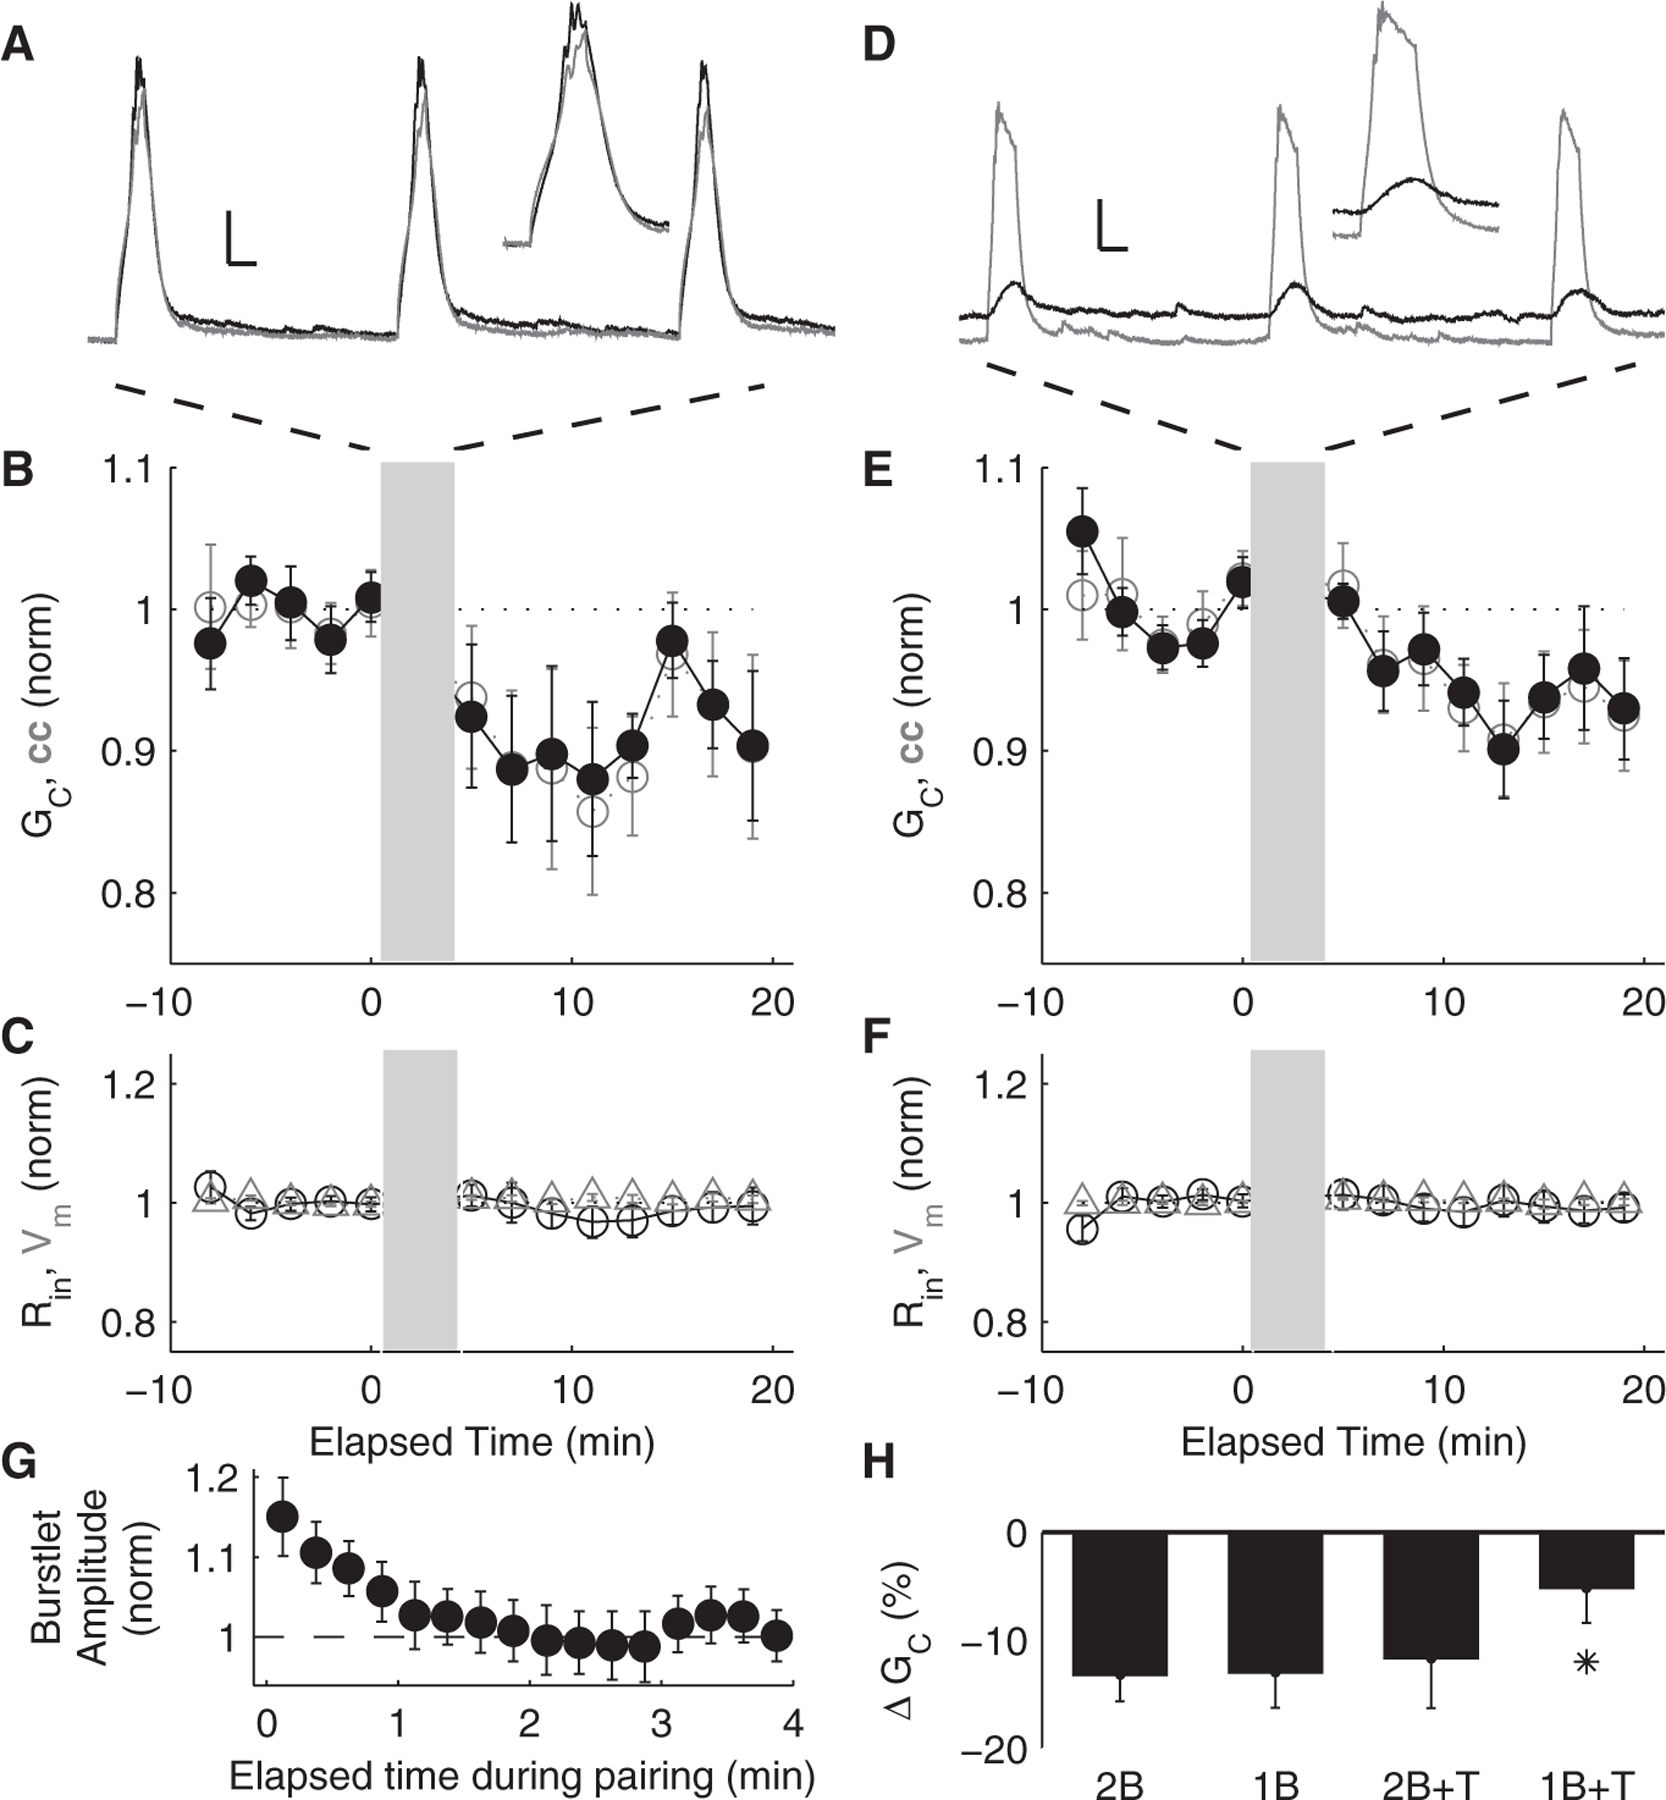
(A) Paired bursting driven by simultaneous current injections into both cells of coupled pairs, in the presence of 1 μM TTX. Scale bars, 10 mV, 50 ms. (Inset) Close-up of paired burst events. (B) Mean cc and GC before and after paired bursting in TTX (gray bar). (C) Average normalized input resistance (Rin) and membrane potential (Vm) for the neurons summarized in (B). (D) Bursting driven by injections of current into one cell of a coupled pair (gray trace) while the other neuron was quiescent (black trace), also in TTX. Scale bars, 10 mV, 50 ms. (Inset) Close-up of burst event and burstlet. (E) Mean cc and GC before and after single-cell bursting in TTX (gray bar). (F) Average normalized input resistance (Rin) and membrane potential (Vm) for the neurons summarized in (E). (G) Burstlet amplitudes (from Fig. 2E) during single-cell activity plotted against elapsed time and normalized to final values. (H) Summary of changes in GC for the four paradigms: paired bursting (2B), single-cell bursting (1B), paired bursting in TTX (2B + T), and single-cell bursting in TTX (1B + T). Asterisk indicates significance (P < 0.05, ANOVA).
Activity paradigms in which only one cell was active allowed us to characterize the time course of changes in electrical synaptic strength by measuring the amplitude of the postsynaptic burstlet in the coupled cell during the 5 min of activity. For both single-cell bursting and single-cell bursting in TTX, changes in synaptic strength (burstlet amplitude) reached their steady-state reduced values within 2 min of activity (Fig. 3G).
In two of our activity paradigms, the activity of the coupled pair, and thus the use of the synapse, was also asymmetrical (Figs. 2E and 3D)—that is, one neuron was active while the other was quiescent, resulting in largely unidirectional current flow across the gap junction channels during activity. These asymmetrical stimuli allowed us to investigate whether the LTD was also expressed asymmetrically. First, we quantified the effects of activity on each direction of coupling, with respect to the active cell. Coupling measured with current injection into cell 1 (the active cell during pairing), or outbound coupling, we denote as cc12, whereas coupling measured with current injection into the quiet cell 2 and relayed by the gap junction back to the active cell 1, or inbound coupling, is cc21 (Fig. 4A). For full bursting in one neuron (Fig. 4B), the inbound coupling cc21 decreased by 16.0 ± 3.4%, whereas outbound coupling, cc12, decreased by 8.6 ± 3.7% (P < 0.05 for both directions; two-tailed, paired t test, n = 11 pairs) (Fig. 4, C and D). The change in cc21 was significantly larger than in cc12 (P < 0.05). Directional conductances decreased similarly; G21 decreased by 10.8 ± 3.2%, and G12 decreased by 6.8 ± 3.2% (P < 0.05). For single-cell LTS bursting in TTX (Fig. 4D), inbound coupling, cc21, decreased by 10.0 ± 3.0% (P < 0.05, n = 10 pairs), whereas the change in outbound coupling, cc12, was not significant (−5.5 ± 2.7%, P = 0.07, n = 10 pairs) (Fig. 4G and H). In TTX, outbound G12 decreased by 7.5 ± 2.0% (P = 0.04), and G21 decreased by 6.6 ± 2.5% (P = 0.09).
Fig. 4.

(A) For activity in cell 1, cc12 (blue) represents the “outbound” coupling measured with current injection into cell 1, and cc21 (green) represents “inbound” coupling. (B) Single-cell bursting in cell 1 (gray) with postsynaptic burstlets in cell 2. Scale bars, 15 mV, 25 ms. (C) Inbound cc21 before and after full bursts in cell 1. (D) Outbound cc12 before and after full bursts in cell 1. (E) Ratios of directional cc [black solid circles; division of the changes in (C) divided by the changes in (D) for each pair] and GC (open circles, P < 0.05 for both cc and GC) after full bursts in cell 1, plotted against initial values. (F) Bursts in cell1 (gray) in1 μM TTX. Scale bars, 10 mV, 25 ms. (G) Inbound cc21 before and after bursts in cell 1 in TTX. (H) Outbound cc12 before and after bursts in cell 1 in TTX. (I) Ratios of directional cc (red solid squares; P = 0.6) and GC (open squares; P = 0.76) after bursts in cell 1 in TTX, plotted against initial values. (J) Model of an asymmetrical gap junction as two parallel branches. RC represents the minimum conductance (maximum resistance) common to both sides of the gap junction, and RD represents additional, asymmetrical conductance in one direction.
In principle, asymmetrical use of a gap junction could potentially act to either decrease, increase, or preserve the pre-activity asymmetry of coupling in any given pair. To examine the systematic effects of unidirectional synapse use on asymmetry, we plotted the ratios of directional ccs and GCs (cc21/cc12 and G21/G12) for each pair after unidirectional activity (Fig. 4, E and I, y axis) against the initial values (Fig. 4, E and I, x axis). The identity line corresponds to coupling asymmetry that was unaffected by asymmetrical use of the synapse. For full bursts in one cell, ratios of ccs increased on average by 9.1 ± 2.4% after activity (P < 0.01, n = 11 pairs) (Fig. 4E); this shift represents a systematic trend of greater change in the coupling of inbound communication, cc21, relative to outbound communication, cc12. Ratios of GC also increased, by 5.0 ± 2.2% (P < 0.05). Changes in asymmetry were not due to coordinated shifts in input resistance; R1/R2 decreased by 3.1 ± 2.6% (P = 0.25). For LTS bursts without sodium spikes in one cell, ratios of ccs and GCs fell along the identity line after activity, with an insignificant change in rectification from initial values (ratio of ccs: 6.0 ± 4.2%, P = 0.6; ratio of GCs: −0.6 ± 2.0%, P = 0.76; R1/R2: −5.3 ± 3.4%, P = 0.07; n = 10 pairs) (Fig. 4I), indicating that the changes in rectification may be due to sodium spikes. As expected, ratios of coupling coefficients also did not change significantly for symmetrical synaptic use (paired bursting).
Although activity-dependent changes have been extensively described and characterized at chemical synapses, long-term modification of electrical synapses by precise patterns of activity of coupled cells themselves has not yet been described. The changes we measured, ~15%, are small as compared with some changes measured at chemical synapses. Neurons receive thousands of individual chemical synaptic inputs, which are each very small, often distant from the soma, and of short, stereotyped time courses. Chemical synaptic inputs are orders of magnitude smaller than are electrical synaptic inputs and typically ineffective as single voices in driving a cell to spike. The average coupling measured here (cc = 0.12) applied to an average presynaptic burst (~50 mV) yields a ~6-mV burstlet in a coupled cell, which persists for the entire ~50 ms of the burst (Figs. 1F, 2E, and 3D); a single burstlet is often large enough to drive bursts directly in a coupled neighbor (Fig. 1). A reduction by <15% is considerable for these already strong synapses and is sufficient to prevent a cell’s burstlet from driving its neighbor to burst (fig. S1).
By preferentially diminishing coupling inbound to bursting cells, activity-dependent LTD could unplug single bursting cells from an overly active or synchronous neighbor or network or adjust input preference between intra-TRN electrical input and input from corticothalamic or thalamocortical fibers. The effects of activity-dependent changes may be more complex in vivo because of multiple electrical synapses and/or recurrent synapses between neurons.
What cellular processes might underlie the observed LTD of electrical synapses? Gap junctions are plaques comprising hundreds to thousands of individual channels. Insertion and deletion of gap junction channels is a normal component of cellular function and a candidate mechanism for changing synaptic strength. In addition, connexin36 (Cx36) proteins have multiple phosphorylation sites (39, 40). Phosphorylation-related changes in coupling mediated by either protein kinase A (41, 42) or CamKII (40) as well as hemi-channel conductance changes at Cx35 channels (43) have been described.
Our experiments indicate that electrical synaptic strength is asymmetrical at baseline and is further adjustable in a use-directional manner. Results in mice in which Cx36 has been knocked out indicate that synapses composed of non-Cx36 proteins are more asymmetrical than those in wild-type (44); thus, one possible source of asymmetry is inclusion of non-Cx36 proteins and/or pores at the synapse. Our results further indicate that coupling asymmetry can be shifted by activity; neurons can fine-tune the relative proportion of signals they send or receive to or from coupled neighbors, respectively. Increased expression or activation of non-Cx36 proteins could account for this increase in asymmetry.
Despite evidence of gap-junctional rectification in mammalian systems, the canonical symbol for those electrical synapses has remained the simple linear resistor (RC). Our observations of baseline asymmetry and activity-dependent shifts in asymmetry (Fig. 4E) led us to reconsider the standard model because a linear resistor cannot account for asymmetry or increases in asymmetry. Diodes have been used to model heavily rectifying invertebrate gap junctions (45) but have not yet been considered for mammalian gap-junctional synapses. We suggest a model of a mammalian gap-junctional synapse as two branches in parallel (Fig. 4J): One branch carries the common resistance (RC) or the maximum resistance (minimum of conductance GC) measured from both directions. A parallel branch consists of a resistor (RD) in series with a diode, representing the increase in conductance (or decreased resistance) observed as asymmetry.
Supplementary Material
Acknowledgments:
We thank D. Feldman and K. Bender for valuable feedback on previous version of the manuscript. This work was supported by the Milton Fund.
Footnotes
Supporting Online Material
References and Notes
- 1.Houser CR, Vaughn JE, Barber RP, Roberts E, Brain Res 200, 341 (1980). [DOI] [PubMed] [Google Scholar]
- 2.Ohara PT, Lieberman AR, J. Neurocytol 14, 365 (1985). [DOI] [PubMed] [Google Scholar]
- 3.Pinault D, Deschênes M, J. Comp. Neurol 391, 180 (1998). [DOI] [PubMed] [Google Scholar]
- 4.Crick F, Proc. Natl. Acad. Sci. U.S.A 81, 4586 (1984). [DOI] [PMC free article] [PubMed] [Google Scholar]
- 5.McAlonan K, Cavanaugh J, Wurtz RH, J. Neurosci 26, 4444 (2006). [DOI] [PMC free article] [PubMed] [Google Scholar]
- 6.Rowe DL et al. , Int. J. Neurosci 115, 1273 (2005). [DOI] [PubMed] [Google Scholar]
- 7.Steriade M, McCormick DA, Sejnowski TJ, Science 262, 679 (1993). [DOI] [PubMed] [Google Scholar]
- 8.Deschênes M, Paradis M, Roy JP, Steriade M, J. Neurophysiol 51, 1196 (1984). [DOI] [PubMed] [Google Scholar]
- 9.Steriade M, Trends Neurosci 28, 317 (2005). [DOI] [PubMed] [Google Scholar]
- 10.Inoue M, Duysens J, Vossen JM, Coenen AM, Brain Res 612, 35 (1993). [DOI] [PubMed] [Google Scholar]
- 11.Bennett MV, Zukin RS, Neuron 41, 495 (2004). [DOI] [PubMed] [Google Scholar]
- 12.Connors BW, Long MA, Annu. Rev. Neurosci 27, 393 (2004). [DOI] [PubMed] [Google Scholar]
- 13.Galarreta M, Hestrin S, Nat. Rev. Neurosci 2, 425 (2001). [DOI] [PubMed] [Google Scholar]
- 14.Gibson JR, Beierlein M, Connors BW, Nature 402, 75 (1999). [DOI] [PubMed] [Google Scholar]
- 15.Chu Z, Galarreta M, Hestrin S, J. Neurosci 23, 96 (2003). [DOI] [PMC free article] [PubMed] [Google Scholar]
- 16.Beierlein M, Gibson JR, Connors BW, Nat. Neurosci 3, 904 (2000). [DOI] [PubMed] [Google Scholar]
- 17.Landisman CE et al. , J. Neurosci 22, 1002 (2002). [DOI] [PMC free article] [PubMed] [Google Scholar]
- 18.Long MA, Landisman CE, Connors BW, J. Neurosci 24, 341 (2004). [DOI] [PMC free article] [PubMed] [Google Scholar]
- 19.Fuentealba P, Steriade M, Prog. Neurobiol 75, 125 (2005). [DOI] [PubMed] [Google Scholar]
- 20.Blatow M et al. , Neuron 38, 805 (2003). [DOI] [PubMed] [Google Scholar]
- 21.Tamás G, Buhl EH, Lörincz A, Somogyi P, Nat. Neurosci 3, 366 (2000). [DOI] [PubMed] [Google Scholar]
- 22.Vervaeke K et al. , Neuron 67, 435 (2010). [DOI] [PMC free article] [PubMed] [Google Scholar]
- 23.Chow CC, Kopell N, Neural Comput 12, 1643 (2000). [DOI] [PubMed] [Google Scholar]
- 24.Lewis TJ, Rinzel J, J. Comput. Neurosci 14, 283 (2003). [DOI] [PubMed] [Google Scholar]
- 25.Blethyn KL, Hughes SW, Crunelli V, Thalamus Relat. Syst 4, 13 (2008). [DOI] [PMC free article] [PubMed] [Google Scholar]
- 26.Steriade M, Domich L, Oakson G, Deschênes M, J. Neurophysiol 57, 260 (1987). [DOI] [PubMed] [Google Scholar]
- 27.Malenka RC, Bear MF, Neuron 44, 5 (2004). [DOI] [PubMed] [Google Scholar]
- 28.Froemke RC, Debanne D, Bi G-Q, Front. Syn. Neurosci 2, 19 (2010). [DOI] [PMC free article] [PubMed] [Google Scholar]
- 29.Lamsa KP, Kullmann DM, Woodin MA, Front. Syn. Neurosci 2, 8 (2010). [DOI] [PMC free article] [PubMed] [Google Scholar]
- 30.Nugent FS, Kauer JA, J. Physiol 586, 1487 (2008). [DOI] [PMC free article] [PubMed] [Google Scholar]
- 31.Haas JS, Nowotny T, Abarbanel HD, J. Neurophysiol 96, 3305 (2006). [DOI] [PubMed] [Google Scholar]
- 32.Pereda AE, Faber DS, J. Neurosci 16, 983 (1996). [DOI] [PMC free article] [PubMed] [Google Scholar]
- 33.Landisman CE, Connors BW, Science 310, 1809 (2005). [DOI] [PubMed] [Google Scholar]
- 34.Materials and methods are available as supporting material on Science Online.
- 35.Gibson JR, Beierlein M, Connors BW, J. Neurophysiol 93, 467 (2005). [DOI] [PubMed] [Google Scholar]
- 36.Devor A, Yarom Y, J. Neurophysiol 87, 3048 (2002). [DOI] [PubMed] [Google Scholar]
- 37.Mann-Metzer P, Yarom Y, J. Neurosci 19, 3298 (1999). [DOI] [PMC free article] [PubMed] [Google Scholar]
- 38.Rörig B, Sutor B, Mol. Neurobiol 12, 225 (1996). [DOI] [PubMed] [Google Scholar]
- 39.Kothmann WW, Li X, Burr GS, O’Brien J, Vis. Neurosci 24, 363 (2007). [DOI] [PMC free article] [PubMed] [Google Scholar]
- 40.Alev C et al. , Proc. Natl. Acad. Sci. U.S.A 105, 20964 (2008). [DOI] [PMC free article] [PubMed] [Google Scholar]
- 41.Urschel S et al. , J. Biol. Chem 281, 33163 (2006). [DOI] [PubMed] [Google Scholar]
- 42.Kothmann WW, Massey SC, O’Brien J, J. Neurosci 29, 14903 (2009). [DOI] [PMC free article] [PubMed] [Google Scholar]
- 43.Mitropoulou G, Bruzzone R, J. Neurosci. Res 72, 147 (2003). [DOI] [PubMed] [Google Scholar]
- 44.Zolnik T, Connors BW, presented at the Society for Neuroscience Conference, Prog. 42.14. San Diego, CA, 2010. [Google Scholar]
- 45.Furshpan EJ, Potter DD, J. Physiol 145, 289 (1959). [DOI] [PMC free article] [PubMed] [Google Scholar]
Associated Data
This section collects any data citations, data availability statements, or supplementary materials included in this article.