

Abstract
Objective
This study aimed to explore the clinicopathological characteristics and prognostic implications of gastric neuroendocrine neoplasms (g‐NENs).
Methods
A retrospective enrollment of 142 patients diagnosed with g‐NENs was conducted at Zhejiang Cancer Hospital between January 1, 2007 and December 31, 2021. The study compared essential clinicopathological features and survival rates. Additionally, the prognosis of gastric neuroendocrine carcinomas/mixed neuroendocrine–non‐neuroendocrine neoplasms (g‐NEC/MiNEN) were contrasted with those of gastric adenocarcinoma (GAC) and signet ring cell carcinoma (SRCC).
Results
The study comprised a total of 142 g‐NENs cases, with a male‐to‐female ratio of approximately 2:1. The 5‐year survival rates for g‐NEC and g‐MiNEN were 26.7% and 35.2%, respectively. Corresponding 5‐year survival rates for G1 and G2 were observed at 100% and 80.0%, respectively. g‐NEC/MiNEN showed a significantly worse prognosis compared to g‐NET (p < 0.001). g‐NEC/MiNEN exhibited a poor prognosis compared to GAC (p < 0.001), and within poorly differentiated GAC, g‐NEC/MiNEN demonstrated a worse prognosis (p = 0.007). Additionally, patients receiving postoperative adjuvant therapy exhibited notably prolonged overall survival (OS) in the case of g‐NEC/MiNEN (p = 0.010).
Conclusion
In short, the prognosis of g‐NEC/MiNEN was worse than that of g‐NET, GAC and poorly differentiated GAC, but this group benefit from postoperative adjuvant therapy.
Keywords: gastric mixed neuroendocrine–non‐neuroendocrine neoplasms, gastric neuroendocrine carcinomas, gastric neuroendocrine neoplasms, gastric neuroendocrine tumors, pathological feature, prognosis
The prognosis of g‐NEC/MiNEN was worse than that of g‐NET, GAC and poorly differentiated GAC, but this group benefit from postoperative adjuvant therapy.

1. INTRODUCTION
Neuroendocrine neoplasms (NENs) represent a rare category of neoplasms, accounting for just 0.5% of all malignant neoplasms. They can manifest in various body parts, with the stomach, pancreas, and lungs being the most common sites. 1 , 2 , 3 , 4 Gastric neuroendocrine neoplasms (g‐NENs) are even rarer, constituting approximately 7% of all gastrointestinal neuroendocrine tumors, 5 and a mere 0.1%–0.6% of all gastric tumors. 6 The incidence of g‐NENs has markedly increased in recent years, likely attributed to heightened clinician awareness, improved diagnostic techniques, and widespread utilization of upper gastrointestinal endoscopy. 7
As per the latest 2019 edition of the WHO Classification of Digestive System Tumors, NENs are classified into three distinct categories: well‐differentiated neuroendocrine tumors (NETs), poorly differentiated neuroendocrine carcinomas (NECs), and mixed neuroendocrine‐non‐neuroendocrine neoplasms (MiNEN). 8 The NET classification was further refined into G1, G2, and G3 based on grade, Mitotic rate, and Ki‐67 index. Meanwhile, NEC is categorized into large‐cell type (LCNEC) and small‐cell type (SCNEC) based on cellular morphology, 8 as delineated in Table 1. The majority of NENs fall under the well‐differentiated neuroendocrine tumors (NETs) category, exhibiting indolent biological behavior and longer survival times. 5 , 9 By contrast, NECs display a higher malignant potential, poorer prognosis, and shorter survival times. 10 g‐NEC and g‐MiNEN, as rare subtypes of gastric cancer, constitute just 0.6% of all gastric malignancies. 11 , 12 , 13 The limited understanding of g‐NENs is due to their low incidence and high heterogeneity.
TABLE 1.
Clinicopathological characteristics of 142 cases of gastric neuroendocrine neoplasms.
| Variable | g‐NEN (142) N (%) | G1 (23) N (%) | G2 (8) N (%) | MiNEN (28) N (%) | NEC (83) N (%) |
|---|---|---|---|---|---|
| Age (year) | 63.00 (55.75, 69.00) | 50.00 (47.00, 56.00) | 54.50 (50.00, 58.00) | 68.00 (58.50, 70.00) | 66.00 (60.00, 70.00) |
| Tumor size (cm) | 4.00 (2.50, 6.00) | 0.70 (0.40, 0.80) | 1.75 (0.85, 2.50) | 4.50 (3.00, 6.00) | 5.00 (3.50, 7.00) |
| LNR (%) | 11.11 (0.00, 21.74) | 0.00 (0.00,0.00) | 0.00 (0.00, 44.79) | 15.56 (2.63, 26.92) | 11.11 (0.00, 20.80) |
| Ki‐67 (%) | 60.00 (30.00, 80.00) | 2.00 (1.00, 2.00) | 5.00 (3.00, 9.25) | 80.00 (60.00, 80.00) | 70.00 (60.00, 80.00) |
| BMI | 21.78 (20.16, 24.57) | 21.30 (20.81, 24.96) | 23.24 (21.31, 24.11) | 23.42 (20.78, 26.11) | 21.19 (19.42, 24.12) |
| Gender | |||||
| Male | 97 (68.3) | 6 (26.1) | 2 (25.0) | 21 (75.0) | 68 (81.9) |
| Female | 45 (31.7) | 17 (73.9) | 6 (75.0) | 7 (25.0) | 15 (18.1) |
| Smoking history | |||||
| No | 84 (59.2) | 21 (91.3) | 6 (75.0) | 17 (60.7) | 40 (48.2) |
| Yes | 58 (40.8) | 2 (8.7) | 2 (25.0) | 11 (39.3) | 43 (51.8) |
| Drinking history | |||||
| No | 93 (65.5) | 19 (82.6) | 5 (62.5) | 19 (67.9) | 50 (60.2) |
| Yes | 49 (34.5) | 4 (17.4) | 3 (37.5) | 9 (32.1) | 33 (39.8) |
| Family history | |||||
| No | 103 (72.5) | 16 (69.6) | 6 (75.0) | 20 (71.4) | 61 (73.5) |
| Yes | 39 (27.5) | 7 (30.4) | 2 (25.0) | 8 (28.6) | 22 (26.5) |
| Weight loss | |||||
| No | 93 (65.5) | 22 (95.7) | 6 (75.0) | 19 (67.9) | 46 (55.4) |
| Yes | 49 (34.5) | 1 (4.3) | 2 (25.0) | 9 (32.1) | 37 (44.6) |
| BMI | |||||
| <18.5 | 11 (7.7) | – | 1 (12.5) | – | 10 (12.0) |
| 18.5–24.0 | 88 (62.0) | 16 (69.6) | 5 (62.5) | 17 (60.7) | 50 (60.2) |
| >24.0 | 42 (29.6) | 7 (30.4) | 2 (25.0) | 11 (39.3) | 22 (26.5) |
| Unknown | 1 (0.7) | – | – | – | 1 (1.2) |
| Symptom | |||||
| Abdominal distension and pain | 96 (67.6) | 11 (47.8) | 4 (50.0) | 17 (60.7) | 64 (77.1) |
| Obstruction of swallowing | 14 (9.9) | – | – | 5 (17.9) | 9 (10.8) |
| Hematemesis, black stool | 8 (5.6) | – | 2 (25.0) | 2 (7.1) | 4 (4.8) |
| Fatigue | 2 (1.4) | 1 (4.3) | – | – | 1 (1.2) |
| No | 22 (15.5) | 11 (47.8) | 2 (25.0) | 4 (14.3) | 5 (6.0) |
| Recurrence or metastasis | |||||
| No | 85 (59.9) | 20 (87.0) | 4 (50.0) | 18 (64.3) | 43 (51.8) |
| Yes | 57 (40.1) | 3 (13.0) | 4 (50.0) | 10 (35.7) | 40 (48.2) |
| Distant metastasis in initial diagnosis | |||||
| No | 107 (75.4) | 23 (100.0) | 6 (75.0) | 23 (82.1) | 55 (66.3) |
| Yes | 35 (24.6) | – | 2 (25.0) | 5 (17.9) | 28 (33.7) |
| Recurrent or metastatic sites | |||||
| Locality | 7 (12.3) | 3 (100.0) | 2 (50.0) | – | 2 (5.0) |
| Distant lymph node | 17 (29.8) | – | – | 6 (60.0) | 11 (27.5) |
| Liver | 27 (47.4) | – | 2 (50.0) | 4 (40.0) | 21 (52.5) |
| Lung | 2 (3.5) | – | – | – | 2 (5.0) |
| Bone | 1 (1.8) | – | – | – | 1 (2.5) |
| Brain | 1 (1.8) | – | – | – | 1 (2.5) |
| Vermiform appendix | 1 (1.8) | – | – | – | 1 (2.5) |
| Adrenal gland | 1 (1.8) | – | – | – | 1 (2.5) |
| Neoadjuvant therapy | |||||
| No | 97 (84.3) | 23 (100.0) | 7 (100.0) | 22 (81.5) | 45 (77.6) |
| Yes | 18 (15.7) | – | – | 5 (18.5) | 13 (22.4) |
| Postoperative adjuvant therapy | |||||
| No | 61 (53.0) | 23 (100.0) | 6 (85.7) | 9 (33.3) | 23 (39.7) |
| Yes | 54 (47.0) | – | 1 (14.3) | 18 (66.7) | 35 (60.3) |
| Survival state | |||||
| Alive | 64 (45.1) | 23 (100.0) | 7 (87.5) | 11 (39.3) | 23 (27.7) |
| Death | 78 (54.9) | – | 1 (12.5) | 17 (60.7) | 60 (72.3) |
| Nerve invasion | |||||
| No | 56 (39.4) | 9 (39.1) | 5 (62.5) | 12 (42.9) | 30 (36.1) |
| Yes | 43 (30.3) | – | – | 15 (53.6) | 28 (33.7) |
| Unknown | 43 (30.3) | 14 (60.9) | 3 (37.5) | 1 (3.6) | 25 (30.1) |
| Vascular tumor thrombus | |||||
| No | 40 (28.2) | 8 (34.8) | 2 (25.0) | 8 (28.6) | 22 (26.5) |
| Yes | 59 (41.5) | 1 (4.3) | 3 (37.5) | 19 (67.9) | 36 (43.4) |
| Unknown | 43 (30.3) | 14 (60.9) | 3 (37.5) | 1 (3.6) | 25 (30.1) |
| LNR(%) | |||||
| ≤11.65 | 51 (35.9) | 9 (39.1) | 3 (37.5) | 9 (32.1) | 30 (36.1) |
| >11.65 | 48 (33.8) | – | 2 (25.0) | 18 (64.3) | 28 (33.7) |
| Unknown | 43 (30.3) | 14 (60.9) | 3 (37.5) | 1 (3.6) | 25 (30.1) |
| Depth of infiltration | |||||
| Mucous membrane | 12 (8.5) | 10 (43.5) | 1 (12.5) | – | 1 (1.2) |
| Submucosa | 20 (14.1) | 10 (43.5) | 5 (62.5) | 1 (3.6) | 4 (4.8) |
| Muscular layer | 12 (8.5) | 1 (4.3) | 1 (12.5) | 2 (7.1) | 8 (9.6) |
| Subserous membrane | 6 (4.2) | – | – | 2 (7.1) | 4 (4.8) |
| Serous membrane and beyond | 64 (45.1) | – | 1 (12.5) | 22 (78.6) | 41 (49.4) |
| Unknown | 28 (19.7) | 2 (8.7) | – | 1 (3.6) | 25 (30.1) |
| Tumor location | |||||
| Upper 1/3 of the stomach | 59 (41.5) | 5 (21.7) | – | 12 (42.9) | 42 (50.6) |
| Middle 1/3 of the stomach | 51 (35.9) | 17 (73.9) | 5 (62.5) | 8 (28.6) | 21 (25.3) |
| Lower 1/3 of the stomach | 32 (22.5) | 1 (4.3) | 3 (37.5) | 8 (28.6) | 20 (24.1) |
| Range of surgery | |||||
| Whole stomach | 42 (29.6) | 8 (34.8) | 3 (42.9) | 20 (74.1) | 42 (72.4) |
| Partial stomach | 73 (51.4) | 15 (65.2) | 4 (57.1) | 7 (25.9) | 16 (27.6) |
| Objective of surgery | |||||
| Radical | 112 (97.4) | 23 (100.0) | 6 (85.7) | 26 (96.3) | 57 (98.3) |
| Palliative | 3 (2.6) | – | 1 (14.3) | 1 (3.7) | 1 (1.7) |
| Method of surgery | |||||
| Open | 81 (70.4) | 4 (17.4) | 3 (42.9) | 23 (85.2) | 51 (87.9) |
| Laparoscope | 18 (15.7) | 5 (21.7) | 2 (28.6) | 4 (14.8) | 7 (12.1) |
| ESD | 16 (13.9) | 14 (60.9) | 2 (28.6) | – | – |
| T stage | |||||
| 1 | 14 (9.9) | 8 (34.8) | 1 (12.5) | 1 (3.6) | 4 (4.8) |
| 2 | 16 (11.3) | 2 (8.7) | 4 (50.0) | 2 (7.1) | 8 (9.6) |
| 3 | 6 (4.2) | – | – | 2 (7.1) | 4 (4.8) |
| 4 | 64 (45.1) | – | 1 (12.5) | 22 (78.6) | 41 (49.4) |
| Unknown | 42 (29.6) | 13 (56.5) | 2 (25.0) | 1 (3.6) | 26 (31.3) |
| N stage | |||||
| 0 | 49 (34.5) | – | 5 (62.5) | 6 (21.4) | 16 (19.3) |
| 1 | 16 (11.3) | 22 (95.7) | 2 (25.0) | 2 (7.1) | 11 (13.3) |
| 2 | 27 (19.0) | 1 (4.3) | – | 10 (35.7) | 17 (20.5) |
| 3 | 22 (15.5) | – | – | 9 (32.1) | 13 (15.7) |
| Unknown | 28 (19.7) | – | 1 (12.5) | 1 (3.6) | 26 (31.3) |
| M stage | |||||
| 0 | 114 (80.3) | 23 (100.0) | 6 (75.0) | 26 (92.9) | 59 (71.1) |
| 1 | 28 (19.7) | – | 2 (25.0) | 2 (7.1) | 24 (28.9) |
| TNM stage | |||||
| I | 18 (12.7) | 8 (34.8) | 1 (12.5) | 3 (10.7) | 6 (7.2) |
| II | 21 (14.8) | 1 (4.3) | 3 (37.5) | 3 (10.7) | 14 (16.9) |
| III | 54 (38.0) | 1 (4.3) | 1 (12.5) | 20 (71.4) | 32 (38.6) |
| IV | 28 (19.7) | – | 2 (25.0) | 2 (7.1) | 24 (28.9) |
| Unknown | 21 (14.8) | 13 (56.5) | 1 (12.5) | – | 7 (8.4) |
| HER2 | |||||
| Negative | 86 (60.6) | 3 (13.0) | 2 (25.0) | 18 (64.3) | 63 (75.9) |
| Positive | 9 (6.3) | – | – | 8 (28.6) | 1 (1.2) |
| Unknown | 47 (33.1) | 20 (87.0) | 6 (75.0) | 2 (7.1) | 19 (22.9) |
| CgA | |||||
| Negative | 30 (21.1) | – | – | 10 (35.7) | 20 (24.1) |
| Positive | 107 (75.4) | 21 (91.3) | 8 (100.0) | 18 (64.3) | 60 (72.3) |
| Unknown | 5 (3.5) | 2 (8.7) | – | – | 3 (3.6) |
| Sy | |||||
| Negative | – | – | – | – | – |
| Positive | 137 (96.5) | 21 (91.3) | 8 (100.0) | 27 (96.4) | 81 (97.6) |
| Unknown | 5 (3.5) | 2 (8.7) | – | 1 (3.6) | 2 (2.4) |
| CD56 | |||||
| Negative | 23 (16.2) | 1 (4.3) | 1 (12.5) | 6 (21.4) | 15 (18.1) |
| Positive | 97 (68.3) | 20 (87.0) | 6 (75.0) | 19 (67.9) | 52 (62.7) |
| Unknown | 22 (15.5) | 2 (8.7) | 1 (12.5) | 3 (10.7) | 16 (19.3) |
The prognosis of g‐NETs and g‐NEC/MiNENs diverges significantly due to differences in differentiation degree and biological behavior. While g‐NETs manifest indolent growth patterns and tend to be benign, g‐NECs are highly malignant, invasive, and associated with dismal prognoses. Various types of g‐NENs present distinct clinical attributes, treatment approaches, pathological traits, and prognostic outcomes. Therefore, it is imperative to study them separately based on their pathological subtypes. In this study, we conducted a retrospective analysis of 142 cases of g‐NENs from Zhejiang Cancer Hospital to investigate their clinicopathological features and prognostic factors. Furthermore, we compared the clinicopathological characteristics and outcomes of g‐NEC/MiNEN, gastric adenocarcinoma (GAC), and gastric signet ring cell carcinoma (SRCC), with the objective of deepening our comprehension of g‐NENs.
2. MATERIALS AND METHODS
2.1. Patient samples
In this study, we included patients diagnosed with primary gastric neuroendocrine neoplasms and admitted to Zhejiang Cancer Hospital between January 1, 2007 and December 31, 2021. Inclusion criteria were as follows: (1) Pathological examination of surgical specimens or gastroscopic biopsy specimens confirming primary gastric neuroendocrine neoplasms; (2) Availability of relatively comprehensive clinical and pathological data. Exclusion criteria were as follows: (1) Presence of concomitant malignant tumors; (2) Nonprimary tumors that have metastasized to the stomach from other sites; (3) Patients with severe cardiopulmonary, liver, or kidney dysfunction; (4) Absence of follow‐up data. The selection process is visually presented in Figure 1.
FIGURE 1.

Flowchart for the selection process of study objects.
2.2. Pathology methods
According to the 2019 WHO Classification criteria for Digestive System tumors (5th edition), gastric neuroendocrine neoplasms were meticulously classified by two senior pathologists and further subdivided into G1, G2, G3, NEC, and MiNEN. The diagnosis criteria for those 28 cases of MiNEN are detailed in Table S1. All pathological stages were aligned with AJCC 8th criteria. Patient historical data, encompassing demographic characteristics and clinicopathological characteristics, were systematically extracted from inpatient records. Survival data were procured through telephone follow‐ups or medical records, with the final follow‐up conducted on January 1st, 2023. The overall survival (OS) was defined as the duration from initial surgery or first diagnosis to death or last follow‐up date.
2.3. Immunohistochemistry
HER2: Tissue sections were baked at 60°C for 60 min and then placed in ventana BenchMark Ultra for staining. The procedure is as follows: EZ prep dewaxing, ULTRA CC1 antigen repair for 36 min, HER2 antibody incubation at 37°C for 32 min, ultraView Universal DAB Detection Kit detection system color rendering, hematoxylin II nuclear restaining. Bluing reagent returns blue. For other antibodies: Tissue sections were baked at 60°C for 60 min and then placed in Leica Bond III for staining. The procedure is as follows: BOND Dewax, BOND Epitope Retrieval 2 Antigen repair at 97°C for 20 min, endogenous peroxidase blocking for 10 min, primary antibody incubation for 15 min, BOND Polymer Refine Detection for secondary antibody incubation for 16 min. DAB color development for 10 min, hematoxylin redyeing for 2 min after returning to blue. Sy: Clone DAK‐SYNAP, ready‐to‐use antibody, supplier Dako, staining platform Leica Bond III. CgA: Clone 317F1D8, ready‐to‐use antibody, supplier Suzhou Baidao, staining platform Leica Bond III. CD56: Clone MX039, dilution ratio 1:600, supplier Fuzhou Maixin, dyeing platform Leica Bond III.
2.4. Statistical analysis
Statistical analysis was conducted using SPSS 26.0 (IBM Corp, Armonk, NY, USA) and GraphPad Prism 9 (GraphPad Software, San Diego, California USA). Counting data were expressed using frequency and percentage, while measurement data were represented by median and quartile. Categorical variables were compared using the chi‐squared test or Fisher's exact test, and continuous variables were compared using the t‐test or Mann–Whitney U test. To mitigate potential confounding factors among different pathological types, Propensity Score Matching (PSM) was implemented. The survival rate was evaluated using the Kaplan–Meier method, and the log‐rank test was used for survival rate comparisons. Cox proportional hazards regression analysis was performed to calculate hazard ratios (HRs) with 95% confidence interval (CI) using cancer‐related death as the endpoint. In the Cox regression multivariate analysis, variables with p‐values <0.05 were considered significant for inclusion, while variables with p‐values >0.1 were considered significant for removal. HRs and their 95% CI were determined for each key variable and compared to their reference category. A p‐value <0.05 was considered statistically significant.
3. RESULTS
3.1. General clinicopathological characteristics
A total of 142 cases of g‐NENs were included in the study. These consisted of 23 cases of NET‐G1 (16.2%), eight cases of NET‐G2 (5.6%), 83 cases of g‐NEC (58.5%), and 28 cases of g‐MiNEN (19.7%). No cases of NET‐G3 were observed. The majority of patients were male (68.3%) with a median age of 63 years. Most tumors were located in the upper third of the stomach (41.5%). 40.1% of patients with g‐NENs experienced recurrence or metastasis, with 24.6% of cases presenting metastasis at initial diagnosis. Distant lymph node and liver metastases were the most common (29.8% and 47.4%, respectively). HER2 expression was positive in only 6.3% of cases, all of which were g‐MiNEN. Detailed clinical and pathological characteristics are presented in Table 1.
3.2. g‐NEC/MiNEN is more prevalent in older males and exhibits a higher propensity for recurrence or metastasis compared to g‐NET
Compared analysis between G1 and G2 showed no significant differences in clinicopathological characteristics and overall survival (OS) (p = 0.065, Table S2 and Figure S1). Similarly, a comparative analysis between g‐MiNEN and g‐NEC groups displayed no significant disparities between them. However, g‐NEC cases demonstrated a higher probability of distant metastasis (p = 0.019), a noticeable reduction in BMI (p = 0.016), and a lower rate of HER2 positivity (p < 0.001, Table S3 and Figure S2). Given the absence of significant differences in clinicopathological features between G1 and G2, as well as g‐MiNEN and g‐NEC, and considering the lack of statistically significant differences in OS, we combined G1 and G2 into the g‐NET group, and grouped g‐MiNEN and g‐NEC as the g‐NEC/MiNEN group. Subsequently, a comparative analysis was performed between these two groups. Notably, male patients had a significantly higher prevalence of g‐NEC/MiNEN (p < 0.001) and were older in age (p < 0.001). Additionally, the g‐NEC/MiNEN subgroup exhibited a higher likelihood of experiencing recurrence or metastasis (p = 0.024), often presenting with distant metastasis at the time of initial diagnosis (p = 0.008), as outlined in Table 2 and illustrated in Figure 2.
TABLE 2.
Chi‐square tests were conducted for g‐NET and g‐NEC/MiNEN groups.
| Variable | g‐NET (n = 31) | g‐NEC/MiNEN (n = 111) | X2 | p |
|---|---|---|---|---|
| Gender | ||||
| Male | 8 | 89 | 33.095 | <0.001 |
| Female | 23 | 22 | ||
| Smoking history | ||||
| No | 27 | 57 | 12.815 | <0.001 |
| Yes | 4 | 54 | ||
| Drinking history | ||||
| No | 24 | 69 | 2.496 | 0.114 |
| Yes | 7 | 42 | ||
| Family history | ||||
| No | 22 | 81 | 0.049 | 0.825 |
| Yes | 9 | 30 | ||
| Weight loss | ||||
| No | 28 | 65 | 10.818 | 0.001 |
| Yes | 3 | 46 | ||
| Tumor location | ||||
| Upper 1/3 of the stomach | 5 | 54 | 21.367 | <0.001 |
| Middle 1/3 of the stomach | 22 | 29 | ||
| Lower 1/3 of the stomach | 4 | 28 | ||
| Distant metastasis in initial diagnosis | ||||
| No | 29 | 78 | 7.070 | 0.008 |
| Yes | 2 | 33 | ||
| Recurrence or metastasis | ||||
| No | 24 | 61 | 5.089 | 0.024 |
| Yes | 7 | 50 | ||
| Recurrence or metastasis sites | ||||
| Liver | 2 | 25 | 0.435 | 0.510 |
| Other | 5 | 25 | ||
| Surgery | ||||
| No | 1 | 26 | 6.420 | 0.011 |
| Yes | 30 | 85 | ||
| Objective of surgery | ||||
| Radical | 29 | 83 | – | 1.000 |
| Palliative | 1 | 2 | ||
| Method of surgery | ||||
| Open | 7 | 74 | – | – |
| Laparoscope | 7 | 11 | ||
| ESD | 16 | 0 | ||
| Range of surgery | ||||
| Whole stomach | 11 | 62 | 12.585 | <0.001 |
| Partial stomach | 19 | 23 | ||
| Neoadjuvant therapy | ||||
| No | 30 | 67 | – | – |
| Yes | 0 | 18 | ||
| Postoperative adjuvant therapy | ||||
| No | 29 | 32 | 31.010 | <0.001 |
| Yes | 1 | 53 | ||
| Nerve invasion | ||||
| No | 14 | 42 | – | – |
| Yes | 0 | 43 | ||
| Vascular tumor thrombus | ||||
| No | 10 | 30 | 6.518 | 0.011 |
| Yes | 4 | 55 | ||
| T stage | ||||
| 1 + 2 | 15 | 15 | 33.337 | <0.001 |
| 3 + 4 | 1 | 69 | ||
| N stage | ||||
| 0 | 27 | 22 | 36.725 | <0.001 |
| 1 + 2 + 3 | 3 | 62 | ||
| M stage | ||||
| 0 | 29 | 85 | 4.409 | 0.036 |
| 1 | 2 | 26 | ||
| TNM stage | ||||
| I + II | 13 | 26 | 17.722 | <0.001 |
| III + IV | 4 | 78 | ||
| LNR (%) | ||||
| ≤11.65 | 12 | 39 | 7.635 | 0.006 |
| >11.65 | 2 | 46 | ||
| CgA | ||||
| Negative | 0 | 30 | – | – |
| Positive | 29 | 78 | ||
| CD56 | ||||
| Negative | 2 | 21 | 3.408 | 0.065 |
| Positive | 26 | 71 | ||
| HER2 | ||||
| Negative | 5 | 81 | – | – |
| Positive | 0 | 9 | ||
P < 0.05 are in bold.
FIGURE 2.
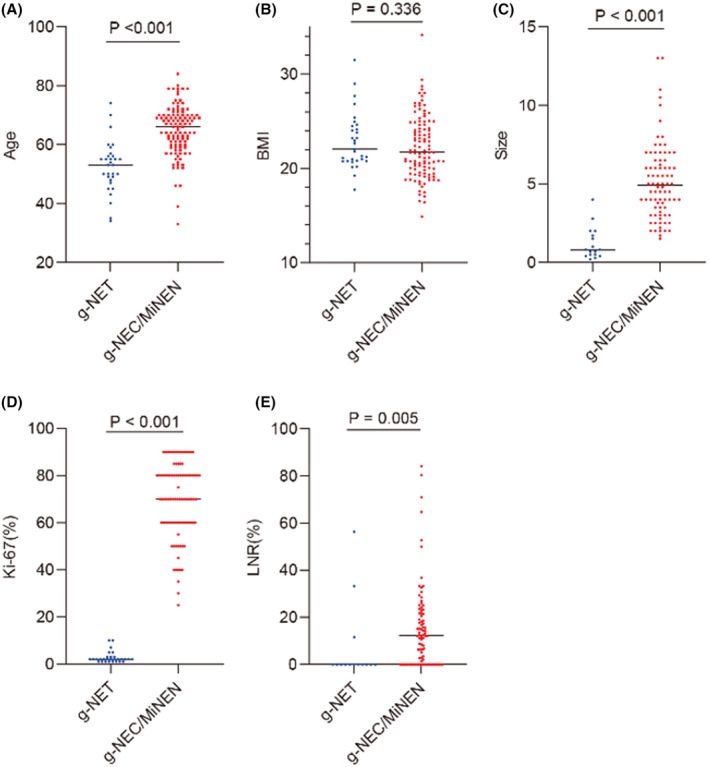
Diagram of the T‐test or Mann–Whitney U test for differences between groups of continuous variables for g‐NET and g‐NEC/MiNEN. (A) The age of g‐NEC/MiNEN group was significantly higher than that of g‐NET group (p < 0.001); (B) There was no difference in BMI between g‐NET and g‐NEC/MiNEN (p = 0.336). (C) g‐NEC/MiNEN were significantly larger than g‐NET (p < 0.001); (D) The Ki‐67 (%) index of g‐NEC/MiNEN was significantly higher than that of g‐NET (p < 0.001); (E) The LNR (%) of g‐NEC/MiNEN is higher than g‐NET (p = 0.005).
3.3. Prognostic factors for g‐NENs
3.3.1. g‐NEC/MiNEN as a risk factor
To evaluate the impact of different pathological types on the prognosis of g‐NENs, Kaplan–Meier survival curves were constructed (Figure 3A,B). The analysis revealed that g‐NEC/MiNEN had a significantly poorer prognosis compared to g‐NET (p < 0.001). As illustrated in Figure 3C, the 1‐year, 3‐year, and 5‐year survival rates for g‐NEC were 63.9%, 35.8%, and 26.7%, respectively, with a median survival time of 18 months. For MiNEN patients, the corresponding rates were 78.6%, 50.3%, and 35.2%, with a median survival time of 39 months. G1 patients exhibited a 100% five‐year survival rate, while G2 patients had rates of 100%, 100%, and 80.0% for the 1‐year, 3‐year, and 5‐year periods, respectively.
FIGURE 3.

Kaplan–Meier survival curve and survival line chart. (A) Kaplan–Meier survival curves of g‐NENs with four different pathological types, G1, G1, MiNEN, and NEC; (B) Kaplan–Meier survival curves for g‐NET and g‐NEC/MiNEN showed poor prognosis for g‐NEC/MiNEN (p < 0.001); (C) 1‐, 3‐, and 5‐year survival rates of g‐NENs with four different pathologic types, G1, G1, MiNEN, and NEC. The 5‐year survival rate of G1 was 100%. The 1‐year, 3‐year, and 5‐year survival rates of G2 were 100.0%, 100.0%, and 80.0%, respectively. The 1‐year, 3‐year, and 5‐year survival rates of MiNEN were 78.6%, 50.3%, and 35.2%, respectively. The 1‐year, 3‐year, and 5‐year survival rates of NEC were 63.9%, 35.8%, and 26.7%, respectively. (D) Kaplan–Meier survival curve of g‐NEC/MiNEN with or without postoperative adjuvant therapy showed that g‐NEC/MiNEN with postoperative adjuvant therapy had a good prognosis (p = 0.010).
In order to identify independent prognostic factors for g‐NENs, univariate COX regression analysis was conducted, including clinicopathological data such as age, sex, and TNM stage. The analysis indicated that gender (p = 0.002), age (p = 0.002), smoking history (p = 0.002), pathological type (p < 0.001), vascular tumor thrombus (p = 0.014), T stage (p = 0.003), N stage (p < 0.001), M stage (p < 0.001), and TNM stage (p < 0.001) significantly influenced prognosis (Table S4). Multivariate COX regression analysis was then performed for these factors, but no statistical differences were found among them (Table S5). However, after excluding the tumor stage factor, pathological type (p = 0.046) was identified as an independent prognostic factor for g‐NENs (Table S6). These results highlight the potential confounding effect of pathological subtypes on overall prognostic analysis and the identification of independent prognostic factors. Therefore, conducting separate investigations for different pathological subtypes is crucial.
3.3.2. Tumor location, tumor stage, and CD56 expression affect the OS of g‐NET patients
Among the 31 g‐NET patients, two G2 patients initially presented with liver metastasis. One of them showed tumor invasion to the mucosal layer, while the other exhibited invasion to the serous layer. During follow‐up, the patient with serous layer invasion unfortunately succumbed to their condition, while the patient with mucosal layer invasion remained alive until the end of follow‐up. The results from the log‐rank test indicated that tumor location (p = 0.042), T stage (p = 0.002), N stage (p = 0.002), M stage (p < 0.001), TNM stage (p = 0.034), and CD56 expression level (p < 0.001) were significantly associated with the prognosis of gastric neuroendocrine tumors, as detailed in Table 3. Kaplan–Meier survival curves (Figure S3A–F) were generated for each variable, highlighting that lower 1/3 stomach tumors, T3 + T4 stages, lymph node metastasis, distant metastasis, and advanced stages were all correlated with poor prognosis. Additionally, negative CD56 expression was also indicative of an unfavorable prognosis.
TABLE 3.
Log‐rank test of 31 g‐NET patients.
| Variable | g‐NET (n = 31) | X2 | P |
|---|---|---|---|
| Gender | |||
| Male | 8 | 0.294 | 0.588 |
| Female | 23 | ||
| Age(year) | |||
| ≤50 | 14 | 0.833 | 0.361 |
| >50 | 17 | ||
| Smoking history | |||
| No | 27 | 0.048 | 0.827 |
| Yes | 4 | ||
| Drinking history | |||
| No | 24 | 0.294 | 0.588 |
| Yes | 7 | ||
| Family history | |||
| No | 22 | 0.467 | 0.495 |
| Yes | 9 | ||
| Weight loss | |||
| No | 28 | 0.100 | 0.752 |
| Yes | 3 | ||
| BMI | |||
| <18.5 | 1 | 0.467 | 0.792 |
| 18.5–24.0 | 21 | ||
| >24.0 | 9 | ||
| Tumor location | |||
| Upper 1/3 of the stomach | 5 | 6.333 | 0.042 |
| Middle 1/3 of the stomach | 22 | ||
| Lower 1/3 of the stomach | 4 | ||
| Tumor size(cm) | |||
| ≤1 | 11 | 2.000 | 0.157 |
| >1 | 6 | ||
| Recurrence or metastasis | |||
| No | 24 | 2.667 | 0.102 |
| Yes | 7 | ||
| Method of surgery | |||
| Open | 7 | 2.143 | 0.343 |
| Laparoscope | 7 | ||
| ESD | 16 | ||
| Range of surgery | |||
| Whole stomach | 11 | 0.571 | 0.450 |
| Partial stomach | 19 | ||
| Nerve invasion | |||
| No | 14 | – | – |
| Yes | 0 | ||
| Vascular tumor thrombus | |||
| No | 10 | 2.333 | 0.127 |
| Yes | 4 | ||
| T stage | |||
| 1 + 2 | 15 | 10.000 | 0.002 |
| 3 + 4 | 1 | ||
| N stage | |||
| 0 | 27 | 10.000 | 0.002 |
| 1 + 2 + 3 | 3 | ||
| M stage | |||
| 0 | 29 | 21.000 | <0.001 |
| 1 | 2 | ||
| TNM stage | |||
| I + II | 13 | 4.500 | 0.034 |
| III + IV | 4 | ||
| CgA | |||
| Negative | 0 | – | – |
| Positive | 29 | ||
| CD56 | |||
| Negative | 2 | 19.000 | <0.001 |
| Positive | 26 | ||
| HER2 | |||
| Negative | 5 | – | – |
| Positive | 0 | ||
P < 0.05 are in bold.
3.3.3. Postoperative adjuvant therapy prolonged the OS of g‐NEC/MiNEN patients
We constructed a Kaplan–Meier survival curve (Figure 3D) which demonstrated that g‐NEC/MiNEN patients who underwent postoperative adjuvant therapy experienced a significantly prolonged OS (p = 0.010). To determine whether postoperative adjuvant therapy serves as an independent prognostic factor for g‐NEC/MiNEN patients, we incorporated gender, age, and TNM stage as clinicopathological characteristics into univariate COX regression analysis. The results of the analysis revealed that postoperative adjuvant therapy (p = 0.013), M stage (p < 0.001), TNM stage (p = 0.015), and lymph node ratio (LNR) (p = 0.016) were all associated with the OS of g‐NEC/MiNEN patients. Following this, we included these influencing factors in a multivariate COX regression analysis, and it was found that postoperative adjuvant therapy remained an independent prognostic factor for g‐NEC/MiNEN patients (Table 4). We further performed univariate and multivariate COX analysis on 83 patients with g‐NEC/MiNEN who underwent surgery, and the same result was obtained, that postoperative adjuvant therapy was an independent protective factor for prognosis (Table S7). In light of these findings, our study suggested that both g‐NEC and g‐MiNEN patients may derive benefits from postoperative adjuvant therapy. Therefore, active considering and implementing adjuvant treatment after surgery is recommended to enhance the prognosis of these patients.
TABLE 4.
Univariate and multivariate COX regression analysis of 111 g‐NEC/MiNEN patients.
| g‐NEC/MiNEN | Univariate COX HR(95%CI) | p | Multivariate COX HR (95% CI) | p |
|---|---|---|---|---|
| Gender | ||||
| Male | 1 (Reference) | 0.729 | ||
| Female | 0.904 (0.513, 1.595) | |||
| Age(year) | ||||
| ≤60 | 1 (Reference) | 0.879 | ||
| >60 | 0.962 (0.583, 1.587) | |||
| Smoking history | ||||
| No | 1 (Reference) | 0.191 | ||
| Yes | 1.348 (0.861, 2.111) | |||
| Drinking history | ||||
| No | 1 (Reference) | 0.978 | ||
| Yes | 0.993 (0.626, 1.576) | |||
| Family history | ||||
| No | 1 (Reference) | 0.866 | ||
| Yes | 0.958 (0.580, 1.582) | |||
| Weight loss | ||||
| No | 1 (Reference) | 0.358 | ||
| Yes | 1.239 (0.785, 1.956) | |||
| BMI | ||||
| <18.5 | 1 (Reference) | 0.533 | ||
| 18.5–24.0 | 1.570 (0.687, 3.589) | 0.285 | ||
| >24.0 | 1.617 (0.675, 3.871) | 0.281 | ||
| Tumor location | ||||
| Upper 1/3 of the stomach | 1 (Reference) | 0.784 | ||
| Middle 1/3 of the stomach | 1.050 (0.600, 1.840) | 0.864 | ||
| Lower 1/3 of the stomach | 1.207 (0.709, 2.053) | 0.488 | ||
| Tumor size(cm) | ||||
| ≤5 | 1 (Reference) | 0.760 | ||
| >5 | 1.091 (0.624, 1.907) | |||
| Neoadjuvant therapy | ||||
| No | 1 (Reference) | 0.989 | ||
| Yes | 0.995 (0.496, 1.996) | |||
| Postoperative adjuvant therapy | ||||
| No | 1 (Reference) | 0.013 | 0.013 | |
| Yes | 0.481 (0.270, 0.855) | 0.479 (0.269,0.855) | ||
| Range of surgery | ||||
| Whole stomach | 1 (Reference) | 0.241 | ||
| Partial stomach | 1.426 (0.788, 2.582) | |||
| Nerve invasion | ||||
| No | 1 (Reference) | 0.390 | ||
| Yes | 1.275 (0.733, 2.220) | |||
| Vascular tumor thrombus | ||||
| No | 1 (Reference) | 0.129 | ||
| Yes | 1.615 (0.870, 2.997) | |||
| T stage | ||||
| 1 + 2 | 1 (Reference) | 0.299 | ||
| 3 + 4 | 1.531 (0.685, 3.419) | |||
| N stage | ||||
| 0 | 1 (Reference) | 0.145 | ||
| 1 + 2 + 3 | 1.715 (0.830, 3.545) | |||
| M stage | ||||
| 0 | 1 (Reference) | <0.001 | 0.416 | |
| 1 | 3.393 (2.026, 5.685) | 1.547 (0.540, 4.430) | ||
| TNM stage | ||||
| I + II | 1 (Reference) | 0.015 | 0.708 | |
| III + IV | 2.177 (1.164, 4.072) | 1.161 (0.531, 2.541) | ||
| LNR (%) | ||||
| ≤11.65 | 1 (Reference) | 0.016 | 0.086 | |
| >11.65 | 2.061 (1.147, 3.704) | 1.837 (0.918, 3.676) | ||
| CgA | ||||
| Negative | 1 (Reference) | 0.289 | ||
| Positive | 0.764 (0.464, 1.257) | |||
| CD56 | ||||
| Negative | 1 (Reference) | 0.349 | ||
| Positive | 1.362 (0.714, 2.598) | |||
| HER2 | ||||
| Negative | 1 (Reference) | 0.294 | ||
| Positive | 0.612 (0.245, 1.531) | |||
| Ki‐67(%) | ||||
| 20–65 | 1 (Reference) | 0.535 | ||
| >65 | 0.852 (0.514, 1.412) | |||
P < 0.05 are in bold.
3.4. g‐NEC/MiNEN has poor prognosis compared to GAC and even poorly differentiated GAC
GAC is the most common subtype of gastric malignancies. To provide a more comprehensive understanding of g‐NEC/MiNEN, we incorporated data from 3217 cases of GAC diagnosed within the same time frame at our research center. Our analysis revealed several significant differences between g‐NEC/MiNEN and GAC. Notably, the age of onset for g‐NEC/MiNEN was considerably higher than that of GAC (p = 0.007). Furthermore, g‐NEC/MiNEN cases were more frequently associated with advanced T stage (T3 + T4, p = 0.011), a high incidence of distant metastasis (p = 0.013), and a greater proportion of cases in stage III + IV (p = 0.018). The 5‐year survival rates for GAC and g‐NEC/MiNEN were 58.4% and 38.2%, respectively, indicating a significantly poorer prognosis for g‐NEC/MiNEN (p < 0.001, Table 5 and Figure 4A). In order to eliminate the influence of confounding factors on prognosis, we performed PSM at a ratio of 1:5 according to age, sex, and TNM stage, and finally obtained a balanced cohort of 425 cases of gastric adenocarcinoma and 85 cases of g‐NEC/MiNEN. The postmatching analysis confirmed that g‐NEC/MiNEN continued to exhibit a poor prognosis (p = 0.036, Figure 4B).
TABLE 5.
Chi‐square test before and after PSM gastric adenocarcinoma and g‐NEC/MiNEN.
| Pre‐PSM | GAC (n = 3217) | g‐NEC/MiNEN (n = 85) | X2 | p | Post‐PSM GAC (n = 425) | g‐NEC/MiNEN (n = 85) | X2 | p |
|---|---|---|---|---|---|---|---|---|
| Variable | ||||||||
| Gender | ||||||||
| Male | 2460 | 68 | 0.575 | 0.448 | 340 | 68 | 0 | 1.000 |
| Female | 757 | 17 | 68 | 17 | ||||
| Age(year) | ||||||||
| ≤60 | 1258 | 21 | 7.235 | 0.007 | 105 | 21 | 0 | 1.000 |
| >60 | 1959 | 64 | 320 | 64 | ||||
| BMI | ||||||||
| <18.5 | 314 | 8 | 2.819 | 0.244 | 47 | 8 | 2.492 | 0.288 |
| 18.5–24.0 | 2053 | 47 | 267 | 47 | ||||
| >24.0 | 850 | 29 | 111 | 29 | ||||
| Family history | ||||||||
| No | 2150 | 63 | 1.988 | 0.159 | 298 | 63 | 0.548 | 0.459 |
| Yes | 1067 | 22 | 127 | 22 | ||||
| Smoking history | ||||||||
| No | 1788 | 46 | 0.072 | 0.789 | 238 | 46 | 0.102 | 0.750 |
| Yes | 1429 | 39 | 187 | 39 | ||||
| Drinking history | ||||||||
| No | 2231 | 52 | 2.593 | 0.107 | 311 | 52 | 4.972 | 0.026 |
| Yes | 986 | 33 | 114 | 33 | ||||
| Tumor location | ||||||||
| Upper 1/3 of the stomach | 904 | 47 | 40.897 | <0.001 | 132 | 47 | 27.691 | <0.001 |
| Middle 1/3 of the stomach | 508 | 19 | 69 | 19 | ||||
| Lower 1/3 of the stomach | 1726 | 19 | 211 | 19 | ||||
| Whole stomach | 79 | 0 | 13 | 0 | ||||
| Vascular tumor thrombus | ||||||||
| No | 1638 | 30 | 8.119 | 0.004 | 197 | 30 | 3.507 | 0.061 |
| Yes | 1577 | 55 | 228 | 55 | ||||
| Nerve invasion | ||||||||
| No | 1666 | 42 | 0.192 | 0.661 | 200 | 42 | 0.157 | 0.692 |
| Yes | 1549 | 43 | 225 | 43 | ||||
| Tumor size(cm) | ||||||||
| ≤5 | 2099 | 47 | 3.065 | 0.080 | 252 | 47 | 0.277 | 0.599 |
| >5 | 1054 | 35 | 165 | 35 | ||||
| T stage | ||||||||
| 1 + 2 | 989 | 15 | 6.422 | 0.011 | 95 | 15 | 0.837 | 0.360 |
| 3 + 4 | 2228 | 69 | 330 | 69 | ||||
| N stage | ||||||||
| 0 | 1124 | 23 | 2.269 | 0.132 | 107 | 23 | 0.132 | 0.716 |
| 1 + 2 + 3 | 2093 | 62 | 318 | 62 | ||||
| M stage | ||||||||
| 0 | 3133 | 79 | 6.179 | 0.013 | 413 | 79 | 3.732 | 0.053 |
| 1 | 84 | 6 | 12 | 6 | ||||
| TNM stage | ||||||||
| I + II | 1412 | 26 | 5.575 | 0.018 | 130 | 26 | 0.004 | 0.947 |
| III + IV | 1805 | 58 | 295 | 58 | ||||
| HER2 | ||||||||
| Negative | 2504 | 64 | 0.716 | 0.398 | 340 | 64 | 1.156 | 0.282 |
| Positive | 227 | 8 | 27 | 8 | ||||
P < 0.05 are in bold.
FIGURE 4.

Kaplan–Meier survival curves of gastric adenocarcinoma and poorly differentiated gastric adenocarcinoma before and after PSM and g‐NEC/MiNEN. (A) Kaplan–Meier survival curves of gastric adenocarcinoma and g‐NEC/MiNEN before PSM, with poor prognosis for g‐NEC/MiNEN (p < 0.001); (B) Kaplan–Meier survival curves of gastric adenocarcinoma and g‐NEC/MiNEN after PSM showed poor prognosis in g‐NEC/MiNEN (p = 0.036). (C) Kaplan–Meier survival curves of poorly differentiated gastric adenocarcinoma and g‐NEC/MiNEN before PSM showed poor prognosis in g‐NEC/MiNEN (p = 0.007); (D) Kaplan–Meier survival curves of poorly differentiated gastric adenocarcinoma and g‐NEC/MiNEN after PSM showed poor prognosis in g‐NEC/MiNEN (p = 0.043).
Given the poor differentiation of g‐NEC/MiNEN, we conducted a separate analysis involving 1007 cases of poor differentiation GAC for comparison. Our findings indicated that male patients were more commonly affected by g‐NEC/MiNEN (p = 0.034), and the age of onset for g‐NEC/MiNEN was typically higher than 60 years (p < 0.001) when compared to poorly differentiated GAC. Importantly, the prognosis for g‐NEC/MiNEN remained poor (p = 0.007), with a 5‐year survival rate lower than that of poorly differentiated GAC, reaching 51.5% (Figure 4C, Table S8). To address potential confounding factors, we performed PSM at a ratio of 1:5 based on age, sex, and TNM stage. The analysis following PSM demonstrated that g‐NEC/MiNEN continued to have a poor prognosis compared to poorly differentiated GAC (p = 0.043, Figure 4D).
SRCC is a distinct subtype of gastric adenocarcinoma. To explore potential differences in prognosis between g‐NEC/MiNEN and SRCC, we conducted an in‐depth analysis and comparison of clinicopathological characteristics and OS using data from 255 cases of gastric SRCC from the same research center during the same period. The analysis demonstrated that g‐NEC/MiNEN is associated with a poorer prognosis when compared to SRCC, particularly in early cases (Table S9, Figure S4).
4. DISCUSSION
The rarity and significant clinicopathological heterogeneity of gastric neuroendocrine neoplasms (g‐NENs) pose a formidable challenge for clinicians in terms of prognostication and treatment selection. It is widely recognized that tumor location and histological characteristics play a pivotal role in determining the biological behavior and prognosis of neuroendocrine neoplasms. 14 , 15 , 16 , 17 The latest classification by the WHO for digestive system tumors stratifies g‐NENs into distinct categories: well‐differentiated g‐NET, poorly differentiated g‐NEC and g‐MiNEN. 8 In our study, the distribution across these subtypes revealed a total of 31 cases of g‐NET (21.8%), 83 cases of g‐NEC (58.5%), and 28 cases of g‐MiNEN (19.7%). Remarkably, g‐NEC constituted more than half of these cases, diverging from the existing epidemiological data, where g‐NETs tend to predominate. 5 , 9 , 18 , 19 , 20 , 21 , 22 This discrepancy might stem from the fact that our hospital specializes in the treatment of malignant tumors, potentially introducing a selection bias.
To gain further insights into the clinicopathological characteristics of g‐NENs, we conducted an intergroup analysis for each pathological subtype. Surprisingly, we found no discernible differences in fundamental clinicopathological features and prognosis between the G1 and G2 groups. The lack of statistical significance in the comparison of G1 and G2 may be simply due to the small sample size of the two groups. However, G1 and G2 had a good prognosis and were combined into one group for analysis, which did not affect our study of the final results. Similarly, when performing an intergroup analysis for g‐NEC and g‐MiNEN, we identified no significant disparities in their basic clinicopathological features or prognosis. As a result, we combined the G1 and G2 groups into a unified g‐NET category, while amalgamating the g‐NEC and g‐MiNEN groups to establish a consolidated g‐NEC/MiNEN category. A comparison between the g‐NET group and the g‐NEC/MiNEN group highlighted a higher prevalence of the latter among elderly males, consistent with findings from numerous studies. 23 , 24 , 25 , 26 , 27 , 28 , 29 , 30 , 31 Additionally, we noted a heightened prevalence of smoking history within this patient population, potentially with a gender‐related association. Our study unveiled that g‐NEC/MiNEN predominantly manifested in the upper third of the stomach, aligning with Liu et al.'s discovery that g‐NEC primarily occurs in the cardia region. 27 Similarly, a higher incidence of relapses or metastases was observed in the g‐NEC/MiNEN group compared to the g‐NET group. Furthermore, a larger number of patients presented with distant metastases during their initial visit, primarily affecting the liver and lymph nodes. These findings consistently concur with previous investigations by multiple researchers. 12 , 27 , 32 , 33 , 34 , 35 , 36 , 37 In the g‐NET group, no cases tested positive for HER2, while in the g‐NEC/MiNEN group, only nine cases were HER2 positive, all of which were g‐MiNEN. As far back as 2014, Ishida et al. examined HER2 expression in 51 g‐NEC cases and found a lack of HER2 expression in all NEC cases. 38 In 2021, Yamashita et al. similarly identified negative HER2 expression in all NEC tissue cases, with HER2 positivity observed in 15 (40%) MiNEN adenocarcinoma components. 39 The HER2 positive rate in g‐NENs is significantly lower than that in GAC, which could be attributed to the nonexpression of HER2 in g‐NETs and the limited expression in g‐NEC/MiNENs. Consequently, HER2 is unlikely to serve as an effective treatment target, diverging from its role in GAC.
The prognosis of g‐NET, g‐NEC, and g‐MiNEN is believed to display significant differences. Specifically, g‐NET demonstrates indolent growth patterns and a propensity towards benign tumor behavior, 40 , 41 while both g‐NEC and g‐MiNEN are marked by high malignancy and unfavorable prognostic outcomes. 42 , 43 , 44 Our study unveiled that the 5‐year survival rates for G1 and G2 were 100% and 80.0%, respectively. By contrast, g‐NEC and g‐MiNEN exhibited considerably lower rates of 26.7% and 35.2%, respectively. These findings underscore the adverse prognosis associated with g‐NEC and g‐MiNEN, juxtaposed with the favorable outcomes observed for G1 and G2. Delving deeper into the prognostic factors within the g‐NET group, we discovered that tumor location in the lower third of the stomach, T3 + T4 stage, lymph node and distant metastasis, as well as stage III + IV were all linked to a poorer prognosis. Additionally, patients exhibiting negative CD56 expression experienced unfavorable outcomes. It is well known that CD56 expression is mainly associated with, but not limited to, natural killer cells. It has been reported that CD56 is also expressed in GEP‐NENs, 45 but the role of CD56 in G‐NET remains unclear. NK cell infiltration has not been reported in G‐NET, but the current research mainly focuses on PD‐1/PD‐L1 in GEP‐NEN. In 2022, Kurtulan et al. conducted a study on g‐NETs and identified grade, size, and depth of lesion infiltration as significant determinants of prognosis. 46 Other studies have reported diverse prognostic factors. Overall, the TNM stage remains a critical prognostic factor. 47 , 48 , 49 , 50 , 51 , 52 , 53 , 54
When investigating the prognostic factors of g‐NEC and g‐MiNEN, we found that postoperative adjuvant therapy can extend the OS of patients with g‐NEC and g‐MiNEN, and it emerges as an independent prognostic factor of g‐NEC. We classified postoperative adjuvant therapy into categories such as adjuvant chemotherapy, adjuvant radiotherapy, and immunotherapy. A majority of patients with g‐NEC and g‐MiNEN underwent surgical treatment alongside comprehensive treatment, including surgery and postoperative adjuvant therapy. Recent years have witnessed surgical resection establishing itself as the most effective therapeutic approach for g‐NEC. 31 , 55 , 56 Drawing from a comprehensive and thorough comprehension of g‐NEC and g‐MiNEN, most researchers agree that postoperative adjuvant chemotherapy could offer potential benefits to these patients. 27 , 57 , 58 , 59 , 60 However, it is important to note that certain studies have reported the ineffectiveness of adjuvant chemotherapy in treating g‐NEC and g‐MiNEN, failing to demonstrate significant enhancements in survival outcomes. 61 , 62 The variations in treatment outcomes can be attributed to several factors, including tumor heterogeneity, drug selection, and population responsiveness. Although our findings suggested that preoperative neoadjuvant therapy did not exert a substantial impact on OS, a study by Ma et al. demonstrated improved prognosis and survival in patients with locally advanced g‐NEC or g‐MiNEN who received preoperative neoadjuvant therapy. 44 Other treatment approaches have also exhibited promise, such as targeting PD‐1/PD‐L1 and CTLA‐4. 39 , 63 Considering the high invasiveness and poor prognosis associated with g‐NEC and g‐MiNEN, our research suggests that a comprehensive treatment approach should be administered to patients g‐NEC and g‐MiNEN after surgery in order to prolong their survival.
The most prevalent pathological type of gastric cancer (GC) is adenocarcinoma. 64 However, recent epidemiological data indicate a decline in its incidence, while the incidence of g‐NEC is rapidly increasing. 65 Our findings indicated that g‐NEC/MiNEN exhibited a worse prognosis even compared to poorly differentiated GAC. This result aligned with conclusions drawn by numerous researchers in the field. 30 , 32 , 43 , 66 , 67 , 68 , 69 , 70 , 71 , 72 , 73 , 74 , 75 , 76 In 2006, Jiang et al. found that the 5‐year OS rate for g‐NEC and GAC were 31.1% and 69.3%, respectively, with significant differences in OS observed at each stage between g‐NEC and GAC. 70 Other researchers suggested that the presence of neuroendocrine components indicated a poor prognosis for GC. 66 , 75 However, a study conducted by Li et al. in 2022 yielded different results when comparing the OS and cancer‐specific survival (CSS) rates between these two types. They concluded that g‐NEC in individuals of Caucasian descent exhibited a more favorable prognosis than GAC. The dissimilarity in results between Li et al.'s study and previous research may potentially be attributed to ethnic disparities, given that most reported studies have been based on data from Asian populations. Meanwhile, we conducted a comparison between two groups of SRCC, which is another rare pathological type of GC. Our findings revealed that both pre‐ and post‐operative‐g‐NEC/MiNEN patients had a poorer prognosis than SRCC. Further stratified analysis indicated that g‐NEC/MiNEN in the early stage had a worse prognosis compared to SRCC, but there was no significant difference in the prognosis of advanced g‐NEC/MINEN cases. In conclusion, our study suggested that g‐NEC/MiNEN exhibited higher malignancy and a worse prognosis than SRCC in the early stage, while their malignancy appeared to be similar in the advanced stage.
Our study has a few of limitations. First, this is a retrospective study, which inevitably results in selection bias and information bias during data collection process. Second, the sample size in this single‐center study is relatively small, as it only includes samples from our hospital. To enhance the generalizability and robustness of our findings, future research should involve multiple research centers and incorporate larger sample sizes.
However, our research does offer a few of advantages. First, we included all patients with gastric neuroendocrine neoplasms treated at our hospital over the past 15 years and reclassified them according to the latest WHO classification of digestive system tumors, distinguishing between G1, G2, G3, NEC, and MiNEN subtypes. Subsequently, we conducted a comprehensive analysis of clinicopathological characteristics and prognosis from various perspectives for each pathological type as well as for the entire cohort. Second, we pioneered a comparative analysis between g‐NEC/MiNEN and SRCC, shedding light on the fact that g‐NEC/MiNEN exhibited high malignancy and poor prognosis in the early stages, while its malignancy level becomes similar to that of advanced stage. This unique aspect of our study contributes to the current body of knowledge in this field.
Our study highlights several key findings. g‐NENs tend to manifest in elderly male patients and often the loss of HER2 expression. g‐NETs generally exhibit a favorable prognosis, with the TNM stage emerging as a primary prognostic factor. By contrast, g‐NEC/MiNEN presents a grim prognosis, displaying a heightened likelihood of relapse or metastasis. It frequently presents with distant metastases at the time of initial diagnosis, predominantly affecting the liver and lymph nodes. Postoperative adjuvant therapy has been demonstrated to improve overall survival for g‐NEC and g‐MiNEN cases. Importantly, g‐NEC/MiNEN demonstrates elevated malignancy and worse prognostic outcomes in comparison to GAC, and even poorly differentiated GAC. Notably, early‐stage g‐NEC/MiNEN shows greater malignancy than SRCC and accompanies a poor prognosis. Conversely, advanced‐stage g‐NEC/MINEN shares similar malignant characteristics with SRCC. These insights collectively contribute to our understanding of gastric neuroendocrine neoplasms and have potential implications for treatment strategies and prognostic evaluations.
AUTHOR CONTRIBUTIONS
Mengli Zi: Data curation (equal); investigation (equal); methodology (equal); writing – original draft (equal). Yubo Ma: Investigation (equal); methodology (equal); writing – original draft (equal). Jinxia Chen: Data curation (equal); methodology (equal). Chuhong Pang: Data curation (equal). xiao Li: Data curation (equal); methodology (equal). Li Yuan: Investigation (equal); methodology (equal); validation (equal). Zhuo Liu: Writing – review and editing (equal). Pengfei Yu: Conceptualization (equal); writing – review and editing (equal).
FUNDING INFORMATION
This study was supported by National Key R&D Program of China (2021YFA0910100), National Natural Science Foundation of China (82074245, 81973634, 82204828), Medical Science and Technology Project of Zhejiang Province (2022KY114, WKJ‐ZJ‐2104), Natural Science Foundation of Zhejiang Province (HDMY22H160008), Science and Technology Projects of Zhejiang Province (2019C03049).
CONFLICT OF INTEREST STATEMENT
The authors have no conflict of interest.
ETHICS STATEMENT
The study was approved by the Institutional Ethics Committee of Zhejiang Cancer Hospital (no. IRB‐2023‐1005) and informed consent has been waived by the Ethic Committee.
Supporting information
Appendix S1
ACKNOWLEDGMENTS
Thanks to the follow‐up room of Zhejiang Cancer Hospital for its contribution to this article.
Zi M, Ma Y, Chen J, et al. Clinicopathological characteristics of gastric neuroendocrine neoplasms: A comprehensive analysis. Cancer Med. 2024;13:e7011. doi: 10.1002/cam4.7011
Contributor Information
Zhuo Liu, Email: zhouliu1985@126.com.
Pengfei Yu, Email: ypfzmu@163.com.
DATA AVAILABILITY STATEMENT
The data that support the findings of this study are available on request from the corresponding author. The data are not publicly available due to privacy or ethical restrictions.
REFERENCES
- 1. Taal BG, Visser O. Epidemiology of neuroendocrine tumours. Neuroendocrinology. 2004;80(Suppl 1):3‐7. [DOI] [PubMed] [Google Scholar]
- 2. Fraenkel M, Faggiano A, Valk GD. Epidemiology of neuroendocrine tumors. Front Horm Res. 2015;44:1‐23. [DOI] [PubMed] [Google Scholar]
- 3. Klöppel G. Neuroendocrine neoplasms: dichotomy, origin and classifications. Visc Med. 2017;33:324‐330. [DOI] [PMC free article] [PubMed] [Google Scholar]
- 4. Anaizi A, Rizvi‐Toner A, Valestin J, Schey R. Large cell neuroendocrine carcinoma of the lung presenting as pseudoachalasia: a case report. J Med Case Rep. 2015;9:56. [DOI] [PMC free article] [PubMed] [Google Scholar]
- 5. Dasari A, Shen C, Halperin D, et al. Trends in the incidence, prevalence, and survival outcomes in patients with neuroendocrine tumors in the United States. JAMA Oncol. 2017;3:1335‐1342. [DOI] [PMC free article] [PubMed] [Google Scholar]
- 6. Yang Z, Wang W, Lu J, et al. Gastric neuroendocrine tumors (G‐Nets): incidence, prognosis and recent trend toward improved survival. Cell Physiol Biochem. 2018;45:389‐396. [DOI] [PubMed] [Google Scholar]
- 7. Chen WF, Zhou PH, Li QL, Xu MD, Yao LQ. Clinical impact of endoscopic submucosal dissection for gastric neuroendocrine tumors: a retrospective study from mainland China. TheScientificWorldJOURNAL. 2012;2012:869769. [DOI] [PMC free article] [PubMed] [Google Scholar]
- 8. Nagtegaal ID, Odze RD, Klimstra D, et al. The 2019 WHO classification of tumours of the digestive system. Histopathology. 2020;76:182‐188. [DOI] [PMC free article] [PubMed] [Google Scholar]
- 9. Hallet J, Law CH, Cukier M, Saskin R, Liu N, Singh S. Exploring the rising incidence of neuroendocrine tumors: a population‐based analysis of epidemiology, metastatic presentation, and outcomes. Cancer. 2015;121:589‐597. [DOI] [PubMed] [Google Scholar]
- 10. Gosain R, Ball S, Rana N, et al. Geographic and demographic features of neuroendocrine tumors in The United States of America: a population‐based study. Cancer. 2020;126:792‐799. [DOI] [PMC free article] [PubMed] [Google Scholar]
- 11. Modlin IM, Lye KD, Kidd M. Carcinoid tumors of the stomach. Surg Oncol. 2003;12:153‐172. [DOI] [PubMed] [Google Scholar]
- 12. Okita NT, Kato K, Takahari D, et al. Neuroendocrine tumors of the stomach: chemotherapy with cisplatin plus irinotecan is effective for gastric poorly‐differentiated neuroendocrine carcinoma. Gastric Cancer. 2011;14:161‐165. [DOI] [PubMed] [Google Scholar]
- 13. Kang SH, Kim KH, Seo SH, et al. Neuroendocrine carcinoma of the stomach: a case report. World J Gastrointest Surg. 2014;6:77‐79. [DOI] [PMC free article] [PubMed] [Google Scholar]
- 14. Hochwald SN, Zee S, Conlon KC, et al. Prognostic factors in pancreatic endocrine neoplasms: an analysis of 136 cases with a proposal for low‐grade and intermediate‐grade groups. J Clin Oncol. 2002;20:2633‐2642. [DOI] [PubMed] [Google Scholar]
- 15. Pape UF, Jann H, Müller‐Nordhorn J, et al. Prognostic relevance of a novel TNM classification system for upper gastroenteropancreatic neuroendocrine tumors. Cancer. 2008;113:256‐265. [DOI] [PubMed] [Google Scholar]
- 16. Kim JY, Hong SM. Recent updates on neuroendocrine tumors from the gastrointestinal and Pancreatobiliary tracts. Arch Pathol Lab Med. 2016;140:437‐448. [DOI] [PubMed] [Google Scholar]
- 17. Huguet I, Grossman AB, O'Toole D. Changes in the epidemiology of neuroendocrine tumours. Neuroendocrinology. 2017;104:105‐111. [DOI] [PubMed] [Google Scholar]
- 18. Masui T, Ito T, Komoto I, Uemoto S. Recent epidemiology of patients with gastro‐entero‐pancreatic neuroendocrine neoplasms (GEP‐NEN) in Japan: a population‐based study. BMC Cancer. 2020;20:1104. [DOI] [PMC free article] [PubMed] [Google Scholar]
- 19. Valent F, Tullio A, Kara E, et al. A retrospective cohort study of histology‐proven neuroendocrine neoplasms in the Italian area of Udine. Endocr Metab Immune Disord Drug Targets. 2021;21:448‐457. [DOI] [PubMed] [Google Scholar]
- 20. Genus TSE, Bouvier C, Wong KF, et al. Impact of neuroendocrine morphology on cancer outcomes and stage at diagnosis: a UK nationwide cohort study 2013‐2015. Br J Cancer. 2019;121:966‐972. [DOI] [PMC free article] [PubMed] [Google Scholar]
- 21. Chauhan A, Yu Q, Ray N, et al. Global burden of neuroendocrine tumors and changing incidence in Kentucky. Oncotarget. 2018;9:19245‐19254. [DOI] [PMC free article] [PubMed] [Google Scholar]
- 22. Chauhan A, Kohn E, Del Rivero J. Neuroendocrine tumors‐less well known, often misunderstood, and rapidly growing in incidence. JAMA Oncol. 2020;6:21‐22. [DOI] [PMC free article] [PubMed] [Google Scholar]
- 23. Koizumi T, Otsuki K, Tanaka Y, Kanda S. Epidemiology of neuroendocrine neoplasmas in Japan: based on analysis of hospital‐based cancer registry data, 2009–2015. BMC Endocr Disord. 2022;22:105. [DOI] [PMC free article] [PubMed] [Google Scholar]
- 24. Uchiyama C, Tamura S, Nakatsuka S, et al. Immunohistochemical consistency between primary tumors and lymph node metastases of gastric neuroendocrine carcinoma. World J Surg Oncol. 2012;10:115. [DOI] [PMC free article] [PubMed] [Google Scholar]
- 25. Namikawa T, Oki T, Kitagawa H, Okabayashi T, Kobayashi M, Hanazaki K. Neuroendocrine carcinoma of the stomach: clinicopathological and immunohistochemical evaluation. Med Mol Morphol. 2013;46:34‐40. [DOI] [PubMed] [Google Scholar]
- 26. Liang P, Wang YX, Ren XC, Gao JB. Neuroendocrine carcinoma of the stomach: clinical features and CT findings. Abdom Radiol (New York). 2016;41:19‐24. [DOI] [PubMed] [Google Scholar]
- 27. Liu DJ, Fu XL, Liu W, et al. Clinicopathological, treatment, and prognosis study of 43 gastric neuroendocrine carcinomas. World J Gastroenterol. 2017;23:516‐524. [DOI] [PMC free article] [PubMed] [Google Scholar]
- 28. Savva C, Kaye P, Soomro I, Parsons SL, James E, Madhusudan S. Primary esophagogastric neuroendocrine carcinoma: a retrospective study from the Nottingham upper gastrointestinal cancer center. J Gastrointest Cancer. 2018;49:85‐92. [DOI] [PubMed] [Google Scholar]
- 29. Yamagata Y, Yoshikawa T, Ishizu K, et al. Is lymph node dissection for neuroendocrine carcinoma of the stomach effective as it is for adenocarcinoma? Eur J Surg Oncol. 2021;47:2004‐2009. [DOI] [PubMed] [Google Scholar]
- 30. Lin J, Zhao Y, Zhou Y, et al. Comparison of survival and patterns of recurrence in gastric neuroendocrine carcinoma, mixed adenoneuroendocrine carcinoma, and adenocarcinoma. JAMA Netw Open. 2021;4:e2114180. [DOI] [PMC free article] [PubMed] [Google Scholar]
- 31. Iwasaki K, Barroga E, Enomoto M, et al. Long‐term surgical outcomes of gastric neuroendocrine carcinoma and mixed neuroendocrine‐non‐neuroendocrine neoplasms. World J Surg Oncol. 2022;20:165. [DOI] [PMC free article] [PubMed] [Google Scholar]
- 32. Ishida M, Sekine S, Fukagawa T, et al. Neuroendocrine carcinoma of the stomach: morphologic and immunohistochemical characteristics and prognosis. Am J Surg Pathol. 2013;37:949‐959. [DOI] [PubMed] [Google Scholar]
- 33. Xu X, Li J, Han X, Shi C, Jin D, Lou W. Clinical characteristics and prognostic factors of patients with gastric neuroendocrine carcinoma treated with radical surgery. Chin Med J. 2014;127:2419‐2422. [PubMed] [Google Scholar]
- 34. Tang X, Chen Y, Guo L, Zhang J, Wang C. Prognostic significance of metastatic lymph node number, ratio and station in gastric neuroendocrine carcinoma. J Gastrointest Surg. 2015;19:234‐241. [DOI] [PubMed] [Google Scholar]
- 35. Huang YC, Yang NN, Chen HC, et al. Clinicopathological features and prognostic factors associated with gastroenteropancreatic mixed neuroendocrine non‐neuroendocrine neoplasms in Chinese patients. World J Gastroenterol. 2021;27:624‐640. [DOI] [PMC free article] [PubMed] [Google Scholar]
- 36. Masui T, Ito T, Komoto I, et al. Nationwide registry for patients with neuroendocrine neoplasm of pancreas, gastrointestinal tract, lungs, bronchi, or thymus in Japan. Int J Clin Oncol. 2022;27:840‐849. [DOI] [PMC free article] [PubMed] [Google Scholar]
- 37. Ye H, Yuan Y, Chen P, Zheng Q. Risk factors for metastasis and survival of patients with T1 gastric neuroendocrine carcinoma treated with endoscopic therapy versus surgical resection. Surg Endosc. 2022;36:6162‐6169. [DOI] [PMC free article] [PubMed] [Google Scholar]
- 38. Ishida M, Sekine S, Taniguchi H, Fukagawa T, Katai H, Kushima R. Consistent absence of HER2 expression, regardless of HER2 amplification status, in neuroendocrine carcinomas of the stomach. Histopathology. 2014;64:1027‐1031. [DOI] [PubMed] [Google Scholar]
- 39. Yamashita S, Abe H, Kunita A, Yamashita H, Seto Y, Ushiku T. Programmed cell death protein 1/programmed death ligand 1 but not HER2 is a potential therapeutic target in gastric neuroendocrine carcinoma. Histopathology. 2021;78:381‐391. [DOI] [PubMed] [Google Scholar]
- 40. La Rosa S, Inzani F, Vanoli A, et al. Histologic characterization and improved prognostic evaluation of 209 gastric neuroendocrine neoplasms. Hum Pathol. 2011;42:1373‐1384. [DOI] [PubMed] [Google Scholar]
- 41. Endo S, Dousei T, Yoshikawa Y, et al. Gastric neuroendocrine tumors in our institutions according to the WHO 2010 classification. Int Surg. 2012;97:335‐339. [DOI] [PMC free article] [PubMed] [Google Scholar]
- 42. Escobar KM, Vicente‐Villardon JL, Villacís Gonzalez RE, et al. Neuroendocrine tumors: an analysis of prevalence, incidence, and survival in a hospital‐based study in Ecuador. Healthcare. 2022;10:1569. [DOI] [PMC free article] [PubMed] [Google Scholar]
- 43. Chen J, Wang A, Ji K, Bu Z, Ji J. Comparison of overall survival of gastric neoplasms containing neuroendocrine carcinoma components with gastric adenocarcinoma: a propensity score matching study. BMC Cancer. 2020;20:777. [DOI] [PMC free article] [PubMed] [Google Scholar]
- 44. Ma F, Wang B, Xue L, et al. Neoadjuvant chemotherapy improves the survival of patients with neuroendocrine carcinoma and mixed adenoneuroendocrine carcinoma of the stomach. J Cancer Res Clin Oncol. 2020;146:2135‐2142. [DOI] [PMC free article] [PubMed] [Google Scholar]
- 45. Zhang WH, Wang WQ, Gao HL, Yu XJ, Liu L. The tumor immune microenvironment in gastroenteropancreatic neuroendocrine neoplasms. Biochim Biophys Acta Rev Cancer. 2019;1872:188311. [DOI] [PubMed] [Google Scholar]
- 46. Kurtulan O, Turhan N, Gedikoğlu G, Akyol A, Sökmensüer C. Defining prognostic parameters of well‐differentiated gastric neuroendocrine tumors based on metastatic potential: a two‐center experience. Acta Gastroenterol Belg. 2022;85:339‐345. [DOI] [PubMed] [Google Scholar]
- 47. Nuñez‐Valdovinos B, Carmona‐Bayonas A, Jimenez‐Fonseca P, et al. Neuroendocrine tumor heterogeneity adds uncertainty to the World Health Organization 2010 classification: real‐world data from the Spanish tumor registry (R‐GETNE). Oncologist. 2018;23:422‐432. [DOI] [PMC free article] [PubMed] [Google Scholar]
- 48. Abdel‐Rahman O, Ghosh S, Morrish D. Impact of baseline body mass index on the outcomes of patients with neuroendocrine neoplasms. J Endocrinol Investig. 2022;45:1683‐1688. [DOI] [PubMed] [Google Scholar]
- 49. Guo Y, Zhang L, Zhang N, et al. Bcl‐2 and Noxa are potential prognostic indicators for patients with gastroenteropancreatic neuroendocrine neoplasms. Endocrine. 2022;78:159‐168. [DOI] [PubMed] [Google Scholar]
- 50. Poleé IN, Hermans BCM, van der Zwan JM, et al. Long‐term survival in patients with gastroenteropancreatic neuroendocrine neoplasms: a population‐based study. Eur J Cancer. 2022;172:252‐263. [DOI] [PubMed] [Google Scholar]
- 51. Shannon AB, Straker RJ 3rd, Fraker DL, Miura JT, Karakousis GC. Validated risk‐score model predicting lymph node metastases in patients with non‐functional gastroenteropancreatic neuroendocrine tumors. J Am Coll Surg. 2022;234:900‐909. [DOI] [PubMed] [Google Scholar]
- 52. Nguyen AH, O'Leary MP, De Andrade JP, et al. Presentation and survival of gastro‐entero‐pancreatic neuroendocrine tumors in young adults versus older patients. Am J Surg. 2022;223:939‐944. [DOI] [PubMed] [Google Scholar]
- 53. Cao LL, Lu J, Lin JX, et al. Incidence and survival trends for gastric neuroendocrine neoplasms: an analysis of 3523 patients in the SEER database. Eur J Surg Oncol. 2018;44:1628‐1633. [DOI] [PubMed] [Google Scholar]
- 54. Şentürk M, Acar B, Yildirim MA, Çakir M, Küçükkartallar T, Vatansev C. Clinicopathological characteristics of Gastroenteropancreatic neuroendocrine tumors: 10 years of experience from a single center. Pancreas. 2022;51:159‐163. [DOI] [PubMed] [Google Scholar]
- 55. Xie JW, Lu J, Lin JX, et al. Different long‐term oncologic outcomes after radical surgical resection for neuroendocrine carcinoma and adenocarcinoma of the stomach. Oncotarget. 2017;8:57495‐57504. [DOI] [PMC free article] [PubMed] [Google Scholar]
- 56. Bajetta E, Catena L, Biondani P, et al. Activity of a three‐drug combination including cisplatin (CLOVER regimen) for poorly differentiated neuroendocrine carcinoma. Anticancer Res. 2014;34:5657‐5660. [PubMed] [Google Scholar]
- 57. Japanese Gastric Cancer Association . Japanese gastric cancer treatment guidelines (5th edition). Gastric Cancer. 2021;2021(24):1‐21. [DOI] [PMC free article] [PubMed] [Google Scholar]
- 58. Girot P, Baudin E, Senellart H, et al. Oxaliplatin and 5‐fluorouracil in advanced well‐differentiated digestive neuroendocrine tumors: a multicenter National Retrospective Study from the French Group of Endocrine Tumors. Neuroendocrinology. 2022;112:537‐546. [DOI] [PubMed] [Google Scholar]
- 59. Xu Y, Yan L, Chen T, et al. Prognosis of patients with poorly differentiated gastric neuroendocrine neoplasms: a multi‐center study in China. Future Oncol. 2022;18:2465‐2473. [DOI] [PubMed] [Google Scholar]
- 60. Gluckman CR, Metz DC. Gastric neuroendocrine tumors (carcinoids). Curr Gastroenterol Rep. 2019;21:13. [DOI] [PubMed] [Google Scholar]
- 61. Lin JP, Zhao YJ, He QL, et al. Adjuvant chemotherapy for patients with gastric neuroendocrine carcinomas or mixed adenoneuroendocrine carcinomas. Br J Surg. 2020;107:1163‐1170. [DOI] [PubMed] [Google Scholar]
- 62. Chen P, Wang W, Wong SW, et al. RUNDC3A regulates SNAP25‐mediated chemotherapy resistance by binding AKT in gastric neuroendocrine carcinoma (GNEC). Cell Death Dis. 2022;8:296. [DOI] [PMC free article] [PubMed] [Google Scholar]
- 63. Al‐Toubah T, Halfdanarson T, Gile J, Morse B, Sommerer K, Strosberg J. Efficacy of ipilimumab and nivolumab in patients with high‐grade neuroendocrine neoplasms. ESMO Open. 2022;7:100364. [DOI] [PMC free article] [PubMed] [Google Scholar]
- 64. Jayarajah U, Fernando A, Samarasekera DN, Seneviratne S. The incidence and patterns of gastric cancers in Sri Lanka from 2001 to 2012: analysis of National Cancer Registry Data. Asia Pac J Clin Oncol. 2021;17:109‐114. [DOI] [PubMed] [Google Scholar]
- 65. Hu P, Bai J, Liu M, et al. Trends of incidence and prognosis of gastric neuroendocrine neoplasms: a study based on SEER and our multicenter research. Gastric Cancer. 2020;23:591‐599. [DOI] [PMC free article] [PubMed] [Google Scholar]
- 66. Ren H, Shi SS, Wang NC, Wang X, Chen YT, Zhao DB. The significant influence of the neuroendocrine component on the survival of patients with gastric carcinoma characterized by coexisting exocrine and neuroendocrine components. J Oncol. 2019;2019:3671268. [DOI] [PMC free article] [PubMed] [Google Scholar]
- 67. Pérez‐Yépez EA, Saldívar‐Cerón HI, Villamar‐Cruz O, Pérez‐Plasencia C, Arias‐Romero LE. p21 activated kinase 1: nuclear activity and its role during DNA damage repair. DNA Repair. 2018;65:42‐46. [DOI] [PubMed] [Google Scholar]
- 68. Hadoux J, Malka D, Planchard D, et al. Post‐first‐line FOLFOX chemotherapy for grade 3 neuroendocrine carcinoma. Endocr Relat Cancer. 2015;22:289‐298. [DOI] [PubMed] [Google Scholar]
- 69. Ahmed M. Gastrointestinal neuroendocrine tumors in 2020. World J Gastrointest Oncol. 2020;12:791‐807. [DOI] [PMC free article] [PubMed] [Google Scholar]
- 70. Jiang SX, Mikami T, Umezawa A, Saegusa M, Kameya T, Okayasu I. Gastric large cell neuroendocrine carcinomas: a distinct clinicopathologic entity. Am J Surg Pathol. 2006;30:945‐953. [DOI] [PubMed] [Google Scholar]
- 71. Park JY, Ryu MH, Park YS, et al. Prognostic significance of neuroendocrine components in gastric carcinomas. Eur J Cancer. 2014;50:2802‐2809. [DOI] [PubMed] [Google Scholar]
- 72. Kubota T, Ohyama S, Hiki N, Nunobe S, Yamamoto N, Yamaguchi T. Endocrine carcinoma of the stomach: clinicopathological analysis of 27 surgically treated cases in a single institute. Gastric Cancer. 2012;15:323‐330. [DOI] [PubMed] [Google Scholar]
- 73. Kim BS, Park YS, Yook JH, Kim BS. Comparison of relapse‐free survival in gastric neuroendocrine carcinoma (WHO grade 3) and gastric carcinoma. Ther Adv Gastroenterol. 2017;10:407‐415. [DOI] [PMC free article] [PubMed] [Google Scholar]
- 74. Chen MH, Kuo YJ, Yeh YC, et al. High neuroendocrine component is a factor for poor prognosis in gastrointestinal high‐grade malignant mixed adenoneuroendocrine neoplasms. J Chin Med Assoc. 2015;78:454‐459. [DOI] [PubMed] [Google Scholar]
- 75. Zou Y, Chen L, Wang X, et al. Prognostic threshold of neuroendocrine differentiation in gastric carcinoma: a clinicopathological study of 945 cases. J Gastric Cancer. 2019;19:121‐131. [DOI] [PMC free article] [PubMed] [Google Scholar]
- 76. Xie JW, Lu J, Wang JB, et al. Prognostic factors for survival after curative resection of gastric mixed adenoneuroendocrine carcinoma: a series of 80 patients. BMC Cancer. 2018;18:1021. [DOI] [PMC free article] [PubMed] [Google Scholar]
Associated Data
This section collects any data citations, data availability statements, or supplementary materials included in this article.
Supplementary Materials
Appendix S1
Data Availability Statement
The data that support the findings of this study are available on request from the corresponding author. The data are not publicly available due to privacy or ethical restrictions.