

Abstract
Background:
Various diet quality scores are consistently and similarly associated with mortality risk. Emerging evidence suggests that individual diet quality components are differentially associated with mortality risk, but it is unclear whether modified weights reflective of relative component differences would strengthen mortality associations.
Objective:
This study examined whether Healthy Eating Index-2015 (HEI-2015) scores with modified (vs. standard) component weights are differentially associated with mortality risk.
Design:
This was a longitudinal analysis of the National Health and Nutrition Examination Survey III (1988–94) with 23 years of mortality follow-up. The HEI-2015 and modified-weight scores were calculated from one 24-hour recall. The a priori Key Facets HEI was a subset score equivalently weighting fruits, vegetables, whole grains, and seafood and plant proteins. In the LASSO regression (LR)-weighted HEI, components were assigned weights reflecting relative mortality risk associations.
Participants/setting:
Analyses included 10,789 U.S. adults (≥ 20 years) who were not pregnant and without prior diabetes, cancer, cardiovascular disease (CVD), or chronic kidney disease diagnoses.
Main outcome measures:
All-cause and CVD mortality risk were the primary outcomes examined.
Statistical analyses performed:
Three energy-adjusted HEI scores were assigned to quintiles; covariate-adjusted sex-stratified Cox models with age as the timescale assessed associations between and trends across quintiles of HEI scores and all-cause and CVD mortality risk.
Results:
Modified-weight HEI scores were associated with 23% to 38% reduced all-cause mortality risk in the highest vs. lowest quintile, while comparisons were only significant for women (Key Facets p=0.02 and LR-weighted p=0.001; for men p=0.06 on both scores), trends across quintiles of modified-weight scores were significant for men and women. The HEI-2015 was not significantly associated with all-cause mortality risk, and none of the scores were associated with CVD mortality risk.
Conclusions:
Only modified-weight HEI scores were associated with reduced all-cause mortality risk. Findings suggest modified diet quality weighting schemes warrant further examination to determine their replicability.
Keywords: diet quality components, Healthy Eating Index, machine learning, mortality, National Health and Nutrition Examination and Survey
INTRODUCTION
Overall dietary patterns, rather than single foods or nutrients, are increasingly recognized as primary lifestyle risk factors for cardiovascular disease (CVD) and overall mortality and are therefore the focus of various dietary recommendations nationally and globally.1 Numerous measures of dietary pattern quality are consistently associated with all-cause mortality risk.2,3 As demonstrated in the Dietary Patterns Methods Project (DPMP), diets classified as high-quality using four diet quality indexes (i.e., the Healthy Eating Index (HEI), Alternative Healthy Eating Index, Mediterranean Diet, and Dietary Approaches to Stop Hypertension scores) were similarly associated with 14% to 28% reductions in all-cause and CVD mortality risk across three large cohorts of U.S. adults.2,4 The similar mortality associations across indexes are not unexpected as the components of healthy diets are largely similar, particularly for reducing mortality risk. A recent meta-analysis examining dietary patterns found that high intakes of specific dietary components (i.e., fruits, vegetables, whole grains, nuts, legumes, unsaturated fats, fish/seafood) were consistently protective against all-cause mortality risk; these same, protective components were commonly assessed in the 110 studies that used diet quality indexes.5 The DPMP authors also noted the consistency in fruits, vegetables, whole grains, and plant proteins, suggesting that these components common to the four DPMP indexes may substantially affect mortality.2
While different diet quality measures contain similar components, varying degrees of emphasis are introduced when dietary pattern recommendations are translated into diet quality indexes.6 Traditionally, component scores have been aggregated into a composite overall diet quality score using linear approaches, which result in relatively equally weighted components.7 For example, in the HEI-2015, where scores indicate adherence to the 2015–2020 Dietary Guidelines for Americans (DGAs) which aim to meet nutrient needs and reduce diet-related morbidity and mortality, 100 points are allocated in five and 10 point increments across nine adequacy and four moderation components.8,9 Nevertheless, the suggestion that shared components common across diet quality indexes may be more influential for mortality risk than others is supported by findings from meta-analyses, which report differential magnitudes of mortality risk associations across individual components.10–13 This differential importance is somewhat reflected in HEI methodology by assigning some specific foods to incentivized components (e.g., whole fruits and greens and beans count independently and toward total fruits and vegetables) which results in double or quadruple counting of intakes.8
While the DPMP concluded that multiple high-quality dietary patterns are similarly associated with mortality risk,2 upweighting specific components may provide greater understanding of their relative importance which could help inform dietary priorities for improving population-level quality, which remains suboptimal.14 The present study explores whether two modified-weight HEI scores are more strongly associated with all-cause and CVD mortality risk, as compared to the standard HEI-2015. First, a Key Facets HEI was created by retaining a subset of a priori selected HEI-2015 components (i.e., two fruit components, two vegetables components, whole grains, and seafood and plant proteins; herein “Key Facets”). Fruits, vegetables, whole grains, seafood, and plant proteins have been consistently emphasized in the literature as protective.2,5 These components were weighted subjectively, using an approach similar to the HEI-2015. Next, a model-based approach reweighted all the HEI-2015 components to reflect relative component importance for reducing mortality risk.15 Therefore, the purpose of this study was to examine whether high scores on two modified-weight HEI scores will result in stronger all-cause and CVD mortality risk compared to standard HEI-2015 scores.
METHODS
Data were analyzed from the Third National Health and Nutrition Examination Survey (NHANES III, 1988–94), a U.S. nationally representative study capturing information on health and nutritional status. Methods for NHANES III have been described elsewhere.16 Briefly, approximately 34,000 noninstitutionalized civilians aged ≥ two mos. were selected for participation using a complex, multistage, probability design. Data were collected first with household interviews, then participants visited a mobile examination center (or completed a home examination when applicable) where anthropometric, biochemical, a 24-hour dietary recall, and other health measures were collected. The National Center of Health Statistics gave ethical approval and informed consent was obtained from participants.16
The analytic sample (n=10,789) selection is depicted in Figure 1. Consistent with the DPMP,2 the analytic sample included participants with complete baseline dietary data and mortality follow-up data through 2015, and reliable 24-hr recall and participant interview as indicated by NHANES staff. Participants with self-reported history of cancer (non-skin), stroke, myocardial infarction, or congestive heart failure were excluded. Beyond DPMP criteria, analyses were restricted to participants aged ≥ 20 years, i.e., adults per NHANES III analytic guidelines17; age was collected during the household screening interview.18 Because energy intake estimates ranged from 39 to 17,739 kcals, the sample was additionally restricted to participants with plausible energy intake between 400 and 7,000 kcals,19 to reduce the influence of potential extreme misreporting; importantly, similar plausible energy intake ranges have been applied (e.g., 500 to 8,000 kcals) in prior DPMP and NHANES III analyses.20–24 Due to changes in overall dietary patterns observed during pregnancy and lactation relative to other life stages,25,26 and because this analysis aimed to characterize population-level intake patterns associated with long term mortality risk, participants who were pregnant and/or breastfeeding at the time of interview were excluded to prevent misclassification of dietary patterns. Consistent with other diet-related mortality analyses in NHANES III,27,28 participants with diabetes (self-reported, fasting blood glucose ≥ 126 mg/dL (7.0 mmol/L), HbA1c ≥ 6.5% (47.5 mmol/mol), or self-reported use of diabetes medication within the past month) or chronic kidney disease (estimated glomerular filtration rate ≤ 60mL/min (1 mL/s)) were also excluded because changes in diet may follow cardiometabolic diagnoses.29,30 For comparability with DPMP estimates, all analyses were sex-stratified a priori (n=5,594 women and n=5,195 men); sex was self-reported during the household screening interview.18
Figure 1.
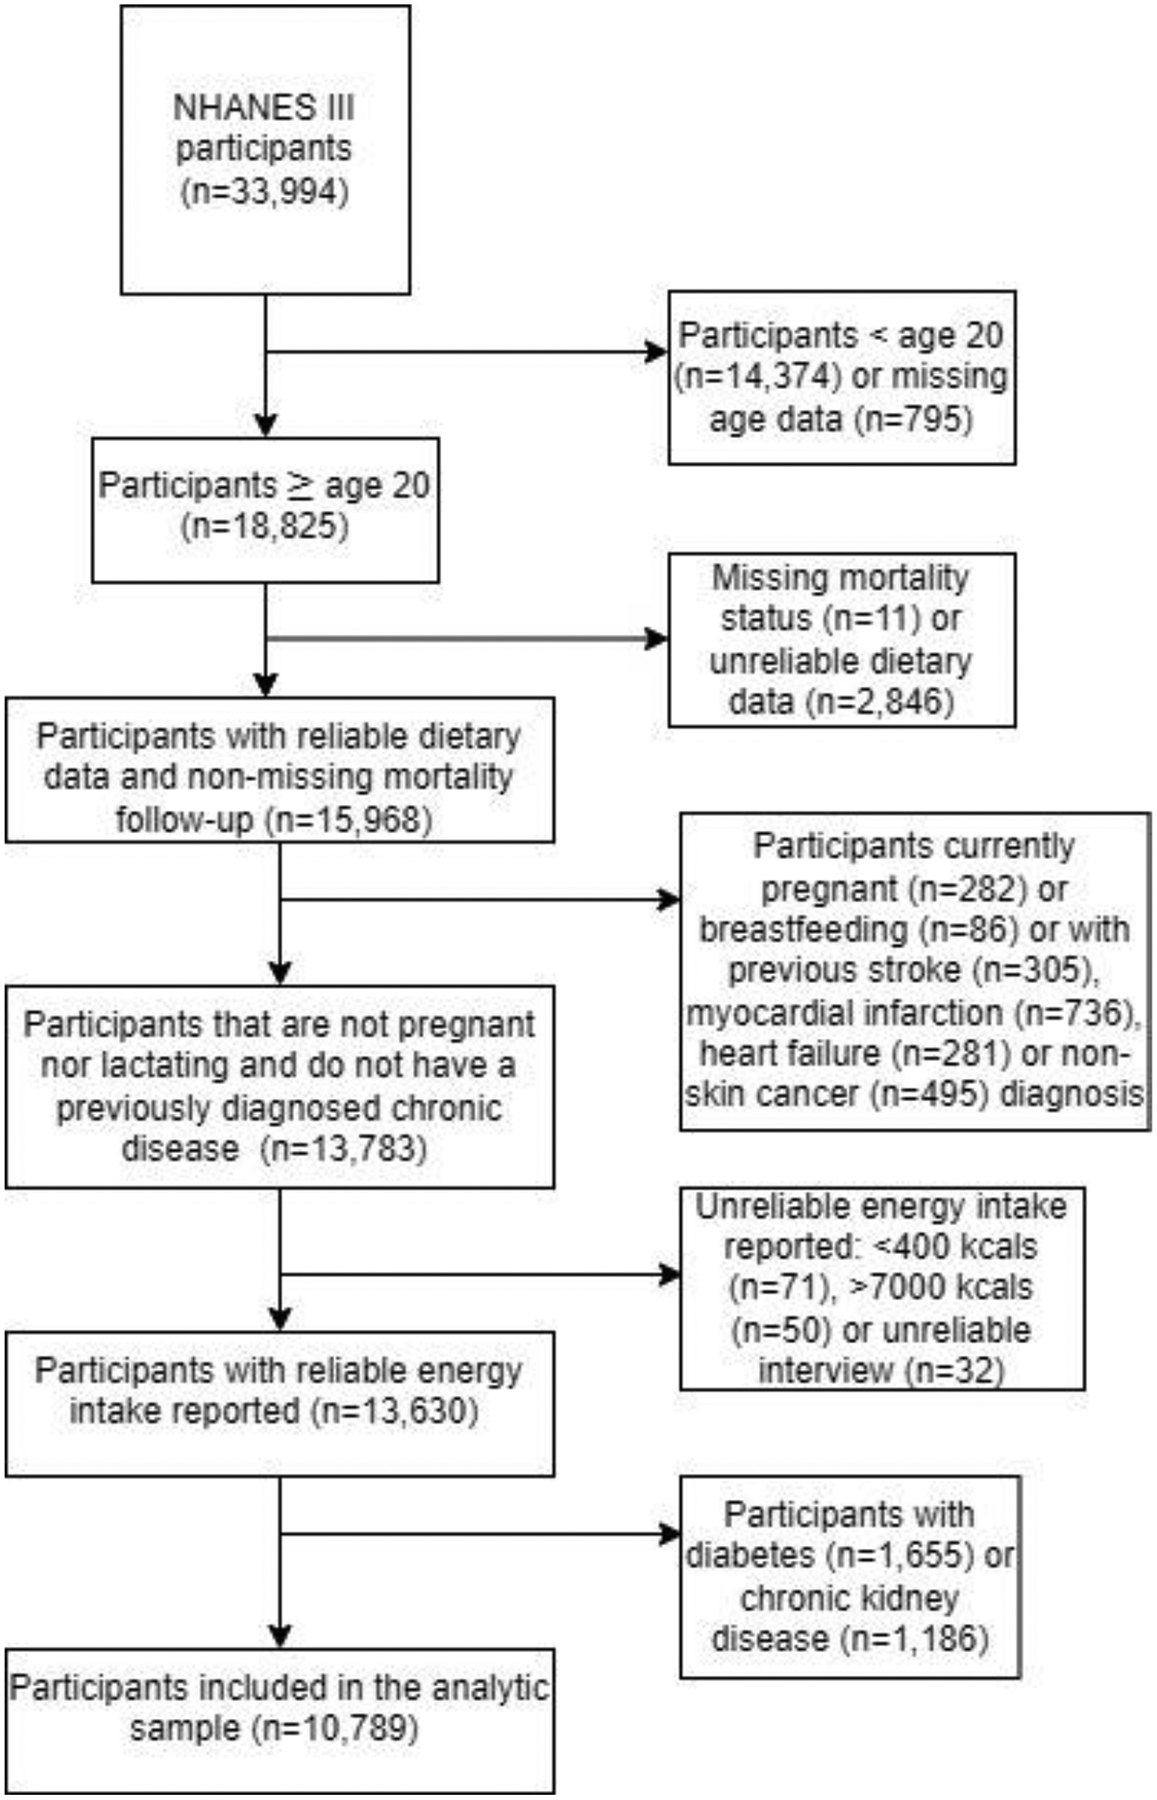
Flow chart designating the analytic sample selection of 10,789 participants from the from the Third National Health and Nutrition Examination and Survey (NHANES III)
Diet quality exposure variables
Twenty-four hour recalls of dietary intake were collected by interviewers using the computer-assisted Dietary Data Collection system.16 Approximately 15% were collected on each of the seven days of the week; most participants completed just one recall, while approximately 5% completed a second recall.16 Foods reported were linked to USDA’s Survey Nutrient Database and Pyramid Servings Database, where food intakes were converted into USDA food group equivalents.31,32 Diet quality was assessed from a single 24-hr recall with the first recall used if the participant completed two, using three versions of the HEI described below.
HEI-2015:
Diet quality was measured using the HEI-2015, an index that assesses compliance with the 2015–2020 DGAs.8 While the original HEI reflects the DGAs at the time of data collection,33 the HEI-2015 was selected to assess mortality risk associated with current guidance; it should be noted, however, that the HEI-2015 components and scoring standards fully align with the HEI-2020, which was released in 2023.34 Therefore, analyses reflect both the HEI-2015 and the HEI-2020.
The HEI-2015 is comprised of 13 components (nine adequacy and four moderation) which are scored proportionally (e.g., whole fruit intakes ≥ 0.4 c./1000 kcals equate to a maximum score of 5 points, while intakes of 0.2 c./1000 kcals equate to a score of 2.5 points). Higher intake of adequacy components (e.g., fruits, vegetables, whole grains, etc.) earn higher scores. Moderation components (e.g., added sugar, sodium, etc.) are scored inversely so higher scores reflect lower (i.e., more desirable) intakes. Food groups are represented with either a single 10-point component or two components worth 5 points each (e.g., whole and total fruit), which sum to a maximum total score of 100 points; higher scores equate to higher diet quality.8
HEI-2015 scores were calculated using the simple scoring method because the proportion of the sample with two recalls was insufficient for current multivariate methods that adjust for usual intake.35 Component weights were altered to create two modified scores for a total of three HEI scores: 1) the standard HEI-2015, 2) the Key Facets HEI, and 3) the least absolute shrinkage and selection operator (LASSO) regression (LR)-weighted HEI (summarized in Table 1). While HEI components are scored on an energy-density basis, because energy intake independent of diet quality is related to mortality, all three HEI scores were adjusted for overall energy intake using the residual method, i.e., continuous scores were regressed onto total energy intake, then residuals were ranked and assigned into sex-specific quintiles.36
Table 1 –
Maximum number of points for each component of the Healthy Eating Index-2015 (HEI-2015) and the two modified versions
| HEI-2015 Components | Standard HEI (points) |
Key facets HEI (points) |
LR-weighteda HEI, womenb (points) |
LR-weighted HEI, menc (points) |
|---|---|---|---|---|
| Total vegetables | 5 | 12.5 | 0.5 | 11.4 |
| Greens and beans | 5 | 12.5 | 6.4 | 0.8 |
| Total fruit | 5 | 12.5 | 17.2 | 16.2 |
| Whole fruit | 5 | 12.5 | 6.1 | 2.2 |
| Whole grains | 10 | 25 | 15.4 | 12.4 |
| Dairy | 10 | - | 7.1 | 4.6 |
| Total protein foods | 5 | - | 0.5 | 3.7 |
| Seafood and plant proteins | 5 | 25 | 17.2 | 14.2 |
| Fatty acids | 10 | - | 11.6 | 7.8 |
| Sodium | 10 | - | 0 | 0.2 |
| Refined grains | 10 | - | 6.6 | 11.2 |
| Saturated fats | 10 | - | 8.8 | 8.7 |
| Added sugars | 10 | - | 2.6 | 6.6 |
| Total score | 100 | 100 | 100 | 100 |
LASSO regression (LR).
Estimated from n=5,594 women who participated in the Third National Health and Nutrition Examination Survey (NHANES III).
Estimated from n=5,195 men who participated in NHANES III.
Key Facets HEI:
Using an a priori subset score approach, the Key Facets HEI was developed to examine whether consistent mortality risk reductions observed across diet quality indexes are explained by the two fruit components, the two vegetable components, the whole grains component, and the seafood and plant-based protein component.2,5 These components were selected because fruits, vegetables, whole grains, and plant-based proteins were consistently represented across the DPMP indexes; moreover, components for greens and beans and whole fruits were included because they are nutrient-dense subgroups that are emphasized in the DGAs and HEI,8,34,37 and because they are consistently and strongly associated with all-cause and CVD mortality risk.10,38 In the Key Facets HEI, weights were assigned in a manner similar to the HEI-2015; each of the two fruit components (i.e., whole fruit and total fruit) and the two vegetables components (i.e., total vegetables and greens and beans) have weights of 12.5, and the whole grains and seafood and plant protein components have weights of 25 (the total protein foods component was omitted from the Key Facets score).
LR-weighted HEI:
Using a data-driven approach, the LR-weighted HEI was developed using LASSO models to determine the optimal component weights for maximizing mortality risk reduction.39 Weights for the LR-weighted HEI were obtained using unadjusted, unweighted, sex-stratified LASSO models from the glmnet package in R Statistical Software, version 3.6.3,40 containing HEI-2015 component scores as predictors, attained age as the timescale (described below), and all-cause mortality as the outcome. Cross-validation was used to select the optimal tuning factor (λ) which determines the strength of the penalization applied.39 Because LASSO models shrink and select variables by assigning a coefficient of zero to less important predictors,39 components assigned a coefficient of zero were omitted from the LR-weighted HEI, except for when any of the six Key Facets components were omitted, in which case, the model was adjusted to force retention. Models were forced to retain the Key Facets components because these were selected a priori as important, shared components based on the previous literature,2,5 and because when collinearity is present amongst LASSO predictors, LASSO generally retains only one predictor.39 Except for whole grains, Key Facets are more collinear than other components because intakes count towards the incentivized, nested component (i.e., whole fruit, greens and beans, and seafood and plant proteins) as well as the broader, overarching component (i.e., total fruit, total vegetables, total protein foods) simultaneously. Therefore, Key Facets were most likely to be omitted during LASSO variable selection and were subsequently forced into the model. Only one component (total vegetables for women) was forced into the model, which was subsequently assigned a weight of 0.5 points, while other component weights remained similar to their non-forced weights. The LR-weighting scheme (Table 1) was derived by summing the absolute value of all coefficients and calculating the component-specific relative contribution (i.e., each component’s percentage of the summed coefficients).
Mortality outcomes
National Death Index records updated through 31 Dec 2015 and matched to NHANES participants using personal identifiers (e.g., name, birthdate, etc.) by the National Center for Health Statistics informed the outcome variables.41 Outcomes of interest included mortality by all-causes and CVD; CVD mortality outcomes were defined as mortality events where the leading cause of death was listed as diseases of the heart or cerebrovascular diseases. Participants who did not experience a mortality event were censored on 31 Dec 2015, and no participants were lost to follow-up before then.
Covariates
For consistency and comparability of estimates, standardized DPMP covariates were replicated as directly as possible within NHANES III using participant interview and exam data. Race and ethnicity were self-reported during the household screening interview; responses for race (Black, White, Other, N/A) and ethnicity (Mexican American, Other Hispanic, N/A18) were combined to create a nominal variable (non-Hispanic White, non-Hispanic Black, Hispanic, or Other race/ethnicity). For education, number of years of education completed were self-reported during the household interview17; years of education were recoded into a four-level variable including less than high school (<12 years), high school graduate (12 years), some college (>12 to <16 years), and college graduate (≥16 years). Consistent with the DPMP, education was included as a measure of socioeconomic status instead of income.
Interview questions on smoking history were used to define a three-level smoking status variable classifying participants as current, former, or never smokers; nonsmokers at the time of survey were classified as former smokers (i.e., smoked ≥ 100 cigarettes in their lifetime) or never smokers.42 Participants self-reported marital status during the interview, selecting from seven classifications (married with(out) spouse in household, living as married, widowed, divorced, separated, and never married42) which were recoded as a dichotomous marital status variable (married/living as married or not (widowed, divorced, never married, separated)).
Leisure time physical activity was assessed using self-reported engagement on nine activities (i.e., jog/run, bicycle, swim, aerobics, dancing, calisthenics, gardening/yard work, weightlifting, and other) and frequency over the past month. Because duration of physical activity was not assessed, number of monthly activities reported were summed and divided by 4.3 (i.e., average weeks/month) to obtain total weekly activities which were dichotomized (<2.5 or ≥2.5 weekly physical activities reported) to create a physical activity covariate.
Height and weight measured by trained NHANES staff were used to calculate BMI, which was categorized as a three-level variable (<25 kg/m2, ≥25 to <30 kg/m2, ≥30 kg/m2). Energy and alcohol intake measured continuously, were obtained from 24-hr recalls.16 Use of hormone replacement therapy for women was assessed via prescription medication data collected during the interview; medications with an ICD-9 code of V07.4, i.e., postmenopausal hormone replacement therapy use, informed a dichotomous variable (yes/no).43 Additionally, summed moderation component scores were adjusted for in the Key Facets HEI models only to help control for possible confounding by moderation scores. No data were missing for covariates, exposure, or outcome variables for participants in the analytic sample.
Statistical analysis
Means and frequencies of participant characteristics were examined across quintiles of all three HEI scores. For continuous characteristics, median values were assigned to all participants in each quintile and regression models assessed trends across quintiles. For categorical characteristics, chi-squared tests were used to assess differences across HEI quintiles. To examine the diet patterns of participants with high and low HEI scores, mean component intakes were calculated and compared descriptively. Unweighted pairwise continuous HEI score correlations were examined to assess similarity of participant scores across the different HEIs.
Cox models assessed associations between quintiles of HEI scores and mortality risk (all-cause and CVD). Models were survey-weighted and standard errors of estimates were calculated using Taylor series linearization.44 For all three HEIs, hazard ratios across score quintiles were estimated using partially-adjusted (adjusted for age and energy intake) and adjusted models which additionally included a priori covariates for race, education, smoking status, BMI, marital status, physical activity, hormone replacement therapy, alcohol intake, and summed moderation components (Key Facets HEI models only). In sensitivity analyses, summed moderation components were removed from the adjusted Key Facets HEI model covariates.
Rather than time-on-study, attained age (i.e., age at interview to age of death or censoring) was applied as the Cox model time metric; because NHANES III participant ages ranged from 20 to 80 years at baseline, mortality risk was more strongly related to age than time-on-study. Therefore, attained age was the most appropriate metric for estimating baseline hazards in this sample.45,46 Furthermore, numerous proportional hazards assumption violations were observed with a time-on-study timescale that were not present with attained age as the timescale. Cox proportional hazards assumptions were assessed via interactions with age where statistically significant interactions indicated violations. When present, models should be stratified by covariates with proportional hazards violations. However, no stratifications were necessary in this analysis, as all exposure variables and covariates met the proportional hazards assumption.
Alongside significance tests comparing hazard ratios in the highest vs. lowest quintile (Q) as the reference group, linear trends in mortality risk across HEI quintiles were tested by assigning median HEI values to all participants in each quintile and analyzing HEI as a continuous variable.
In LASSO models used to determine weights for the LR-weighted HEI, sensitivity analyses assessed model fit using the c-statistic,47 a measure of concordance between model-based predictions and actual outcomes. C-statistics range from zero to one, where a value of one indicates perfect discrimination and a value of 0.5 indicates model discrimination is no better than chance.
Aside from LASSO models which were developed using R Statistical Software,40 all analyses were completed in SAS 9.4,48 where complex survey weights were applied (unless otherwise noted) to obtain nationally representative estimates. All significance tests were two-sided at the 0.05 significance level. Because this analysis was exploratory, no adjustments were made for multiple comparisons.
RESULTS
Participant characteristics
Among 5,594 women, 1,276 (23%) all-cause mortality events occurred, 328 (6%) which were due to CVD, and among 5,195 men, 1,570 (30%) all-cause and 388 (7%) CVD mortality events occurred with a median follow-up of 276 months for women and 277 months for men (i.e., 23 yrs., range = 1 to 326 months). Participant characteristics for high (i.e., Q5) and low (i.e., Q1) scores on all three HEIs are displayed in Table 2 for women and Table 3 for men; characteristics for both sexes followed similar patterns across all three scores. Men and women in Q5 (compared to Q1) had higher scores on all three HEIs, lower BMIs, older ages at enrollment, and lower energy intake (p-value for trend across HEI quintiles <0.0001), except for women on the HEI-2015, where Q5 (vs. Q1) BMI and energy intake were higher, and age was lower. Differences in race/ethnicity were observed across quintiles (p<0.001); descriptively, Q5 (vs. Q1) generally had more non-Hispanic White participants whereas Q1 generally had more non-Hispanic Black and Hispanic participants, except for women on the HEI-2015 where Q5 (vs. Q1) had fewer non-Hispanic White and more Hispanic women. Compared to Q1, Q5 participants were more frequently married (except for men on the HEI-2015, p>0.05). Differences were also observed for smoking status and education (p-value <0.05) where descriptively Q5 (vs. Q1) had more nonsmokers and college graduates. Additionally, more women in Q5 were using hormone replacement therapy (p-value for trend <0.0001). All HEI scores were moderate-to-highly correlated (r>0.6; data not shown). In both sexes, HEI-2015 scores were similarly correlated with LR-weighted (r=0.8) and Key Facets HEI scores (r=0.7).
Table 2 –
Descriptive characteristics for women (n=5,594) in the Third National Health and Nutrition Examination Survey across groups with the highest and lowest diet quality on three Healthy Eating Index-2015 (HEI-2015) scores
| HEI-2015 | Key Facets HEI-2015 | LRa-weighted HEI-2015 | |||||||||||||
|---|---|---|---|---|---|---|---|---|---|---|---|---|---|---|---|
| Quintile 1 | Quintile 5 | p-valueb | Quintile 1 | Quintile 5 | p-value | Quintile 1 | Quintile 5 | p-value | |||||||
| n | 1118 | 1119 | 1118 | 1119 | 1118 | 1119 | |||||||||
| All-cause mortality cases (n) | 212 | 341 | 189 | 333 | 217 | 344 | |||||||||
| CVD mortality cases (n) | 53 | 95 | 39 | 90 | 45 | 96 | |||||||||
| HEI-2015 range | 12.7 to 38.4 | 57.1 to 93.5 | 0 to 17.3 | 50.1 to 100 | 4.9 to 25.1 | 52.7 to 98.4 | |||||||||
| Mean | SDc | Mean | SD | Mean | SD | Mean | SD | Mean | SD | Mean | SD | ||||
| HEI-2015 | 31.4 | 0.2 | 67.1 | 0.2 | *** | 35.4 | 0.3 | 63.7 | 0.4 | *** | 33.9 | 0.2 | 65.9 | 0.3 | *** |
| Key Facets HEI-2015 | 20.6 | 0.3 | 63.5 | 0.5 | *** | 19.9 | 0.3 | 63.7 | 0.4 | *** | 17.7 | 0.2 | 65.9 | 0.4 | *** |
| LR-weighted HEI-2015 | 16.6 | 0.4 | 58.5 | 0.6 | *** | 11.2 | 0.3 | 63.4 | 0.4 | *** | 13.8 | 0.2 | 61.9 | 0.5 | *** |
| BMId (kg/m2) | 26.3 | 0.3 | 26.8 | 0.5 | *** | 26.8 | 0.5 | 25.1 | 0.2 | *** | 26.7 | 0.5 | 25.3 | 0.2 | *** |
| Age (y) | 38.0 | 0.6 | 36.9 | 0.7 | *** | 36.9 | 0.7 | 48.0 | 0.7 | *** | 34.7 | 0.7 | 48.6 | 0.8 | *** |
| Energy intake (kcal/day) | 1737 | 30 | 1739 | 40 | *** | 1790 | 30 | 1755 | 33 | *** | 1778 | 29 | 1742 | 37 | *** |
| Alcohol intake (g/day) | 2.4 | 0.4 | 9.8 | 1.9 | *** | 7.4 | 1.3 | 7.0 | 1.2 | *** | 4.7 | 0.8 | 6.9 | 1.4 | *** |
| % | % | % | % | % | % | ||||||||||
| Race/ethnicity | *** | *** | *** | ||||||||||||
| Non-Hispanic White | 76.1 | 75.3 | 75.6 | 83.0 | 75.9 | 81.6 | |||||||||
| Non-Hispanic Black | 13.2 | 11.6 | 14.7 | 6.6 | 13.4 | 7.3 | |||||||||
| Hispanic | 8.6 | 9.3 | 7.8 | 6.1 | 8.8 | 7.0 | |||||||||
| Other race/ethnicity | 2.1 | 3.8 | 1.9 | 4.3 | 1.9 | 4.1 | |||||||||
| Married | 59.1 | 65.0 | *** | 59.3 | 65.0 | *** | 61.6 | 65.2 | * | ||||||
| Smoking status | *** | *** | *** | ||||||||||||
| Nonsmoker | 50.1 | 53.5 | 48.1 | 59.8 | 45.3 | 61.4 | |||||||||
| Former smoker | 12.7 | 17.7 | 10.8 | 24.5 | 13.3 | 25.7 | |||||||||
| Current smoker | 37.3 | 28.7 | 41.2 | 15.7 | 41.4 | 12.9 | |||||||||
| Education | *** | *** | *** | ||||||||||||
| Less than high school | 22.6 | 19.8 | 26.4 | 12.7 | 26.8 | 12.3 | |||||||||
| High school graduate | 41.1 | 42.5 | 39.3 | 31.6 | 38.8 | 33.8 | |||||||||
| Some college | 21.4 | 21.1 | 22.2 | 26.2 | 21.5 | 25.6 | |||||||||
| College graduate | 14.8 | 16.6 | 12.1 | 29.5 | 12.9 | 28.3 | |||||||||
| Hormone replacement therapy | 3.2 | 4.5 | *** | 3.6 | 7.3 | *** | 4.0 | 8.0 | |||||||
LASSO regression
P-values reflect trend tests across HEI quintiles obtained via regression for continuous variables and chi-squared test of difference for categorical variables, where * for P<0.05, ** for P<0.01, and *** for P<0.001.
standard deviation
body mass index.
Table 3 –
Descriptive characteristics for men (n=5,195) in the Third National Health and Nutrition Examination Survey across groups with the highest and lowest diet quality on three Healthy Eating Index-2015 (HEI-2015) scores
| HEI-2015 | Key Facets HEI-2015 | LRa-weighted HEI-2015 | |||||||||||||
|---|---|---|---|---|---|---|---|---|---|---|---|---|---|---|---|
| Quintile 1 | Quintile 5 | p-valueb | Quintile 1 | Quintile 5 | p-value | Quintile 1 | Quintile 5 | p-value | |||||||
| n | 1039 | 1039 | 1039 | 1039 | 1039 | 1039 | |||||||||
| All-cause mortality cases (n) | 289 | 349 | 323 | 367 | 292 | 358 | |||||||||
| CVD mortality cases (n) | 77 | 104 | 75 | 100 | 73 | 106 | |||||||||
| HEI-2015 range | 12.7 to 38.5 | 56.7 to 91.9 | 0 to 14.7 | 48.3 to 100 | 8.2 to 32.8 | 59.4 to 96.1 | |||||||||
| Mean | SDc | Mean | SD | Mean | SD | Mean | SD | Mean | SD | Mean | SD | ||||
| HEI-2015 | 31.5 | 0.3 | 65.3 | 0.3 | *** | 36.1 | 0.4 | 61.5 | 0.5 | *** | 32.7 | 0.4 | 63.3 | 0.5 | *** |
| Key Facets HEI-2015 | 30.0 | 0.4 | 68.3 | 0.5 | *** | 30.3 | 0.4 | 67.7 | 0.5 | *** | 27.0 | 0.3 | 70.2 | 0.4 | *** |
| LR-weighted HEI-2015 | 16.3 | 0.5 | 55.6 | 0.6 | *** | 10.0 | 0.2 | 60.5 | 0.5 | *** | 13.3 | 0.4 | 58.0 | 0.6 | *** |
| BMId (kg/m2) | 26.3 | 0.2 | 26.1 | 0.2 | *** | 26.5 | 0.3 | 26.1 | 0.1 | *** | 26.1 | 0.3 | 26.0 | 0.1 | *** |
| Age (y) | 36.5 | 0.5 | 44.8 | 0.7 | *** | 36.3 | 0.5 | 44.8 | 0.8 | *** | 35.5 | 0.4 | 45.9 | 0.7 | *** |
| Energy intake (kcal/day) | 2743 | 58 | 2618 | 48 | *** | 2712 | 54 | 2574 | 52 | *** | 2769 | 48 | 2543 | 44 | *** |
| Alcohol intake (g/day) | 8.2 | 1.0 | 19.5 | 1.5 | *** | 27.3 | 2.8 | 10.4 | 1.2 | *** | 13.6 | 1.5 | 12.1 | 1.2 | *** |
| % | % | % | % | % | % | ||||||||||
| Race/ethnicity | *** | *** | *** | ||||||||||||
| Non-Hispanic White | 73.1 | 82.1 | 76.5 | 82.8 | 76.2 | 81.3 | |||||||||
| Non-Hispanic Black | 10.3 | 6.9 | 12.2 | 7.0 | 11.3 | 7.5 | |||||||||
| Hispanic | 12.6 | 8.9 | 8.4 | 6.7 | 8.8 | 7.6 | |||||||||
| Other race/ethnicity | 4.0 | 2.1 | 3.0 | 3.5 | 3.7 | 3.6 | |||||||||
| Married | 69.9 | 74.0 | 61.4 | 75.1 | *** | 67.9 | 76.5 | ** | |||||||
| Smoking status | *** | *** | *** | ||||||||||||
| Nonsmoker | 34.4 | 43.1 | 26.4 | 47.1 | 31.0 | 44.0 | |||||||||
| Former smoker | 33.9 | 36.3 | 19.1 | 33.4 | 16.5 | 37.7 | |||||||||
| Current smoker | 31.6 | 20.5 | 54.6 | 19.5 | 52.6 | 18.3 | |||||||||
| Education | *** | *** | *** | ||||||||||||
| Less than high school | 26.9 | 16.0 | 29.4 | 13.4 | 30.1 | 14.9 | |||||||||
| High school graduate | 31.1 | 22.1 | 40.7 | 23.5 | 39.4 | 23.9 | |||||||||
| Some college | 20.1 | 22.5 | 17.5 | 21.6 | 18.6 | 21.1 | |||||||||
| College graduate | 22.0 | 39.3 | 12.4 | 41.4 | 12.0 | 40.0 | |||||||||
LASSO regression
P-values reflect trend tests across HEI quintiles obtained via regression for continuous variables and chi-squared test of difference for categorical variables, where * for P<0.05, ** for P<0.01, and *** for P<0.001.
standard deviation
body mass index.
Mean component density intakes are presented in Table 4 for women and Table 5 for men. Intake patterns were similar across both sexes and aligned with overall scores – e.g., Q5 (vs. Q1) intakes were better aligned to the DGAs (i.e., higher intake for adequacy and lower for moderation components) except for dairy and total protein foods, where intakes appeared similar (e.g., Q1 vs. Q5 differed by <0.1c. for dairy and <0.5 oz. for total protein foods). Mean Q1 and Q5 intakes attained or approached maximum component score intake thresholds for total vegetables (despite descriptively higher Q5 intake, 1.94 to 2.42 vs. 1.01 to 1.57 c./1000 kcals) and total protein foods, and for Q5 only in greens and beans, total fruit, whole fruit (women only), and seafood and plant proteins (modified scores only). On the other hand, mean intakes for Q1 and Q5 were consistently aligned to low scores (i.e., low adherence to DGAs) for whole grains, dairy, fatty acids, and all moderation components.
Table 4 –
Mean component intakes across quintiles of high and low scores on three Healthy Eating Index-2015 (HEI-2015) diet quality indexes among n=5,594 women in the Third National Health and Nutrition Examination Survey
| HEI-2015 components | Units | Standard for maximum score | HEI-2015 | Key Facets HEI-2015 | LRa-weighted HEI-2015 | |||
|---|---|---|---|---|---|---|---|---|
| Q1b | Q5c | Q1 | Q5 | Q1 | Q5 | |||
| Total vegetables | cup equivalents/1000 kcal | ≥1.1 | 1.24 | 2.42 | 1.34 | 2.26 | 1.57 | 2.26 |
| Greens and beans | cup equivalents/1000 kcal | ≥0.2 | 0.07 | 0.38 | 0.00 | 0.41 | 0.10 | 0.35 |
| Total fruit | cup equivalents/1000 kcal | ≥0.8 | 0.23 | 1.63 | 0.13 | 1.54 | 0.05 | 1.68 |
| Whole fruit | cup equivalents/1000 kcal | ≥0.4 | 0.01 | 0.52 | 0.00 | 0.54 | 0.00 | 0.53 |
| Whole grains | oz equivalents/1000 kcal | ≥1.5 | 0.10 | 1.25 | 0.04 | 1.21 | 0.07 | 1.26 |
| Dairy | cup equivalents/1000 kcal | ≥1.3 | 0.70 | 0.79 | 0.71 | 0.74 | 0.71 | 0.75 |
| Total protein foods | oz equivalents/1000 kcal | ≥2.5 | 2.14 | 2.46 | 2.48 | 2.34 | 2.42 | 2.42 |
| Seafood and plant proteins | oz equivalents/1000 kcal | ≥0.8 | 0.11 | 0.71 | 0.02 | 0.90 | 0.03 | 0.92 |
| Fatty acids | MUFAs+PUFAs/SFAd | ≥2.5 | 1.50 | 2.31 | 1.68 | 2.10 | 1.50 | 2.29 |
| Sodium | g/1000 kcal | ≤1.1 | 1.83 | 1.48 | 1.63 | 1.63 | 1.68 | 1.60 |
| Refined grains | oz equivalents/1000 kcal | ≤1.8 | 3.72 | 1.92 | 3.20 | 2.27 | 3.30 | 2.16 |
| Saturated fats | % kcal | ≤8% | 13.36 | 8.67 | 12.17 | 9.71 | 13.46 | 8.77 |
| Added sugars | % kcal | ≤6.5% | 20.25 | 10.17 | 20.46 | 11.38 | 19.48 | 11.32 |
LASSO regression,
Quintile 1,
Quintile 5,
monounsaturated fatty acids + polyunsaturated fatty acids / saturated fatty acids
Table 5 –
Mean component intakes across quintiles of high and low scores on three Healthy Eating Index-2015 (HEI-2015) diet quality indexes among n=5,195 men in the Third National Health and Nutrition Examination Survey
| HEI-2015 components | Units | Standard for maximum score | HEI-2015 | Key Facets HEI-2015 | LRa-weighted HEI-2015 | |||
|---|---|---|---|---|---|---|---|---|
| Q1b | Q5c | Q1 | Q5 | Q1 | Q5 | |||
| Total vegetables | cup equivalents/1000 kcal | ≥1.1 | 1.19 | 2.01 | 1.19 | 1.94 | 1.01 | 2.01 |
| Greens and beans | cup equivalents/1000 kcal | ≥0.2 | 0.05 | 0.33 | 0.00 | 0.35 | 0.10 | 0.27 |
| Total fruit | cup equivalents/1000 kcal | ≥0.8 | 0.18 | 1.18 | 0.10 | 1.23 | 0.06 | 1.30 |
| Whole fruit | cup equivalents/1000 kcal | ≥0.4 | 0.01 | 0.35 | 0.00 | 0.38 | 0.00 | 0.35 |
| Whole grains | oz equivalents/1000 kcal | ≥1.5 | 0.09 | 1.12 | 0.02 | 1.13 | 0.07 | 1.06 |
| Dairy | cup equivalents/1000 kcal | ≥1.3 | 0.67 | 0.68 | 0.71 | 0.64 | 0.76 | 0.61 |
| Total protein foods | oz equivalents/1000 kcal | ≥2.5 | 2.36 | 2.54 | 2.58 | 2.49 | 2.18 | 2.72 |
| Seafood and plant proteins | oz equivalents/1000 kcal | ≥0.8 | 0.12 | 0.72 | 0.01 | 0.90 | 0.04 | 0.90 |
| Fatty acids | MUFAs+PUF As/SFAd | ≥2.5 | 1.52 | 2.32 | 1.69 | 2.13 | 1.51 | 2.30 |
| Sodium | g/1000 kcal | ≤1.1 | 1.85 | 1.41 | 1.58 | 1.61 | 1.63 | 1.57 |
| Refined grains | oz equivalents/1000 kcal | ≤1.8 | 3.65 | 1.93 | 3.02 | 2.33 | 3.65 | 2.12 |
| Saturated fats | % kcal | ≤8% | 13.12 | 9.11 | 12.18 | 9.98 | 12.98 | 9.27 |
| Added sugars | % kcal | ≤6.5% | 19.54 | 10.68 | 17.73 | 12.45 | 19.16 | 11.56 |
LASSO regression,
Quintile 1,
Quintile 5,
monounsaturated fatty acids + polyunsaturated fatty acids / saturated fatty acids
All-cause mortality
Associations between diet quality and all-cause mortality risk on all three scores are summarized in Figure 2. In adjusted models, participants with high (Q5, vs. Q1) modified-weight scores had 23% to 38% reduced all-cause mortality risk, though estimates were only significant for women (Key Facets p=0.02, LR-weighted p=0.001; for men, p=0.06 on both scores), while high scores on the HEI-2015 were not associated (p-value=0.1 for women and 0.3 for men). Adjusted linear trends in all-cause mortality risk across score quintiles were significant for the Key Facets (test for trend p-value=0.002 for women, p-value=0.03 for men) and LR-weighted (test for trend p-value=0.003 for women, p-value=0.01 for men) scores but not for HEI-2015 scores (test for trend p-value=0.09 for women, p-value=0.3 for men).
Figure 2.

All-cause mortality hazard ratios for high vs. low scores on three Healthy Eating Index-2015 (HEI-2015) scores for women (left, n=5,594) and men (right, n=5,195) estimated from the Third National Health and Nutrition Examination Survey (n=10,789)
a LASSO regression. Asterisks reflect significant test-for-trend, i.e., * for P<0.05, ** for P<0.01, and *** for P<0.001. Survey-weighted, sex-stratified Cox proportional hazards models compared all-cause mortality risk estimates across quintiles of all three HEI scores. Estimates displayed are for the 5th quintile (high diet quality) and error bars represent 95% confidence intervals. Models are adjusted for race, education, smoking status, BMI, marital status, physical activity, hormone replacement therapy, age, energy intake and alcohol intake. The Key Facets HEI is additionally adjusted for summed moderation components.
In partially-adjusted models, high scores (i.e., Q5 vs. Q1) were consistently associated with significant 33% to 52% reductions in all-cause mortality risk and significant trends were detected across quintiles of each score for both sexes. Partially-adjusted and adjusted quintile HR estimates for all-cause mortality are presented in Table 6.
Table 6 –
Partially-adjusted and adjusted hazard ratios and 95% confidence intervals for all-cause mortality risk associated with high diet quality compared to low across three different Healthy Eating Index-2015 (HEI-2015) scores in the Third National Health and Nutrition Examination and Survey (n=10,789)
| Score | Sex | Quintile 1 | Quintile 2 | Quintile 3 | Quintile 4 | Quintile 5 | p-valuea | p-trendb | ||||
|---|---|---|---|---|---|---|---|---|---|---|---|---|
| Partially-adjustedc | ||||||||||||
| HEI-2015 | HRd | 95% CIe | HR | 95% CI | HR | 95% CI | HR | 95% CI | ||||
| Women | REFf | 0.81 | [0.61,1.07] | 0.87 | [0.65,1.17] | 0.73 | [0.56,0.96] | 0.66 | [0.50,0.87] | ** | ** | |
| Men | REF | 0.88 | [0.70,1.10] | 0.88 | [0.69,1.12] | 0.78 | [0.61,1.00] | 0.67 | [0.54,0.83] | *** | *** | |
| Key Facets HEI-2015 | ||||||||||||
| Women | REF | 0.81 | [0.60,1.09] | 0.72 | [0.49,1.05] | 0.62 | [0.47,0.80] | 0.54 | [0.40,0.74] | *** | *** | |
| Men | REF | 0.63 | [0.47,0.86] | 0.60 | [0.45,0.81] | 0.44 | [0.32,0.59] | 0.48 | [0.36,0.62] | *** | *** | |
| LRg-weighted HEI-2015 | ||||||||||||
| Women | REF | 0.64 | [0.49,0.85] | 0.72 | [0.50,1.01] | 0.54 | [0.41,0.73] | 0.49 | [0.37,0.65] | *** | *** | |
| Men | REF | 1.00 | [0.76,1.31] | 0.70 | [0.52,0.94] | 0.56 | [0.43,0.75] | 0.56 | [0.43,0.72] | *** | *** | |
| Adjustedh | ||||||||||||
| HEI-2015 | HR | 95% CI | HR | 95% CI | HR | 95% CI | HR | 95% CI | ||||
| Women | REF | 0.87 | [0.64,1.18] | 0.99 | [0.75,1.30] | 0.82 | [0.62,1.08] | 0.80 | [0.60,1.06] | |||
| Men | REF | 0.96 | [0.74,1.24] | 1.00 | [0.79,1.26] | 0.92 | [0.72,1.18] | 0.90 | [0.72,1.13] | |||
| Key Facets HEI-2015 | ||||||||||||
| Women | REF | 0.93 | [0.70,1.26] | 0.82 | [0.57,1.19] | 0.76 | [0.57,1.02] | 0.66 | [0.46,0.94] | * | ** | |
| Men | REF | 0.75 | [0.54,1.05] | 0.76 | [0.56,1.04] | 0.59 | [0.43,0.82] | 0.72 | [0.52,1.01] | * | ||
| LR-weighted HEI-2015 | ||||||||||||
| Women | REF | 0.70 | [0.55,0.90] | 0.81 | [0.57,1.16] | 0.65 | [0.49,0.88] | 0.62 | [0.46,0.82] | ** | ** | |
| Men | REF | 1.07 | [0.83,1.39] | 0.82 | [0.62,1.10] | 0.72 | [0.55,0.95] | 0.77 | [0.59,1.01] | * | ||
P-values compare high versus low (i.e., Quintile 5 vs. 1) HEI scores from survey-weighted Cox proportional hazards models where * for P<0.05, ** for P<0.01, and *** for P<0.001.
P-for-trends were obtained via linear trend test across continuous HEI scores by designating the quintile-specific median HEI score for all participants in survey-weighted Cox proportional hazards models where * for P<0.05, ** for P<0.01, and *** for P<0.001.
Partially-adjusted models include covariates for age and energy intake.
hazard ratio
confidence interval
reference group
LASSO regression
Fully-adjusted models are adjusted for race, smoking status, BMI, marital status, physical activity, hormone replacement therapy, continuous age, energy and alcohol intake. The Key Facets HEI is additionally adjusted for summed moderation components
In sensitivity analyses, when summed moderation components were removed from the adjusted Key Facets HEI model, Q5 estimates for women were HR= 0.64 [0.47, 0.89] (vs. 0.66 [0.46, 0.94] with the moderation components adjustment) and for men, HR= 0.71 [0.53, 0.95] (vs. 0.72 [0.52, 1.01] with the moderation components adjustment).
CVD mortality
Sex-stratified estimates for associations between high (i.e., Q5) vs. low scores on all three HEIs and CVD mortality risk are presented in Figure 3. In adjusted models for both sexes, high scores on all 3 HEIs and trends across quintiles were not significantly associated with CVD mortality risk (p>0.05). Partially-adjusted CVD mortality findings were similarly nonsignificant for women. For men, however, high scores (Q5 vs. Q1) were associated with reduced CVD mortality risk by an estimated 47% on the Key Facets (HR=0.53 [0.32, 0.87]), 42% on the LR-weighted (HR= 0.58 [0.38, 0.88]), and 35% on the HEI-2015 (HR=0.65 [0.45, 0.94]), though partially-adjusted trends across quintiles were only significant (p-value<0.05) for the modified scores and not the HEI-2015 (p>0.05). Table 7 contains sex-stratified quintile estimates of partially-adjusted and adjusted CVD HRs for all three HEI scores.
Figure 3.

Cardiovascular disease mortality hazard ratios for high vs. low scores on three Healthy Eating Index-2015 (HEI-2015) scores for women (left, n=5,594) and men (right, n=5,195) estimated from the Third National Health and Nutrition Examination Survey (n=10,789).
a LASSO regression. Survey-weighted, sex-stratified Cox proportional hazards models compared cardiovascular disease mortality risk estimates across quintiles of all three HEI scores. Estimates displayed are for the 5th quintile (high diet quality) and error bars represent 95% confidence intervals. Models are adjusted for race, education, smoking status, BMI, marital status, physical activity, hormone replacement therapy, age, energy intake and alcohol intake. The Key Facets HEI is additionally adjusted for summed moderation components.
Table 7 –
Partially-adjusted and adjusted hazard ratios and 95% confidence intervals for cardiovascular disease mortality risk associated with high diet quality compared to low across three different Healthy Eating Index-2015 (HEI-2015) scores in the Third National Health and Nutrition Examination Survey (n=10,789)
| Score | Sex | Quintile 1 | Quintile 2 | Quintile 3 | Quintile 4 | Quintile 5 | p-valuea | p-trendb | ||||
|---|---|---|---|---|---|---|---|---|---|---|---|---|
| Partially-adjustedc | ||||||||||||
| HEI-2015 | HRd | 95% CIe | HR | 95% CI | HR | 95% CI | HR | 95% CI | ||||
| Women | REFf | 0.65 | [0.39,1.10] | 1.00 | [0.59,1.72] | 0.93 | [0.54,1.60] | 0.68 | [0.44,1.04] | |||
| Men | REF | 0.53 | [0.30,0.92] | 0.63 | [0.38,1.03] | 0.55 | [0.32,0.97] | 0.65 | [0.45,0.94] | * | ||
| Key Facets HEI-2015 | ||||||||||||
| Women | REF | 1.15 | [0.51,2.56] | 0.78 | [0.37,1.67] | 0.82 | [0.45,1.50] | 0.74 | [0.35,1.55] | |||
| Men | REF | 0.60 | [0.35,1.04] | 0.76 | [0.44,1.29] | 0.45 | [0.28,0.71] | 0.53 | [0.32,0.87] | * | * | |
| LRg-weighted HEI-2015 | ||||||||||||
| Women | REF | 1.12 | [0.65,1.92] | 1.22 | [0.67,2.24] | 0.63 | [0.34,1.16] | 0.74 | [0.43,1.29] | |||
| Men | REF | 0.86 | [0.54,1.37] | 0.45 | [0.28,0.73; | ] 0.40 | [0.22,0.73] | 0.58 | [0.38,0.88] | * | * | |
| Adjustedh | ||||||||||||
| HEI-2015 | HR | 95% CI | HR | 95% CI | HR | 95% CI | HR | 95% CI | ||||
| Women | REF | 0.71 | [0.40,1.25] | 1.13 | [0.68,1.90] | 1.00 | [0.56,1.79] | 0.78 | [0.45,1.35] | |||
| Men | REF | 0.54 | [0.30,0.96] | 0.68 | [0.43,1.08] | 0.64 | [0.35,1.16] | 0.86 | [0.56,1.33] | |||
| Key Facets HEI-2015 | ||||||||||||
| Women | REF | 1.29 | [0.53,3.12] | 0.91 | [0.42,1.98] | 0.98 | [0.49,1.97] | 0.90 | [0.36,2.21] | |||
| Men | REF | 0.75 | [0.41,1.36] | 0.99 | [0.56,1.75] | 0.63 | [0.37,1.06] | 0.87 | [0.44,1.70] | |||
| LR-weighted HEI-2015 | ||||||||||||
| Women | REF | 1.22 | [0.71,2.09] | 1.39 | [0.74,2.64] | 0.75 | [0.40,1.41] | 0.89 | [0.48,1.64] | |||
| Men | REF | 0.89 | [0.57,1.39] | 0.51 | [0.32,0.82] | 0.50 | [0.27,0.95] | 0.79 | [0.49,1.27] | |||
P-values compare high versus low (i.e., Quintile 5 vs. 1) HEI scores from survey-weighted Cox proportional hazards models where * for P<0.05, ** for P<0.01, and *** for P<0.001.
P-for-trends were obtained via linear trend test across continuous HEI scores by designating the quintile-specific median HEI score for all participants in survey-weighted Cox proportional hazards models where * for P<0.05, ** for P<0.01, and *** for P<0.001.
Partially-adjusted models include covariates for age and energy intake.
hazard ratio
confidence interval
reference group
LASSO regression
Fully-adjusted models are adjusted for race, smoking status, BMI, marital status, physical activity, hormone replacement therapy, continuous age, energy and alcohol intake. The Key Facets HEI is additionally adjusted for summed moderation components.
In sensitivity analyses, after summed moderation components were removed from the adjusted models, Key Facets Q5 estimates were more strongly associated with CVD morality risk for women (HR=0.81 [0.36, 1.82] vs. 0.90 [0.36, 2.21] including moderation components) and men (HR=0.84 [0.46, 1.54] vs. 0.87 [0.44, 1.70] including moderation components).
Lastly, model fit in LASSO models used to derive weights for the LR-weighted HEI was examined. The unadjusted, unweighted LR-models had c-statistics of 0.5375 for women and 0.5578 for men, which indicates models performed slightly better than chance.35
DISCUSSION
The goal of this analysis was to evaluate whether two modified-weight HEI scores were differentially associated with all-cause and CVD mortality risk among a national sample of U.S. adults; and if so, to what magnitude relative to HEI-2015 scores. Both reweighted HEI scores were significantly associated with 23% to 38% reductions in all-cause mortality risk while the HEI-2015 was not significantly associated with all-cause mortality. Consistent with previous analyses examining dietary exposures in this sample, none of the HEI scores were associated with CVD mortality risk,27,28,49 potentially due to fewer events or inaccuracies in cause-of-death information.50,51 Comparatively, in DPMP analyses of three U.S. cohorts, the HEI-2010 and three other diet quality scores were associated with risk reductions of 17% to 26% for all-cause and 14% to 28% for CVD mortality.2 In this analysis, all-cause mortality estimates for modified-weight HEI scores were generally stronger than observed with standard weighting schemes in the DPMP as well as in meta-analyses,2,52,53 However, in present analyses, estimates for high (vs. low) modified-weight scores were only significant for women.
Present analyses suggest that Key Facets, compared to other components, may contribute more substantially to mortality associations. Increasing the value of Key Facet components from 35 to 100 points in a subset score approach, Key Facets HEI scores were associated with 28% to 34% all-cause mortality risk reductions despite eliminating more than half the HEI-2015 components and adjusting for summed moderation scores. Key Facets were also heavily upweighted in the LR-weighted HEI (i.e., to 63 points for women and 57 points for men) which was associated with 23% to 38% all-cause mortality risk reduction. Notably, moderation components were eliminated in the Key Facets HEI and largely downweighted on the LR-weighted HEI (i.e., from 40 points on the HEI-2015 to 18 for women and 27 points for men), suggesting that moderation components are not inconsequential but Key Facets are stronger predictors of mortality risk. Taken together, upweighting Key Facets while downweighting or eliminating moderation components may have contributed to the stronger all-cause mortality risk associations for modified-weight (vs. standard HEI-2015) scores.
The findings of this study were largely similar to prior analyses. A previous NHANES III study noted that high vs. low (>80 points, vs. <50) original HEI scores, calculated from a food frequency questionnaire, were significantly associated with all-cause mortality risk among men, but not women.49 The original HEI substantially differs from the HEI-2015 in that it includes total grains, meat, cholesterol, total fat, and variety and because it does not include energy density scoring.33 Moreover, significant findings were more probable in the previous analysis because more extreme, threshold-based score differences were compared with fewer participants in each category (e.g., 14% to 18% with low and 9% to 12% with high scores) while present analyses compared the top 20% and the bottom 20%. Nevertheless, differences between present findings and prior research warrant further discussion.
In this analysis, component weights were modified while maintaining all other aspects of HEI scoring (e.g., scoring standards, allocation of foods to components, etc.). Because intakes exceeding maximum adequacy or minimum moderation scoring standards are truncated in current diet quality indexes, intakes outside of scoring thresholds are lost and not reflected in total scores; this is a particular concern when intakes for a large portion of the sample are truncated.54 Component scores rather than unconstrained intake densities were used as LASSO model inputs, and as expected, these low variability components were downweighted or removed in the LR-weighted HEI while the higher variability Key Facet components were upweighted. Therefore, it is possible that the equal emphasis of low variability components in the HEI-2015 may dilute the importance of higher variability components (e.g., Key Facets) which may explain attenuated all-cause mortality associations observed on the HEI-2015.
Aside from component intake truncations, several other aspects of the underlying HEI methodology make it challenging to assess relative component importance and optimize weights. In the HEI-2015 scoring, several specific foods contribute to multiple adequacy components simultaneously (e.g., legumes), which contributes to marked collinearity in the underlying component scores and makes it difficult to isolate components. Alternatively, despite strong associations with CVD mortality risk,55,56 processed meat intake is simultaneously incentivized in total protein foods and penalized in saturated fat and sodium moderation components. Therefore, optimizing component weights may require closer examination of details such as scoring standards and food allocations.
Present analyses examined modified-weighting schemes within the HEI due to the rigorous validation process, use of energy-density scoring, and because it is regularly updated alongside the DGAs.5,8,57 While virtually all diet quality indexes feature generally equivalent weighting schemes,6 HEI component weights are assigned equally because “until data become available to suggest otherwise, it is a premise of the HEI that the DGA[s] are meant to be considered as a whole and that all concepts are equally important”.8 Characterizing the optimal and relative balance between components may be warranted, given the high level of agreement across the DPMP and various reviews and meta-analyses in terms of the dietary components associated with reduced mortality risk (e.g., high in fruit, vegetables, plant-based proteins, whole grains, fish, and unsaturated fats, low in red and processed meat, refined grains, and added sugars).2,5 Notably, while dietary patterns that align with the HEI and other traditional diet quality indexes are undoubtably health-promoting, present findings suggest that some components may be more important for mortality risk reduction relative to others, which is not reflected in current indexes. Though evidence is preliminary, because modified-weight HEI scores were associated with all-cause mortality while HEI-2015 scores were not, further exploration of a priori and data-driven approaches to diet quality weighting schemes is warranted. If differential (vs. standard) weighting schemes are similarly associated with mortality risk in other samples with more comprehensive measures of dietary intake, opportunities to provide more targeted guidance for some populations with higher overall mortality risk should be further considered.
Findings also support further integration of adaptive models, such as LASSO, into diet quality assessment methods. The present application of LASSO models obtained model-based relative component weights while retaining all other aspects of HEI scoring in a hybrid approach that incorporates a priori evidence and empirical associations. Importantly, LR models were used exclusively to derive component weights and not to estimate overall diet quality-mortality associations. Based on model fit estimates, opportunities to improve fit by integrating covariate adjustments, stratifications and/or by utilizing unconstrained intake densities (rather than component scores) as model inputs should be explored to see if the current model fit, which indicates models performed slightly better than chance, can be improved beyond the crude model fit obtained in the present analysis.
This analysis is not without limitations. Only a single 24-hour recall was routinely collected in NHANES III and because applying an adjustment for usual intake is not possible with only one recall,35 the variance of intake distributions may be overestimated. Inflated variance may be a particular concern for episodically-consumed (i.e., on a non-daily basis) foods, such as dark green vegetables and whole grains in the U.S. population,58,59 which may attenuate associations between the Key Facets HEI scores and mortality risk. Additional measurement error may be present in self-reported energy intake; in NHANES III, estimates suggest 28% of women and 18% of men underreported, with higher rates of underreporting among participants who were older and with higher BMIs.60 While underreported energy intake may inflate HEI scores, the cumulative effects of measurement error from self-reported energy and Key Facet intakes may result in overestimated variance in sample HEI scores,59,61 which may have attenuated mortality estimates. Lastly, because data-driven component weights were optimized for mortality risk associated with the diets of the particular people in this sample, the performance of the LR-weighted HEI likely varies across samples, particularly when differences in dietary patterns and/or diet assessment tools are present. Thus, further research is needed to determine whether findings are replicable in other samples.
This analysis also has several strengths. For comparability with DPMP analyses, methods were developed in alignment with the DPMP’s standardized methodology, which was rigorously developed so that parallel, cross-cohort estimates could be synthesized.2 Furthermore, this analysis was conducted in a large nationally representative sample suggesting results may be somewhat generalizable. Lastly, this analysis considered two different HEI weight modifications and their associations with mortality risk. Findings suggest that both a priori and model-based approaches may be viable approaches to component weighting for specified outcomes as compared to standard approaches that treat components as relatively equivalent, and that more consideration needs to be given to this critical yet frequently overlooked aspect of diet quality measurement.6,7
CONCLUSIONS
In conclusion, diet quality scores containing a subset of HEI-2015 components and model-based component weights resulted in stronger all-cause mortality risk associations compared to HEI-2015 scores. Findings suggest that some diet quality components may be more strongly associated with mortality risk than other components in the U.S. population and adapting existing diet quality indexes to accommodate more nuanced, differential, and relative component weights may strengthen mortality risk associations. Results indicate that further examination of modified and differential diet quality component weights may be warranted.
RESEARCH SNAPSHOT.
Research Question:
In a national sample, are Healthy Eating Index-2015 (HEI-2015) scores measured with standard versus modified component weights differentially associated with mortality risk? Modified-weight scores included a Key Facets score that equally weighted fruits, vegetables, whole grains, and seafood and plant proteins and a LASSO regression-weighted score with model-based weights.
Key Findings:
In adjusted models, the HEI-2015 and modified-weight HEI scores were differently associated with mortality risk. Both modified-weight HEI scores were associated with 23% to 38% reductions in all-cause mortality risk while the HEI-2015 was not. None of the scores were associated with cardiovascular disease mortality.
Acknowledgements:
This work was supported by the Foundation of the Academy of Nutrition and Dietetics (Jean Hankin Nutritional Epidemiology predoctoral grant), the Avenir Award Program for Research on Substance Abuse and HIV/AIDS (DP2) from National Institute on Drug Abuse of the National Institutes of Health (DP2DA046856), and the Foundation for Food and Agricultural Research New Innovator Award (534298).
Funding:
Dr. Haley Parker’s dissertation research was supported with the Jean Hankin Nutritional Epidemiology predoctoral grant from the Foundation of the Academy of Nutrition and Dietetics.
Dr. Ashley Buchanan was partially supported by grant DP2DA046856 by the Avenir Award Program for Research on Substance Abuse and HIV/AIDS (DP2) from National Institute on Drug Abuse of the National Institutes of Health. The content is solely the responsibility of the authors and does not necessarily represent the official views of the National Institutes of Health.
Dr. Maya Vadiveloo was partially supported by the Foundation for Food and Agricultural Research New Innovator Award (534298). The Foundation for Food and Agricultural Research had no role in the design, analysis or writing of this article.
Footnotes
Publisher's Disclaimer: This is a PDF file of an unedited manuscript that has been accepted for publication. As a service to our customers we are providing this early version of the manuscript. The manuscript will undergo copyediting, typesetting, and review of the resulting proof before it is published in its final form. Please note that during the production process errors may be discovered which could affect the content, and all legal disclaimers that apply to the journal pertain.
Conflicts of interest: The authors have no conflicts of interest to disclose.
Contributor Information
Haley W. Parker, University of Rhode Island, Department of Nutrition, 41 Lower College Road, Kingston, RI 02881.
Brietta M. Oaks, University of Rhode Island, Department of Nutrition, 41 Lower College Road, Kingston, RI 02881.
Ashley L. Buchanan, University of Rhode Island, Department of Pharmacy, Avedisian Hall, 7 Greenhouse Road, Kingston, RI 02881.
Maya K. Vadiveloo, University of Rhode Island, Department of Nutrition, 41 Lower College Road, Kingston, RI 02881.
REFERENCES
- 1.Tapsell LC, Neale EP, Satija A, Hu FB. Foods, Nutrients, and Dietary Patterns: Interconnections and Implications for Dietary Guidelines. Adv Nutr. 2016;7(3):445–454. [DOI] [PMC free article] [PubMed] [Google Scholar]
- 2.Liese AD, Krebs-Smith SM, Subar AF, George SM, Harmon BE, Neuhouser ML, Boushey CJ, Schap TE, Reedy J. The Dietary Patterns Methods Project: Synthesis of Findings across Cohorts and Relevance to Dietary Guidance. J Nutr. 2015;145(3):393–402. [DOI] [PMC free article] [PubMed] [Google Scholar]
- 3.Ocké MC. Evaluation of methodologies for assessing the overall diet: Dietary quality scores and dietary pattern analysis. Proc Nutr Soc. 2013;72(2):191–199. [DOI] [PubMed] [Google Scholar]
- 4.Reedy J, Krebs-Smith SM, Miller PE, Liese AD, Kahle LL, Park Y, Subar AF. Higher diet quality is associated with decreased risk of all-cause, cardiovascular disease, and cancer mortality among older adults. J Nutr. 2014;144(6):881–889. [DOI] [PMC free article] [PubMed] [Google Scholar]
- 5.English LK, Ard JD, Bailey RL, Bates M, Bazzano LA, Boushey CJ, Brown C, Butera G, Callahan EH, de Jesus J, Mattes RD, Mayer-Davis EJ, Novotny R, Obbagy JE, Rahavi EB, Sabate J, Snetselaar LG, Stoody EE, Van Horn LV, Venkatramanan S, Heymsfield SB. Evaluation of Dietary Patterns and All-Cause Mortality: A Systematic Review. JAMA Netw Open. 2021;4(8):e2122277–e2122277. [DOI] [PMC free article] [PubMed] [Google Scholar]
- 6.Waijers PMCM, Feskens EJM, Ocké MC. A critical review of predefined diet quality scores. Br J Nutr. 2007;97(02):219. [DOI] [PubMed] [Google Scholar]
- 7.Burggraf C, Teuber R, Brosig S, Meier T. Review of a priori dietary quality indices in relation to their construction criteria. Nutr Rev. 2018;76(10):747. [DOI] [PMC free article] [PubMed] [Google Scholar]
- 8.Krebs-Smith SM, Pannucci TE, Subar AF, Kirkpatrick SI, Lerman JL, Tooze JA, Wilson MM, Reedy J. Update of the Healthy Eating Index: HEI-2015. J Acad Nutr Diet. 2018;118(9):1591–1602. [DOI] [PMC free article] [PubMed] [Google Scholar]
- 9.U.S. Department of Health and Human Services and U.S. Department of Agriculture. 2015 – 2020 Dietary Guidelines for Americans. 8th Edition. December 2015. Accessed April 13, 2017. https://health.gov/our-work/food-nutrition/previous-dietary-guidelines/2015. [Google Scholar]
- 10.Aune D, Giovannucci E, Boffetta P, Fadnes LT, Keum N, Norat T, Greenwood DC, Riboli E, Vatten LJ, Tonstad S. Fruit and vegetable intake and the risk of cardiovascular disease, total cancer and all-cause mortality—a systematic review and dose-response meta-analysis of prospective studies. Int J Epidemiol. 2017;46(3):1029–1056. [DOI] [PMC free article] [PubMed] [Google Scholar]
- 11.Aune D, Keum N, Giovannucci E, Fadnes LT, Boffetta P, Greenwood DC, Tonstad S, Vatten LJ, Riboli E, Norat T. Whole grain consumption and risk of cardiovascular disease, cancer, and all cause and cause specific mortality: systematic review and dose-response meta-analysis of prospective studies. BMJ. 2016;353:i2716. [DOI] [PMC free article] [PubMed] [Google Scholar]
- 12.Naghshi S, Sadeghi O, Willett W, Esmaillzadeh A. Dietary intake of total, animal, and plant proteins and risk of all cause, cardiovascular, and cancer mortality: systematic review and dose-response meta-analysis of prospective cohort studies. BMJ. 2020;370. [DOI] [PMC free article] [PubMed] [Google Scholar]
- 13.Schwingshackl L, Schwedhelm C, Hoffmann G, Lampousi AM, Knüppel S, Iqbal K, Bechthold A, Schlesinger S, Boeing H. Food groups and risk of all-cause mortality: a systematic review and meta-analysis of prospective studies. Am J Clin Nutr. 2017;105(6):ajcn153148. [DOI] [PubMed] [Google Scholar]
- 14.Wang DD, Leung CW, Li Y, Ding EL, Chiuve SE, Hu FB, Willett WC. Trends in Dietary Quality Among Adults in the United States, 1999 Through 2010. JAMA Intern Med. 2014;174(10):1587–1595. [DOI] [PMC free article] [PubMed] [Google Scholar]
- 15.Kirk D, Catal C, Tekinerdogan B. Precision nutrition: A systematic literature review. Comput Biol Med. 2021;133:104365. [DOI] [PubMed] [Google Scholar]
- 16.U.S. National Center for Health Statistics. Plan and operation of the Third National Health and Nutrition Examination Survey, 1988–94. Series 1: programs and collection procedures. Vital Health Stat 1. 1994;(32):1–407. [PubMed] [Google Scholar]
- 17.U.S. National Center for Health Statistics, Centers for Disease Control and Prevention. Analytic and Reporting Guidelines: The Third National Health and Nutrition Examination Survey, NHANES III (1988–94). October 1996. Accessed August 30, 2023. https://wwwn.cdc.gov/nchs/data/nhanes/analyticguidelines/88-94-analytic-reporting-guidelines.pdf
- 18.Centers for Disease Control and Prevention. National Health and Nutrition Examination Survey III - Field Operations Manual. May 1991. Accessed January 18, 2022. https://www.cdc.gov/nchs/data/nhanes/nhanes3/cdrom/nchs/manuals/fieldop.pdf
- 19.Vadiveloo M, Dixon LB, Mijanovich T, Elbel B, Parekh N. Dietary Variety Is Inversely Associated with Body Adiposity among US Adults Using a Novel Food Diversity Index. J Nutr. 2015;145(3):555–563. [DOI] [PubMed] [Google Scholar]
- 20.Liese AD, Wambogo E, Lerman JL, Boushey CJ, Neuhouser ML, Wang S, Harmon BE, Tinker LF. Variations in Dietary Patterns Defined by the Healthy Eating Index 2015 and Associations with Mortality: Findings from the Dietary Patterns Methods Project. J Nutr. 2022;152(3):796–804. [DOI] [PMC free article] [PubMed] [Google Scholar]
- 21.George SM, Ballard-Barbash R, Manson JE, Reedy J, Shikany JM, Subar AF, Tinker LF, Vitolins M, Neuhouser ML. Comparing Indices of Diet Quality With Chronic Disease Mortality Risk in Postmenopausal Women in the Women’s Health Initiative Observational Study: Evidence to Inform National Dietary Guidance. Am J Epidemiol. 2014;180(6):616–625. [DOI] [PMC free article] [PubMed] [Google Scholar]
- 22.Stram DO, Hankin JH, Wilkens LR, Pike MC, Monroe KR, Park S, Henderson BE, Nomura AM, Earle ME, Nagamine FS, Kolonel LN. Calibration of the dietary questionnaire for a multiethnic cohort in Hawaii and Los Angeles. Am J Epidemiol. 2000;151(4):358–370. [DOI] [PMC free article] [PubMed] [Google Scholar]
- 23.Chen HJ, Wang Y, Cheskin LJ. Relationship between frequency of eating and cardiovascular disease mortality in U.S. adults: the NHANES III follow-up study. Ann Epidemiol. 2016;26(8):527–533. [DOI] [PMC free article] [PubMed] [Google Scholar]
- 24.Yang EJ, Kerver JM, Song WO, Chung HK, Kim WY. Carbohydrate Intake Is Associated with Diet Quality and Risk Factors for Cardiovascular Disease in U.S. Adults: NHANES III. J Am Coll Nutr. 2013;22(1):71–79. [DOI] [PubMed] [Google Scholar]
- 25.Kominiarek MA, Rajan P. Nutrition Recommendations in Pregnancy and Lactation. Med Clin North Am. 2016;100(6):1199. [DOI] [PMC free article] [PubMed] [Google Scholar]
- 26.Lee YQ, Loh J, Ang RSE, Chong MFF. Tracking of Maternal Diet from Pregnancy to Postpregnancy: A Systematic Review of Observational Studies. Curr Dev Nutr. 2020;4(8). [DOI] [PMC free article] [PubMed] [Google Scholar]
- 27.Kim H, Caulfield LE, Rebholz CM. Healthy Plant-Based Diets Are Associated with Lower Risk of All-Cause Mortality in US Adults. J Nutr. 2018;148(4):624–631. [DOI] [PMC free article] [PubMed] [Google Scholar]
- 28.Kim H, Hu E, Rebholz C. Ultra-processed food intake and mortality in the USA: results from the Third National Health and Nutrition Examination Survey (NHANES III, 1988–1994). Public Health Nutr. 2019;22(10):1777–1785. [DOI] [PMC free article] [PubMed] [Google Scholar]
- 29.Newson JT, Huguet N, Ramage-Morin PL, McCarthy MJ, Bernier J, Kaplan MS, McFarland BH. Health behaviour changes after diagnosis of chronic illness among Canadians aged 50 or older. Health Rep. 2012;23(4):49. [PMC free article] [PubMed] [Google Scholar]
- 30.Xiang X Chronic Disease Diagnosis as a Teachable Moment for Health Behavior Changes Among Middle-Aged and Older Adults. J Aging Health. 2015;28(6):995–1015. [DOI] [PubMed] [Google Scholar]
- 31.National Cancer Institute, Division of Cancer Control & Population Sciences. Pyramid Servings Database (PSDB) for NHANES III. Accessed March 20, 2023. https://epi.grants.cancer.gov/pyramid/
- 32.U.S. National Center for Health Statistics, Centers for Disease Control and Prevention. NHANES III Healthy Eating Index Data File (Series 11, No. 6A) January 2020. Accessed March 20, 2023. https://wwwn.cdc.gov/nchs/data/nhanes3/6a/hei-acc.pdf
- 33.Kennedy ET, Ohls J, Carlson S, Fleming K. The Healthy Eating Index: design and applications. J Am Diet Assoc. 1995;95(10):1103–1108. [DOI] [PubMed] [Google Scholar]
- 34.Shams-White MM, Pannucci TE, Lerman JL, Herrick KA, Zimmer M, Mathieu KM, Stoody EE, Reedy J. Healthy Eating Index-2020: Review and Update Process to Reflect the Dietary Guidelines for Americans,2020–2025. J Acad Nutr Diet. 2023;123(9):1280–1288. [DOI] [PMC free article] [PubMed] [Google Scholar]
- 35.Luo H, Dodd KW, Arnold CD, Engle-Stone R. A New statistical method for estimating usual intakes of nearly-daily consumed foods and nutrients through use of only one 24-hour dietary recall. J Nutr. 2019;149(9):1667–1673. [DOI] [PMC free article] [PubMed] [Google Scholar]
- 36.Willett Walter. Nutritional Epidemiology. 3rd ed. Oxford University Press; 2012. [Google Scholar]
- 37.Dietary Guidelines Advisory Committee. Scientific Report of the 2020 Dietary Guidelines Advisory Committee: Advisory Report to the Secretary of Agriculture and the Secretary of Health and Human Services. July 2020. Accessed September 26, 2020. https://www.dietaryguidelines.gov/2020-advisory-committee-report
- 38.Wang DD, Li Y, Bhupathiraju SN, Rosner BA, Sun Q, Giovannucci EL, Rimm EB, Manson JE, Willett WC, Stampfer MJ, Hu FB. Fruit and Vegetable Intake and Mortality: Results From 2 Prospective Cohort Studies of US Men and Women and a Meta-Analysis of 26 Cohort Studies. Circulation. 2021;143(17):1642–1654. [DOI] [PMC free article] [PubMed] [Google Scholar]
- 39.Tibshirani R Regression Shrinkage and Selection Via the Lasso. J R Stat Soc Series B Stat Methodol. 1996;58(1):267–288. [Google Scholar]
- 40.R: A Language and Environment for Statistical Computing [computer program]. Version 3.6.3 Vienna, Austria: R Foundation for Statistical Computing; 2020. [Google Scholar]
- 41.National Center for Health Statistics. The Linkage of National Center for Health Statistics Survey Data to the National Death Index – 2015 Linked Mortality File (LMF): Methodology Overview and Analytic Considerations. March 2019. Accessed June 7, 2020. https://www.cdc.gov/nchs/data-linkage/mortality-methods.htm
- 42.Centers for Disease Control and Prevention. National Health and Nutrition Examination Survey III Interviewer’s Manual. June 1993. Accessed January 19, 2022. https://wwwn.cdc.gov/nchs/data/nhanes3/manuals/fieldint.pdf
- 43.Centers for Disease Control and Prevention. Documentation, Codebook, and Frequencies Prescription Medications Questionnaire NHANES III: 1988 to 1994. April 1998. Accessed August 30, 2023. https://wwwn.cdc.gov/nchs/data/nhanes3/2a/pupremed.pdf
- 44.SAS Institute Inc. SAS/STAT ® 14.3 User’s Guide, The SURVEYPHREG Procedure. September 2017. Accessed July 4, 2022. https://support.sas.com/documentation/onlinedoc/stat/143/surveyphreg.pdf
- 45.Korn EL, Graubard BI, Midthune D. Time-to-event analysis of longitudinal follow-up of a survey: Choice of the time-scale. Am J Epidemiol. 1997;145(1):72–80. [DOI] [PubMed] [Google Scholar]
- 46.Griffin BA, Anderson GL, Shih RA, Whitsel EA. Use of alternative time scales in Cox proportional hazard models: implications for time-varying environmental exposures. Stat Med. 2012;31(27):3320–3327. [DOI] [PMC free article] [PubMed] [Google Scholar]
- 47.Harrell FE, Lee KL, Mark DB. Multivariable prognostic models: issues in developing models, evaluating assumptions and adequacy, and measuring and reducing errors. Stat Med. 1996;15(4):361–387. [DOI] [PubMed] [Google Scholar]
- 48.SAS [computer program]. Version 9.4 Cary, NC, USA: SAS Institute Inc; 2016. [Google Scholar]
- 49.Kappeler R, Eichholzer M, Rohrmann S. Meat consumption and diet quality and mortality in NHANES III. Eur J Clin Nutr. 2013;67:598–606. [DOI] [PubMed] [Google Scholar]
- 50.Pagidipati NJ, Gaziano TA. Estimating deaths from cardiovascular disease: a review of global methodologies of mortality measurement. Circulation. 2013;127(6):749–756. [DOI] [PMC free article] [PubMed] [Google Scholar]
- 51.Smith C, Scott S, Wagner B. The necessary role of the autopsy in cardiovascular epidemiology. Hum Pathol. 1998;29(12):1469–1479. [DOI] [PubMed] [Google Scholar]
- 52.Morze J, Danielewicz A, Hoffmann G, Schwingshackl L. Diet Quality as Assessed by the Healthy Eating Index, Alternate Healthy Eating Index, Dietary Approaches to Stop Hypertension Score, and Health Outcomes: A Second Update of a Systematic Review and Meta-Analysis of Cohort Studies. J Acad Nutr Diet. 2020;120(12):1998–2031.e15. [DOI] [PubMed] [Google Scholar]
- 53.Schwingshackl L, Hoffmann G. Diet quality as assessed by the Healthy Eating Index, the Alternate Healthy Eating Index, the Dietary Approaches to Stop Hypertension Score, and health outcomes: a systematic review and meta-analysis of cohort studies. J Acad Nutr Diet. 2015;115(5):780–800.e5. [DOI] [PubMed] [Google Scholar]
- 54.Ricart G, Atoloye AT, Durward CM, Guenther PM. New Exponential Scoring Functions for Diet Quality Indexes Solve Problems Caused by Truncation. J Nutr. 2022;152(4):1168–1173. [DOI] [PubMed] [Google Scholar]
- 55.Mozaffarian D. Dietary and Policy Priorities for Cardiovascular Disease, Diabetes, and Obesity: A Comprehensive Review. Circulation. 2016;133(2):187–225. [DOI] [PMC free article] [PubMed] [Google Scholar]
- 56.Kwok CS, Gulati M, Michos ED, Potts J, Wu P, Watson L, Loke YK, Mallen C, Mamas MA. Dietary components and risk of cardiovascular disease and all-cause mortality: a review of evidence from meta-analyses. Eur J Prev Cardiol. 2019;26(13):1415–1429. doi: 10.1177/2047487319843667 [DOI] [PubMed] [Google Scholar]
- 57.Reedy J, Lerman JL, Krebs-Smith SM, Kirkpatrick SI, Pannucci TE, Wilson MM, Subar AF, Kahle LL, Tooze JA. Evaluation of the Healthy Eating Index-2015. J Acad Nutr Diet. 2018;118(9):1622–1633. [DOI] [PMC free article] [PubMed] [Google Scholar]
- 58.Tooze JA, Midthune D, Dodd KW, Freedman LS, Krebs-Smith SM, Subar AF, Guenther PM, Carroll RJ, Kipnis V. A new method for estimating the usual intake of episodically-consumed foods with application to their distribution. J Am Diet Assoc. 2006;106(10):1575. [DOI] [PMC free article] [PubMed] [Google Scholar]
- 59.Dodd KW, Guenther PM, Freedman LS, Subar AF, Kipnis V, Midthune D, Tooze JA, Krebs-Smith SM. Statistical methods for estimating usual intake of nutrients and foods: a review of the theory. J Am Diet Assoc. 2006;106(10):1640–1650. [DOI] [PubMed] [Google Scholar]
- 60.Briefel RR, Sempos CT, McDowell MA, Chien S, Alaimo K. Dietary methods research in the third National Health and Nutrition Examination Survey: underreporting of energy intake. Am J Clin Nutr. 1997;65(4 Suppl):1203S–1209S. [DOI] [PubMed] [Google Scholar]
- 61.Freedman LS, Guenther PM, Krebs-Smith SM, Dodd KW, Midthune D. A Population’s Distribution of Healthy Eating Index-2005 Component Scores Can Be Estimated When More Than One 24-Hour Recall Is Available. J Nutr. 2010;140(8):1529. [DOI] [PMC free article] [PubMed] [Google Scholar]