

Abstract
Transcriptional profiling demonstrated markedly reduced type I interferon gene expression in untreated mycosis fungoides skin lesions compared to healthy skin. Type I interferon expression in MF correlated with APC-associated IRF5 before PUVA and epithelial ULBP2 after therapy, suggesting an enhancement of epithelial type I IFN. Immunostains confirmed reduced baseline type I interferon production in MF and increased levels post-PUVA in responding patients. Effective tumor clearance was associated with increased type I interferon expression, enhanced recruitment of CD8+ T cells into skin lesions and expression of genes associated with antigen specific T cell activation. Interferon kappa, a keratinocyte-derived inducer of type I interferons, was increased by PUVA and correlated with upregulation of other type I interferons. In vitro, deletion of keratinocyte interferon kappa decreased baseline and UVA-induced type I interferons and interferon response genes. In summary, we find a baseline deficit in type I interferon production in MF that is restored by PUVA and correlates with enhanced antitumor responses. This may explain why MF generally develops in sun-protected skin and suggests that drugs that increase epithelial type I interferons, including topical MEK and EGFR inhibitors, may be effective therapies for MF.
One sentence summary:
Lesional skin biopsies from patients with mycosis fungoides had reduced type I IFN gene expression; phototherapy-induced increases in type I IFNs were associated with enhanced CD8 T cell recruitment into tumors and clearance of the malignant T cell clone.
Introduction
Phototherapy, a safe and effective treatment for T cell mediated inflammatory skin diseases, is also effective in the treatment of the mycosis fungoides (MF) variant of cutaneous T cell lymphoma (Honig et al., 1994, Olsen et al., 2016, Pathak and Fitzpatrick, 1992). Psoralen plus UVA (PUVA) induces remissions in 72% of mycosis fungoides patients that can last up to 10 years with maintenance therapy (Querfeld et al., 2005, Weinstock and Gardstein, 1999, Willemze et al., 2005). PUVA is also an effective therapy for psoriasis, an IL-17 driven inflammatory skin disease (Parrish et al., 1974). It is not clear how PUVA improves both lymphoma and inflammatory skin diseases, given that cancer clearance requires enhanced T cell function and improvement of psoriasis requires suppression of T cell activity. We report here studies of MF skin lesions before and after phototherapy and in vitro studies of UV exposed keratinocytes that demonstrate a deficit in type I interferon production in MF that is improved by phototherapy and correlates with PUVA-induced tumor clearance.
Results
A deficit in type I interferon production in MF can be improved by PUVA phototherapy
Skin biopsies obtained from 17 patients with stage IA-IIB mycosis fungoides (MF) were studied by NanoString-based gene expression profiling and compared to 4 samples of healthy human skin. Gene expression of all six type I interferons (IFN) measured by the panel was significantly down regulated in MF skin lesions (Fig. 1a, FDR<0.1, fold change>4). Because NanoString expression profiling uses an optical method to directly measure gene expression counts in tissue and is not dependent on PCR amplification, accurate individual gene expression levels can be measured using this approach (Geiss et al., 2008). All six type I IFNs and the type III IFN IFNL2/IL-28A were markedly reduced in MF as compared to healthy skin (Fig. 1b, d). IFNG and the type III IFN IFNL1/IL-29 were not significantly different (Fig. 1c, d).
Figure 1. A deficit in baseline type I interferon production in untreated MF can be improved by PUVA phototherapy.
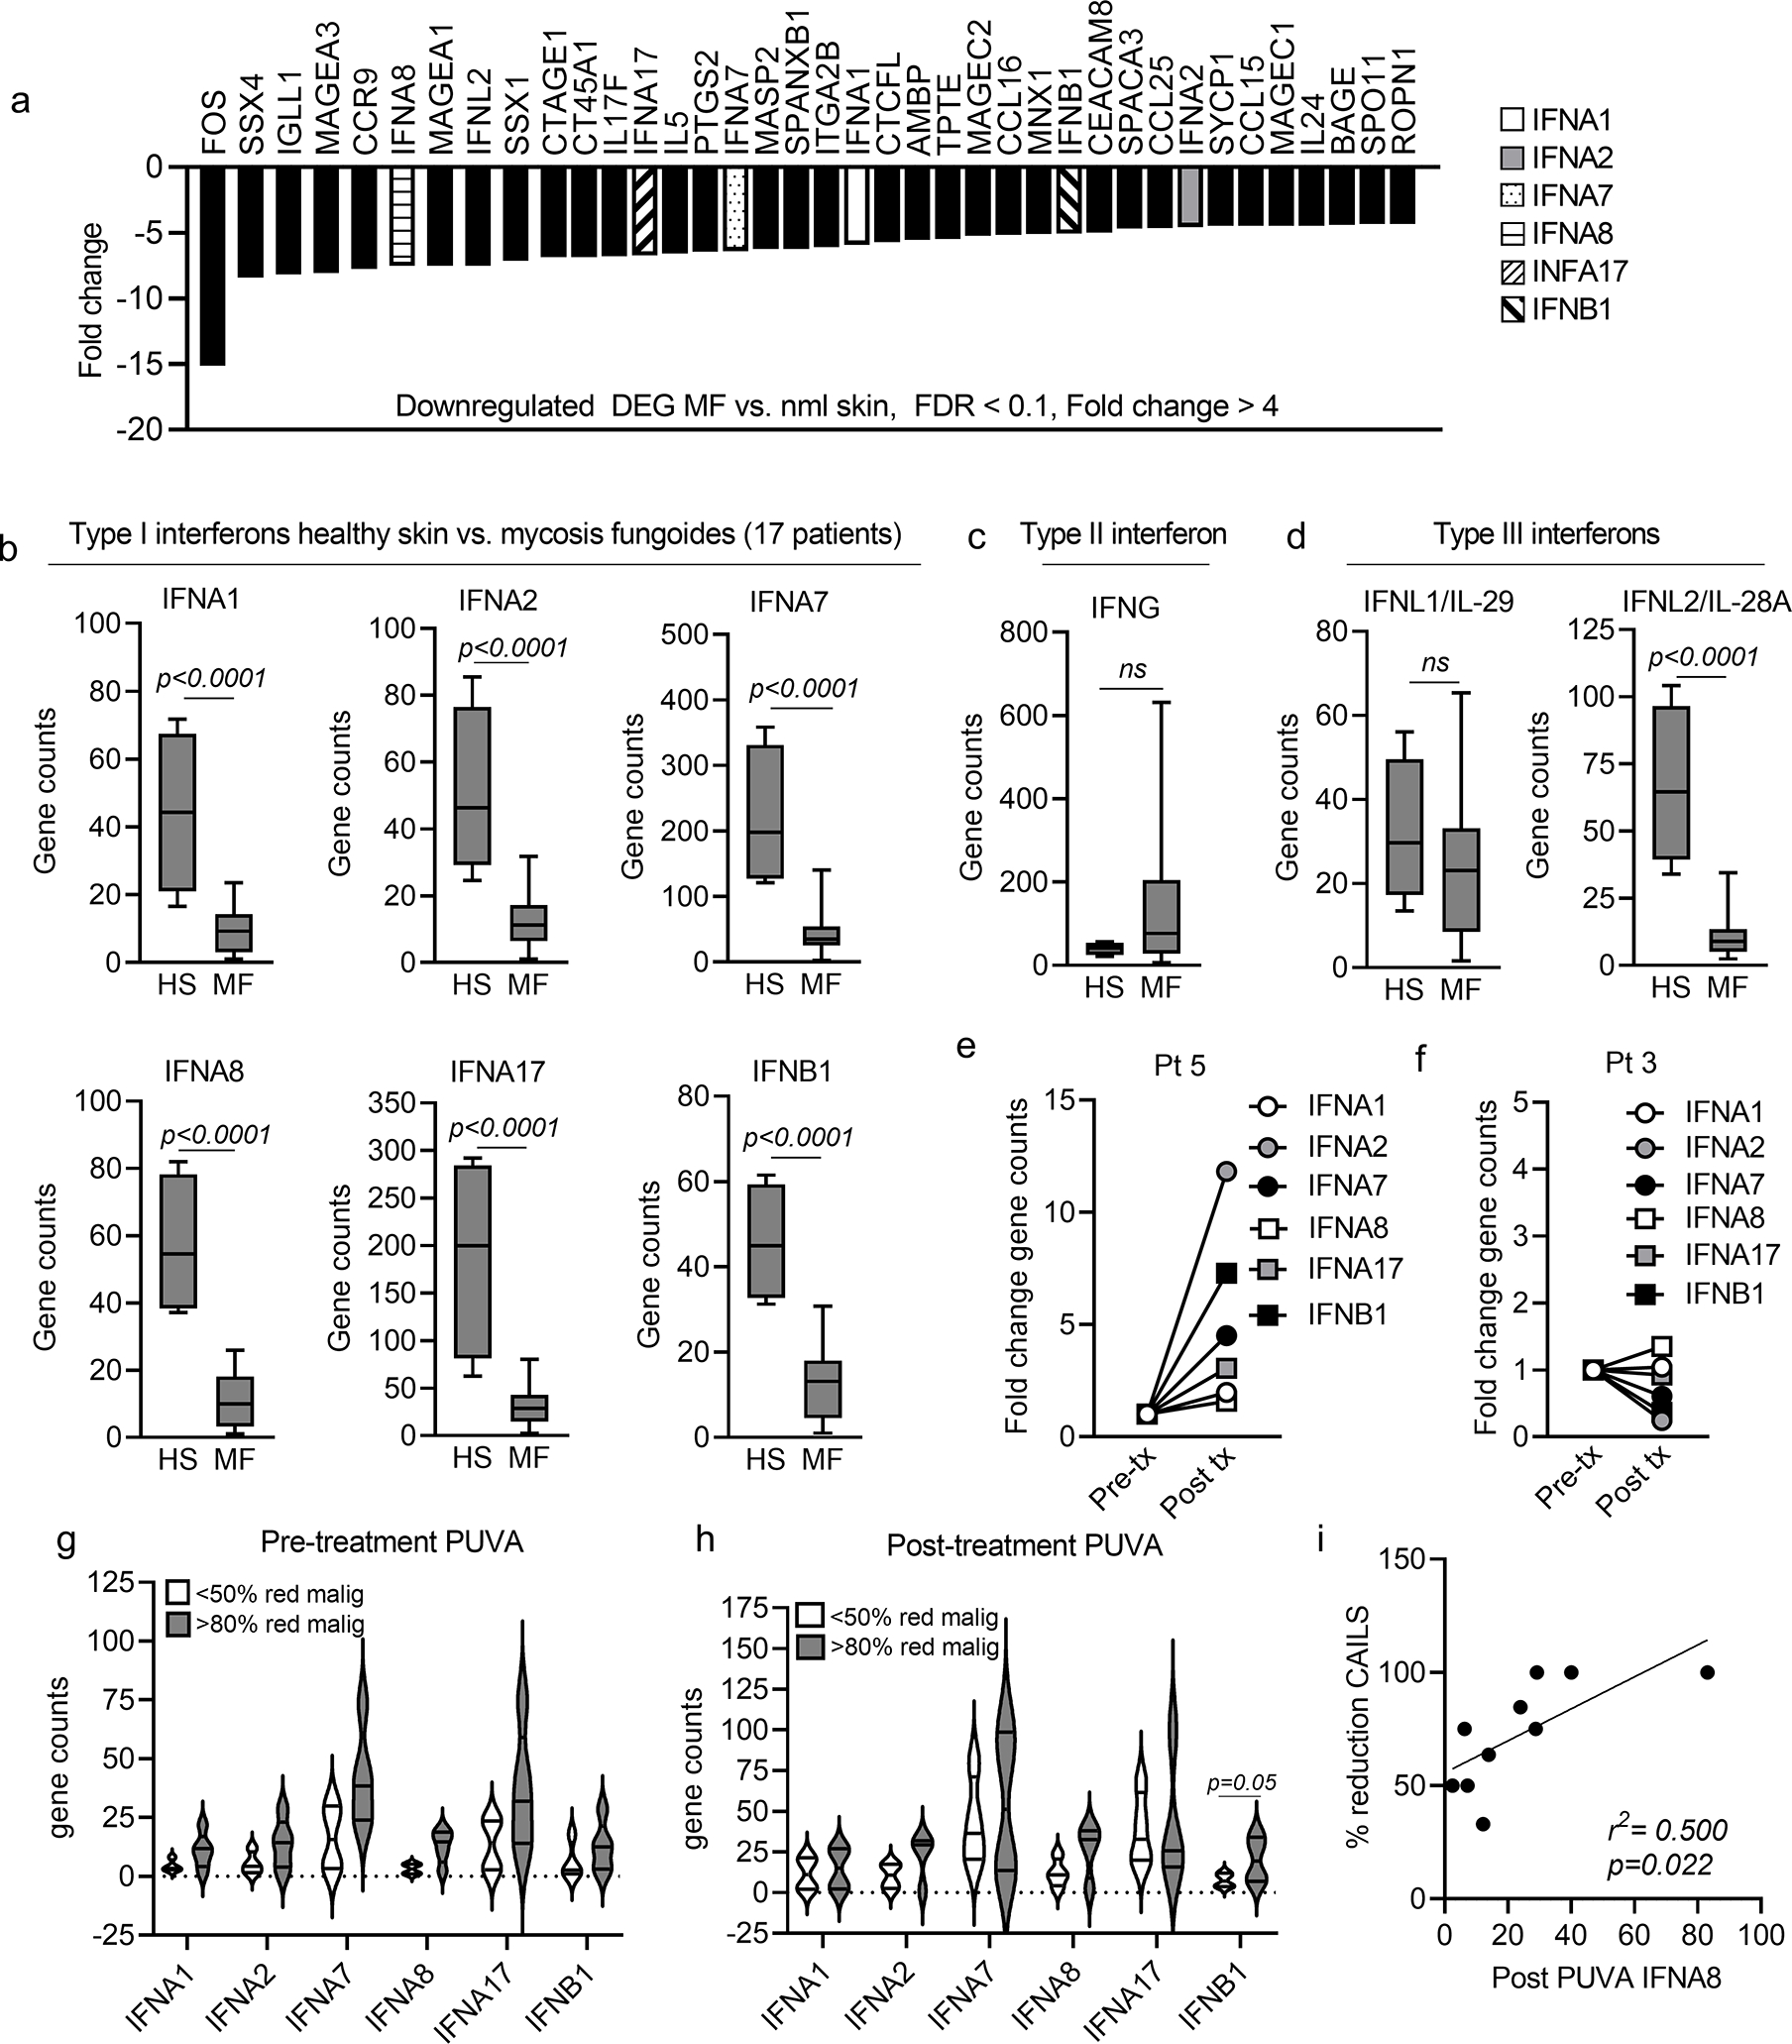
(a) Gene expression levels of type I IFNs are significantly reduced in MF lesional skin as compared to skin from healthy controls. Differentially expressed genes (DEG) in lesional skin biopsies from 17 patients with IA-IIB MF compared to 4 healthy human skin donors are shown. Expression of 6/6 type I IFN genes included in the NanoString panel were significantly decreased in MF compared to healthy skin (Fig. 1a, FDR<0.1, fold change>4). (b-d) Quantitative gene count comparisons confirmed highly significant downregulation all six type I IFNs (b) and the type III IFN IFNL2/IL-28A (d) in MF; IFNG (c) and IFNL1/IL-29 (d) were not significantly different. (e-h) Studies of type I IFN production before and after PUVA phototherapy demonstrated heterogeneous patient responses. Patient 5 (e) had upregulation of all six type I IFNs and 99% clearance of the malignant T cell clone whereas Patient 3 (g) showed no IFN increases and had a 0.03% increase in malignant T cells. The mean and SEM of gene counts before (panel h, Pre treatment) and after (panel i, Post treatment) PUVA therapy in patients who cleared <50% of malignant T cells (white) and >80% of malignant T cells (gray) are shown. (i) Type I IFN levels correlate with clinical clearance of disease. The expression of IFNA8 after PUVA significantly correlated with improved CAILS score of the index lesion. Significance was determined using two-tailed T-tests (b,c,d,g,h) and linear regression analyses (i).
We studied skin biopsies of stage IA-IIB mycosis fungoides (MF) before and after treatment with PUVA twice weekly for 12–24 weeks as part of a previously described clinical trial at the Medical University of Graz (Vieyra-Garcia et al., 2019b). Clinical severity of single index lesions was assessed using the Composite Assessment of Index Lesion Severity (CAILS) scoring system and across the entire body surface area using the Modified Severity-Weighted Assessment Tool (mSWAT) scoring system. Samples were studied by NanoString profiling and high throughput TCR sequencing (HTS) to directly measure malignant and benign T cell numbers (Kirsch et al., 2015). Changes in type I IFN production after PUVA varied among patients (Fig. 1e–h). Patient 5 had upregulation of all six type I IFNs and a 99% reduction in the number of malignant T cells in skin whereas Patient 3 showed no increases in type I IFNs and had a 0.03% increase in the number of malignant T cells after therapy (Fig. 1e,f). Patients tended to up regulate all or none of the type I IFN genes, suggesting they may be regulated as a group (Fig. 1e–h). Patients with a >80% clearance of malignant T cells tended to have increased baseline and post-PUVA levels of type I IFN gene expression compared to less responsive patients (<50% reduction), although this was only statistically significant for IFNB post-PUVA (Fig. 1g, h). Overall, the reduction in the clinical severity of the index lesion (CAILS) significantly correlated with expression of the type I IFN IFNA8 (Fig. 1i).
Epidermal type I IFN production is deficient in MF and can be increased by PUVA therapy
Given the low expression of type I IFNs in CTCL, we expected to see reduced expression of known inducers of type I IFN production. However, known inducers of type I IFN were either unchanged or increased in CTCL (IRF5, IRF8, IFIH1, Fig. 2a), suggesting a call for IFN production that goes unanswered. In untreated MF, type I IFN expression was tightly associated with IRF5, which in turn correlated with macrophage specific genes in CTCL but not healthy skin (Fig. 2b). In contrast, type I IFN production in healthy skin was tightly linked to expression of ULBP2, a keratinocyte derived, stress-induced NKG2D ligand known to be induced by UVB and type I IFN exposure (Fig. 2c, first panel) (Katlinskaya et al., 2015, Vantourout et al., 2014). ULBP2 can activate NKG2D-expressing T cells and NK cells and its expression is associated with better immunologic responses to cancer (Akiyama et al., 2016, Li et al., 2018). ULBP2 gene expression was significantly reduced in untreated MF compared to healthy skin (Fig. 2c, second panel). PUVA increased expression of the ULBP2 gene in all patients, with the exception of Patient 3 who did not upregulate type I IFNs and had increased malignant T cells after PUVA therapy (Fig. 2d left panel). After PUVA therapy, gene expression of all six type I IFNs significantly correlated with epithelial ULBP2 expression, a return to the pattern seen in heathy skin (Fig. 2d, right panel). In summary, healthy skin and post-PUVA IFN gene expression correlated with ULBP2, a marker of epithelial IFN production, whereas residual IFN gene expression was macrophage associated in untreated MF.
Figure 2. Type I IFN expression correlates with APC-associated IRF5 before PUVA phototherapy and with epithelial associated-ULBP2 after therapy, and malignant T cells are associated with IRF2, a negative regulator of epithelial IFN production.
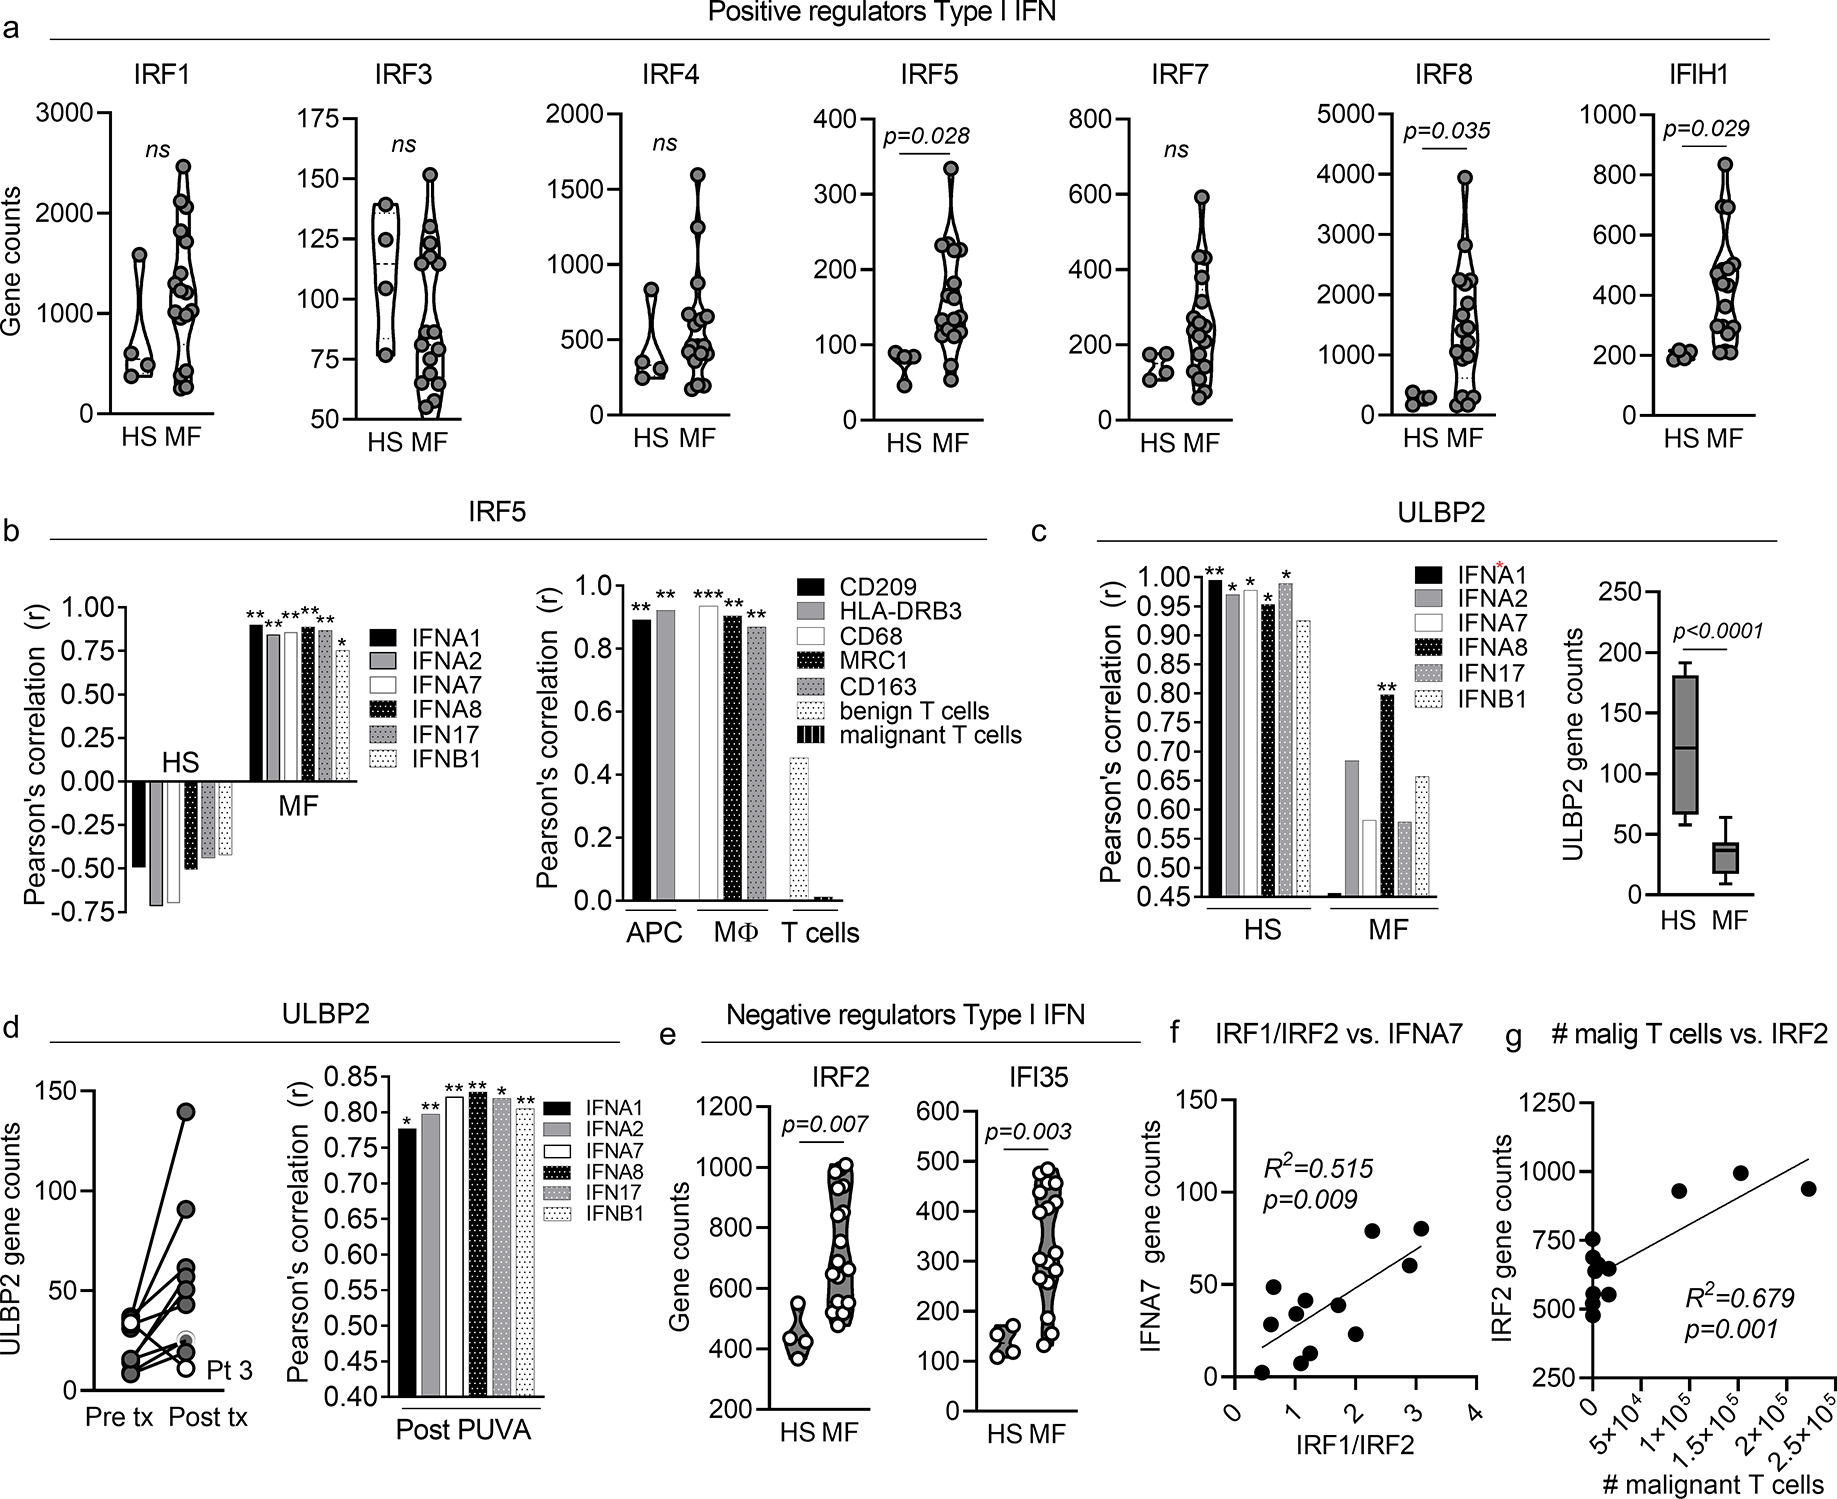
(a) Gene expression counts of positive regulators of type I IFN production are shown for lesional skin from 17 MF patients (MF) vs. skin from four healthy donors (HS). (b) In MF, type I IFN expression was tightly associated with IRF5, which correlated with antigen presenting cell (APC) and macrophage (MΦ) specific genes. (c) In healthy skin, type I IFN production was tightly linked to expression of ULBP2, a driver of keratinocyte type I IFN production (left panel). ULBP2 gene expression was reduced in MF compared to healthy skin (c, second panel). (d) PUVA increased the expression of ULBP2 in MF skin lesions in all patients except patient 3 (white circles, left panel). Total expression all six type I IFNs correlated strongly with ULBP2 expression after PUVA (right panel). (e) IRF2 and IFI35 were up regulated in MF compared to healthy skin (HS). (f) IRF1/IRF2 correlated with expression of IFNA7 in MF skin lesions. (g) IRF2 expression levels correlated with the number of malignant T cells in skin as measured by HTS. Significance was determined using two-tailed T-tests (a,c,e), Pearson correlations with two tailed p values (b,c,d,) and linear regression analyses (f,g). * p<0.05, ** p<0.01, *** p<0.0001
Multiplex immunostaining was then performed to localize type I IFN production in healthy skin donors and MF skin lesions (Fig. 3, a–e). Sun protected skin samples from the abdomen of healthy donors and MF skin lesions were immunostained with an antibody recognizing multiple type I IFN α isoforms. IFNα was detectable in the epidermal keratinocytes of sun protected healthy skin (Fig. 3a, top panel) but less detectable in CTCL skin lesions (Fig. 3a, lower panel). In healthy skin, a subset of intraepidermal cells, dermal cells, and the blood vessels of high endothelial venules expressed IFNα (Fig. 3 b–d). Co-staining demonstrated that intraepidermal IFNα+ cells lacked expression of keratin 14 (ker 14, red, top panel) but expressed MART-1 (red, second panel), confirming their identity as melanocytes (Fig. 3b). The endothelial cells of high endothelial venules (HEV), recognizable by their characteristic shape, were a source of IFNα (Fig. 3c). These findings are consistent with prior reports that healthy human melanocytes and endothelial cells express α and β type I IFNs (Lv et al., 2012, Satomi et al., 2002). A population of dermal hematopoietic cells, identified by their expression of CD45, also produced IFNα (Fig. 3d). PUVA therapy increased epidermal IFNα expression in patient 9, who had eradication of malignant T cells after therapy (Fig. 3e top panel; mSWAT 21→0) but did not improve IFNα expression in patient 13, who clinically improved but failed to clear malignant T cells by HTS (Fig. 3e, lower panel, mSWAT 5→0). These findings support a deficit of epidermal IFNα production in MF that can be reversed in a subset of MF patients by PUVA therapy.
Figure 3. Epithelial IFNα production is reduced in MF, can be enhanced by PUVA therapy and type I interferon levels correlate with recruitment of CD8 T cells into MF lesions.
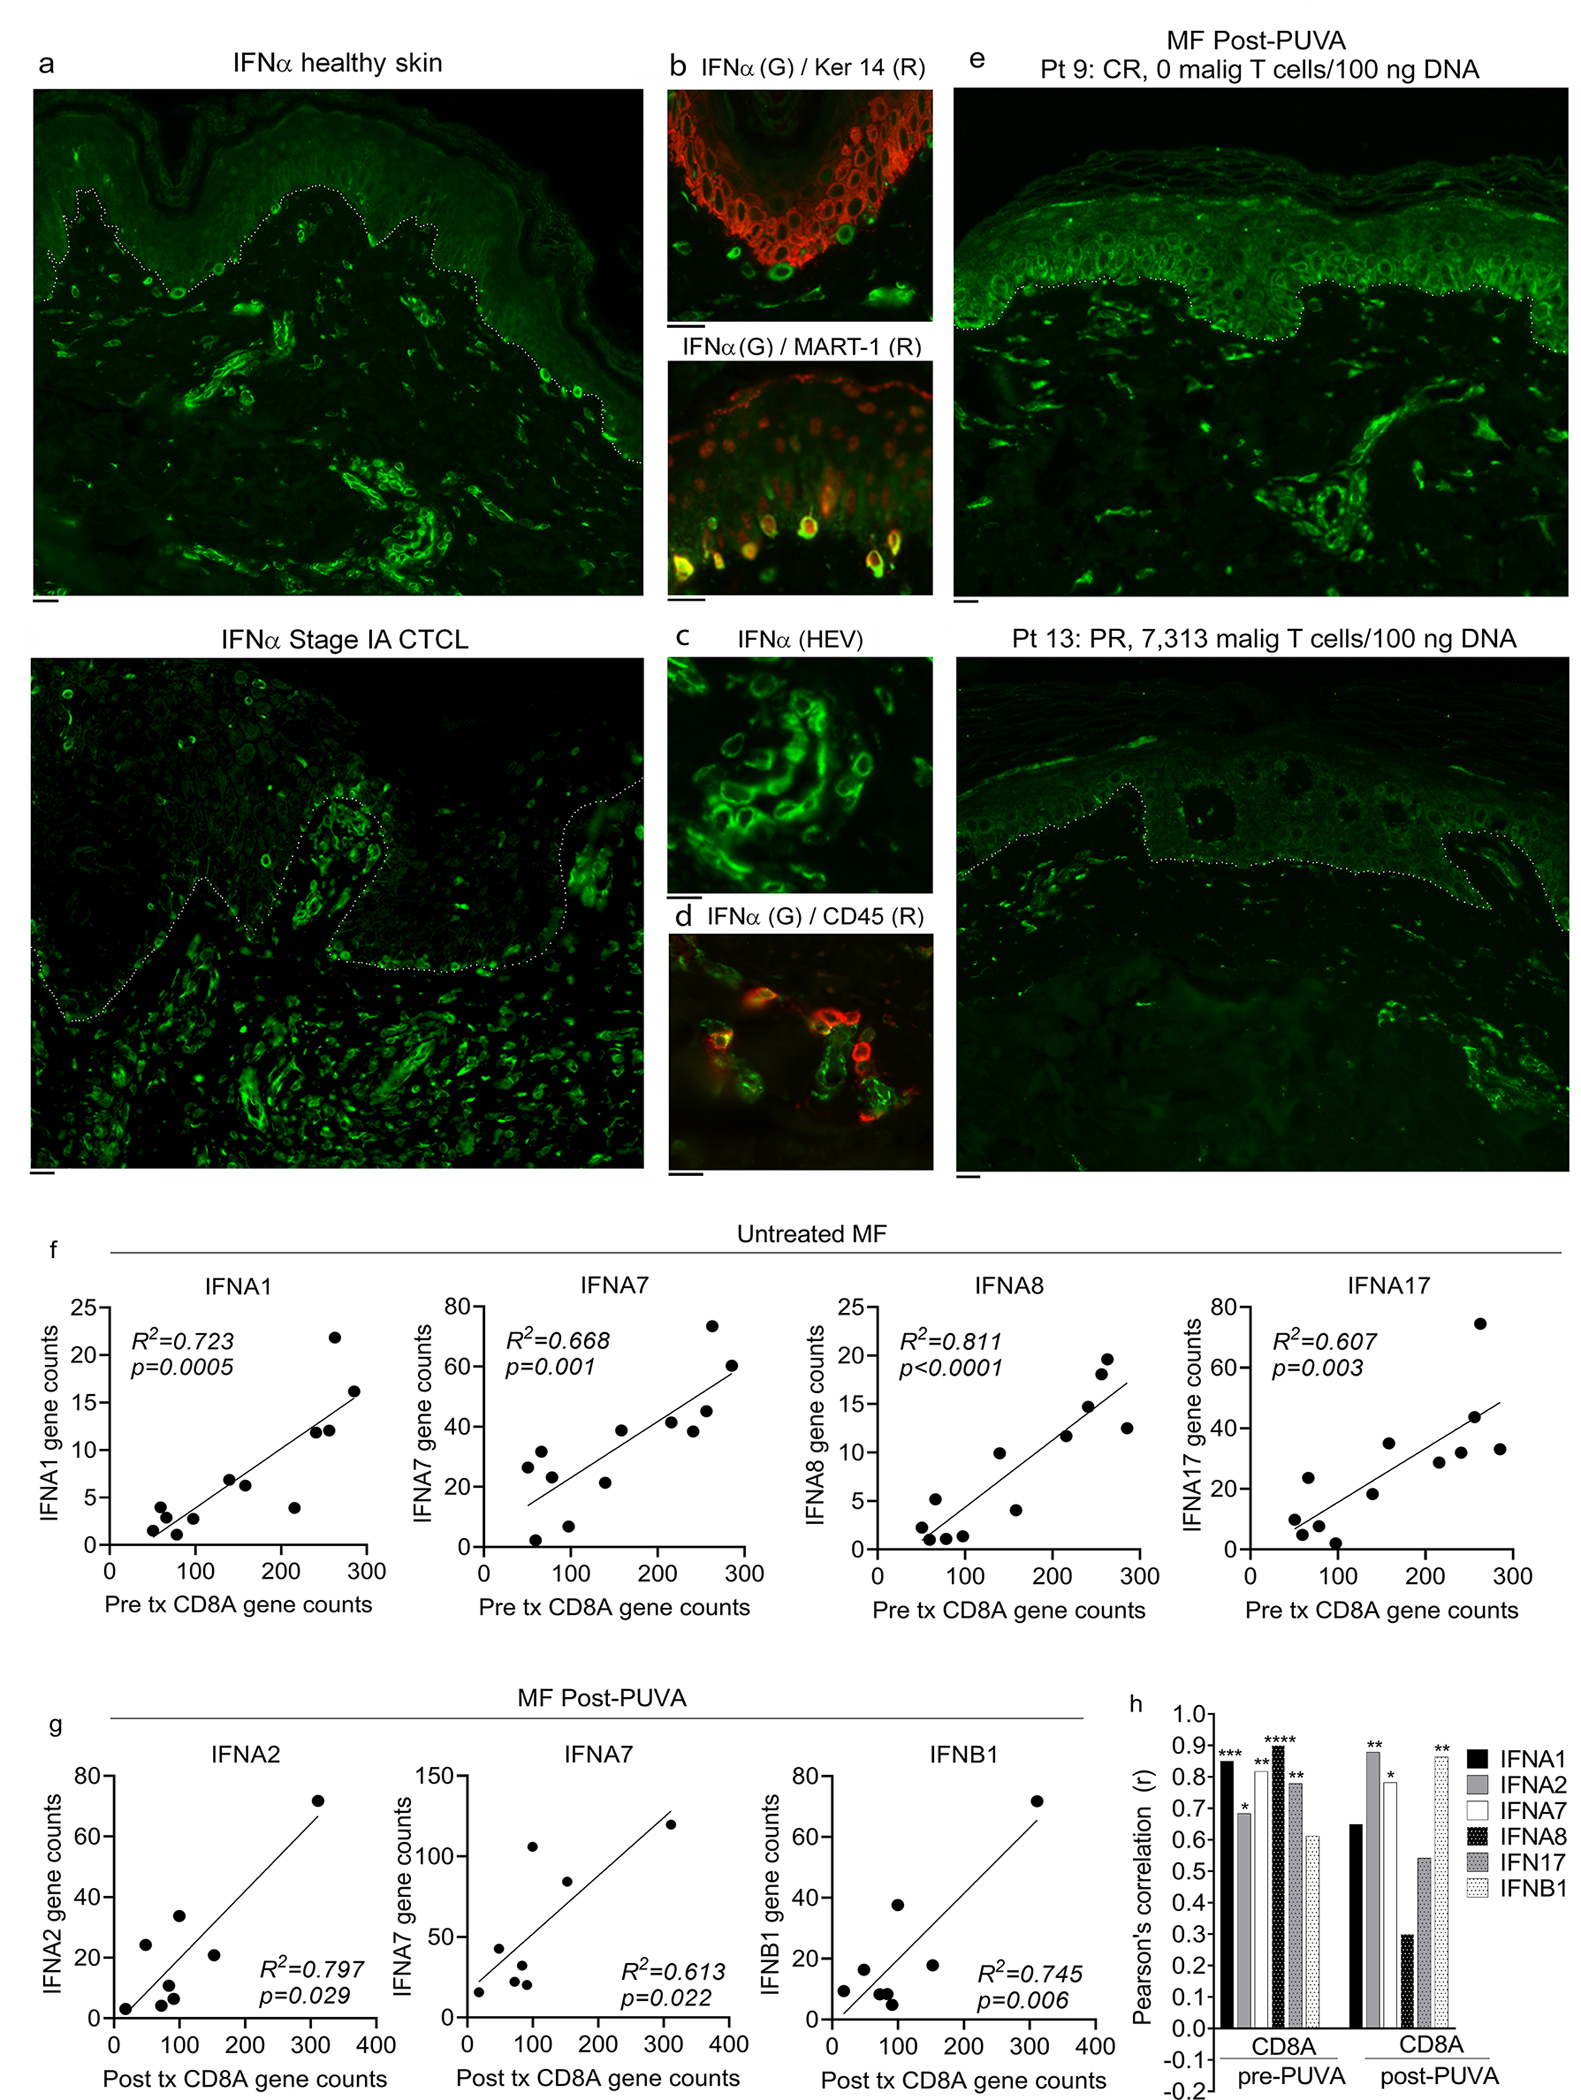
(a) Immunostaining of healthy donor abdominal skin (top) and MF (bottom) for IFNα. Single representative donors are shown; similar results were obtained in a total of four healthy and four MF patients. The basement membrane zone is indicated by a dotted line. (b-d) Melanocytes, high endothelial venules and hematopoietic cells produce IFNα in healthy skin. Immunostaining for keratin 14 (Ker 14) and MART-1 demonstrated that melanocytes produced IFNα (b). IFNα was also produced by high endothelial venules (HEV, c) and CD45+ hematopoietic cells (d). Representative results are shown, similar results were obtained in a total of four healthy skin donors. (e) PUVA therapy increased epidermal IFNα expression in patient 9, who had eradication of malignant T cells after therapy (e, top panel) but did not improve IFNα expression in patient 13, who failed to clear disease (e, lower panel). The basement membrane zone is indicated by a dotted line. Two additional PUVA treated MF patients showed similar results. (f-h) Type I interferon levels correlate with recruitment of CD8 T cells into MF skin lesions. (a,b) Correlation of type I IFN and CD8A gene expression levels are shown in lesional skin of untreated MF patients (f) and in MF lesional skin after PUVA therapy (g). (h) The Pearson’s correlation coefficients of all type I IFN genes with CD8A in untreated MF and after PUVA are shown. A two tailed p value was utilized for all analyses. Scale bars: 10μm. * p<0.05, ** p<0.01, *** p<0.0001
Malignant T cells are associated with IRF2, a negative regulator of epithelial IFN production
We measured the expression of negative regulators of type I IFN production to determine how malignant T cell presence may suppress type I IFN production. IRF2 and IFI35, suppressors of type I IFN expression and signaling respectively, were up regulated in untreated MF compared to healthy skin (Fig. 2e). IFI35 inhibits type I IFN signaling via its effects on RIG-I (Das et al., 2014). IRF2 antagonizes IRF1-induced type I IFN production by binding to and repressing type I IFN and IFN-inducible MHC class I genes as well as suppressing the transcription of IRF1 itself (Yanai et al., 2012). The ratio of IRF1/IRF2 regulates type I IFN gene transcription, and increased IRF2 can contribute to tumor progression (Antonczyk et al., 2019). IRF1/IRF2 gene expression levels correlated with expression of IFNA7 in CTCL skin lesions (Fig. 2f), suggesting that IRF2 may play an active role in suppressing expression of type I IFNs. Lastly, increased levels of IRF2 correlated with the number of malignant T cells in skin, raising the possibility that malignant T cells may suppress type I IFN gene expression by inducing IRF2 (Fig. 2g).
Type I IFN levels correlate with recruitment of CD8 T cells into MF skin lesions
In prior studies, we found that PUVA therapy was associated with a shift in benign infiltrating T cells from Th2 to Th1 and that eradication of malignant T cells was associated with the recruitment and expansion of CD8 T cells bearing antigen receptors not present before therapy (Vieyra-Garcia et al., 2019a). To determine if CD8 T cell infiltration was related to levels of type I IFNs, we measured gene expression of type I IFNs and CD8A, a proxy for CD8 T cell infiltration (Fig. 3f–h). CD8A gene counts were strongly correlated with five out of six type I IFNs before PUVA (Fig. 3f, h) and three type I IFNs post-PUVA (Fig. 3g, h).
Effective tumor clearance is associated with increased type I IFN expression, enhanced CD8+ T cell recruitment and evidence of antigen specific T cell activation
We utilized the differential patient responses in our cohort to identify the effects of PUVA phototherapy that correlated with disease clearance. Changes in type I IFN gene expression, recruitment of new benign T cell clones into the tumor, expression of genes associated with post-PUVA CD8 T cell presence, antigen specific T cell activation and the presence of malignant T cells pre-and post-PUVA were assessed using a combination of quantitative NanoString gene expression analyses and HTS in patients who had effective (Fig. 4a), intermediate (Fig. 4b) and poor tumor clearance (Fig. 4c). Upregulation of type I IFNs was evident in patients with effective tumor clearance and was associated with high levels of new T cell recruitment into tumors (Fig. 4 first, second rows). In our prior studies, we identified five genes strongly associated with CD8 T cells after PUVA therapy (KLRK1, GZMK, CD5, CD6, CYFIFP2) (Vieyra-Garcia et al., 2019a). Effective tumor clearance was associated with increased expression of these CD8 T cell associated genes after PUVA as well as increased expression of genes indicative of antigen specific T cell activation and TCR signaling (CD40L, ITK, LCK, Zap70).
Figure 4. Effective tumor clearance was associated with increased type I IFN expression, enhanced recruitment of CD8+ T cells into skin lesions and expression of genes associated with antigen specific T cell activation.
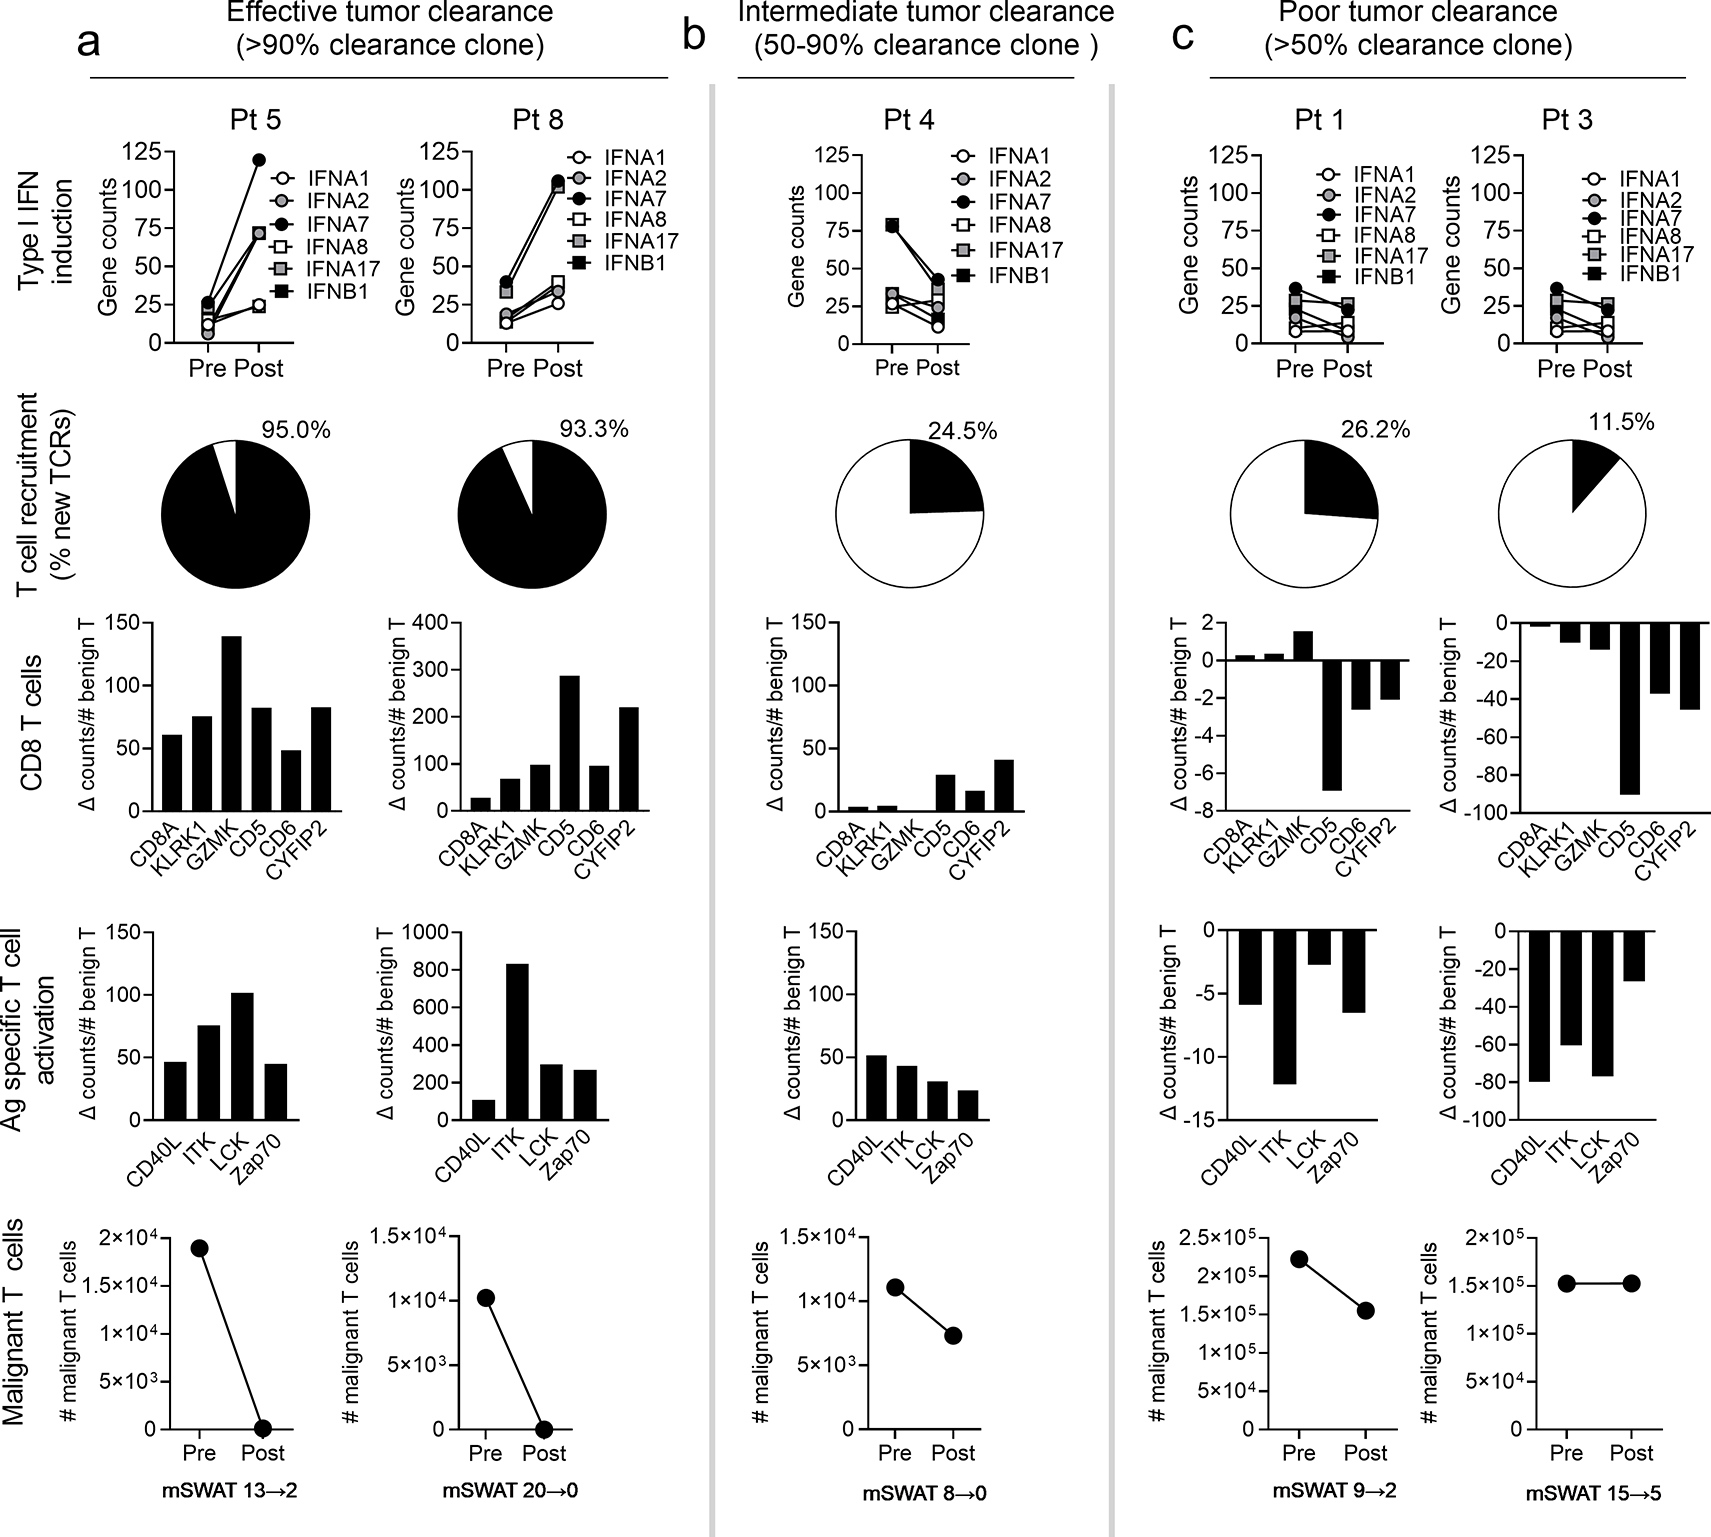
Data derived from patients with effective (a), intermediate (b) and poor (c) tumor clearance are shown. Gene expression levels of type I IFNs before (Pre) and after (Post) PUVA increased in high but not intermediate and poor responders (top row). The % of benign T cell clones newly recruited into skin after PUVA as assessed by HTS was greatest in patients with effective tumor clearance (second row). Change scores pre and post PUVA for genes associated with CD8 T cells (third row) and antigen specific activation (fourth row), normalized to the total number of benign T cells, were highest in patients with effective tumor clearance. Malignant T cell numbers in skin before (Pre) and after (Post) PUVA therapy and mSWAT clinical response scores are shown.
IFN kappa is reduced in MF compared to healthy skin, is upregulated by PUVA phototherapy and correlates with the production of α and β type I IFNs
Because our results suggested a defect in epidermal type I IFN production in MF, we investigated the early events after light exposure that might lead to increased epidermal type I IFN production. IFN kappa (IFNκ) is a type I IFN expressed predominantly by epidermal keratinocytes (LaFleur et al., 2001). UVB light exposure increases expression of IFNκ, leading to the upregulation of other type I IFNs (Stannard et al., 2017), a biological response that is implicated in the flaring of cutaneous lupus lesions after sun exposure (Sarkar Mrinal K. et al., 2018). It is not known if UVA exposure induces epithelial IFNκ. We investigated expression of the IFNκ gene IFNK following PUVA therapy in MF patients using quantitative real-time PCR (qRT-PCR). qRT-PCR was utilized because IFNK was not included in the NanoString profiling panel used to initially profile skin biopsies. The expression of IFNK was significantly lower in untreated MF skin lesions compared to healthy skin, paralleling reduced levels of IFNA1 and IFNB1 (Fig. 5a). Levels of IFNK, IFNA1 and IFNB1 tended to increase after PUVA phototherapy (Fig. 5b). Lastly, expression levels of both IFNA1 and IFNB1 were strongly correlated with expression of IFNK (Fig. 5c).
Figure 5. IFNκ is reduced in MF compared to healthy skin, is upregulated by PUVA phototherapy and correlates with the production of α and β type I IFNs.
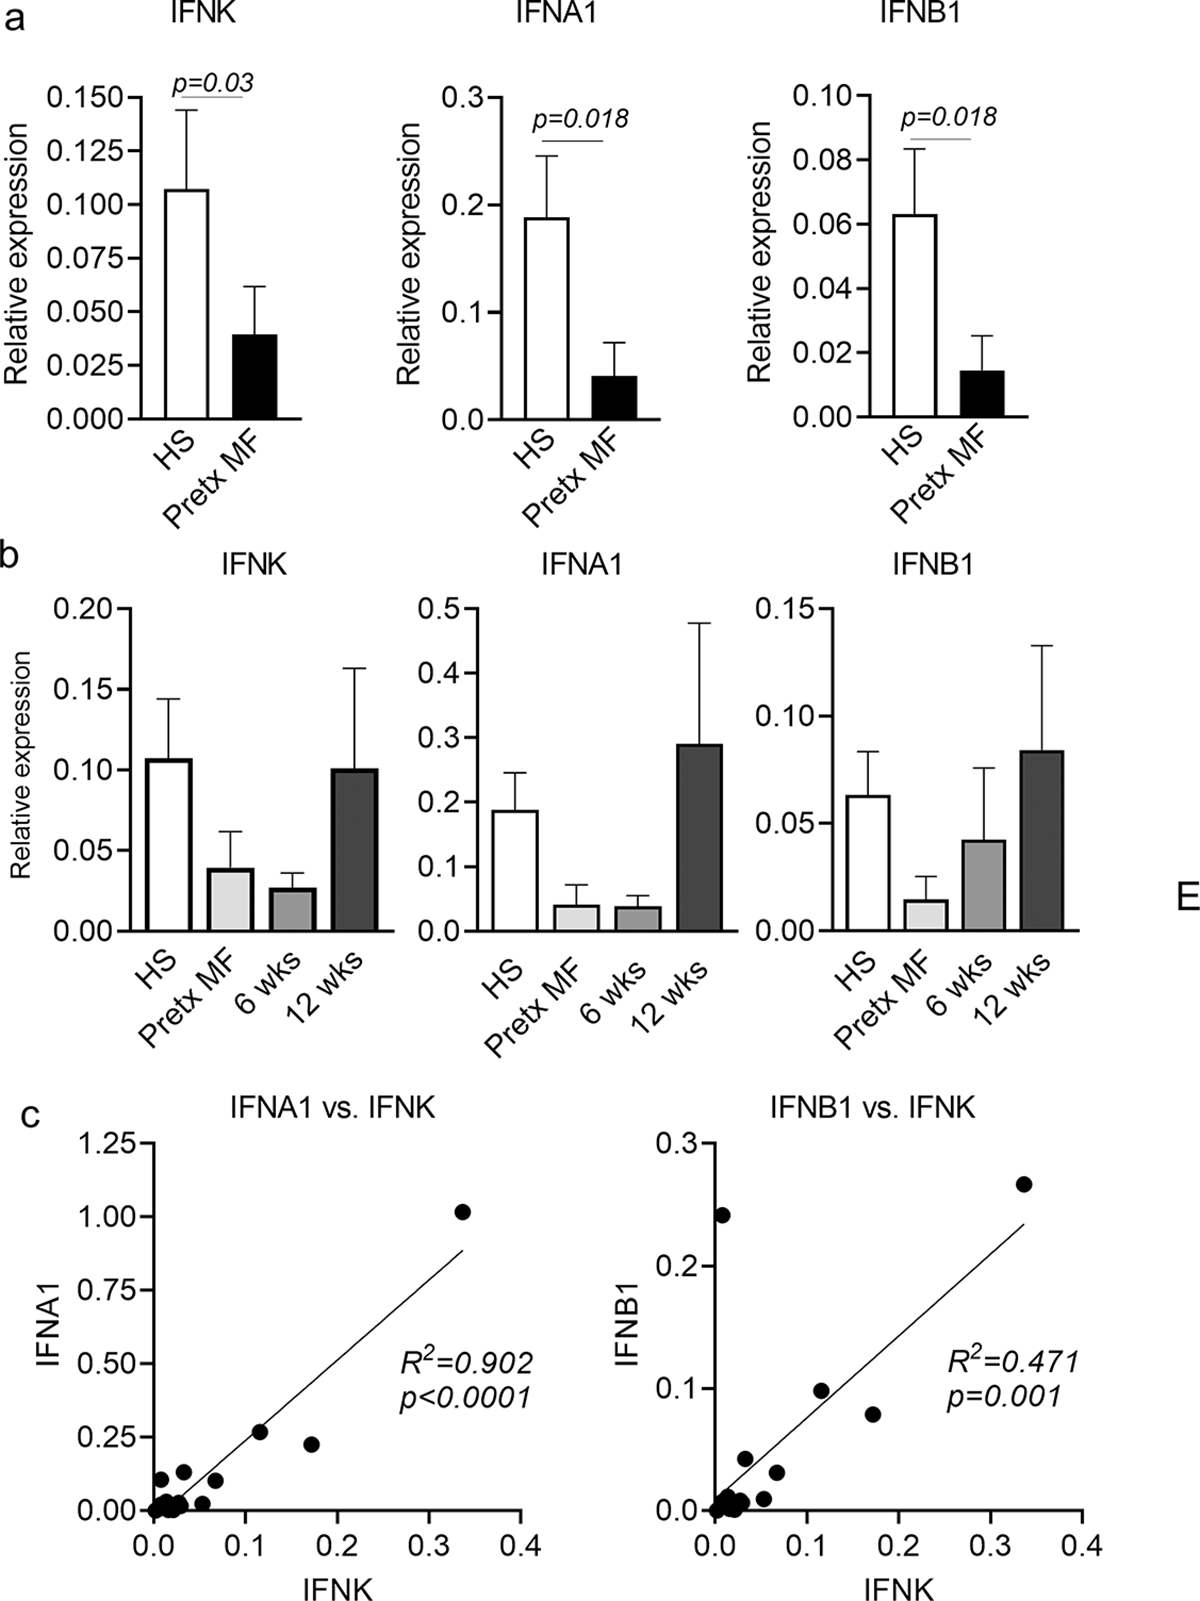
(a) Quantitative RT-PCR studies demonstrated that IFNK, IFNA1 and IFNB1 were expressed at lower levels in pretreatment MF lesions (Pretx MF) compared to healthy skin (HS). (b) The expression IFNK, IFNA1 and IFNB1 in MF skin lesions tended to increase to normal levels following PUVA. (c) The expression of IFNA1 and IFNB1 were both tightly correlated with expression of IFNK; MF values both before and after PUVA are included. Significance was determined using two-tailed T-tests (a,b) and linear regression analyses (c).
IFNκ enhances keratinocyte production of type I IFNs and downstream IFN genes in response to UVA
We hypothesized that PUVA phototherapy, which incorporates UVA light exposure, may act via IFNκ to enhance the epidermal production of other type I IFNs, thereby enhancing antitumor immunity. To determine if UVA exposure induces IFNκ production, we stimulated healthy human keratinocytes with UVA (4 J/cm2 of UVA light using a handheld light source at 365 nm) (Fig. 6a) or UVA plus 1 μM 8-methoxypsoralen (Fig. 6b), then analyzed IFNs and IRF1 expression by quantitative RT-PCR. IFNK and IRF1 were upregulated at 6 hours after light exposure (Fig. 6a, b, left two panels), preceding the upregulation of α and β type I IFNs (IFNA1 and IFNB1), which peaked at 24 hours after light exposure. (Fig. 6a, b, right panels) To determine if IFNκ was responsible for the light induced induction of other type I IFN, Tert-transduced immortalized keratinocytes with CRISPR-Cas9 deletion of the IFNK gene (Sarkar Mrinal K. et al., 2018) were exposed to UVA and analyzed by qRT-PCR. Expression of IFNA1 and IFNB1 were significantly decreased in IFNκ knockout keratinocytes compared to wild type controls (WT) after treatment with UVA alone (Fig. 6c) or UVA plus psoralen (Fig. 6d). The expression of IRF1 and IRF2, upstream regulators of epithelial type I IFN production, were significantly lower both before and after treatment in IFNκ knockout keratinocytes, but expression of IRF5, an APC associated IFN regulator, was unchanged (Fig. 6e, g). Levels of the downstream type I IFN response genes ISG15 and MX1 were both significantly lower in IFNκ knockout keratinocytes compared to WT controls after treatment with UVA alone (Fig. 6f) or UVA plus psoralen (Fig. 6h). Taken together, our results show that IFNκ is upregulated by UVA and PUVA exposure, its upregulation precedes the induction of other type I IFNs, and that IFNκ is necessary and sufficient for the induction of type I IFNs and IFN response gene expression in human keratinocytes treated with UVA and PUVA.
Figure 6. IFNκ is responsible for induction of epithelial type I IFNs and downstream IFN response genes after UVA phototherapy.
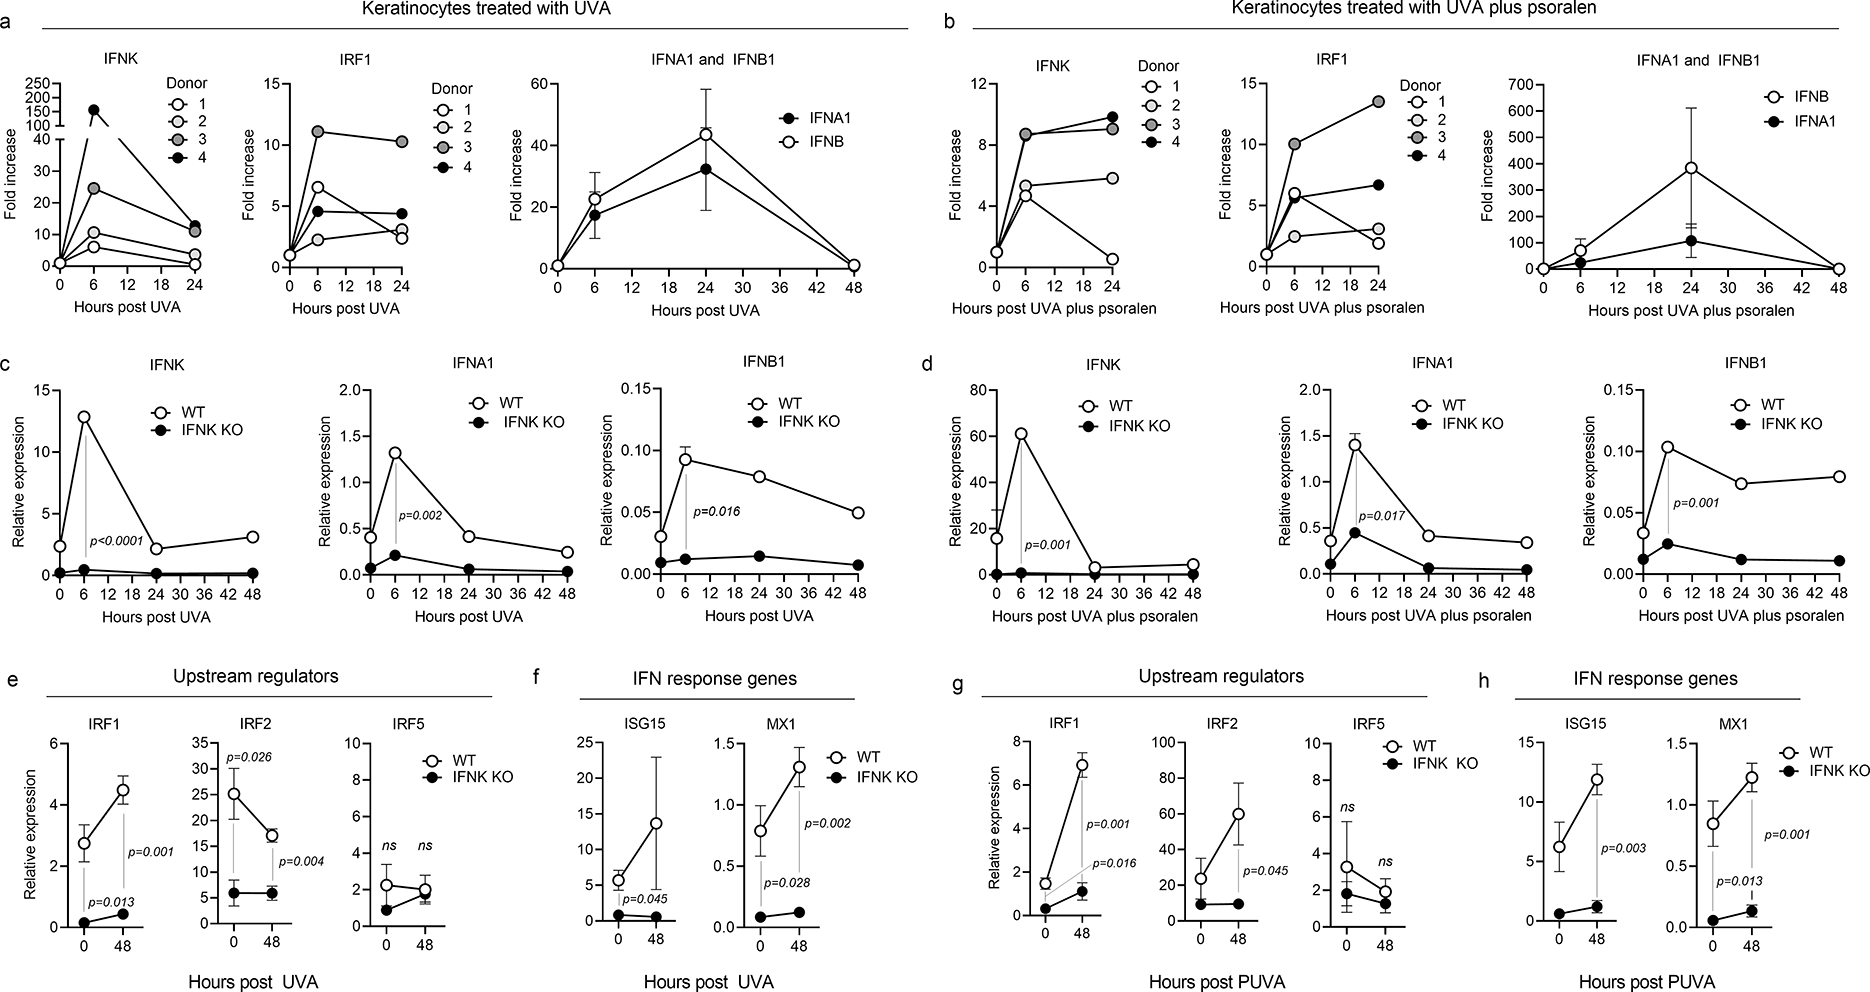
Healthy human cultured keratinocytes were stimulated in vitro with UVA (a) or UVA plus psoralen (b), then analyzed by quantitative RT-PCR for the expression of IFNs and IRF1. IFNK and IRF1 were upregulated at 6 hours after UVA exposure (left two panels), preceding the upregulation of α and β type I interferons (IFNA1 and IFNB1, right panels), which peaked at 24 hours after light exposure. (c,d) To determine if IFNκ was responsible for the light induced increase in other type I interferons, Tert-transduced immortalized keratinocytes with CRISPR-Cas9 deletion of IFNκ were exposed to UVA and studied by qRT-PCR for their expression of IFNs. Expression of IFNK, IFNA1 and IFNB1 were significantly decreased in IFNκ knockout keratinocytes compared to wild type controls (WT) after treatment with UVA alone (c) or UVA plus psoralen (d). (e,g) Expression of IRF1 and IRF2, two upstream regulators of epithelial type I IFN production, were significantly lower both before and after treatment in IFNκ knockout keratinocytes. Expression of IRF5, an APC-associated interferon regulator, was unchanged. Results after treatment with UVA alone (e) and UVA plus psoralen (g) are shown. (f,h) Levels of the downstream interferon response genes ISG15 and MX1 were both significantly lower in IFNκ knockout keratinocytes compared to WT controls after treatment with UVA alone (f) or UVA plus psoralen (h). Significance was determined using two-tailed T-tests.
Discussion
Patients with MF present clinically with inflammatory patches and plaques on the skin; MF skin lesions contain an admixture of malignant and benign infiltrating T cells that together create an inflammatory tumor microenvironment (Vieyra-Garcia et al., 2019a). Approximately 20% of patients develop advanced disease characterized variably by tumors, widespread skin disease and distant metastases (Agar et al., 2010). Despite the inflammatory clinical appearance of MF, type I IFN gene expression was markedly decreased in MF compared to noninflamed, healthy human skin. Gene expression and immunostaining studies suggested a selective deficit of epidermal type I IFN production in MF. Type I IFN gene expression correlated with ULPB2, a keratinocyte driver of type I IFN production, in healthy skin and in MF patients after treatment with PUVA, but with IRF5, a macrophage associated driver of type I IFN production, in untreated MF. Immunostaining for IFNα isoforms demonstrated that melanocytic, endothelial and hematopoietic IFNα production was demonstrable in MF but epidermal production was decreased. We found the malignant T cell number was tightly correlated with expression of IRF2, a factor that downregulates the production of epithelial type I IFNs (Yanai et al., 2012). One of the characteristics that identified in CTCL patients resistant to treatment with PUVA plus IFNα was elevated expression of IRF2 (Wozniak et al., 2009). Additional studies are needed to determine how malignant T cells induce IRF2 and to identify other mechanisms by which malignant T cells suppress type I IFN production. To our knowledge, this is the first report of a deficit in type I IFN production in CTCL. These findings add CTCL to a growing list of cancers known to inactivate type I IFN pathways to allow continued proliferation, resistance to apoptosis and to evade immune detection (Stojdl et al., 2000).
We found that type I IFN levels were correlated with expression of the CD8A gene, suggesting a linkage to CD8 T cell infiltration. By comparing heterogeneous patient responses to PUVA therapy, we found that malignant T cell clearance from skin was associated with increased type I IFN production, recruitment of new benign T cell clones into skin and enhanced expression of genes associated with CD8 T cell presence and antigen specific T cell activation. Our results are consistent with the ability of type I IFNs to induce epidermal production of the Th1 recruiting chemokines CXCR9 and CXCL10 and to recruit T cells into skin following radiation therapy (Lim et al., 2014). The association of increased type I IFNs with tumor clearance is consistent with the known ability of type I IFNs to promote the activation, proliferation, differentiation, survival and anti-cancer effector functions of CD8+ T cells (Boukhaled et al., 2021, Katlinski et al., 2017).
Phototherapy in its various forms can effectively treat MF and T cell mediated inflammatory diseases of the skin including psoriasis, vitiligo and graft vs. host disease (Honig et al., 1994, Olsen et al., 2016, Pathak and Fitzpatrick, 1992). Phototherapy increases IL-10 and inhibits IL-17 production, increases the number and suppressive activity of regulatory T cells and activates the cGAS-STING pathway, leading to type I IFN production (Buhl and Schön, 2016, Morita, 2018, Vieyra-garcia and Wolf, 2018). Other effects include isomerization of urocanic acid, induction of platelet-activating factor, and activation of the aryl hydrocarbon receptor, changes that are thought to lead to apoptosis and downstream immunomodulatory effects (Buhl and Schön, 2016, Morita, 2018, Vieyra-garcia and Wolf, 2018, Weatherhead et al., 2011).
Because we observed decreased epidermal production of type I IFNs in MF, we further investigated epidermal mechanisms of type I IFN production. IFNκ is a light-responsive keratinocyte-derived type I IFN that controls both basal and UVB-induced epithelial type I IFN production (LaFleur et al., 2001, Sarkar M. K. et al., 2018). UVB light induces IFNκ production, leading to enhanced production of other type I IFNs and induction of downstream IFN response genes (Sarkar M. K. et al., 2018). Keratinocyte production of IFNκ is a critical driver of the type I IFN overproduction, dendritic cell activation and photosensitive apoptosis observed in skin lesions of cutaneous lupus after sun exposure (Sarkar M. K. et al., 2018, Stannard et al., 2017).
We observed decreased IFNκ in untreated MF skin lesions that increased after PUVA therapy and was tightly linked to the induction of other type I IFNs. These findings are consistent with a defect in epithelial IFN production that can be improved by PUVA. UVB induces epithelial production of IFNκ but the ability of UVA to drive IFNκ production has not been studied. Using in vitro treated keratinocytes, we established that UVA, in the presence or absence of psoralen, induced keratinocyte IFNκ production that preceded the upregulation of other type I IFNs. Studies of IFNκ deficient keratinocytes demonstrated that IFNκ production was necessary for both basal and induced production of other type I IFNs and for downstream production of interferon response genes. We hypothesize that PUVA induced cGAS-STING pathway activation in the epidermis likely leads to early production of IFNκ by keratinocytes that in turn leads to enhanced production of other type I interferons and activation of downstream interferon response genes. Further studies are needed to evaluate the contributions keratinocyte derived IFNκ to phototherapy induced IFN production and downstream immunologic effects.
Our finding that PUVA phototherapy-induced increases in type I IFN production improve immune responses to CTCL is consistent with the clinical observation that systemic IFNα therapy is an effective therapy for a subset of patients with early stage CTCL (Olsen, 2003, Spaccarelli and Rook, 2015). The addition of systemic IFNα therapy to PUVA also improves the ability of phototherapy to clear disease (Chiarion-Sileni et al., 2002, Stadler et al., 1998). Enhanced type I IFN production is likely the mechanism of action for resiquimod, a topically applied TLR7/8 agonist, that induces the regression of both treated and distant untreated MF skin lesions (Rook et al., 2015). Lastly, our findings may help to explain the observation that CTCL tends to develop on non-sun exposed areas of skin (Kim et al., 2005). Local increases in type I IFNs in sun exposed skin may prevent disease formation at these sites.
Our findings suggest other therapies that enhance type I IFN production may be effective in the treatment of CTCL. Antibodies that block epidermal growth factor receptor (EGFR) signaling and inhibitors of mitogen activated protein kinase kinases (MEK 1 and 2) induce cutaneous toxicity by enhancing the production of epidermal IFNκ and other type I IFNs in skin (Lulli et al., 2016, 2017). Our results suggest that topical or systemic treatment with EGFR or MEK1/2 inhibitors may be effective therapies for CTCL. Whole exome sequencing studies demonstrated that mutations associated with UV exposure made up 52% of the total mutational burden in mycosis fungoides (Jones et al., 2021); these alternative therapies could potentially enhance type I IFN production without the mutagenic risks of additional UV exposure.
Materials & Methods
Study design and skin samples
This is an experimental laboratory study performed on human tissue samples. All studies were performed in accordance with the Declaration of Helsinki. Written, informed consent was obtained from all patients before study entry and sample collection. Patients who were studied met the World Health Organization-European Organization for Research and Treatment of Cancer (WHO-EORTC) criteria for MF (Willemze et al., 2005). Biopsy specimens were obtained from Stage IA-IIB mycosis fungoides patients before and after 12–24 weeks of PUVA therapy as previously described (Vieyra-Garcia et al., 2019b) or from patients seen at the Dana-Farber/Brigham and Women’s Cancer Center Cutaneous Lymphoma Program. Evaluation of index lesions was based upon improvement from baseline of the CAILS score (Composite Assessment of Index Lesion Severity) which evaluates changes from baseline of the treated target lesions for size, erythema, scaling and lesion elevation and on change from baseline of the mSWAT score (modified Severity-Weighted Assessment Tool) which evaluates the entire skin surface for percent involvement with a weighted score based upon whether a lesion is a patch, plaque or tumor. Skin from healthy individuals was obtained from healthy patients undergoing cosmetic surgery procedures. Immunostaining and gene expression studies were performed using in vitro assays without blinding or randomization. Study components were not predefined.
DNA isolation and HTS
DNA was isolated from formalin fixed, paraffin embedded or frozen, OCT embedded skin samples and studied by ImmunoSEQ™ (Adaptive Biotechnologies, Seattle, WA) from 100–400 ng of DNA template as previously described (Kirsch et al., 2015). The percent of T cells consisting of the malignant clone was determined by dividing the abundance of the malignant clone (number of reads) by the total number of T cell reads. The number of malignant T cells per sample was obtained by multiplying the malignant clone frequency (MCF) and the total number of productive templates. To normalize the samples based on total input DNA, we divided the number of T cells/100 ng input DNA.
RNA isolation and NanoString based gene expression analyses
RNA was isolated from healthy skin and CTCL skin samples using the RNeasy Mini Kit (Qiagen), as per manufacturer’s instructions. RNA concentration was measured using a NanoDrop 2000 (Thermo Scientific) Spectrophotometer. The expression of 770 immune response-related genes was measured using the NanoString Human PanCancer Immune Profiling Panel. Normalization and analysis of NanoString data were carried out using nSolver software. Normalization factors were calculated based on 40 reference genes.
Calculation of patient response indices
For the data shown in Fig. 4, “T cell recruitment” was calculated from HTS data as: (# new unique T cell sequences after treatment/total # unique sequences after treatment)*100. For “CD8 recruitment”, gene counts for CD8A and the top five genes most strongly associated with CD8A after PUVA therapy from our prior studies (KLRK1, GZMK, CD5, CD6, CYFIP2) (Vieyra-Garcia et al., 2019a) were normalized for the number of benign T cells by dividing gene counts by the # benign T cells per 100ng DNA (as measured by HTS)/1000. “Antigen specific T cell activation” scores were calculated by measuring gene counts for markers of antigen specific T cell activation (CD40L, ITK, LCK, Zap70) normalized for the number of benign T cells by dividing gene counts by the # benign T cells per 100ng DNA (as measured by HTS)/1000. Change in frequency of the malignant T cell clone was calculated from HTS data as the # malignant T cells (per 100 ng DNA)/total T cells (per 100 ng DNA) after treatment - # malignant T cells (per 100 ng DNA)/total T cells (per 100 ng DNA) before treatment. The number of malignant T cells post treatment was the # malignant T cells (per 100 ng DNA) after therapy.
Immunostaining
Healthy skin, untreated CTCL and post-PUVA CTCL samples were fixed in formalin, embedded in paraffin, sectioned, and stored at room temperature until use. For deparaffinization, slides were baked for 20 min at 58°C, cooled to room temperature, washed in xylene for 30 min, and rehydrated in 100%, 95%, 75% ethanol and deionized water. For antigen retrieval, slides were pressure cooked for 15 min at 110° C in citrate buffer, pH 6, except for IFNκ which took place in EDTA buffer, pH 9. Slides were cooled to room temperature, washed in PBS, blocked with protein block (Dako), then stained with primary antibodies diluted in protein block at 4° C overnight and secondary antibodies for 30 min, with two three-minute wash steps between antibodies. Slides were washed in TBS-tween and deionized water and mounted in Vectashield Hard Set Mounting Medium with DAPI (Vector Labs). Tissues were imaged immediately after mounting on a Mantra Quantitative Pathology Workstation using Mantra Snap 1.0 imaging software and analyzed with inForm image analysis software (PerkinElmer). Primary antibodies used include IFNκ (Abnova # H00056832-M01, 1:25), IFNα (Santa Cruz Biotechnology # sc-80996, 1:10), IFNβ1 (Biolegend # 514005, 1:50), MART1 (Novus Biologics # NBP2-15197, 1:400), and CD45 (Cell Signaling Technologies # 13917, 1:200). Secondary antibodies used include goat anti-mouse IgG1-AF488, IgG2a-AF594, and IgG2b-AF594 and goat anti-rabbit IgG-AF594 antibodies (Life Technologies, 1:1000).
Quantitative reverse transcription real-time polymerase chain reaction (qRT-PCR) measurement of IFNs from patient biopsies pre- and post-PUVA
Total RNA was isolated from frozen tissue using the AllPrep DNA/RNA Mini Kit (Qiagen) as per manufacturer’s instructions. Per sample, 5μg of RNA was reverse transcribed into cDNA using the High-Capacity cDNA Reverse Transcription Kit (ThermoFisher Scientific). Relative gene expression was determined using GoTaq qPCR Master Mix (Promega) on a CFX96 Touch Real-Time PCR Detection System (Bio-Rad). Samples were run in triplicate. Cycle thresholds (Ct) were determined and relative mRNA expression to YWHAZ (reference gene) was calculated using the ΔCt method. Primers used are included in Table S1.
Culture conditions for keratinocytes and keratinocytes cell lines:
Normal wild type keratinocytes were grown in keratinocyte serum-free media (ThermoFisher #17005-042) supplemented with human recombinant epidermal growth factor (rEGF), bovine pituitary extract (BPE), and 1% penicillin/streptomycin/glutamine. An immortalized NTERT keratinocyte cell line and an IFNκ knockout NTERT cell line (kindly supplied by Dr. Johann Gudjonsson, University of Michigan, Ann Arbor, MI) were grown in keratinocyte serum-free medium without calcium chloride (ThermoFisher #10725-018) supplemented with 0.4mM calcium chloride, human rEGF, BPE, and 1% penicillin/streptomycin.
Light treatment of keratinocytes
Keratinocytes and keratinocyte cell lines were grown to 80% confluence in 6-well plates and treated with 4 J/cm2 of ultraviolet-A light using a handheld light source at 365nm (Analytik Jena UVP UVGL-58) measured using a UVA/B light meter (Sper Scientific 850009). Cells were exposed to UVA while in PBS. For UVA with psoralen treatment, cells were incubated in 1 uM 8-methoxypsoralen (Sigma Aldrich) for 2 hours prior to UVA exposure. Sham irradiated controls were used in all experiments.
Quantitative reverse transcription real-time polymerase chain reaction (qRT-PCR) following keratinocyte UV exposure experiments
Total 1 μg RNA was reverse-transcribed using SuperScript™ VILO™ cDNA Synthesis Kit (ThermoFisher # 17005042) according to the manufacturer’s instructions. qRT-PCR was performed using the ABI StepONE Plus instrument and the Fast SYBR Green Master Mix (ThermoFisher # 4385612) according to the manufacturer’s instructions. Samples were run in triplicate. Cycle thresholds (Ct) were determined and relative mRNA expression to YWHAZ (reference gene) was calculated using the ΔCt method. Primers used are included in Supplemental Table I.
Statistical analyses
Primary methods of data analysis included descriptive statistics (means, medians and standard deviations). Differences between two sample groups were detected using the one tailed Wilcoxon–Mann–Whitney test, α=0.05. For comparisons of multiple groups, a Kruskal–Wallis one-way analysis of variance with a Bonferroni-Dunn’s post test for multiple means test was used, α =0.05. All reported p values are adjusted for multiple comparison testing. For mRNA expression and association studies, Pearson correlations were used to identify genes associated with malignant T cells (number of cells/100 ng DNA by HTS), or with CD7 or CD8A gene counts (as measured by NanoString). Only genes with r>0.8 and p<0.01 were considered significant.
Study approval
All studies were performed in accordance with the Declaration of Helsinki. Written consent was obtained from all patients before study entry and sample collection. All tissues were collected with previous approval from relevant review boards: Medical University of Graz Ethical Committee and the Dana-Farber Cancer Institute Institutional Review Board. Translational studies were approved by the Institutional Review Board of the Partners Human Research Committee.
Supplementary Material
Acknowledgments:
The authors would like to thank the patients who made this work possible, for entrusting us with their clinical care and for donating skin samples. Rachael Clark is the guarantor for this work.
Funding:
This work was supported by NIH/NIAMS R01 AR074797 (R.A.C.), NIH/NCI R01 CA203721 (R.A.C./T.S.K), NIH/NCI U01CA253190 (R.A.C.), T32 AR-07098-36 (supplied salary for J.T.O.), the KL2/Catalyst Medical Research Investigator Training (CMeRIT) program (supplied salary for J.T.O.) and a CLARIONS grant from the Cutaneous Lymphoma Foundation (to R.A.C.), and charitable donations from the Lubin Foundation and the David Lamb Fund for Cutaneous T cell Lymphoma Research. J.E.G. and M.K.S. were supported by P30 AR075043. The work was also supported by research grant W1241 from the FWF Austrian Science Fund, grant 15463 from the Oesterreichische Nationalbank Anniversary Fund, and the Austrian Society of Dermatology and Venereology (P.W) and P.A.V.-G. had funding support from the Fondation René Touraine-Celgene and the European Academy of Dermatology and Venereology.
Footnotes
Conflict of Interest Statement: John T. O’Malley is a current employee of Sanofi and holds stock options in the company. Phillip M. Devlin reports textbook royalties less than $5000 from Demos Medical Publishing, NYC. Nicole R. LeBoeuf is a consultant and has received honoraria from Bayer, Seattle Genetics, Sanofi, Silverback, Fortress Biotech, and Synox Therapeutics outside the submitted work. The remaining authors report no conflicts of interest.
Publisher's Disclaimer: This is a PDF file of an unedited manuscript that has been accepted for publication. As a service to our customers we are providing this early version of the manuscript. The manuscript will undergo copyediting, typesetting, and review of the resulting proof before it is published in its final form. Please note that during the production process errors may be discovered which could affect the content, and all legal disclaimers that apply to the journal pertain.
Data Availability Statement:
NanoString data sets have been deposited into the Gene Expression Omnibus (GEO) database (GSE234856, GSE234854, GSE234852) and HTS data files have been deposited to the Adaptive Biotechnologies publicly available archive (DOI: 10.21417/RC2023JID, https://clients.adaptivebiotech.com/pub/clark-2023-JID).
References
- Agar NS, Wedgeworth E, Crichton S, Mitchell TJ, Cox M, Ferreira S, et al. Survival outcomes and prognostic factors in mycosis fungoides/Sezary syndrome: validation of the revised International Society for Cutaneous Lymphomas/European Organisation for Research and Treatment of Cancer staging proposal. Journal of clinical oncology : official journal of the American Society of Clinical Oncology 2010;28(31):4730–9. [DOI] [PubMed] [Google Scholar]
- Akiyama Y, Kondou R, Iizuka A, Ohshima K, Urakami K, Nagashima T, et al. Immune response-associated gene analysis of 1,000 cancer patients using whole-exome sequencing and gene expression profiling-Project HOPE. Biomed Res 2016;37(4):233–42. [DOI] [PubMed] [Google Scholar]
- Antonczyk A, Krist B, Sajek M, Michalska A, Piaszyk-Borychowska A, Plens-Galaska M, et al. Direct inhibition of IRF-dependent transcriptional regulatory mechanisms associated with disease. Frontiers in immunology 2019. [DOI] [PMC free article] [PubMed] [Google Scholar]
- Boukhaled GM, Harding S, Brooks DG. Opposing Roles of Type I Interferons in Cancer Immunity. Annual review of pathology 2021;16:167–98. [DOI] [PMC free article] [PubMed] [Google Scholar]
- Buhl T, Schön MP. Peeking into immunoregulatory effects of phototherapy. Experimental dermatology 2016. [DOI] [PubMed] [Google Scholar]
- Chiarion-Sileni V, Bononi A, Fornasa CV, Soraru M, Alaibac M, Ferrazzi E, et al. Phase II trial of interferon-alpha-2a plus psolaren with ultraviolet light A in patients with cutaneous T-cell lymphoma. Cancer 2002;95(3):569–75. [DOI] [PubMed] [Google Scholar]
- Das A, Dinh PX, Panda D, Pattnaik AK. Interferon-inducible protein IFI35 negatively regulates RIG-I antiviral signaling and supports vesicular stomatitis virus replication. Journal of virology 2014;88(6):3103–13. [DOI] [PMC free article] [PubMed] [Google Scholar]
- Geiss GK, Bumgarner RE, Birditt B, Dahl T, Dowidar N, Dunaway DL, et al. Direct multiplexed measurement of gene expression with color-coded probe pairs. Nature biotechnology 2008;26(3):317–25. [DOI] [PubMed] [Google Scholar]
- Honig B, Morison WL, Karp D. Photochemotherapy beyond psoriasis. Journal of the American Academy of Dermatology 1994;31(5 Pt 1):775–90. [DOI] [PubMed] [Google Scholar]
- Jones CL, Degasperi A, Grandi V, Amarante TD, Genomics England Research C, Mitchell TJ, et al. Spectrum of mutational signatures in T-cell lymphoma reveals a key role for UV radiation in cutaneous T-cell lymphoma. Sci Rep 2021;11(1):3962. [DOI] [PMC free article] [PubMed] [Google Scholar]
- Katlinskaya YV, Carbone CJ, Yu Q, Fuchs SY. Type 1 interferons contribute to the clearance of senescent cell. Cancer Biol Ther 2015;16(8):1214–9. [DOI] [PMC free article] [PubMed] [Google Scholar]
- Katlinski KV, Gui J, Katlinskaya YV, Ortiz A, Chakraborty R, Bhattacharya S, et al. Inactivation of Interferon Receptor Promotes the Establishment of Immune Privileged Tumor Microenvironment. Cancer cell 2017;31(2):194–207. [DOI] [PMC free article] [PubMed] [Google Scholar]
- Kim EJ, Hess S, Richardson SK, Newton S, Showe LC, Benoit BM, et al. Immunopathogenesis and therapy of cutaneous T cell lymphoma. 2005. [DOI] [PMC free article] [PubMed] [Google Scholar]
- Kirsch IR, Watanabe R, O’Malley JT, Williamson DW, Scott LL, Elco CP, et al. TCR sequencing facilitates diagnosis and identifies mature T cells as the cell of origin in CTCL. Sci Transl Med 2015;7(308):308ra158. [DOI] [PMC free article] [PubMed] [Google Scholar]
- LaFleur DW, Nardelli B, Tsareva T, Mather D, Feng P, Semenuk M, et al. Interferon-κ, a Novel Type I Interferon Expressed in Human Keratinocytes. Journal of Biological Chemistry 2001. [DOI] [PubMed] [Google Scholar]
- Li C, Shen Z, Zhou Y, Yu W. Independent prognostic genes and mechanism investigation for colon cancer. Biol Res 2018;51(1):10. [DOI] [PMC free article] [PubMed] [Google Scholar]
- Lim JY, Gerber SA, Murphy SP, Lord EM. Type I interferons induced by radiation therapy mediate recruitment and effector function of CD8(+) T cells. Cancer immunology, immunotherapy : CII 2014;63(3):259–71. [DOI] [PMC free article] [PubMed] [Google Scholar]
- Lulli D, Carbone ML, Pastore S. Epidermal growth factor receptor inhibitors trigger a type I interferon response in human skin. Oncotarget 2016;7(30):47777–93. [DOI] [PMC free article] [PubMed] [Google Scholar]
- Lulli D, Carbone ML, Pastore S. The MEK Inhibitors Trametinib and Cobimetinib Induce a Type I Interferon Response in Human Keratinocytes. Int J Mol Sci 2017;18(10). [DOI] [PMC free article] [PubMed] [Google Scholar]
- Lv Q, Yang M, Liu X, Zhou L, Xiao Z, Chen X, et al. MDP up-regulates the gene expression of type I interferons in human aortic endothelial cells. Molecules 2012;17(4):3599–608. [DOI] [PMC free article] [PubMed] [Google Scholar]
- Morita A Current developments in phototherapy for psoriasis. 2018. [DOI] [PubMed] [Google Scholar]
- Olsen EA. Interferon in the treatment of cutaneous T-cell lymphoma. Dermatologic therapy 2003;16(4):311–21. [DOI] [PubMed] [Google Scholar]
- Olsen EA, Hodak E, Anderson T, Carter JB, Henderson M, Cooper K, et al. Guidelines for phototherapy of mycosis fungoides and Sezary syndrome: A consensus statement of the United States Cutaneous Lymphoma Consortium. Journal of the American Academy of Dermatology 2016;74(1):27–58. [DOI] [PubMed] [Google Scholar]
- Parrish JA, Fitzpatrick TB, Tanenbaum L, Pathak MA. Photochemotherapy of psoriasis with oral methoxsalen and longwave ultraviolet light. The New England journal of medicine 1974;291(23):1207–11. [DOI] [PubMed] [Google Scholar]
- Pathak MA, Fitzpatrick TB. The evolution of photochemotherapy with psoralens and UVA (PUVA): 2000 BC to 1992 AD. Journal of photochemistry and photobiology B, Biology 1992;14(1–2):3–22. [DOI] [PubMed] [Google Scholar]
- Querfeld C, Rosen ST, Kuzel TM, Kirby KA, Roenigk HH Jr., Prinz BM, et al. Long-term follow-up of patients with early-stage cutaneous T-cell lymphoma who achieved complete remission with psoralen plus UV-A monotherapy. Archives of dermatology 2005;141(3):305–11. [DOI] [PubMed] [Google Scholar]
- Rook AH, Gelfand JC, Wysocka M, Troxel AB, Benoit B, Surber C, et al. Topical resiquimod can induce disease regression and enhance T-cell effector functions in cutaneous T-cell lymphoma. Blood 2015;126(12):1452–61. [DOI] [PMC free article] [PubMed] [Google Scholar]
- Sarkar MK, Hile GA, Tsoi LC, Xing X, Liu J, Liang Y, et al. Photosensitivity and type i IFN responses in cutaneous lupus are driven by epidermal-derived interferon kappa. Annals of the Rheumatic Diseases 2018. [DOI] [PMC free article] [PubMed] [Google Scholar]
- Sarkar MK, Hile GA, Tsoi LC, Xing X, Liu J, Liang Y, et al. Photosensitivity and type I IFN responses in cutaneous lupus are driven by epidermal-derived interferon kappa. Ann Rheum Dis 2018;77(11):1653–64. [DOI] [PMC free article] [PubMed] [Google Scholar]
- Satomi H, Wang B, Fujisawa H, Otsuka F. Interferon-beta from melanoma cells suppresses the proliferations of melanoma cells in an autocrine manner. Cytokine 2002;18(2):108–15. [DOI] [PubMed] [Google Scholar]
- Spaccarelli N, Rook AH. The Use of Interferons in the Treatment of Cutaneous T-Cell Lymphoma. Dermatol Clin 2015;33(4):731–45. [DOI] [PubMed] [Google Scholar]
- Stadler R, Otte HG, Luger T, Henz BM, Kuhl P, Zwingers T, et al. Prospective randomized multicenter clinical trial on the use of interferon −2a plus acitretin versus interferon −2a plus PUVA in patients with cutaneous T-cell lymphoma stages I and II. Blood 1998;92(10):3578–81. [PubMed] [Google Scholar]
- Stannard JN, Reed TJ, Myers E, Lowe L, Sarkar MK, Xing X, et al. Lupus Skin Is Primed for IL-6 Inflammatory Responses through a Keratinocyte-Mediated Autocrine Type I Interferon Loop. Journal of Investigative Dermatology 2017. [DOI] [PMC free article] [PubMed] [Google Scholar]
- Stojdl DF, Lichty B, Knowles S, Marius R, Atkins H, Sonenberg N, et al. Exploiting tumor-specific defects in the interferon pathway with a previously unknown oncolytic virus. Nature medicine 2000;6(7):821–5. [DOI] [PubMed] [Google Scholar]
- Vantourout P, Willcox C, Turner A, Swanson CM, Haque Y, Sobolev O, et al. Immunological visibility: posttranscriptional regulation of human NKG2D ligands by the EGF receptor pathway. Sci Transl Med 2014;6(231):231ra49. [DOI] [PMC free article] [PubMed] [Google Scholar]
- Vieyra-Garcia P, Crouch JD, O’Malley JT, Seger EW, Yang CH, Teague JE, et al. Benign T cells drive clinical skin inflammation in cutaneous T cell lymphoma. JCI insight 2019a. [DOI] [PMC free article] [PubMed] [Google Scholar]
- Vieyra-Garcia P, Fink-Puches R, Porkert S, Lang R, Pöchlauer S, Ratzinger G, et al. Evaluation of Low-Dose, Low-Frequency Oral Psoralen-UV-A Treatment with or Without Maintenance on Early-Stage Mycosis Fungoides: A Randomized Clinical Trial. JAMA dermatology 2019b. [DOI] [PMC free article] [PubMed] [Google Scholar]
- Vieyra-garcia PA, Wolf P. From Early Immunomodulatory Triggers to Immunosuppressive Outcome : Therapeutic Implications of the Complex Interplay Between the Wavebands of Sunlight and the Skin. 2018;5(September):1–9. [DOI] [PMC free article] [PubMed] [Google Scholar]
- Weatherhead SC, Farr PM, Jamieson D, Hallinan JS, Lloyd JJ, Wipat A, et al. Keratinocyte apoptosis in epidermal remodeling and clearance of psoriasis induced by UV radiation. Journal of Investigative Dermatology 2011. [DOI] [PMC free article] [PubMed] [Google Scholar]
- Weinstock MA, Gardstein B. Twenty-year trends in the reported incidence of mycosis fungoides and associated mortality. Am J Public Health 1999;89(8):1240–4. [DOI] [PMC free article] [PubMed] [Google Scholar]
- Willemze R, Jaffe ES, Burg G, Cerroni L, Berti E, Swerdlow SH, et al. WHO-EORTC classification for cutaneous lymphomas 10.1182/blood-2004-09-3502. Blood 2005;105(10):3768–85. [DOI] [PubMed] [Google Scholar]
- Wozniak MB, Tracey L, Ortiz-Romero PL, Montes S, Alvarez M, Fraga J, et al. Psoralen plus ultraviolet A ± interferon-α treatment resistance in mycosis fungoides: The role of tumour microenvironment, nuclear transcription factor-κB and T-cell receptor pathways. British Journal of Dermatology 2009. [DOI] [PubMed] [Google Scholar]
- Yanai H, Negishi H, Taniguchi T. The IRF family of transcription factors: Inception, impact and implications in oncogenesis. Oncoimmunology 2012;1(8):1376–86. [DOI] [PMC free article] [PubMed] [Google Scholar]
Associated Data
This section collects any data citations, data availability statements, or supplementary materials included in this article.
Supplementary Materials
Data Availability Statement
NanoString data sets have been deposited into the Gene Expression Omnibus (GEO) database (GSE234856, GSE234854, GSE234852) and HTS data files have been deposited to the Adaptive Biotechnologies publicly available archive (DOI: 10.21417/RC2023JID, https://clients.adaptivebiotech.com/pub/clark-2023-JID).