

Abstract
Elevation of mean intraocular pressure (IOP) has long been recognized as a leading risk factor for glaucoma. Less is known about the possible contribution of moment-to-moment variations in IOP to disease development and progression due to limitations of tonometry, the prevailing method of IOP measurement. Tonometry provides good estimates of mean IOP but not IOP variance. The aim of this study was to quantitatively characterize IOP variability via round-the-clock IOP telemetry in conscious unrestrained rats. The anterior chamber of one eye was implanted with a microcannula connected to a wireless backpack telemetry system, and IOP data were collected every 4 s for one week. The cannula was then repositioned under the conjunctiva, and control data were collected for an additional week. IOP statistics were computed in 30-min intervals over a 24-h period and averaged across days. All animals exhibited a diurnal variation in mean IOP, while deviations about the mean were independent of time of day. Correlation analysis of the deviations revealed transient and sustained components, which were respectively extracted from IOP records using an event detection algorithm. The amplitude and interval distributions of transient and sustained events were characterized, and their energy content was estimated based on outflow tissue resistance of rat eyes. Transient IOP events occurred ~231 times per day and were typically ≤5 mmHg in amplitude and 2–8 min in duration, while sustained IOP events occurred ~16 times per day and were typically ≤5 mmHg in amplitude and 20–60 min in duration. Both persisted but were greatly reduced in control recordings, implying minor contamination of IOP data by motion-induced telemetry noise. Sustained events were also often synchronous across implanted animals, indicating that they were driven by autonomic startle and stress responses or other physiological processes activated by sensory signals in the animal housing environment. Not surprisingly, the total daily fluidic energy applied to resistive outflow pathways was determined primarily by basal IOP level. Nevertheless, transient and sustained fluctuations collectively contributed 6% and diurnal fluctuations contributed 9% to daily IOP energy. It is therefore important to consider the cumulative impact of biomechanical stress that IOP fluctuations apply over time to ocular tissues.
Keywords: wireless telemetry, IOP, diurnal rhythms, glaucoma
1. Introduction
It is well established that chronic elevation of mean intraocular pressure (IOP) is a major risk factor for glaucoma in humans and for glaucoma-like damage in animal models. Comparatively little, though, is known about IOP variance and its potential impact on eye health and function. Tonometry has long been the gold standard of IOP measurement for its noninvasiveness and ease of use, but tonometry can provide only sporadic snapshots of IOP history. Moreover, the snapshots can be distorted by corneal tissue properties (Copt et al., 1999; Ehlers et al., 1975; Tonnu et al., 2005; Whitacre et al., 1993) and biased by operator skill (Grolman et al., 1990; Trevino et al., 2020). Tonometry requires subject compliance, which can be difficult in animals, and forcing compliance via physical restraint or anesthetic sedation has been shown to markedly alter IOP statistics (Miyazaki et al., 2000; Nicou et al., 2021; Turner et al., 2019b). Tonometry also requires subject interaction, which can elicit a stress response that produces erratic tonometry data and may unknowingly lead to overestimation of resting IOP (Nicou et al., 2021; Turner et al., 2019b). The whitecoat effect, as it is known clinically, can confound glaucoma diagnosis (Méndez-Ulrich et al., 2018; Shily, 1987). Without direct continuous access to IOP, the relative contributions of physiological fluctuations and experimental noise to variability in tonometer output is uncertain.
To address the issue, wireless telemetry systems have been developed for round-the-clock IOP monitoring. The systems have been deployed in conscious animals of various size from mice to humans using assorted types of wearable and implantable pressure transducers, such as contact lens sensors (Kim et al., 2017; Mansouri and Shaarawy, 2011; Zhang et al., 2022), indwelling microcannulas (Bello and Passaglia, 2017; Downs et al., 2011; Li and Liu, 2008; McLaren et al., 1996; Schnell et al., 1996), and intraocular implants (Lee et al., 2017; Todani et al., 2011). They have revealed that IOP is highly dynamic, varying over seconds to hours due to changes in ocular blood volume and aqueous humor flow driven by vascular pulsations, blinks and saccades, postural shifts, circadian rhythms, and other physical and biological factors (Aptel et al., 2016; Bello and Passaglia, 2017; Coleman and Trokel, 1969; Cooper et al., 1979; Downs et al., 2011; Ficarrotta and Passaglia, 2020; Li and Liu, 2008; Markert et al., 2018; Mohamed and Passaglia, 2023; Nicou et al., 2021; Schnell et al., 1996; Turner et al., 2017). The multiscale variations are important to characterize because they alter the static mechanical stress and strain applied to ocular tissues by mean IOP. Cell survival depends on withstanding periodic as well as stochastic perturbations. Abnormal IOP amplitudes or dynamics disturb biomechanical homeostasis and may injure prone tissues like the retina and optic nerve over time.
Few studies to date have investigated IOP variability in awake unrestrained animals. The one research group to do so analyzed telemetry data recorded continually for several months from non-human primates and reported ~10,000 transient IOP fluctuations of >0.6 mmHg every hour, with more small-amplitude impulses during sleeping hours and up to half of impulses exceeding 5 mmHg during waking hours (Markert et al., 2018; Turner et al., 2019a). The IOP impulses were very brief, lasting under a second, and fluctuations of longer duration were not examined. We have developed a wireless telemetry system for round-the-clock IOP monitoring in rats and potentially larger animals (Bello and Passaglia, 2017). We have shown that IOP varies spontaneously over a wide range of amplitudes and durations, even when animals are inactive (Nicou et al., 2021). The objective of this study was to characterize the statistics of IOP variations in quantitative detail for healthy rats.
2. Materials and Methods
All experiments were conducted in accordance with the National Institutes of Health guide for the care and use of laboratory animals and compliance with a protocol approved by the Institutional Animal Care and Use Committee (IACUC) at the University of South Florida.
2.1. IOP recording
Adult male Brown-Norway rats (300–400 g) were housed in a temperature-controlled room (22 °C) under a 12-hr light (6AM - 6PM)/12-hr dark (6PM - 6AM) cycle with food and water available ad libitum. The anterior chamber of the right eye was implanted with a silicone microcannula (OD: 200 μm, ID: 100 μm, AS One International, Santa Clara, CA, USA) filled with balanced salt solution, 3 mM moxifloxacin hydrochloride (Vigamox®, Alcon, Fort Worth, TX), 1.3 mM enoxaparin sodium (Lovenox®, Henry Schein, Melville, NY), and 2.2 mM triamcinolone acetonide (Triesence®, Alcon, Fort Worth, TX). The cannula was sutured to the sclera and connected via a skull-mounted coupler to a custom-made wireless IOP telemetry device that was worn like a backpack. Details of the eye cannulation procedure and the temperature and drift-free properties of the device have been published (Bello and Passaglia, 2017; Nicou et al., 2021). Pressure sensors were calibrated with a mercury manometer prior to use.
IOP data were collected at 0.25 Hz round-the-clock for weeks to months from awake free-moving animals, during which different experiments were performed after allowing at least one day of surgical recovery. For 12 animals, IOP data were collected for one week before any experimental testing and subjected to analysis. On occasion multiple animals were recorded at the same time. For 5 pairs of different animals, IOP data were collected simultaneously for at least three days before any experimental testing and separately analyzed to assess environmental contributions to IOP variability. At experiment end, the cannula was removed from the eye and placed under the conjunctiva in 4 of these animals and one week of control pressure data was collected.
2.2. Data analysis
IOP records were processed and analyzed using MATLAB software (The Mathworks, Natick, MA). Outliers were first removed with a median filter of 28-s width, and noise was smoothed with a mean filter of 28-s width (Nicou et al., 2021). Records were then split into 24-h segments, and IOP mean and variance were calculated in 30-min intervals over the course of a day. Results were combined across days and animals by referencing mean calculations to the 24-h average IOP of the corresponding segment and variance calculations to the 30-min average IOP of the corresponding interval.
Transient and sustained IOP events were identified according to a published event-detection algorithm (Markert et al., 2018). Fig 1A illustrates the algorithm, which was implemented using the MATLAB command ‘findpeaks’ with two parameters: minimum peak prominence and minimum peak separation. Minimum peak prominence is the amount a local maximum must exceed the highest local minimum to qualify as an event. It was set at 1 mmHg to prevent baseline noise from triggering events. Minimum peak separation is the time that must elapse before another event is detected. It was specified empirically by computing the autocorrelation of IOP records and noting the shortest lag at which the autocorrelation suddenly changes slope or falls to zero. Prominent peaks separated more than this time lag were defined as transient events and subtracted from the IOP record. The algorithm was then reapplied, and residual peaks were defined as sustained events. They were similarly subtracted, and the remaining waveform was defined as baseline.
Figure 1.

Event detection algorithm. Schematic pressure waveform containing several peaks, labeled A-F. The algorithm first determines the times and amplitudes of all peaks (filled symbols) and valleys (unfilled symbols) and identifies the subset of peaks (red circles) that satisfies two criteria: minimum peak prominence (minPP) and minimum peak separation (minPS). The former requires peaks to exceed adjacent valleys by a criterion amount (left dashed line), and the latter requires a criterion amount of time between prominent peaks (right dashed line). In the schematic, minPP and minPS are respectively set at 1 mmHg and 1 min so the algorithm would discard peak C because it is not prominent and peak E because it occurs too soon after peak D, which is more prominent. The algorithm then finds the deepest valley between prominent peaks (blue circles), linearly interpolates between the valleys (blue line), and defines events as the area between the interpolated line and pressure waveform (shaded area).
The relative impact of transient, sustained, and baseline fluctuations was quantified in terms of the biomechanical energy applied to intraocular tissue. Since fluidic power is the product of pressure and flow, the fluidic energy E generated by IOP fluctuations over an interval T is given by:
where R is tissue resistance. R is well documented for aqueous drainage tissues and was set to 43.5 min·mmHg/μl, based on measurements of conventional outflow facility in rat eyes (Ficarrotta et al., 2018). Diurnal variations in outflow facility (Mohamed and Passaglia, 2023) were ignored for computational ease. Energy was calculated for each 24-h segment via numerical integration of squared transient, sustained, and baseline records, expressed in units of μJ/day using the conversion factor of 1 mmHg·μl = 0.133 μJ, and averaged across days for each animal.
Statistical analysis was conducted using SigmaPlot software (Systat, San Jose, CA), with significance assessed at α of 0.05. Data that passed a normality test are expressed as mean ± standard deviation and those that did not pass as median with lower and upper quartiles in brackets or box-and-whiskers. Energy differences between IOP components were evaluated using a one-way repeated-measures ANOVA on ranks with a Tukey test for paired comparisons. Linear correlation between component energies and daytime IOP was assessed using a Pearson product-moment (r) test. Significance of serial correlation and cross-correlation analyses was assessed using a bootstrap approach. The approach involved shuffling the series of event amplitudes or intervals peeled by the event detection algorithm from an IOP record 1000 times randomly, correlating the unshuffled series with each shuffled series, extracting the maximum correlation coefficient within a lag time of 180 min, and then using the probability distribution of shuffled coefficients to specify the likelihood of the measured amplitude or interval coefficient.
3. Results
The study analyzed IOP data collected round-the-clock for at least 7 consecutive days from 12 conscious rats. All animals exhibited a diurnal rhythm, with lower IOP in the light (day) phase and higher IOP in the dark (night) phase (Fig 2A). The average daytime IOP (10AM - 2PM) was 13.3 ± 3.0 mmHg and the average nighttime IOP (10PM - 2AM) was 19.0 ± 5.8 mmHg. Differences in resting IOP across animals were removed, and changes in IOP statistics over the course of a day were evaluated in 30-min intervals. On average, mean IOP began to rise at 6PM (lights off), reached nighttime level by 7PM, began to fall around 5AM (1 hr before lights on), and returned to daytime level by 7AM (Fig 2B). It also trended lowest in the early morning and upwards in the late afternoon. IOP variability did not, on the other hand, exhibit a diurnal rhythm (Fig 2C). Deviations about mean IOP of each interval averaged ~2 mmHg irrespective of the time of day.
Figure 2.

IOP mean and variance statistics. (A) IOP recorded over one week from a conscious free-moving rat housed under 12-hr light/12-hr dark conditions. (B) Mean IOP change over a 24-hr period averaged across animals in 30-min intervals. Mean changes are relative to the daily resting IOP of each animal. (C) Standard deviation of IOP variability over a 24-hr period averaged across animals in 30-min intervals. Deviations are relative to the mean IOP of each interval. White-black bars indicate the light-dark cycle.
IOP fluctuated from moment-to-moment over a range of amplitudes and durations. Fig 3A plots a 4-hr segment of representative data, in which numerous irregular bumps can be seen atop slow undulations in IOP. The fluctuations originate in large part from the eye since they were greatly diminished after cutting the cannula behind the limbal implantation site and securing under the conjunctiva (Fig 3B). They were not eliminated as the cannula tip was still covered by conjunctiva and not open to atmosphere. Fig 3C plots the auto-correlogram of daytime (10AM - 2PM) and nighttime (10PM - 2AM) IOP readings for each animal. All correlograms, irrespective of time of day, exhibited a narrow peak at zero lag of similar width across animals and a broader peak of variable width. Peak widths were estimated by fitting a double Gaussian function to average daytime and nighttime correlograms. Based on fitted variances, lags of 2 min and 20 min were respectively found to span >95% of the narrow and broad peak areas. After removing the cannula, mean pressure was −0.2 ± 0.4 mmHg during the day and 0.1 ± 0.5 during the night (N = 4). Auto-correlograms exhibited a broad peak at zero lag like that observed with the cannula in the eye, but much smaller in magnitude, and the narrow peak was largely absent (Fig 3D).
Figure 3.
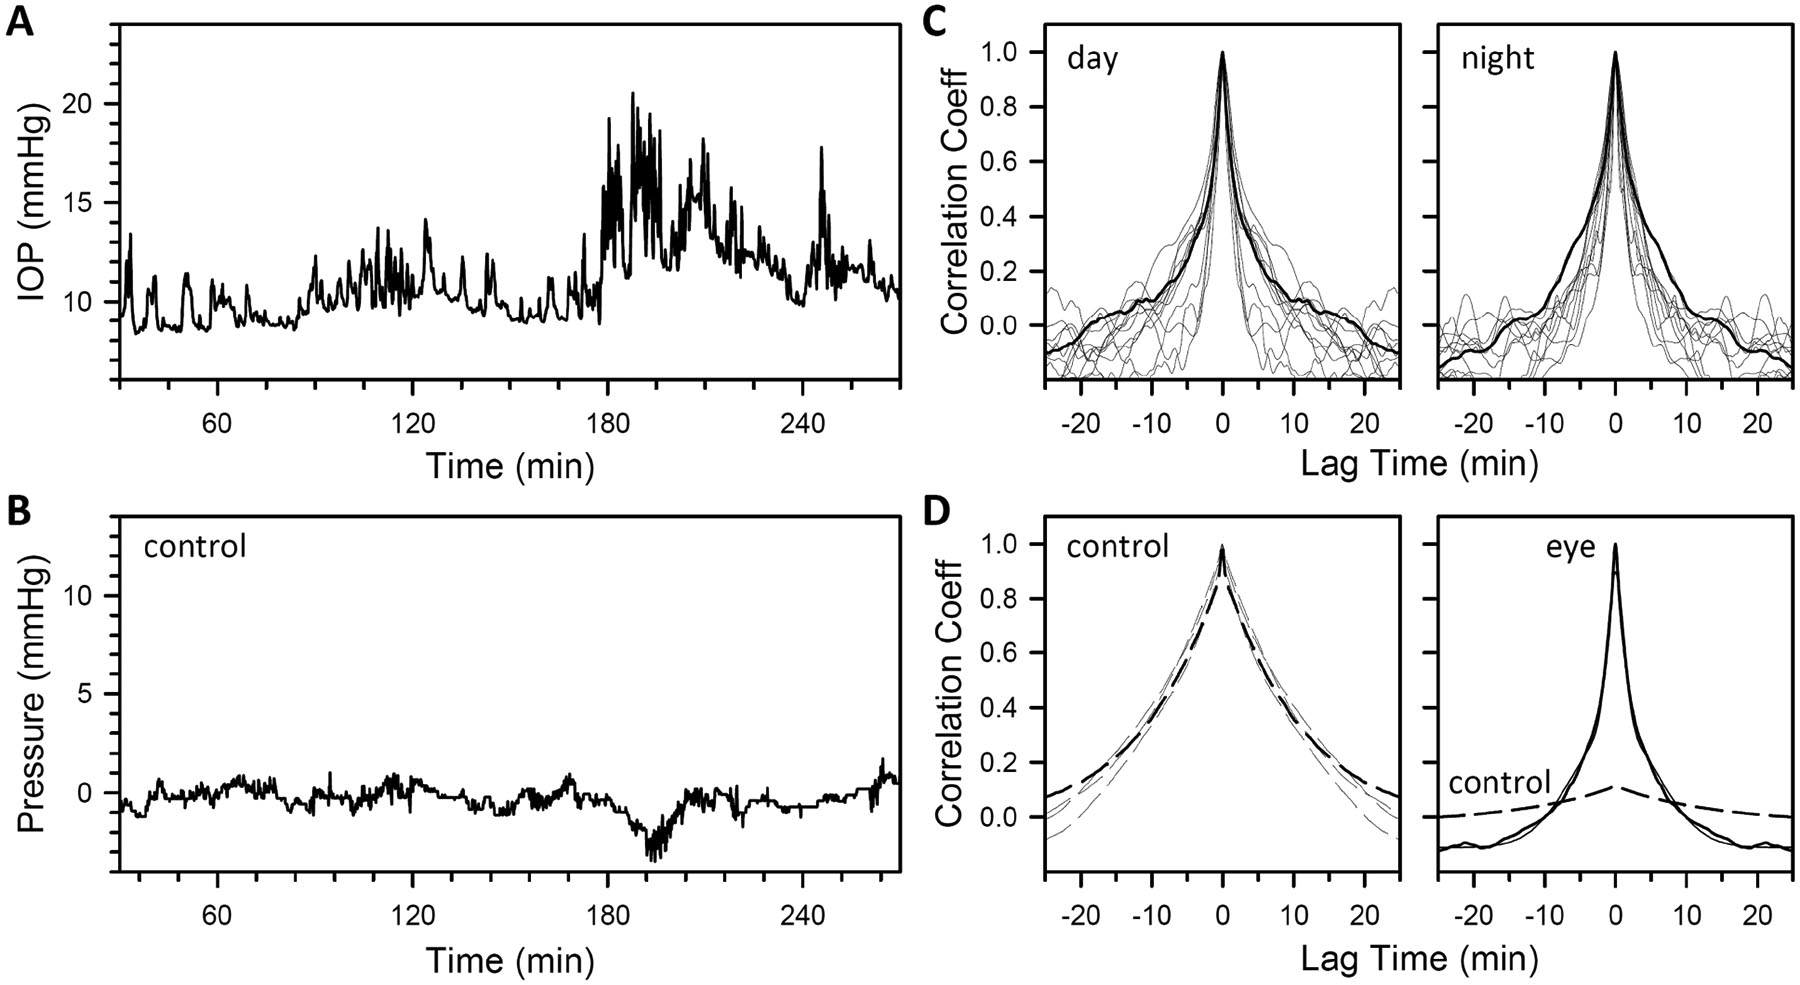
Temporal correlations in IOP. (A) Data segment showing fast and slow IOP fluctuations in a conscious rat. (B) Control data segment from the same animal showing fluctuations that persist after the cutting the implanted cannula behind the limbus. (C) Auto-correlogram of daytime (10A-2PM) and nighttime (10PM-2AM) IOP data averaged across days for this animal (thick line) and all other animals (thin lines) (N = 12). (D) Left, Auto-correlogram of control cut-cannula data averaged across one week over the same time periods for this and other animals (thick and thin dashed lines, respectively) (N = 4). Right, Average auto-correlogram of cut (dashed line) and uncut (thick solid line) cannula data. The control cut-cannula correlogram was scaled by 0.12 to match the relative variance of the uncut-cannula correlogram. Thin line is a double Gaussian fit of the average auto-correlogram for implanted eyes (σ1 = 1.2 min, σ1 = 6.1 min).
Based on the correlation structure, IOP records were parsed using an event detection algorithm into three components: transient, sustained, and baseline. Fig 4A illustrates the parsing process. The transient component was extracted first and consisted of events of ≥1-mmHg amplitude and ≥2-min separation. It contained the fastest fluctuations (seconds to minutes) recorded by the telemetry system, which underlie the auto-correlogram peaks in Fig 3. The sustained component was extracted from the residual record and consisted of events of ≥1-mmHg amplitude and ≥20-min separation. It captured slow fluctuations (minutes to hours) in the IOP record that extend beyond the auto-correlogram range in Fig 3. The remainder was considered the baseline component. It was largely devoid of fluctuations and tracked the diurnal IOP rhythm. Fig 4B plots the transient, sustained, and baseline waveforms averaged over a 24-h period across days and animals. Neither the transient or sustained component exhibited a pronounced diurnal rhythm, consistent with the variance analysis in Fig 2C. The parsing process did, though, indicate a tendency for large sustained events at lights off (6PM). The baseline waveform mirrored the mean IOP record in Fig 2B. It could be further divided into basal and diurnal subcomponents. The basal subcomponent corresponds to the minimum baseline level, which was 10.0 mmHg. This is less than the measured daytime IOP level because 3.5 mmHg of transient and sustained signal was removed according to waveform amplitudes in Fig 4B. The diurnal subcomponent was ~5 mmHg in peak-to-trough amplitude, consistent with the measured change in diurnal IOP.
Figure 4.

Extraction of transient and sustained IOP events. (A) Representative record of IOP peaks and valleys identified by the event detection algorithm of Fig 1. The algorithm first detected “transient events” using a minimum peak prominence of 1 mmHg and a minimum peak separation of 2 min based on the narrow correlogram peak in Fig 3 (top, red dots/shading), which were then peeled from the IOP record (middle). The algorithm next detected “sustained events” in the record after transient events were peeled off using a minimum peak prominence of 1 mmHg and a minimum peak separation of 20 min based on the broad correlogram peak in Fig 3 (top, blue dots/shading), which were then peeled away as well (bottom). The remainder was considered “baseline” IOP (top, gray shading). (B) 24-hr average transient (top), sustained (middle), and baseline (bottom) waveforms across days and animals. Dashed line marks the minimum baseline level. Shaded areas above and below that line respectively indicate diurnal and basal subcomponents of the baseline waveform. White-black bars indicate the light-dark cycle.
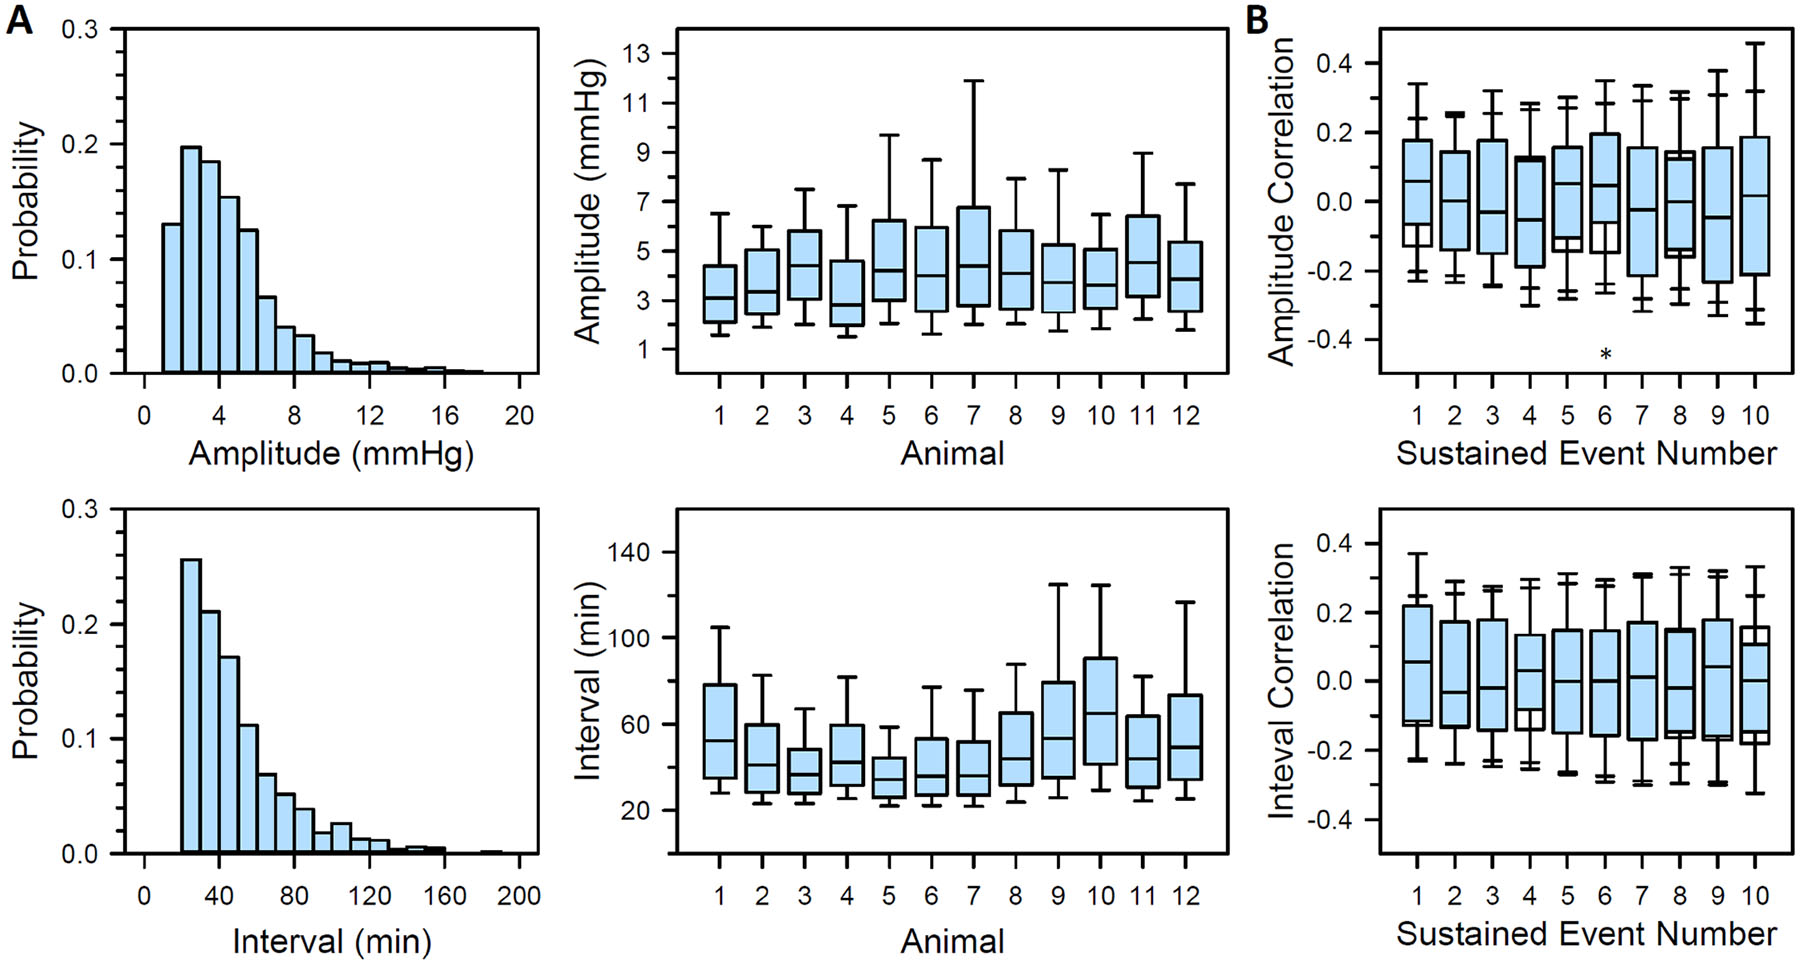
Fig 5A summarizes transient event statistics. Amplitude and interval distributions were positively skewed since the detection algorithm does not allow for negative events. On average, there were 231 ± 79 transient events per day across animals. Over 85% were ≤5 mmHg in amplitude, with some reaching up to 15 mmHg in one animal, and over 80% of intervals were ≤8 min, with very few transient events separated more than 20 min apart. Serial correlation analysis revealed a temporal dependence among transient events (Fig 5B). The first four serial coefficient distributions of event amplitude and interevent interval both differed significantly from the chance distribution determined by randomly shuffling the order of events (p<0.001 for first four amplitude and interval coefficients). The positive serial correlation indicates that transient events tend to occur in short clusters of similar magnitude and interspacing.
Figure 5.

Statistics of transient IOP events. (A) Probability distribution of transient event amplitudes (upper left) and interevent intervals (lower left) across animals, along with the transient event amplitude (upper right) and interevent interval (lower right) distribution for each animal. (B) Distribution of serial correlation coefficients across animals for transient event amplitude (top) and interevent interval (bottom) records. Filled boxes correspond to the recorded series of transient events and empty boxes correspond to the same series after random shuffling to eliminate potential serial correlation between events. Box edges give upper quartile, median, and lower quartile and whiskers give data range. Asterisks indicate statistical significance (p<0.05).
Fig 6A summarizes sustained event statistics. Amplitude and interval distributions had a similar positive-skewed shape as those for transient events. On average, there were 16 ± 2 sustained events per day across animals. Over 80% were ≤5 mmHg in amplitude, with some exceeding 15 mmHg in one animal, and over 75% lasted 60 min or less based on separation interval. Serial correlation analysis indicated no interdependence among sustained events (Fig 6B). Coefficient distributions were indistinguishable after shuffling the order of event amplitudes (p>0.10 for all but the 6th serial coefficient, for which p<0.01) and interevent intervals (p>0.10 for all serial coefficients).
Figure 6.
Statistics of sustained IOP events. (A) Probability distribution of sustained event amplitudes (upper left) and interevent intervals (lower left) across animals, along with the sustained event amplitude (upper right) and interevent interval (lower right) distribution for each animal. (B) Distribution of serial correlation coefficients across animals for sustained event amplitude (top) and interevent interval (bottom) records. Filled boxes correspond to the recorded series of sustained events and empty boxes correspond to the same series after random shuffling to eliminate potential serial correlation between events. Box edges give upper quartile, median, and lower quartile and whiskers give data range. Asterisks indicate statistical significance (p<0.05).
The energetic content of transient and sustained events was determined by integrating event power over interevent interval. The calculation only considered IOP energy exerted on aqueous outflow pathways and assumed that outflow resistance was the same for all rats and constant over time. The assumption may lead to energy underestimation given reported increases in outflow resistance at night (Mohamed and Passaglia, 2023), but the relative energy content of different IOP components would not be impacted. Fig 7 plots the energy distributions of transient and sustained events in individual animals and the population of animals. Both distributions are exponential to a first approximation with a slightly long tail (r = 0.99) and were fairly consistent in range across animals. The energy content of individual transient events was about ten-fold less than that of individual sustained events.
Figure 7.

Energy content of transient and sustained events. Distributions of IOP energy contained in transient (top) and sustained (bottom) events for individual animals (right) and the population of animals (left). Energy calculations apply to a rat aqueous outflow pathway of standard and fixed resistance. Box edges give upper quartile, median, and lower quartile and whiskers give data range.
The daily energy impact of the various IOP components was compared. Estimates of transient, sustained, diurnal, and basal energy were 21 [19, 27], 33 [22, 45], 55 [47, 148], and 745 [535, 899] μJ/day, respectively, across animals. Transient and sustained events collectively contributed 6% [5%, 10%] of the total IOP energy applied to resistive outflow pathways of the rat eye, the diurnal rhythm contributed 9% [6%, 13%], and the basal level contributed the remaining 83% [82%, 88%] (Fig 8A). Daily energy totals and percentages were significantly different between all IOP components (p<0.05). They were also much greater than transient (5 [5, 7] μJ/day, p<0.05) and sustained (8 [6, 12] μJ/day, p<0.05) energy estimates of control data with a cut cannula. Component energy estimates were positively correlated with daytime IOP level (Fig 8B). The correlation was greatest for the basal component (r = 0.87, p<0.001), which may be expected as it approximates daytime IOP. The correlation was moderate-to-strong for the other three components (transient: r = 0.70, p<0.01; sustained: r = 0.77, p<0.01; diurnal: r = 0.63, p<0.05), indicating that transient and sustained events are larger and diurnal swings are greater in animals with higher daytime IOP level. Accordingly, transient and sustained energies were positively correlated with diurnal energy (Fig 8C, r = 0.61 for both, p<0.05) and sustained energy was positively correlated with transient energy (Fig 8D, r = 0.87, p<0.001).
Figure 8.

Relative energy in different IOP components. (A) Contribution of transient [T], sustained [S], diurnal [D], and basal [B] components to the total energy in IOP records. Symbols give energy percentages for individual animals. (B) Average daily IOP energy of transient, sustained, diurnal, and basal components (red, blue, gray, and white symbols, respectively) expressed in logarithmic units. (C) Relation of daily transient and sustained energy to diurnal energy. (D) Relation of daily sustained energy to transient energy. Error bars give standard deviations. Dashes are data regression lines.
IOP was sometimes recorded for multiple days from pairs of animals simultaneously (N = 5). Fig 9A shows a 3-day segment of IOP data from two rats that were housed in adjacent cages. Several coincident fluctuations may be seen in the records at various times of the day and night. The phenomenon was examined further by peeling IOP components from each record. Fig 9B shows cross-correlograms for the peeled series of transient and sustained events and for multiple random shuffles of the series. There was no correlation between transient events in this or the other recording pairs, as evidenced by the peak coefficient falling well in the range of shuffled correlation peaks across a 20-min range of lead and lag times. However, there was significant correlation between sustained events in this and two other recording pairs, with all correlograms exhibiting a distinct broad peak near zero lag (12 ± 7 min) that was unlikely to happen by chance based on event shuffling (p<0.05). It is uncertain whether sustained events were uncorrelated in the remaining pairs or the coincidence was too infrequent for correlogram detection.
Figure 9.

Coincident IOP fluctuations in conscious rats. (A) IOP recorded currently over multiple days from two free-moving rats (J105 and J106). White-black bars indicate the light-dark cycle. Asterisks indicate IOP fluctuations that were coincident in both animals. (B) Cross-correlogram of transient (top) and sustained (bottom) events for the pair of IOP records in A (red and blue lines, respectively) and for three random shuffles of event order in one record (gray lines). Dashed line marks the maximum correlation coefficient in 95% of 1000 shuffled cross-correlograms.
4. Discussion
This study quantitatively characterized IOP variability in conscious rats over several days of wireless telemetry recording. As reported previously (Lozano et al., 2015; Moore et al., 1996), rats housed under a standard light-dark cycle exhibited a pronounced diurnal IOP rhythm with higher mean level during the dark phase. Since rats are nocturnal, it could be that the diurnal rhythm in mean IOP is a byproduct of their sleep-wake cycle. That is, IOP variation is elevated at night because the animal is active and reduced during the day because the animal sleeps. However, a diurnal rhythm in IOP variance was not observed. A marked dependence of IOP variance on sleep-wake cycle is not apparent in primate telemetry recordings either (Markert et al., 2018). A key finding is therefore that mechanisms of chronic IOP fluctuation are decoupled from those of circadian IOP modulation.
Further analysis revealed multiple scales of temporal correlation in telemetry data. In addition to the diurnal rhythm, transient and sustained forms of correlation were identified. The transient component reflects sporadic bumps in IOP, which occurred a few hundred times per day. Most were ≤5 mmHg and ≤8 min apart. They had a gamma-like distribution and covaried in amplitude and interval with preceding transient events. The sustained component reflects sporadic undulations in IOP, which occurred around a dozen times per day. Most were ≤5 mmHg and lasted ≤60 min. They were also gamma distributed in amplitude and interval but did not covary with preceding sustained events. Since transient events are much shorter in duration, their energy content was individually about 10-fold less than sustained events. Their total IOP energy per day was, on the other hand, similar to sustained events owing to their over 10-fold higher rate of incidence.
Contributions of transient, sustained, diurnal, and basal components to IOP variability were compared to gauge their relative biomechanical impact on the pressure-dependent outflow pathway of rat eyes. The non-varying basal component accounted for the bulk of daily IOP energy, which may explain the connection between glaucoma and mean IOP. Small changes in mean level produce comparatively large changes in daily energy level. Yet, the eye contains homeostatic mechanisms that are designed to accommodate tonic input. Transient, sustained, and diurnal components perturb IOP homeostasis, presenting recurrent challenges throughout the day. They collectively accounted for 10–20% of daily IOP energy. The energy content of all three components also trended larger in animals with higher daytime IOP, which would have greater potential for glaucoma development. Moreover, in some cases, the energy content of individual transient and sustained events approached that of the basal component over the event duration. Healthy rat eyes can apparently handle this pattern and amount of IOP variability without suffering permanent impairment, but perhaps glaucomatous eyes cannot.
4.1. Origin of transient and sustained IOP events
Transient IOP events were first analyzed in telemetry studies of non-human primates (Markert et al., 2018; Turner et al., 2019a). The events were peeled from IOP records using a finite impulse response filter to identify peaks and troughs. They were milliseconds in duration and attributed to blinks, saccades, and ocular blood pulses. Their energy content correlated with ocular perfusion pressure during waking hours, presumably due to animal activity (Markert et al., 2018), and collectively accounted for ~10% of the average IOP energy that the primate eye must withstand daily (Turner et al., 2019a). This is comparable to the daily energy that was measured for transient, sustained, and diurnal fluctuations combined in rats. Sustained IOP events were not described in the primate studies, and diurnal IOP rhythms were not observed.
It is important to note that transient IOP events analyzed here are minutes in duration and are the same in name only as those in primates. Rat IOP may exhibit impulse-like events from blinks and ocular pulses, but the data acquisition rate of our telemetry system was too low to detect them. Transient events in this study appear instead to derive mainly from animal motion. At least 25% of transient event energy can be attributed to recording artifacts that were induced by animal movements since the events were diminished but not abolished after subconjunctival cannula placement. The artifacts are likely caused by head and body rotations (Bello and Passaglia, 2017), which can bend the fluid-filled tube running to the pressure sensor that the rat wears on its back. Recording artifacts may have factored in the other 75% of transient event energy as well, except fast spontaneous IOP fluctuations were recorded in mice and rabbits with telemetry systems that do not use a fluid-filled cannula (McLaren et al., 1996; Ruixia Li, 2008). It is therefore postulated that the bulk of transient IOP energy reflects acute changes in ocular blood pressure and flow associated with animal activity.
This is the first study to analyze sustained IOP events. The events appear to derive primarily from internal physiological processes, though the specific processes involved are less clear. Sustained events have features in common with transient events, such as amplitude, interval, and energy distribution shape. They also covary with transient events in energy content, suggesting that the distinction may be arbitrary and sustained events could simply be long transient events. Yet, hour-long fluctuations in IOP are not easily ascribed to recording artifacts that generated many transient events. Moreover, sustained events differed markedly in serial correlation properties and, unlike transient events, they oftentimes happened synchronously across recorded animals. The temporal coincidence indicates that sustained IOP events originate from internal processes activated by shared sensory input like animal vocalizations, cage vibrations, and caretaker sightings. Startle and stress responses to such inputs have been shown to alter IOP for comparably long periods of time (Dinslage et al., 1998; Nicou et al., 2021; Turner et al., 2019b). One or more autonomic processes may be involved, which could change ocular blood pressure and flow as postulated for transient events, modify aqueous humor dynamics of the eye, or modulate body temperature. The latter could explain why sustained events persisted to a degree after removing the cannula tip from the eye. Since the cannula was still subdermal it was exposed to body temperature variations, which can impact pressure readings (Nicou et al., 2021).
4.2. Study limitations and directions
Four limitations of this study are noted. One is the current design of the rat telemetry system. The system can faithfully track sustained and diurnal variations in IOP, but animal motion introduces transient artifacts that are indistinguishable from transient variations intrinsic to rat IOP. It is anticipated that recording artifacts can be greatly attenuated or abolished with a smaller sensor that can be mounted to the skull or embedded inside the cannula tip based on primate telemetry data (Jasien et al., 2020). Ongoing efforts are thereby directed at shrinking the telemetry system further and expanding its capabilities to monitor additional physiological variables. Based on study results, two of importance are body temperature and locomotor activity. A second limitation is data acquisition rate. The telemetry system was configured here for chronic round-the-clock IOP recording at 0.25 Hz. Much higher sample rate would be required to detect very fast IOP fluctuations like ocular pulses. Our system has this capability but it would dramatically shorten battery life, necessitating frequent battery replacement or intermittent pauses in data collection. A third limitation is animal housing environment. The random opening and closing of doors, entry and exit of people, and buzzing of machines can pierce the quiescence of housing rooms and trigger transient and sustained blips in IOP (Nicou et al., 2021). They might also disrupt the normal sleep-wake behavior of animals, which could explain the constancy of IOP variation observed here throughout the day. In addition, the uniformity and periodicity of ambient lighting might enhance IOP rhythmicity. IOP statistics may thus differ for rats that are not raised under the controlled environmental conditions of an animal facility. A fourth limitation is the use of a single average outflow resistance in the calculation of fluidic power on ocular tissues. Conventional outflow resistance varies in a given eye throughout the day (Mohamed and Passaglia, 2023). It can also differ between animals. The impact on power estimates would be minor though as studies report a fairly narrow range of outflow resistances (35–48 min·mmHg/μl) for adult Brown-Norway rats (Feola et al., 2020; Ficarrotta et al., 2018)
5. Conclusion
A principal finding from round-the-clock IOP telemetry in rats is that mean IOP varies throughout the day but IOP variance does not. The implication is that short-term and long-term variations in IOP are mediated by distinct processes. Correlation analysis revealed transient and sustained scales of short-term variation. Transient IOP fluctuations lasted minutes and tended to cluster together in events of similar amplitude and interval. Some transient events were artifacts of our telemetry system caused by animal motion, but most were not according to control experiments. They are attributed to acute changes in blood circulation to the eye. Sustained IOP fluctuations lasted up to a few hours and were not correlated with each other in amplitude or interval. They often occurred simultaneously in recorded animals and were therefore likely induced by startle and stress responses of the animals to surrounding stimuli. Transient, sustained, and diurnal fluctuations collectively accounted for 11–23% of the total IOP energy that the rat eye must withstand daily.
Highlights.
IOP was recorded round-the-clock for several days in conscious freely-moving rats
mean IOP exhibited a diurnal rhythm, while IOP variance did not
transient and sustained IOP fluctuations lasting minutes to hours were identified
sustained IOP fluctuations were often synchronously across recorded animals
fluctuations contributed >15% of daily IOP energy applied to intraocular tissues
Acknowledgements
Authors acknowledge Simon Bello who had collected some of the telemetry data included in the analyses.
Funding
The work was supported by the National Institutes of Health [grant R01 EY027037]
Abbreviations
- IOP
intraocular pressure
- minPP
minimum peak prominence
- minPS
minimum peak separation
Footnotes
Publisher's Disclaimer: This is a PDF file of an unedited manuscript that has been accepted for publication. As a service to our customers we are providing this early version of the manuscript. The manuscript will undergo copyediting, typesetting, and review of the resulting proof before it is published in its final form. Please note that during the production process errors may be discovered which could affect the content, and all legal disclaimers that apply to the journal pertain.
Declaration of Competing Interests
Authors have no relevant financial disclosures
References
- Aptel F, Weinreb RN, Chiquet C, Mansouri K, 2016. 24-h monitoring devices and nyctohemeral rhythms of intraocular pressure. Prog Retin Eye Res. 55, 108–148. [DOI] [PubMed] [Google Scholar]
- Bello SA, Passaglia CL, 2017. A Wireless Pressure Sensor for Continuous Monitoring of Intraocular Pressure in Conscious Animals. Ann Biomed Eng. 45, 2592–2604. [DOI] [PMC free article] [PubMed] [Google Scholar]
- Coleman DJ, Trokel S, 1969. Direct-recorded intraocular pressure variations in a human subject. Arch Ophthalmol. 82, 637–40. [DOI] [PubMed] [Google Scholar]
- Cooper R, Beale D, Constable I, Grose G, 1979. Continual monitoring of intraocular pressure: effect of central venous pressure, respiration, and eye movements on continual recordings of intraocular pressure in the rabbit, dog, and man. British Journal of Ophthalmology. 63, 799–804. [DOI] [PMC free article] [PubMed] [Google Scholar]
- Copt RP, Thomas R, Mermoud A, 1999. Corneal thickness in ocular hypertension, primary open-angle glaucoma, and normal tension glaucoma. Arch Ophthalmol. 117, 14–6. [DOI] [PubMed] [Google Scholar]
- Dinslage S, McLaren J, Brubaker R, 1998. Intraocular pressure in rabbits by telemetry II: effects of animal handling and drugs. Invest Ophthalmol Vis Sci. 39, 2485–9. [PubMed] [Google Scholar]
- Downs JC, Burgoyne CF, Seigfreid WP, Reynaud JF, Strouthidis NG, Sallee V, 2011. 24-hour IOP telemetry in the nonhuman primate: implant system performance and initial characterization of IOP at multiple timescales. Invest Ophthalmol Vis Sci. 52, 7365–75. [DOI] [PMC free article] [PubMed] [Google Scholar]
- Ehlers N, Bramsen T, Sperling S, 1975. Applanation tonometry and central corneal thickness. Acta Ophthalmol (Copenh). 53, 34–43. [DOI] [PubMed] [Google Scholar]
- Feola AJ, Sherwood JM, Pardue MT, Overby DR, Ethier CR, 2020. Age and Menopause Effects on Ocular Compliance and Aqueous Outflow. Invest Ophthalmol Vis Sci. 61, 16. [DOI] [PMC free article] [PubMed] [Google Scholar]
- Ficarrotta KR, Bello SA, Mohamed YH, Passaglia CL, 2018. Aqueous Humor Dynamics of the Brown-Norway Rat. Invest Ophthalmol Vis Sci. 59, 2529–2537. [DOI] [PMC free article] [PubMed] [Google Scholar]
- Ficarrotta KR, Passaglia CL, 2020. Intracranial pressure modulates aqueous humour dynamics of the eye. J Physiol. 598, 403–413. [DOI] [PMC free article] [PubMed] [Google Scholar]
- Grolman B, Myers KJ, Lalle P, 1990. How reliable is the Goldmann tonometer as a standard? J Am Optom Assoc. 61, 857–62. [PubMed] [Google Scholar]
- Jasien JV, Zohner YE, Asif SK, Rhodes LA, Samuels BC, Girkin CA, Morris JS, Downs JC, 2020. Comparison of extraocular and intraocular pressure transducers for measurement of transient intraocular pressure fluctuations using continuous wireless telemetry. Scientific reports. 10, 1–10. [DOI] [PMC free article] [PubMed] [Google Scholar]
- Kim J, Kim M, Lee MS, Kim K, Ji S, Kim YT, Park J, Na K, Bae KH, Kyun Kim H, Bien F, Young Lee C, Park JU, 2017. Wearable smart sensor systems integrated on soft contact lenses for wireless ocular diagnostics. Nat Commun. 8, 14997. [DOI] [PMC free article] [PubMed] [Google Scholar]
- Lee JO, Park H, Du J, Balakrishna A, Chen O, Sretavan D, Choo H, 2017. A microscale optical implant for continuous in vivo monitoring of intraocular pressure. Microsyst Nanoeng. 3, 17057. [DOI] [PMC free article] [PubMed] [Google Scholar]
- Li R, Liu JH, 2008. Telemetric monitoring of 24 h intraocular pressure in conscious and freely moving C57BL/6J and CBA/CaJ mice. Mol Vis. 14, 745–9. [PMC free article] [PubMed] [Google Scholar]
- Lozano DC, Hartwick ATE, Twa MD, 2015. Circadian rhythm of intraocular pressure in the adult rat. Chronobiology International. 32, 513–523. [DOI] [PMC free article] [PubMed] [Google Scholar]
- Mansouri K, Shaarawy T, 2011. Continuous intraocular pressure monitoring with a wireless ocular telemetry sensor: initial clinical experience in patients with open angle glaucoma. British Journal of Ophthalmology. 95, 627–629. [DOI] [PubMed] [Google Scholar]
- Markert JE, Jasien JV, Turner DC, Huisingh C, Girkin CA, Downs JC, 2018. IOP, IOP Transient Impulse, Ocular Perfusion Pressure, and Mean Arterial Pressure Relationships in Nonhuman Primates Instrumented With Telemetry. Invest Ophthalmol Vis Sci. 59, 4496–4505. [DOI] [PMC free article] [PubMed] [Google Scholar]
- McLaren JW, Brubaker RF, FitzSimon JS, 1996. Continuous measurement of intraocular pressure in rabbits by telemetry. Invest Ophthalmol Vis Sci. 37, 966–75. [PubMed] [Google Scholar]
- Miyazaki Y, Matsuo T, Kurabayashi Y, 2000. Immobilization stress induces elevation of intraocular pressure in rabbits. Ophthalmic Res. 32, 270–7. [DOI] [PubMed] [Google Scholar]
- Mohamed Y, Passaglia CL, 2023. A portable feedback-controlled pump for monitoring eye outflow facility in conscious rats. PLoS One. 18, e0280332. [DOI] [PMC free article] [PubMed] [Google Scholar]
- Moore CG, Johnson EC, Morrison JC, 1996. Circadian rhythm of intraocular pressure in the rat. Current Eye Research. 15, 185–191. [DOI] [PubMed] [Google Scholar]
- Méndez-Ulrich JL, Sanz A, Feliu-Soler A, Álvarez M, Borràs X, 2018. Could white coat ocular hypertension affect to the accuracy of the diagnosis of Glaucoma? Relationships between anxiety and intraocular pressure in a simulated clinical setting. Applied Psychophysiology and Biofeedback. 43, 49–56. [DOI] [PubMed] [Google Scholar]
- Nicou CM, Pillai A, Passaglia CL, 2021. Effects of acute stress, general anesthetics, tonometry, and temperature on intraocular pressure in rats. Experimental Eye Research. 210, 108727. [DOI] [PMC free article] [PubMed] [Google Scholar]
- Ruixia Li JHKL, 2008. Telemetric monitoring of 24 h intraocular pressure in consciousand freely moving C57BL/6J and CBA/CaJ mice. Molecular Vision. 14, 745–749. [PMC free article] [PubMed] [Google Scholar]
- Schnell CR, Debon C, Percicot CL, 1996. Measurement of intraocular pressure by telemetry in conscious, unrestrained rabbits. Invest Ophthalmol Vis Sci. 37, 958–65. [PubMed] [Google Scholar]
- Shily BG, 1987. Psychophysiological stress, elevated intraocular pressure, and acute closed-angle glaucoma. Am J Optom Physiol Opt. 64, 866–70. [DOI] [PubMed] [Google Scholar]
- Todani A, Behlau I, Fava MA, Cade F, Cherfan DG, Zakka FR, Jakobiec FA, Gao Y, Dohlman CH, Melki SA, 2011. Intraocular Pressure Measurement by Radio Wave Telemetry. Investigative Ophthalmology & Visual Science. 52, 9573. [DOI] [PubMed] [Google Scholar]
- Tonnu PA, Ho T, Newson T, El Sheikh A, Sharma K, White E, Bunce C, Garway-Heath D, 2005. The influence of central corneal thickness and age on intraocular pressure measured by pneumotonometry, non-contact tonometry, the Tono-Pen XL, and Goldmann applanation tonometry. Br J Ophthalmol. 89, 851–4. [DOI] [PMC free article] [PubMed] [Google Scholar]
- Trevino RC, Majcher CE, Sponsel WE, Villaflor C, Nozicka J, 2020. Repeatability of Goldmann tonometry performed by optometry students on glaucoma patients. Clin Exp Optom. 103, 813–820. [DOI] [PubMed] [Google Scholar]
- Turner DC, Samuels BC, Huisingh C, Girkin CA, Downs JC, 2017. The Magnitude and Time Course of IOP Change in Response to Body Position Change in Nonhuman Primates Measured Using Continuous IOP Telemetry. Invest Ophthalmol Vis Sci. 58, 6232–6240. [DOI] [PMC free article] [PubMed] [Google Scholar]
- Turner DC, Edmiston AM, Zohner YE, Byrne KJ, Seigfreid WP, Girkin CA, Morris JS, Downs JC, 2019a. Transient Intraocular Pressure Fluctuations: Source, Magnitude, Frequency, and Associated Mechanical Energy. Invest Ophthalmol Vis Sci. 60, 2572–2582. [DOI] [PMC free article] [PubMed] [Google Scholar]
- Turner DC, Miranda M, Morris JS, Girkin CA, Downs JC, 2019b. Acute Stress Increases Intraocular Pressure in Nonhuman Primates. Ophthalmol Glaucoma. 2, 210–214. [DOI] [PMC free article] [PubMed] [Google Scholar]
- Whitacre MM, Stein RA, Hassanein K, 1993. The effect of corneal thickness on applanation tonometry. Am J Ophthalmol. 115, 592–6. [DOI] [PubMed] [Google Scholar]
- Zhang J, Kim K, Kim HJ, Meyer D, Park W, Lee SA, Dai Y, Kim B, Moon H, Shah JV, Harris KE, Collar B, Liu K, Irazoqui P, Lee H, Park SA, Kollbaum PS, Boudouris BW, Lee CH, 2022. Smart soft contact lenses for continuous 24-hour monitoring of intraocular pressure in glaucoma care. Nat Commun. 13, 5518. [DOI] [PMC free article] [PubMed] [Google Scholar]