

Abstract
OBJECTIVES:
To evaluate the relationship between early life stress (ELS) and metabolic risk in healthy young adults and assess the role of health behaviors.
METHODS:
Young adults aged 18-40 (N=190) with no medical conditions or medication usage were recruited from the community. Participants with ELS (N=113) had a history of childhood maltreatment and most also experienced parental loss (n=88). Controls (N=77) had no history of maltreatment or parental loss. Standardized interviews and self-reports assessed demographics, adversity, medical/psychiatric history, and health behaviors. Blood pressure and anthropometrics were measured, and fasting plasma assayed for lipid profiles, glucose, insulin level and hemoglobin A1c. We calculated both a clinical cut-point and continuous composite metabolic risk score based on clinical risk factors and the mean of z-scores of each measure respectively.
RESULTS:
ELS was significantly associated with increased clinical cut-point (β=.68, 95% CI .20 to 1.17, p= .006) and continuous (β= .23, 95% CI .08 to .038, p= .003) composite metabolic risk scores. On sensitivity analysis, the association of ELS with the continuous composite metabolic risk score was reduced to a trend after adjusting for a range of psychosocial and health predictors (β = .18, 95% CI .00 to .36, p =.053), with both diet and college graduate status significant in the model.
CONCLUSIONS:
Healthy young adults with a history of ELS have increased metabolic risk scores as compared to controls. This relationship may be partially due to health behaviors and socioeconomic factors. These findings underline that ELS is an early contributor to metabolic risk.
Keywords: Early Life Stress, Childhood Maltreatment, Childhood Adversity, Trauma, Metabolic Syndrome, Cardiometabolic Risk
INTRODUCTION
Early life stress (ELS) is a major risk factor for many illnesses in mid-to-late adulthood, including psychiatric disorders, cardiovascular disease (CVD), and type 2 diabetes mellitus (T2DM) (1). ELS appears to be a particularly potent risk factor for metabolic syndrome (MetS). MetS is a group of physiological conditions including central obesity, hypertension, dyslipidemia, and hyperglycemia, which collectively promote the development of CVD, T2DM, and increase risk for cardiovascular mortality (2–4). A diagnosis of MetS requires 3 of 5 of the following: waist circumference > 40 inches in men, > 35 inches in women; triglycerides > 150 mg/dl; high density lipoprotein C (HDL-C) < 40mg/dl in men, < 50 mg/dl in women; systolic blood pressure ≥ 130 mmHg, diastolic blood pressure ≥ 85 mmHg; fasting glucose ≥ 100 mg/dl (5). With an estimated prevalence of 36.9% among U.S. adults in 2016, MetS is an extremely common health problem and an urgent public health priority (6). Stressors early in life may be particularly influential contributors to MetS because such experiences increase social, behavioral, and physiological risk across the life course (7). There is evidence that ELS increases risk for MetS via multiple physiological pathways, including modifications of neuroendocrine (8), inflammatory (9,10), and cellular aging processes (11) throughout the body.
Research from a variety of disciplines has linked ELS to MetS and other deleterious cardiometabolic outcomes in adults even after adjusting for factors including health behaviors and socioeconomic factors that are known to impact disease outcomes (10,12–14). Most of this work assesses cumulative or aggregate adverse childhood experiences rather than specific types of abuse or neglect given the tendency for adverse experiences in childhood such as abuse and neglect to co-occur (15,16). Through this approach multiple studies have shown that effects of ELS on cardiometabolic risk factors and outcomes may be dependent on the aggregate number of adversity experiences, such that individuals with greater adversity burden are at higher risk of cardiometabolic disease (12). For instance, a 2018 systematic meta-analysis of 37 studies including more than 427,000 individuals indicated that cumulative childhood adversity has a modest significant effect on adult cardiometabolic outcomes (including hypertension, T2DM, and CVD) (13). Another systematic meta-analysis from 2017 that included 37 studies found that exposure to at least four adverse childhood experiences significantly increased health risks compared to individuals without adverse childhood experiences, with modest effect sizes for obesity and type 2 diabetes mellitus, and moderate effect sizes for cardiovascular disease (1).
Numerous studies have also linked ELS to preclinical metabolic risk. These studies have found positive associations between ELS and individual preclinical risk factors in adulthood, including obesity (17,18) and insulin resistance in midlife (19). Most of these studies have focused on populations such as adolescents, middle-aged or older adults, or women only (18,20–22). Studies in adolescents have demonstrated that a history of ELS is associated with an increased risk of obesity, elevated diastolic blood pressure and elevated heart rate, suggesting that some metabolic health effects of ELS begin early in the lifecourse (20,23). Less work has focused on ELS and early signs of cardiometabolic risk in healthy young adults prior to the onset of cardiometabolic disease. Among adults 33-45-years-old in the Coronary Artery Risk Development in Young Adults (CARDIA) study, a one-unit increase in risky family score (a self-report measure assessing the family environment prior to age 18) was associated with a 1.0% higher 10-year coronary heart disease (CHD) risk score(24). In a longitudinal birth cohort study of 1689 young adults, ELS (as measured by the CTQ) was significantly associated with obesity and total cholesterol/HDL-C ratio, and negatively associated with HDL levels while controlling for covariates such as age, depression, and education (25). This study did not include other important measures of metabolic risk, including hemoglobin A1c, blood pressure measurements, or waist circumference. Furthermore, body mass index (BMI) was the primary outcome measure of the study, which is increasingly considered problematic as it reflects muscle mass in addition to adipose tissue, and does not reflect differences across individuals of different racial or ethnic backgrounds (25).
Despite the growing body of evidence demonstrating effects of ELS on cardiometabolic risk earlier in life, there are several important gaps in the current literature to address. First, there has been significant variability in the measurement and definition of ELS used across studies (13). Many studies focus on self-report measures such as the CTQ or checklists with retrospective and subjective assessments of childhood maltreatment (13). One study that used the longitudinal 1958 British birth cohort with a total of 9377 participants found that childhood maltreatment was associated with greater adiposity and worse hemoglobin A1c and blood lipids profiles at age 45 (26). In this study childhood neglect was assessed prospectively via 5 questions, and childhood abuse was measured via three yes/no retrospective self-report questions at age 45 (26). While the prospective assessment of neglect was a strength, the assessment of maltreatment was limited by a small number of non-validated questions (26). In another prospective study of 892 adults in New Zealand, clustering of metabolic syndrome risk markers at age 32 were not significantly predicted by childhood maltreatment, but a history of low socioeconomic status (SES) in childhood or childhood social isolation was significant (10) . Maltreatment was assessed in this study with a combination of prospective behavioral observations and parental reports suggestive of harsh discipline, maternal rejection, and two or more changes in the child’s primary caregiver, as well as retrospective reports of physical or sexual abuse during adulthood. Strengths of this study include the prospective data on parenting behaviors, but the limited and unvalidated nature of the questions about abuse and neglect could account for the lack of a maltreatment effect (10). Alternatively, validated interview-based measures such as the Childhood Experience of Care and Abuse (CECA) interview can offer a more robust approach to ELS assessment that, while limited by retrospective recall, incorporates a breadth of important contributors and may be less affected by reporting bias than self-report measures (27).
The current body of literature also contains inconsistencies in the assessment of additional factors that may be responsible for the association between ELS and cardiometabolic risk, including concurrent adult stress (28,29), symptoms of depression and anxiety (12,30), educational attainment and other socioeconomic factors (31), and health behaviors (32,33). It is well-established that ELS is associated with lower SES (13,34,35), depression and anxiety symptoms (8,10,30), and altered exercise (33,36) and diet behaviors (37). Comprehensive and standardized diet measures in particular have been missing from the literature, which is surprising given that lower quality diets have been linked to both ELS and MetS and may be an important mechanism through which adversity increases cardiometabolic risk (37). The inconsistent assessment of these factors leads to uncertainty about the mechanisms by which ELS contributes to metabolic risk, including through the effect of ELS on health behaviors. Finally, to the best of our knowledge there have not been any studies in healthy young adult populations that have included the complete MetS criteria in their analyses of metabolic risk in this population.
In this study, we examined relationships between ELS and metabolic risk in a sample of young adults without known chronic illness or medications, utilizing the CECA interview, which is a robust and validated interview-based measure of childhood adversity that provides additional important contextual details of exposures, such as the frequency and severity of abuse, along with parental loss, discord or violence (38,39). Additionally, we utilize a comprehensive assessment of metabolic risk, including all the measures included in the National Cholesterol Education Program Adult Treatment Panel III (NCEP ATP III) diagnostic criteria for MetS along with additional measures of metabolic function, including hemoglobin A1c, LDL and total cholesterol (5). We also examine whether a history of ELS is associated with changes in insulin resistance as measured by the Homeostatic Model Assessment of Insulin Resistance (HOMA-IR). Sensitivity analyses adjust for a range of important psychosocial and behavioral factors, including age, sex assigned at birth, adult stress, physical activity, diet quality, college graduate status, minoritized group status, and symptoms of anxiety and depression.
MATERIALS & METHODS
2.1. Participants
This study included a subsample of participants enrolled in the Lifestyle Influences of Family Environment (LIFE) study. Participants (N=190) were young adults, aged 18-40, recruited via internet and community advertisements seeking healthy individuals raised in stable two-parent households or those with ELS. Prospective participants were assessed for eligibility via phone screen. Prior to enrollment, participants were informed about the study and voluntary written informed consent was obtained. The study was approved by the Butler Hospital Institutional Review Board.
Participants in the ELS group experienced at least one form of moderate-severe childhood maltreatment before the age of 18. including physical, emotional or sexual abuse and neglect. Most also had childhood parental loss, and some experienced inter-parental violence (See 2.3 Measures and 3.2 Adversity Characteristics). Those in the control group were raised in two-parent homes and had no history of parental separation or divorce, and had no major history of childhood maltreatment, parental loss, or psychiatric disorders. The sample was selected to exclude individuals with diagnosed medical conditions or medication use to avoid confounding related to illness and medications and to target examination of specific physiological effects of childhood adversity in healthy individuals. Participants with acute and chronic medical conditions, pregnancy, and the use of prescription medications other than hormonal contraceptives were excluded. Participants were queried about recent exposures, and those with major acute stressors, illness, or sleep loss were rescheduled to a time when behaviors and exposures were at baseline. Positive drug screens were initially exclusionary, but in order to support recruitment of eligible participants, part way through the study this criterion was adjusted to allow the inclusion of ELS participants who frequently used marijuana (e.g., reported using 3 or more times per week or tested positive for THC, n =17), and n=1 control participant also tested positive for THC. Individuals with primary bipolar disorder, obsessive-compulsive disorder (OCD), and psychotic disorders were excluded. For a full description of the sampling methods, please refer to Daniels et al. 2023 (40) A total of 220 participants enrolled in the study and met study inclusion/exclusion criteria. The final sample size of 190 was obtained after excluding participants who did not have usable blood samples, data for ELS group determination, or metabolic laboratory values. All data and analysis code are available upon request from the first author.
2.2. Procedures
Study timeline.
All data for the LIFE study was collected between October 2014 and March 2020. Individuals who met study inclusion criteria participated in three study visits, each approximately one week apart. Consent, medical history, anthropometrics, the fasting blood draw, self-report measures and the SCID-V interview were obtained during visit 1. The CECA interview was conducted during visit 2. The ASA24 dietary recall measure was assessed during both visit 2 and visit 3.
Blood collection.
Participants fasted from all food and drink (except water) starting at 8:00 PM the evening prior to blood collection. Venipuncture was performed the next morning between 8:15 AM and 9:00 AM by a trained phlebotomist or research nurse using standard phlebotomy practices. Blood was collected from the antecubital region in two 10ml SST tubes, one silicone coated, and one EDTA tube using an evacuated system with 23- to 21-gauge butterfly needles. Samples were homogenized by inverting the tubes 5 to 10 times. The samples were stored at 4°C and sent to the Woman and Infants Core Clinical Laboratory (Providence, RI) for processing.
Metabolic assays:
Assays were performed in the Women and Infants Core Clinical Laboratory (Providence, RI). Total cholesterol enzymatic assay was performed on the Architect Ci4100 analyzer (Abbott Laboratory, Chicago IL) using the Abbott cholesterol total reagent with a range of detection of 5.0mg/dl-705mg/dl. HDL cholesterol was assayed via accelerator selective detergent on the Architect Ci4100 using the Abbott HDL Ultra reagent, with a range of detection of 5mg/dl-117.0mg/dl. Triglyceride level was assayed via glycerol phosphate oxidase on the Architect Ci4100 analyzer (Abbott Laboratory, Chicago IL) using the Abbott triglyceride reagent, with a range of detection of 5.0mg/dl-1226mg/dl. Hemoglobin A1C % was assayed via HPLC with a boronate column on the Premier Hb9210 analyzer (Trinity Biotech, Kansas City MO) with a range of detection of 3.8%-18.5%. Glucose level was assayed on the Architect Ci4100 analyzer (Abbott Laboratory, Chicago IL) via hexokinase/G-6- PDH using the Abbott glucose reagent, with a range of detection of 5.0mg/dl- 800mg/dl. Fasting insulin level was assayed using the Beckman Coulter Access Ultrasensitive Insulin Reagent on the UniCel Dxl 600 analyzer (Beckman Coulter, Inc., Brea, CA, USA). The range of detection was 1-300 μIU/mL, with an intra-assay CV of 2.2% and inter-assay CV of 3.6%.
2.3. Measures
Demographics, past medical history, and health behaviors.
Age, sex assigned at birth, race, ethnicity, household income, and college graduate status were obtained by participant self-report. Participants were queried about any current or prior medical problems, medication use, alcohol use, pack-years of smoking, and other drug consumption. To capture some effects of systemic racism and discrimination, we included a composite minoritized group variable that incorporates individuals who identified as Black/African American, Asian, American Indian or Alaska Native, Hispanic/Latino, or more than one race.
Assessment of early adversity and adult stressors.
Participants were included in the ELS and control groups based on information provided from the CECA interview, a validated semi-structured interview that assesses 8 objectively defined indices of adversity, including physical abuse, sexual abuse, psychological abuse, antipathy, parental neglect, as well as childhood maternal or parental loss, and violence between parents/caregivers (38,39). For the purposes of this study, we combined the maternal and paternal loss indices into one category labeled “parental loss.” The CECA interview has an inter-rater reliability that ranges from 0.82 to 1.0. Construct validity has been shown in two separate samples of adult sisters with an 84-94% agreement between sisters for the presence or absence of childhood maltreatment (38,39). The CECA was conducted by a trained interviewer and scores were independently reviewed by a second trained interviewer. Consensus scoring was used for unclear cases following discussion in a group format. For participants with missing data on the CECA, data from telephone screens and the Childhood Trauma Questionnaire (42) were used to determine the presence of maltreatment and parental loss. All subjects in the ELS group experienced at least one form of moderate to marked maltreatment occurring prior to age 18, according to the CECA interview. To disentangle effects of adult stressors from those of childhood adverse experiences, we also collected measures of adult stressors with the Stressful Life Experiences Questionnaire (SLEQ). This is a 17 item self-report questionnaire developed in our lab that assesses exposure since age 18 to a variety of traumatic events, including life threatening illnesses or accidents, traumatic bereavement, financial stress, sexual assault, physical abuse, among others.
Assessment of psychiatric and health behaviors.
Psychiatric diagnoses were assessed using the Structured Clinical Interview for the DSM-5 (SCID-5-RV Version 1.0.0). Prior to the release of the SCID5, a subset of participants (n = 29) were assessed using the Mini-International Neuropsychiatric Interview for the DSM-IV (M.I.N.I.) (43), which was modified to included information for DSM-5 diagnoses. Symptoms of depression were assessed using the Inventory of Depressive Symptomatology Self Report (IDS-SR) (44). Symptoms of anxiety were assessed with the Beck Anxiety Inventory (BAI) (45). The General Practice Physical Activity Questionnaire-Physical Activity Index (GPPAQ-PAI) was used to assess typical exercise levels of participants. It provides a four-level physical activity index (46). Dietary intake data in a subset of 120 participants were collected using the Automated Self-Administered 24-hour (ASA24) Dietary Assessment Tool (versions 2014 and 2016), which was developed by the National Cancer Institute (47,48). The total Healthy Eating Index (HEI) (49) was calculated based on the ASA24 for each participant as a measure of diet quality. For more details on dietary measures, please see Marquez et al. 2021 (37).
Measures of Metabolic Risk, Insulin Resistance and Anthropometrics.
Height and weight were measured in the laboratory using a standard scale and SECA stadiometer (Chino, CA). Waist circumference (inches) was measured by trained research staff using a tape measure midway between the lowest rib and iliac crest. Waist-to-height ratio was calculated by dividing the waist circumference by height in inches. Blood pressure (mmHg) was measured using a sphygmomanometer by a trained technician or research nurse. Laboratory measures of metabolic risk (total cholesterol, HDL cholesterol, triglycerides, hemoglobin A1c, fasting glucose, and fasting insulin) were obtained via the procedures outlines in methods section 2.2 Procedures.
Metabolic risk was calculated using two complementary methods. In order to capture incremental risk in this sample of healthy young people, we first calculated a continuous metabolic composite risk score using the sum of the mean z-scores (sample value – mean)/standard deviation) for each measure (waist-to-height ratio, systolic and diastolic blood pressure, triglycerides, total cholesterol, LDL cholesterol, fasting plasma glucose, and hemoglobin A1c). Of note, the HDL cholesterol mean z-score was subtracted in this calculation as higher HDL z-scores are associated with lower MetS risk. Previous studies have demonstrated that z-score composites of MetS risk reliably predict cardiometabolic outcomes (50,51).
Next, we asked whether the ELS group was associated with an increase in the number of participants meeting the criterion for increased metabolic risk using clinical cut-points based on the National Cholesterol Education Program Adult Treatment Panel III (NCEP ATP III) and typical clinical practice (5). The following values were considered indicative of elevated metabolic risk: waist circumference > 40 inches in men and > 35 inches in women; systolic blood pressure ≥ 130mmHg; diastolic blood pressure ≥ 85mmHg; triglycerides ≥ 150 mg/dL; HDL cholesterol < 40 mg/dL in men and < 50 mg/dL in women; LDL cholesterol ≥ 130; total cholesterol > 200; fasting plasma glucose ≥ 100 mg/dL; and hemoglobin A1c ≥ 5.7 (5). A clinical cut-point composite metabolic risk score was calculated for each participant based on the total number of measures meeting clinical criteria for elevated metabolic risk. Insulin resistance was computed using the Homeostatic Model Assessment for Insulin Resistance (HOMA-IR) (52). This is calculated using the equation fasting serum insulin (μU/ml) × fasting plasma glucose (mmol l−1)/22.5) (53).
2.4. Statistical Analyses
All analyses were conducted and all figures were prepared using R Studio(54). Missing data diagnostics showed 7% of the data were missing for the GPPAQ-PAI physical activity scale, and 36.8% were missing the HEI score as it was added to the protocol after the start of the study. CECA adversity subtype data were missing for 6.3% of participants and subtype data was extracted from other measures as described in methods section 2.3 Measures. A total of 0.5% of participants (n=10) reported smoking cigarettes but were missing pack-year data. All other variables used in the analysis had complete data with no missing values. A full information maximum likelihood (FIML) estimation was used to create models in the setting of missing data. Data and statistical outputs are available upon request.
ELS and control group differences in demographics, psychiatric, and health variables were compared using Chi square, Fisher’s exact test, and two-sided T-tests as appropriate. The central analysis of this project involved examination of the relationship between the ELS group and controls regarding the continuous and clinical cut-point composite metabolic risk scores. These were examined using linear regression models, with each respective risk score as the dependent variable. Each model adjusted for the covariates of age and sex assigned at birth, as supported by literature (55). In the event of a significant model, a) sensitivity analyses were conducted to control for demographic, behavioral, and psychiatric symptom variables that differed between groups in the bivariate analyses, and b) the relationship between ELS group and each individual measure of metabolic risk was explored using ANCOVAs. Finally, group differences in the number of participants meeting the clinical cut-points for each measure were examined using logistic regression models, controlling for age and sex.
Given that diet score and college graduate status became significant in the sensitivity analysis of the continuous composite metabolic risk score, we conducted exploratory analyses examining the indirect effects of diet scores and college graduate status on the relationship between ELS group and the continuous composite metabolic risk score. This was analyzed with 1000 bootstrap replications using the Lavaan mediation package in R (56) with both age and sex assigned at birth as covariates in the models.
Finally, the effect of ELS on insulin resistance, which is not typically available as a measure of MetS, was examined using a linear regression model, adjusting for age and sex assigned at birth. In the event of a significant model, sensitivity analyses were conducted to control for demographic, behavioral, and psychiatric symptom variables that differed between groups in the bivariate analyses.
RESULTS
3.1. Sample characteristics
The demographic characteristics of the ELS and control groups are reported in Table 1. There were no significant differences in age or sex assigned at birth between the ELS and control groups. Participants in the ELS group were more likely to identify as Hispanic and less likely to have obtained a college degree than those in the control group. The number of individuals who identified as a member of a minoritized group did not differ significantly between the ELS group and controls.
Table 1:
Sample characteristics
| Control Group N = 77 | ELS Group N = 113 | p-value | |
|---|---|---|---|
| Demographics | |||
| Age, M (SD) | 26.8 (5.5) | 27.7 (5.7) | .29 |
| Sex (% female) | 67.53 | 69.02 | .95 |
| Race, n (%) | |||
| American Indian or Alaska Native | 0 (0) | 4 (3.5) | |
| Asian | 9 (11.7) | 4 (3.5) | |
| Black or African American | 7 (9.1) | 13 (11.5) | |
| White | 59 (76.6) | 69 (61.1) | |
| More than one race | 2 (2.6) | 14 (12.4) | |
| Unknown | 0 (0) | 9 (8) | |
| Ethnicity, n (%) Hispanic | 6 (7.8) | 26 (23) | .011 * |
| Minoritized group status, n (%) | 24(31.2) | 51(45.1) | .053 |
| College degree, n (%) | 58 (75.3) | 48 (42.5) | < .001 *** |
| Stress and Psychiatric Measures | |||
| SLEQ, M (SD) | 1.2 (1.3) | 3.7 (2.7) | < .001 *** |
| BAI, M (SD) | 1.8 (3.1) | 7.5 (8.6) | < .001 *** |
| IDS-SR, M (SD) | 6 (4.6) | 17.9 (12) | < .001 *** |
| Health Measure | |||
| Pack-years of smoking, M (SD) ‡ | 0.07 (0.4) | 1.3 (3.6) | .004 ** |
| GPPAQ-PAI, M (SD) | 3.1 (1) | 3 (1.2) | 0.3 |
| HEI†, M (SD) | 57.4 (11.1) | 52.3 (13.4) | .024 * |
Significant at the .05 level
Significant at the .01 level
Significant at the .001 level
n = 180 for the pack-years of smoking measure
n = 120 for the HEI measure
ELS = Early Life Stress; SLEQ = Stressful Life Experiences Questionnaire; BAI = Beck Anxiety Inventory; IDS-SR = Inventory of Depressive Symptomatology Self Report; GPPAQ-PAI = The General Practice Physical Activity Questionnaire - Physical Activity Index; HEI = Healthy Eating Index
Statistical tests to determine p were χ2 tests for sex assigned at birth, ethnicity, minoritized group status, and college graduate status; Two-sided T-tests were used for continuous variables.
3.2. Adversity Characteristics
The ELS group had a high level of childhood adversity, with 72.6% experiencing 4 or more moderate-marked CECA adversity subtypes, 91.2% experiencing 3 or more moderate-marked adversity subtypes, and 98.2% experiencing 2 or more moderate-marked adversity subtypes. The mean number of adversity subtypes experienced in the ELS group was 4.79 out of 7 possible subtypes. Individuals in the control group did not experience any of the CECA adversity subtypes. The frequencies of moderate-marked CECA adversity subtypes in the ELS group were as follows: 90.1% parental antipathy, 81.8% neglect, 69.1% physical abuse, 44.7% sexual abuse, 52.8% psychological abuse, 36.2% parental/caregiver violence, and 77.9% experiencing parental loss.
3.3. Psychiatric and Health Characteristics
Psychiatric and health characteristics of the ELS and control groups are reported in Table 1. Participants in the ELS group had significantly higher levels of adult stress exposures on the SLEQ. They also reported greater severity of symptoms of anxiety and depression, as measured by the BAI and IDS-SR, respectively. Participants in the ELS group had more pack-years of smoking. HEI total score was significantly greater in the control group, indicating a healthier diet. There were no significant differences in exercise based on the GPPAQ-PAI.
3.4. Continuous composite metabolic risk scores and individual measure z-scores
In the linear regression model for the continuous composite metabolic risk score, participants in the ELS group had a higher mean continuous composite metabolic risk score (B = .23, 95% CI .08 to .038, p = .003). Both female sex (B = −.34, 95% CI −.49 to −.18, p <.001) and age (B = .02, 95% CI .01 to .04, p <.001) were significant within the model (See Supplemental Digital Content, Table S1). Figure 1 shows the mean continuous composite metabolic risk score by group. With the sample size of n=190, power was calculated to be 0.87 for this model. When examining each individual measure of metabolic risk, participants in the ELS group had significantly higher waist-to-height ratio (F(df) = 6.94(186), p = .009), systolic blood pressure (F(df) = 5.6(186), p = .019), diastolic blood pressure (F(df)= 4.23(186), p = .041), and hemoglobin A1c (F(df) = 7.39(186), p = .007). HDL levels were significantly lower in the ELS group (F(df) = 7.39(186), p = .007). No differences were observed in triglycerides, total cholesterol, LDL, or glucose. Table 2 shows the mean and standard deviations for the individual continuous measures of metabolic risk. Figure 2 depicts the mean z-scores of each metabolic risk measure by group to show a pattern of risk across the range of MetS components.
Figure 1.
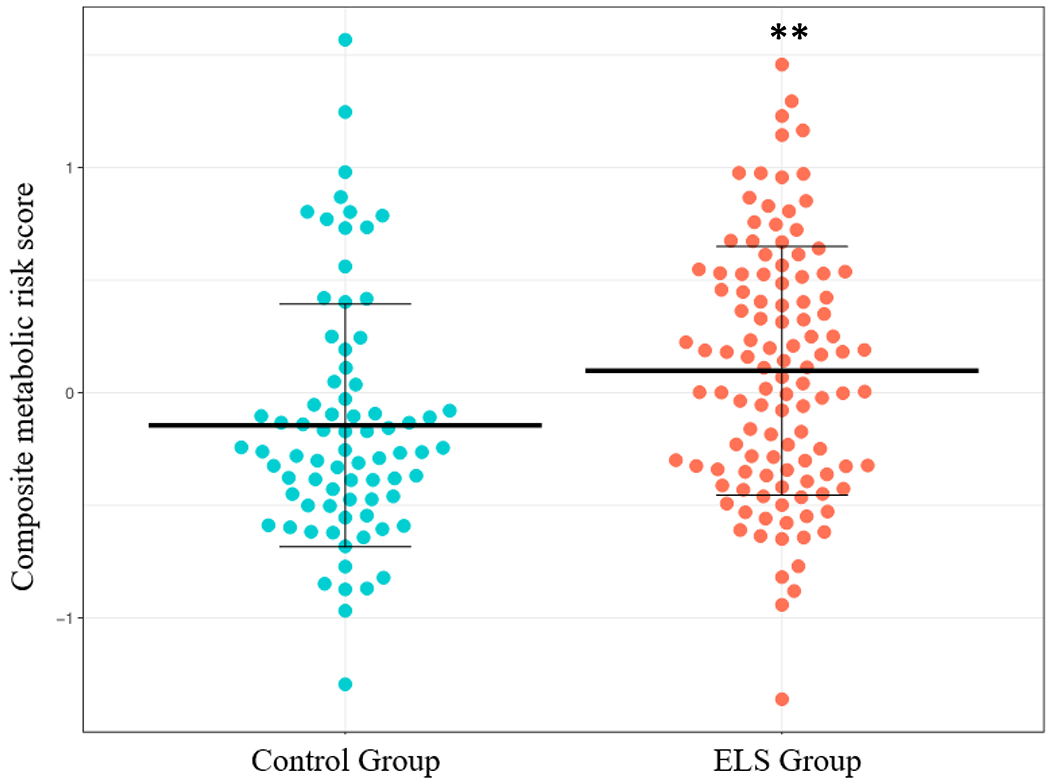
Mean Continuous Composite Metabolic Risk Score by ELS Group. Note that this reflects the mean values prior to adjusting for age and sex.
ELS = Early Life Stress
** Significant at the .01 level
Table 2:
Individual Measures of Metabolic Risk using both Binary Clinical Cut-points and Continuous Measures
| Control Group N = 77 | ELS Group N = 113 | F(df) | p-value | |
|---|---|---|---|---|
| Continuous Measures, M (SD) | ||||
| Waist-to-height ratio | .48 (.08) | .52 (.1) | 6.94 (186) | .009 ** |
| Systolic blood pressure | 125 (13.3) | 129 (13.1) | 5.6 (186) | .019 * |
| Diastolic blood pressure | 72 (8.4) | 75 (8.3) | 4.23 (186) | .041 * |
| Triglycerides | 90 (50.9) | 93 (46.5) | .18 (186) | .67 |
| Total cholesterol | 179 (29.7) | 179 (33.7) | 0 (186) | .99 |
| LDL cholesterol | 103 (25) | 108 (29.3) | 1.3 (186) | .26 |
| HDL cholesterol | 58 (13.7) | 52 (13.8) | 7.39 (186) | .007 ** |
| Fasting glucose | 81 (9) | 82 (8.2) | 2.2 (186) | .14 |
| Hemoglobin a1c | 5.16 (.28) | 5.27 (.30) | 7.39 (186) | .007 ** |
| Control Group N = 77 | ELS Group N = 113 | Z(df) | p-value | |
| Binary Measures Using Metabolic Syndrome Criteria and Clinical Cutoffs†, n (%) | ||||
| Waist Circumference | 14 (18) | 37 (33) | 2.1 (186) | .036 * |
| Systolic blood pressure | 26 (34) | 57 (50) | 2.4 (186) | .016 * |
| Diastolic blood pressure | 6 (8) | 14 (12) | .87 (186) | .38 |
| Triglycerides | 8 (10) | 11 (10) | −.22 (186) | .83 |
| Total cholesterol | 16 (21) | 28 (25) | .57 (186) | .57 |
| LDL cholesterol | 10 (13) | 26 (23) | 1.6 (186) | .11 |
| HDL cholesterol | 13 (17) | 37 (33) | 2.38 (186) | .018 * |
| Fasting glucose | 3 (4) | 3 (3) | −.69 (186) | .49 |
| Hemoglobin A1c | 3 (4) | 14 (12) | 1.82 (186) | .068 |
Significant at the .05 level
Significant at the .01 level
Significant at the .001 level†
The following criteria were used for cutoffs based on clinical literature and metabolic syndrome criteria: waist circumference > 40 inches in men and > 35 inches in women; systolic blood pressure ≥ 130mmHg; diastolic blood pressure ≥ 85mmHg; triglycerides ≥ 150 mg/dL; HDL cholesterol < 40 mg/dL in men and < 50 mg/dL in women; LDL cholesterol ≥ 130; total cholesterol > 200; fasting plasma glucose ≥ 100 mg/dL; and hemoglobin A1c ≥ 5.7
Statistical tests to determine p were ANCOVAs for the continuous measures and logistic regression models for the binary measures.
Figure 2:
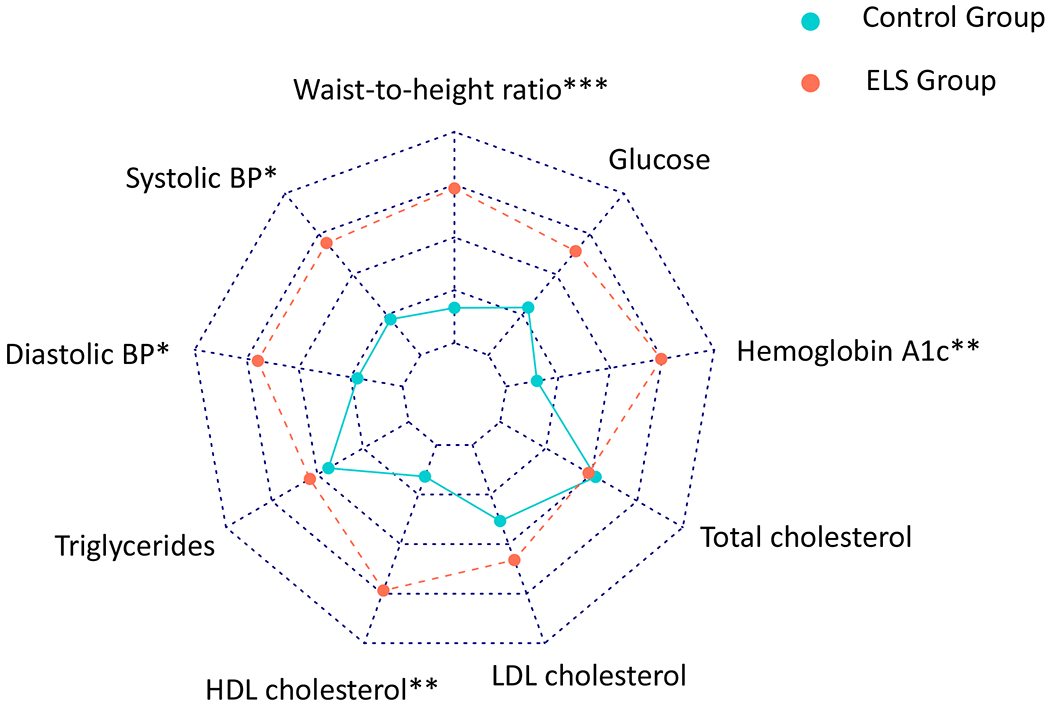
Mean z-scores for each individual metabolic risk measure in the ELS group as compared to controls. Higher mean z-scores of all measures with the exception of HDL cholesterol are associated with higher metabolic risk. Higher mean HDL is associated with lower metabolic risk.
ELS = Early Life Stress
* Significant at the .05 level
** Significant at the .01 level
*** Significant at the .001 level
3.5. Clinical cut-point composite metabolic risk scores and individual measures based on cut-points
In the linear regression model for the clinical cut-point composite metabolic risk score, participants in the ELS group had a significantly higher metabolic risk score (B = .68, 95% CI .20 to 1.17, p = .006). With a sample size of n=190, power was calculated at 0.83 for this model. Age was also significant within the model (B =.05, 95% CI .01 to .09, p = .018) (See Table S1). The ELS group had a significantly higher number of participants with a waist circumference (Z(df)= 2.1, p = .036) or systolic blood pressure (Z(df)) = 2.4, p = .016) above the cut-points outlined in the criteria for MetS defined by the NCEP ATP III. The ELS group was also significantly more likely to have an HDL <40 for men and <50 for women (Z(df) = 2.38, p = .018). There were no significant differences between groups for any of the other individual measures of metabolic risk if looking at clinical cut-points (diastolic blood pressure, triglycerides, total cholesterol, LDL cholesterol, glucose, and hemoglobin A1c). Table 2 shows the percentage of participants above the clinical cut-points for each individual metabolic risk measure by group.
3.6. Sensitivity analyses
Sensitivity analyses were conducted to rule out effects related to other potential contributors to cardiometabolic risk within the sample by including age, sex assigned at birth, adult stress, physical activity, diet quality, college graduate status, minoritized group status, and symptoms of anxiety and depression as covariates in each model (See Supplemental Digital Content, Table S2). In the linear regression model using the continuous composite metabolic risk score, the strength of the observed relationship between ELS group and the mean continuous composite metabolic risk score was reduced to a trend, with diet score and college graduate status both significant in the model (for diet: B = −.01, 95% CI −.017 to −.002, p = .010; for college graduate status: B = −.20, 95% CI −.35 to −.04, p = .015). ELS no longer remained a significant predictor of mean metabolic z-score (B = .18, 95% CI .00 to .36, p =.053). Sex assigned at birth and age were also significant within this model (for female sex: B = −.23, 95% CI −.4 to −.07, p =.006; for age: B = .02, 95% CI .01 to .04, p =.001), suggesting that female sex at birth is associated with lower continuous metabolic composite risk, and metabolic risk increases with age. Adult stress, depressive symptoms, minoritized group status, anxiety symptoms, exercise, and pack-years smoking were not significant predictors in the model.
In the linear regression model using the clinical cut-point composite metabolic risk score, the relationship between the metabolic risk score and ELS did not appreciably change (B = .78, 95% CI .18 to 1.37, p = .011). Age was also significant within this model (B = .06, 95% CI .01 to .10, p = .012). Adult stress, sex assigned at birth, minoritized group status, anxiety and depressive symptoms, exercise, pack-years of smoking, diet score and college graduate status were all nonsignificant within the model.
3.7. Indirect Effects of Diet Scores and College Graduate Status in the Relationship Between ELS Group and the Continuous Composite Metabolic Risk Score
Given that the sensitivity analyses identified both diet score and college graduate status as significant predictors of the continuous composite metabolic risk score, we examined them as potential mediators of the relationship between ELS group and the continuous composite metabolic risk score controlling for age and sex assigned at birth. There was a significant indirect effect of ELS on the continuous composite metabolic risk score via diet score (ACME: b = .051, 95% CI [.005, .122]). The residual direct effect of ELS on the continuous composite metabolic risk score remained significant (ADE: b = .176, 95% CI [.012, .33]). Both the “a” pathway from ELS to the HEI score (b = −5.54, 95% CI [−9.966, −1.291]) and “b” pathway from the HEI score to the composite metabolic risk score (b = −.009, 95% CI [−.016, −.002]) were significant. There was also a significant indirect effect of ELS on the continuous composite metabolic risk score via college graduate status (ACME: b = 1.057, 95% CI [.091, 2.419]). The residual direct effect of ELS on the continuous composite metabolic risk score remained significant (ADE: b = .161, 95% CI [.01, .319]). Both the “a” pathway from ELS to college graduate status (b = −5.511, 95% CI [−9.915, −1.88]) and “b” pathway from college graduate status to the composite metabolic risk score (b = −.192, 95% CI [−.345, −.039]) were significant.
3.8. Insulin Sensitivity and ELS
HOMA-IR was significantly higher in the ELS group (B= .68, CI .18 to 1.18, p = .006). With the sample size of n=190, power was calculated to be 0.88 for this analysis. When examining the same model including additional covariates (symptoms of anxiety and depression, exercise, diet score, pack-years of smoking, minoritized group status, and college graduate status), the association between HOMA-IR and ELS was reduced to a trend (B= .57, CI −.05 to 1.17, p = .075). Exercise was significant in this model, with more exercise associated with lower HOMA-IR (B= −.26, CI −.49 to −.03, p = .026).
DISCUSSION
The findings presented here indicate that healthy young adults with a history of ELS have increased metabolic risk scores and also meet the clinical criteria for risk in several of the independent MetS domains. The association between ELS group and the clinical cut-point metabolic risk score remained significant even after adjusting for age, sex assigned at birth, adult stress, symptoms of anxiety and depression, exercise, college graduate status, minoritized group status, pack-years of smoking and diet quality. The association between ELS group and the continuous metabolic risk score was reduced to a trend when adjusting for these other factors, with age and sex assigned at birth significant in the model. We also found that insulin resistance, as measured by HOMA-IR, was significantly greater in participants in the ELS group as compared to controls, but this was also reduced to a trend when adjusting for potential confounding psychosocial and behavioral factors, including a significant protective effect of exercise.
This study adds to a growing body of literature that has identified ELS as a contributor to cardiometabolic risk in young adults and is among the first to examine metabolic risk in this population using a more complete risk assessment, including all the components of MetS criteria and additional other clinical risk factors such as hemoglobin A1c and LDL cholesterol. Most prior studies in young adults have examined either individual risk factors (25,26) or the clustering of a few metabolic risk factors (10)rather than using composite metabolic risk scores. The clinical cut-point metabolic risk score was designed to include each individual component of MetS criteria, in addition to hemoglobin A1c, all of which are individually associated with insulin resistance and elevated risk of cardiovascular disease and type II diabetes mellitus (5) . The use of a continuous composite metabolic risk score in addition to a clinical cut-point composite metabolic risk score adds significant value to the literature as it detects pre-clinical metabolic risk differences in metabolic health that might not meet MetS criteria cut-points. This is important as the risk associated with each individual measure is likely continuous in nature, and thus dichotomizing individual measures results in lost information. This can result in either underestimation or overestimation of risk, such that small changes in individual measures may result in large changes in the composite risk score, despite little change in actual risk (50). This may be partially why the continuous composite metabolic risk score was reduced to a trend on sensitivity analysis, but the clinical cut-point metabolic risk score remained significant. Furthermore, prior cohort studies have demonstrated that composite metabolic risk z-scores can be associated with a higher risk of ischemic stroke and coronary heart disease over the spectrum of MetS severity, suggesting that the information gained from using continuous MetS risk scores are directly relevant to future health outcomes (51,57).
The significant main effect of ELS on HOMA-IR is consistent with prior literature linking ELS with both diabetes and glucose intolerance (58,59). That this effect was reduced to a trend level when controlling for covariates, including significant effects of exercise, suggests that behavioral factors such as exercise may be important for counteracting effects of ELS on risk for T2DM (60). These findings may be important for understanding and developing clinical targets and interventions in patients with a history of ELS prior to the onset of cardiometabolic disease.
Examination of the individual measures of metabolic risk demonstrated that individuals in the ELS group had significantly higher waist-to-height ratio, systolic blood pressure, diastolic blood pressure, and hemoglobin A1c. The ELS group also had significantly lower HDL levels. Participants with a history of ELS were also more likely to have a waist circumference and systolic blood pressure above and HDL levels below the NCEP ATP III-defined clinical cut-points for MetS. These results are consistent with prior studies that have demonstrated an association between ELS and obesity and increased adiposity, lower HDL levels, higher diastolic blood pressure, and higher hemoglobin A1c in adolescence through mid adulthood (20,23,25,26). Measures of increased adiposity are among the most consistently reported metabolic risk factors associated with ELS, likely due to altered hypothalamic-pituitary-adrenal axis function(8,23), chronic inflammation (10), and health behaviors such as lower dietary quality (37).
Given that diet score and college graduate status were both significant in the sensitivity analysis for the continuous composite metabolic risk score, we conducted exploratory mediation analyses which demonstrated that both diet score and college graduation status had indirect effects on the relationship between ELS and the continuous composite metabolic risk score. The indirect effect of education is unsurprising, as college graduation status is a component of SES and a well-established contributor to cardiometabolic outcomes in the context of ELS (13). Childhood adversity is known to predict lower educational attainment, which in turn is correlated with an increased risk of developing cardiometabolic disease (34,61,62). It is proposed that educational attainment affects health via mechanisms such as higher income, healthier lifestyle choices, and greater psychosocial resources (62). The indirect effect of diet scores on the relationship between ELS and the continuous composite metabolic risk score is also consistent with prior literature. ELS has been associated with an unhealthy diet as early as adolescence, which is hypothesized to be secondary to increased palatability and cravings for sugary or fatty foods (32,37,63). Failing to account for diet quality as a factor in metabolic risk studies may result in overestimation of the independent effects of ELS on metabolic risk and neglects a potential avenue for intervention. It should be noted as well that diet is a structural determinant of health and is independently related to health outcomes, including diabetes (35). Individuals with a history of ELS may face food insecurity or reduced access to healthy food options which may be one pathway through which ELS impacts diet and metabolic risk (64).
This study adjusts for important psychosocial and behavioral factors known to be associated with both ELS and metabolic risk, including diet quality, physical exercise, age, sex assigned at birth, pack-years smoking, college graduation status, adult stress, and symptoms of depression and anxiety. Diet quality in particular is not consistently adjusted for in the current literature, despite being related to both ELS and metabolic risk. Furthermore, our focus on healthy young adults without known medical conditions or medication use indicates that ELS is associated with increased metabolic risk and insulin resistance prior to the onset of clinically recognized cardiometabolic disease.
An additional strength of this study includes the use of the CECA interview for the evaluation of ELS. As previously noted, there has been significant variability in the measurement and definition of ELS used in the literature (13), which makes it more difficult to disentangle the effects of ELS on health. The CECA is a standardized interview-based approach to the retrospective assessment of ELS. Scoring is based on objective behaviors and impact on the participant. For example, in scoring the presence and severity of physical violence, the precise nature and frequency of the behavior(s), and the impact on the participant (e.g., requiring medical care) are elicited and considered. While few studies have directly compared the CECA to other questionnaire-based measures, it has been proposed that subjective questionnaire-based measures such as the CTQ and ACE Study Questionnaire may be subject to underreporting due to normalization of adverse experiences in individuals with histories of childhood adversity (65). The retrospective nature of the CECA interview renders it subject to recall bias (66), however this is likely a greater problem with self-report measures as they do not allow follow-up questions or clarification (27).
This study is limited by its moderate sample size, and retrospective, observational design, which can lend itself to confounding by other uncontrolled factors such as genetics and prenatal exposures. While we controlled for many potential factors that can contribute to metabolic risk, we did not include a more direct or objective measure of childhood SES, which is well-known to impact adult metabolic risk and cardiometabolic outcomes (13,34). It should also be noted that while race was included in the demographic measures, there was insufficient representation across groups to examine the relationship between race, ELS and metabolic risk. While we incorporated a dichotomized minoritized group status variable into our sensitivity analysis, this likely does not fully capture the effects of race. There is also a fundamental difference between examining the effects of race and effects of racism, such that while examining race alone may reveal disparities in health risk factors and outcomes, studying the impacts of the differential experiences of racism may lead to important mechanistic insights that are more actionable. For example, interpersonal discrimination and racism, as well as structural racism, may be significant contributors to metabolic risk as both perceived every day and lifetime discrimination are associated with higher MetS severity and risk for other cardiometabolic health outcomes (67,68). Furthermore, some of the factors that impacted the continuous composite metabolic risk score in this study, including education and diet, are known to be disparate between different racial groups and significantly impacted by structural and interpersonal racism (69). This underlines the need for further work in these areas, specifically including the direct assessment of discrimination-based stressors.
CONCLUSION
Healthy young adults with a history of ELS had increased metabolic risk compared to controls using metabolic risk scores based on both continuous and clinical cut-point indices. These findings persisted for the clinical cut-point metabolic risk score even after adjusting for factors such as adult stress, symptoms of anxiety and depression, exercise, diet score, pack-years smoking, and college degree attainment. In sensitivity analyses we found that the relationship between ELS and the continuous metabolic risk score was reduced to a trend, with both diet and college graduate status significant in the model. The significant effect of ELS on HOMA-IR was also reduced to trend level when controlling for covariates, with exercise becoming significant in the model. This study emphasizes the importance of considering ELS as a contributor to future metabolic risk even in healthy young adults. Interventions should focus on policies to reduce structural and community factors that contribute to ELS such as poverty, food insecurity, community violence, and racism, along with more immediately accessible interventions in the health care setting (70). Parenting support and mental health services are critical; for example, provider-patient mentorship and coaching has the potential to strengthen parental self-regulation and mental health, which may help promote resilience in their children (71). Targeted screening for early metabolic risk factors in young adults with a history of ELS may be beneficial, although the literature in this area is limited. Future work exploring potential early interventions in these populations to reduce morbidity and mortality due to cardiometabolic disease is essential.
Supplementary Material
Conflicts of Interest and Sources of Funding
The authors declare no conflicts of interest. This work was supported by National Institutes of Health grants R01MH101107 (ART) and Dr. Tyrka’s time was additionally supported by P20GM139767 and R21AG077332. Dr. Teresa Daniels and Dr. Meghan Kulak received support from National Institute of Mental Health (NIMH) grant MH101076 (ART), and Dr. Daniels also received support from the National Institute of Child and Human Development (NICHD) grant T32HD101392 (ART). Dr. William Lewis-de los Angeles and Dr. Audrey Tyrka also received support from the Hasbro/Bradley Pilot Clinical Research Award from Lifespan.
Acronyms:
- ELS
early life stress
- MetS
Metabolic syndrome
- CVD
cardiovascular disease
- T2DM
type 2 diabetes mellitus
- HDL-C
high density lipoprotein C
- LDL
low density lipoprotein
- HOMA-IR
Homeostatic Model Assessment for Insulin Resistance
- CECA
Childhood Experience of Care and Abuse Interview
- CTQ
Childhood Trauma Questionnaire
- BMI
body mass index
- SES
socioeconomic status
- NCEP ATP III
National Cholesterol Education Program Adult Treatment Panel III
- CHD
coronary heart disease
- LIFE
Lifestyle Influences of Family Environment Study
- OCD
obsessive-compulsive disorder
- SLEQ
Stressful Life Experiences Questionnaire
- SCID5
Structured Clinical Interview for the DSM-5
- M.I.N.I
Mini-international Neuropsychiatric Interview for the DSM-IV
- IDS-SR
Inventory of Depressive Symptomatology Self Report
- BAI
Beck Anxiety Inventory
- GPPAQ-PAI
The General Practice Physical Activity Questionnaire-Physical Activity Index
- ASA24
Automated Self-Administered 24-hour Dietary Assessment Tool
- HEI
Healthy Eating Index
Footnotes
Data and analysis code are available upon request from the first author.
REFERENCES
- 1.Hughes K, Bellis MA, Hardcastle KA, Sethi D, Butchart A, Mikton C, et al. The effect of multiple adverse childhood experiences on health: a systematic review and meta-analysis. The Lancet Public Health. 2017;2:e356–66. [DOI] [PubMed] [Google Scholar]
- 2.Danese A, McEwen BS. Adverse childhood experiences, allostasis, allostatic load, and age-related disease. Vol. 106, Physiology and Behavior. 2012. [DOI] [PubMed] [Google Scholar]
- 3.Lee C, Tsenkova V, Carr D. Childhood trauma and metabolic syndrome in men and women. Social science & medicine (1982). 2014;105:122–30. [DOI] [PMC free article] [PubMed] [Google Scholar]
- 4.Go AS, Mozaffarian D, Roger VL, Benjamin EJ, Berry JD, Blaha MJ, et al. Heart Disease and Stroke Statistics—2014 Update. Circulation [Internet]. 2014;129:e28–292. Available from: 10.1161/01.cir.0000441139.02102.80 [DOI] [PMC free article] [PubMed] [Google Scholar]
- 5.Grundy SM, Cleeman JI, Daniels SR, Donato KA, Eckel RH, Franklin BA, et al. American Heart Association, National Heart L and BI. Diagnosis and management of the metabolic syndrome: an American Heart Association/National Heart, Lung, and Blood Institute Scientific Statement. Circulation. 2005;112:2735–52. [DOI] [PubMed] [Google Scholar]
- 6.Hirode G, Wong RJ. Trends in the Prevalence of Metabolic Syndrome in the United States, 2011–2016. Vol. 323, JAMA - Journal of the American Medical Association. 2020. [DOI] [PMC free article] [PubMed] [Google Scholar]
- 7.Turner RJ, Thomas CS, Brown TH. Childhood adversity and adult health: Evaluating intervening mechanisms. Social Science & Medicine. 2016;156:114–24. [DOI] [PubMed] [Google Scholar]
- 8.Ruiz R, Roque A, Pineda E, Licona-Limón P, José Valdéz-Alarcón J, Lajud N. Early life stress accelerates age-induced effects on neurogenesis, depression, and metabolic risk. Psychoneuroendocrinology. 2018;96:203–11. [DOI] [PubMed] [Google Scholar]
- 9.Danese A J, Lewis S Psychoneuroimmunology of Early-Life Stress: The Hidden Wounds of Childhood Trauma? Neuropsychopharmacology. 2017;42:99–114. [DOI] [PMC free article] [PubMed] [Google Scholar]
- 10.Danese A, Moffitt TE, Harrington H, Milne B. Adverse childhood experiences and adult risk factors for age-related disease: depression, inflammation, and clustering of metabolic risk markers. Arch Pediatr Adolesc Med. 2009;12:1135–43. [DOI] [PMC free article] [PubMed] [Google Scholar]
- 11.Epel ES. Psychological and metabolic stress: A recipe for accelerated cellular aging? Vol. 8, Hormones. 2009. [DOI] [PubMed] [Google Scholar]
- 12.Deschênes SS, Kivimaki M, Schmitz N. Adverse Childhood Experiences and the Risk of Coronary Heart Disease in Adulthood: Examining Potential Psychological, Biological, and Behavioral Mediators in the Whitehall II Cohort Study. Journal of the American Heart Association. 2021;10:e019013. [DOI] [PMC free article] [PubMed] [Google Scholar]
- 13.Jakubowski KP, Cundiff JM, Matthews KA. Cumulative childhood adversity and adult cardiometabolic disease: A meta-analysis. Health psychology : official journal of the Division of Health Psychology, American Psychological Association. 2018;37:701–15. [DOI] [PMC free article] [PubMed] [Google Scholar]
- 14.Huang H, Yan P, Shan Z, Chen S, Li M, Luo C, et al. Adverse childhood experiences and risk of type 2 diabetes: A systematic review and meta-analysis. Metabolism. 2015;64:1408–18. [DOI] [PubMed] [Google Scholar]
- 15.Green JG, McLaughlin KA, Berglund PA, Gruber MJ, Sampson NA, Zaslavsky AM, et al. Childhood adversities and adult psychiatric disorders in the national comorbidity survey replication I: associations with first onset of DSM-IV disorders. Archives of general psychiatry. 2010;67:113–23. [DOI] [PMC free article] [PubMed] [Google Scholar]
- 16.Friedman EM, Karlamangla AS, Gruenewald TL, Koretz B, Seeman TE. Early life adversity and adult biological risk profiles. Psychosomatic Medicine. 2015;77:176–85. [DOI] [PMC free article] [PubMed] [Google Scholar]
- 17.Gunstad J, Paul RH, Spitznagel MB, Cohen RA, Williams LM, Kohn M, et al. Exposure to early life trauma is associated with adult obesity. Psychiatry Research. 2006;142:31–37. [DOI] [PubMed] [Google Scholar]
- 18.Boynton-Jarrett R, Rosenberg L, Palmer JR, Boggs DA, Wise LA. Child and adolescent abuse in relation to obesity in adulthood: the Black Women’s Health Study. Pediatrics. 2012;130:245–53. [DOI] [PMC free article] [PubMed] [Google Scholar]
- 19.Fuller-Rowell TE, Homandberg LK, Curtis DS, Tsenkova VK, Williams DR, Ryff CD. Disparities in insulin resistance between black and white adults in the United States: The role of lifespan stress exposure. Psychoneuroendocrinology. 2019;107:1–8. [DOI] [PMC free article] [PubMed] [Google Scholar]
- 20.Burke NJ, Hellman JL, Scott BG, Weems CF, Carrion VG. The impact of adverse childhood experiences on an urban pediatric population. Child Abuse & Neglect. 2011;35:408–13. [DOI] [PMC free article] [PubMed] [Google Scholar]
- 21.Slopen N, Koenen KC, Kubzansky LD. Cumulative adversity in childhood and emergent risk factors for long-term health. The Journal of pediatrics. 2014;164:631–32. [DOI] [PubMed] [Google Scholar]
- 22.Midei AJ, Matthews KA, Chang YF, Bromberger JT. Childhood physical abuse is associated with incident metabolic syndrome in mid-life women. Health Psychology. 2013;32:121–27. [DOI] [PMC free article] [PubMed] [Google Scholar]
- 23.Jimenez V, Sanchez N, Clark ELM, Miller RL, Casamassima M, Verros M, et al. Associations of adverse childhood experiences with stress physiology and insulin resistance in adolescents at risk for adult obesity. Developmental psychobiology. 2021;63:e22127. [DOI] [PMC free article] [PubMed] [Google Scholar]
- 24.Loucks EB, Almeida ND, Taylor SE, Matthews KA. Childhood Family Psychosocial Environment and Coronary Heart Disease Risk. Psychosomatic Medicine. 2011;73:563–71. [DOI] [PMC free article] [PubMed] [Google Scholar]
- 25.Kisely S, Siskind D, Scott JG, Najman JM. Self-reported child maltreatment and cardiometabolic risk in 30-year-old adults. Internal Medicine Journal. 2022; [DOI] [PMC free article] [PubMed] [Google Scholar]
- 26.Li L, Pinto Pereira SM, Power C. Childhood maltreatment and biomarkers for cardiometabolic disease in mid-Adulthood in a prospective British birth cohort: Associations and potential explanations. BMJ Open. 2019;9:1–12. [DOI] [PMC free article] [PubMed] [Google Scholar]
- 27.Gayer-Anderson C, Reininghaus U, Paetzold I, Hubbard K, Beards S, Mondelli V, et al. A comparison between self-report and interviewer-rated retrospective reports of childhood abuse among individuals with first-episode psychosis and population-based controls. Journal of Psychiatric Research. 2020;123:145–50. [DOI] [PMC free article] [PubMed] [Google Scholar]
- 28.Johnson DA, Knutson K, Colangelo LA, Hale L, Redline S, Carnethon M, et al. Associations of Chronic Burden, Sleep Characteristics, and Metabolic Syndrome in the Coronary Artery Risk Development in Young Adults Study. Psychosomatic Medicine. 2022;84:711–18. [DOI] [PMC free article] [PubMed] [Google Scholar]
- 29.Kuo W, Bratzke LC, Oakley LD, Kuo F, Wang H, Brown RL. The association between psychological stress and metabolic syndrome: A systematic review and meta-analysis. Obesity Reviews. 2019;20:1651–64. [DOI] [PubMed] [Google Scholar]
- 30.Al-Khatib Y, Akhtar MA, Kanawati MA, Mucheke R, Mahfouz M, Al-Nufoury M. Depression and Metabolic Syndrome: A Narrative Review. Cureus. 2022; [DOI] [PMC free article] [PubMed] [Google Scholar]
- 31.Fuller-Thomson E, Sinclair DA, Brennenstuhl S. Carrying the Pain of Abuse: Gender-Specific Findings on the Relationship between Childhood Physical Abuse and Obesity in Adulthood. Obesity Facts. 2013;6:325–36. [DOI] [PMC free article] [PubMed] [Google Scholar]
- 32.Vilija M, Romualdas M. Unhealthy food in relation to posttraumatic stress symptoms among adolescents. Appetite. 2014;74:86–91. [DOI] [PubMed] [Google Scholar]
- 33.Thyfault JP, Bergouignan A. Exercise and metabolic health: beyond skeletal muscle. Diabetologia. 2020;63:1464–74. [DOI] [PMC free article] [PubMed] [Google Scholar]
- 34.Havranek EP, Mujahid MS, Barr DA, Blair IV, Cohen MS, Cruz-Flores S, et al. Social Determinants of Risk and Outcomes for Cardiovascular Disease. Circulation. 2015;132:873–98. [DOI] [PubMed] [Google Scholar]
- 35.Hill-Briggs F, Adler NE, Berkowitz SA, Chin MH, Gary-Webb TL, Navas-Acien A, et al. Social Determinants of Health and Diabetes: A Scientific Review. Diabetes Care. 2021;44:258–79. [DOI] [PMC free article] [PubMed] [Google Scholar]
- 36.Felitti VJ, Anda RF, Nordenberg D, Williamson DF, Spitz AM, Edwards V, et al. Relationship of Childhood Abuse and Household Dysfunction to Many of the Leading Causes of Death in Adults. American Journal of Preventive Medicine. 1998;14:245–58. [DOI] [PubMed] [Google Scholar]
- 37.Marquez FD, Risica PM, Mathis KJ, Sullivan A, Gobin AP, Tyrka AR. Do measures of healthy eating differ in survivors of early adversity? Appetite. 2021;162:105180. [DOI] [PMC free article] [PubMed] [Google Scholar]
- 38.Bifulco A, Brown GW, Harris TO. Childhood Experience of Care and Abuse (CECA): a retrospective interview measure. Journal of child psychology and psychiatry, and allied disciplines [Internet]. 1994;35:1419–35. Available from: http://www.ncbi.nlm.nih.gov/pubmed/7868637 [DOI] [PubMed] [Google Scholar]
- 39.Bifulco A, Brown GW, Lillie A, Jarvis J. Memories of Childhood Neglect and Abuse: Corroboration in a Series of Sisters. Journal of Child Psychology and Psychiatry. 1997;38:365–74. [DOI] [PubMed] [Google Scholar]
- 40.Daniels TE, Mathis KJ, Gobin AP, Lewis-de los Angeles WW, Smith EM, Chanthrakumar P, et al. Associations of early life stress with leptin and ghrelin in healthy young adults. Psychoneuroendocrinology. 2023;149:106007. [DOI] [PMC free article] [PubMed] [Google Scholar]
- 41.Flanagin A, Frey T, Christiansen SL. Updated Guidance on the Reporting of Race and Ethnicity in Medical and Science Journals. JAMA. 2021;326:621. [DOI] [PubMed] [Google Scholar]
- 42.Bernstein DP, Stein JA, Newcomb MD, Walker E, Pogge D, Ahluvalia T, et al. Development and validation of a brief screening version of the Childhood Trauma Questionnaire. Child Abuse and Neglect. 2003;27. [DOI] [PubMed] [Google Scholar]
- 43.Sheehan DV, Lecrubier Y, Sheehan KH, Amorim P, Janavs J, Weiller E, et al. The Mini-International Neuropsychiatric Interview (M.I.N.I.): the development and validation of a structured diagnostic psychiatric interview for DSM-IV and ICD-10. The Journal of clinical psychiatry. 1998;59 Suppl 20:22–33;quiz 34-57. [PubMed] [Google Scholar]
- 44.Rush AJ, Giles DE, Schlesser MA, Fulton CL, Weissenburger J, Burns C. The Inventory for Depressive Symptomatology (IDS): preliminary findings. Psychiatry research [Internet]. 1986;18:65–87. Available from: http://www.ncbi.nlm.nih.gov/pubmed/3737788 [DOI] [PubMed] [Google Scholar]
- 45.Beck AT, Epstein N, Brown G, Steer RA. An inventory for measuring clinical anxiety: psychometric properties. Journal of consulting and clinical psychology [Internet]. 1988;56:893–97. Available from: http://www.ncbi.nlm.nih.gov/pubmed/3204199 [DOI] [PubMed] [Google Scholar]
- 46.Foster J The General Practice Physical Activity Questionnaire ( GPPAQ ) A screening tool to assess adult physical activity levels , within primary care Updated May 2009. Nhs. 2009;1–21. [Google Scholar]
- 47.National Cancer Institute. Overview and Background of The Healthy Eating Index. EGRP/DCCPS/NCI/NIH. 2017. [Google Scholar]
- 48.National Cancer Institute. HEI Scoring Algorithm. EGRP/DCCPS/NCI/NIH. 2019. [Google Scholar]
- 49.Krebs-Smith SM, Pannucci TRE, Subar AF, Kirkpatrick SI, Lerman JL, Tooze JA, et al. Update of the Healthy Eating Index: HEI-2015. Journal of the Academy of Nutrition and Dietetics [Internet]. 2018;118:1591–1602. Available from: 10.1016/j.jand.2018.05.021 [DOI] [PMC free article] [PubMed] [Google Scholar]
- 50.Hillier TA, Rousseau A, Lange C, Lépinay P, Cailleau M, Novak M, et al. Practical way to assess metabolic syndrome using a continuous score obtained from principal components analysis. Diabetologia. 2006;49:1528–35. [DOI] [PMC free article] [PubMed] [Google Scholar]
- 51.DeBoer MD, Filipp SL, Sims M, Musani SK, Gurka MJ. Risk of Ischemic Stroke Increases Over the Spectrum of Metabolic Syndrome Severity. Stroke. 2020;51:2548–52. [DOI] [PMC free article] [PubMed] [Google Scholar]
- 52.Ikeda Y, Suehiro T, Nakamura T, Kumon Y, Hashimoto K. Clinical significance of the insulin resistance index as assessed by homeostasis model assessment. Endocrine journal. 2001;48:81–86. [DOI] [PubMed] [Google Scholar]
- 53.Matthews DR, Hosker JP, Rudenski AS, Naylor BA, Treacher DF, Turner RC. Homeostasis model assessment: insulin resistance and ß-cell function from fasting plasma glucose and insulin concentrations in man. Diabetologia. 1985;28:412–19. [DOI] [PubMed] [Google Scholar]
- 54.RStudio Team. RStudio: Integrated Development for R. Boston, MA: RStudio, PBC; 2020. [Google Scholar]
- 55.Danaei G, Finucane MM, Lu Y, Singh GM, Cowan MJ, Paciorek CJ, et al. National, regional, and global trends in fasting plasma glucose and diabetes prevalence since 1980: systematic analysis of health examination surveys and epidemiological studies with 370 country-years and 2·7 million participants. The Lancet. 2011;378:31–40. [DOI] [PubMed] [Google Scholar]
- 56.Rosseel Y lavaan: An R Package for Structural Equation Modeling. Journal of Statistical Software. 2012;48. DOI: 10.18637/jss.v048.i02. [DOI] [Google Scholar]
- 57.DeBoer MD, Gurka MJ, Golden SH, Musani SK, Sims M, Vishnu A, et al. Independent Associations Between Metabolic Syndrome Severity and Future Coronary Heart Disease by Sex and Race. Journal of the American College of Cardiology. 2017;69:1204–5. [DOI] [PMC free article] [PubMed] [Google Scholar]
- 58.Maniam J, Antoniadis C, Morris MJ. Early-Life Stress, HPA Axis Adaptation, and Mechanisms Contributing to Later Health Outcomes. Frontiers in Endocrinology. 2014;5. [DOI] [PMC free article] [PubMed] [Google Scholar]
- 59.Thomas C, Hyppönen E, Power C Obesity and Type 2 Diabetes Risk in Midadult Life: The Role of Childhood Adversity. Pediatrics. 2008;121:e1240–49. [DOI] [PubMed] [Google Scholar]
- 60.Seal S V, Turner JD. The ‘Jekyll and Hyde’ of Gluconeogenesis: Early Life Adversity, Later Life Stress, and Metabolic Disturbances. International Journal of Molecular Sciences. 2021;22:3344. [DOI] [PMC free article] [PubMed] [Google Scholar]
- 61.Agardh E, Allebeck P, Hallqvist J, Moradi T, Sidorchuk A. Type 2 diabetes incidence and socio-economic position: a systematic review and meta-analysis. International Journal of Epidemiology. 2011;40:804–18. [DOI] [PubMed] [Google Scholar]
- 62.Montez JK, Hayward MD. Cumulative childhood adversity, educational attainment, and active life expectancy among U.S. adults. Demography. 2014;51:413–35. [DOI] [PMC free article] [PubMed] [Google Scholar]
- 63.Lewis-de los Angeles WW. Association Between Adverse Childhood Experiences and Diet, Exercise, and Sleep in Pre-adolescents. Academic Pediatrics. 2022;22:1281–86. [DOI] [PubMed] [Google Scholar]
- 64.Hirth JM, Rahman M, Berenson AB. The Association of Posttraumatic Stress Disorder with Fast Food and Soda Consumption and Unhealthy Weight Loss Behaviors Among Young Women. Journal of Women’s Health. 2011;20:1141–49. [DOI] [PMC free article] [PubMed] [Google Scholar]
- 65.Smith N, Lam D, Bifulco A, Checkley S. Childhood Experience of Care and Abuse Questionnaire (CECA.Q). Social Psychiatry and Psychiatric Epidemiology. 2002;37:572–79. [DOI] [PubMed] [Google Scholar]
- 66.Baldwin JR, Reuben A, Newbury JB, Danese A. Agreement Between Prospective and Retrospective Measures of Childhood Maltreatment. JAMA Psychiatry. 2019;76:584. [DOI] [PMC free article] [PubMed] [Google Scholar]
- 67.Cardel MI, Chi X, Min Y-I, Sims M, Musani SK, Dulin A, et al. Experiences of Discrimination Are Associated With Worse Metabolic Syndrome Severity Among African Americans in the Jackson Heart Study. Annals of behavioral medicine : a publication of the Society of Behavioral Medicine. 2021;55:266–79. [DOI] [PMC free article] [PubMed] [Google Scholar]
- 68.Churchwell K, Elkind MSV, Benjamin RM, Carson AP, Chang EK, Lawrence W, et al. Call to Action: Structural Racism as a Fundamental Driver of Health Disparities: A Presidential Advisory From the American Heart Association. Circulation. 2020;142. [DOI] [PubMed] [Google Scholar]
- 69.Javed Z, Haisum Maqsood M, Yahya T, Amin Z, Acquah I, Valero-Elizondo J, et al. Race, Racism, and Cardiovascular Health: Applying a Social Determinants of Health Framework to Racial/Ethnic Disparities in Cardiovascular Disease. Circulation: Cardiovascular Quality and Outcomes. 2022;15. [DOI] [PubMed] [Google Scholar]
- 70.Shonkoff JP. Capitalizing on Advances in Science to Reduce the Health Consequences of Early Childhood Adversity. JAMA Pediatrics. 2016;170:1003. [DOI] [PubMed] [Google Scholar]
- 71.Blair C, Raver CC. Child development in the context of adversity: experiential canalization of brain and behavior. The American psychologist. 2012;67:309–18. [DOI] [PMC free article] [PubMed] [Google Scholar]
Associated Data
This section collects any data citations, data availability statements, or supplementary materials included in this article.