

Summary
PIM kinases have important pro-tumorigenic roles and mediate several oncogenic traits, including cell proliferation, survival, and chemotherapeutic resistance. As a result, multiple PIM inhibitors have been pursued as investigational new drugs in cancer; however, response to PIM inhibitors in solid tumors has fallen short of expectations. We found that inhibition of PIM kinase activity stabilizes protein levels of all three PIM isoforms (PIM1/2/3), and this can promote resistance to PIM inhibitors and chemotherapy. To overcome this effect, we designed PIM proteolysis targeting chimeras (PROTACs) to target PIM for degradation. PIM PROTACs effectively downmodulated PIM levels through the ubiquitin-proteasome pathway. Importantly, degradation of PIM kinases was more potent than inhibition of catalytic activity at inducing apoptosis in prostate cancer cell line models. In conclusion, we provide evidence of the advantages of degrading PIM kinases versus inhibiting their catalytic activity to target the oncogenic functions of PIM kinases.
Keywords: PIM kinases, proteolysis, targeted therapeutics, chemoresistance
Graphical Abstract
Introduction
The Proviral Integration for the Moloney murine leukemia virus (PIM) kinases were initially defined as oncogenic in hematopoietic malignancies1. More recently, PIM kinases have been found to be overexpressed in hematological malignancies2 and solid tumors, including prostate cancer3, breast cancer4, colon cancer5, endometrial cancer6, gastric cancer1, and pancreatic cancer7. Additionally, high expression of PIM1 predicts poor survival in multiple cancer types, such as neuroblastoma, osteosarcoma, pancreatic cancer, breast cancer, and prostate cancer7–10. The PIM kinases are serine/threonine kinases that include three different isoforms: PIM1, PIM2, and PIM3. The PIM kinases phosphorylate a wide range of substrates that control tumorigenic phenotypes, including proliferation and cell survival. Activation of the PIM kinases can promote cancer progression and resistance to chemotherapy11. In addition, preclinical studies indicate that pharmacological inhibition of PIM has the potential to improve the efficacy of both chemotherapies and precision medicines11.
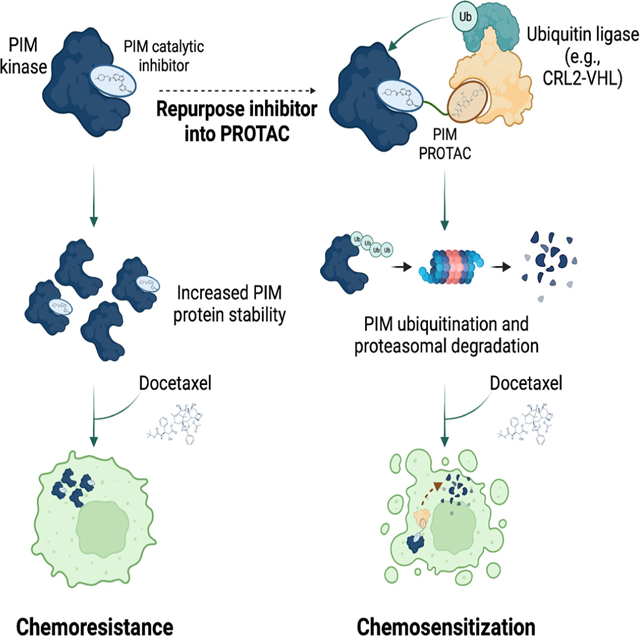
The PIM kinases lack regulatory domains12 and once translated, PIM kinases adopt a constitutively active conformation. Therefore, the function of these kinases is primarily regulated by altering the rates of protein synthesis and degradation12. The turnover of PIM isoforms appears to be regulated through ubiquitin-mediated protein degradation13. Here we report that small-molecule PIM inhibitors lead to an increase in PIM protein levels, indicating that PIM kinases regulate their own degradation14,15. Furthermore, we demonstrate that PIM kinases have pro-tumorigenic functions independent of catalytic activity, indicating that degradation rather than catalytic inhibition is the optimal therapeutic intervention strategy to target the PIM kinases. We describe novel PIM kinase PROTACs that target PIM1 kinase for degradation and demonstrate that a pan-PIM kinase degrader is superior to PIM catalytic inhibitors for promoting cancer cell death and chemosensitization.
Results
Catalytically inactive PIM1 kinase has increased stability and can mediate chemoresistance.
PIM kinase inhibitors have entered clinical trials because of the pro-oncogenic role of these serine/threonine kinases. Our lab and several other groups have reported that small molecule PIM inhibitors lead to an increase in PIM protein levels, suggesting that PIM may control its own degradation14–16. However, little is known about how the non-catalytic functions of PIM might impact cell survival. We aimed to determine how catalytic inhibition would affect protein stability and whether catalytic activity is required for the tumorigenic functions of the PIM kinases. Treatment of PC3, LNCaP, and C4–2 prostate cancer cells with different pan-PIM kinase inhibitors increased the levels of all three PIM isoforms (Figure 1A, S1A). Importantly, despite increased PIM kinase expression, signaling downstream of PIM kinases was reduced after inhibition, as assessed by phosphorylation of the PIM effectors IRS-1 and BAD (Figure 1A, S1A). Importantly, PIM1 and PIM2 mRNA levels were not elevated after PIM inhibition with the small-molecule inhibitor AZD1208, and only PIM3 expression was slightly increased after inhibition of PIM catalytic activity (Figure S1B). To further elucidate the mechanism by which PIM kinases are stabilized after catalytic inhibition, we conducted ubiquitination assays. PC3 cells transfected with PIM1 were treated with DMSO or the pan-PIM inhibitor PIM447 and incubated with the proteasome inhibitor MG-132 for different times. PIM1 ubiquitination was significantly reduced by approximately 3-fold in the presence of PIM447 after 2 and 4 h of treatment (Figure 1B), indicating PIM catalytic activity might be critical for promoting PIM ubiquitination. To probe deeper into how PIM activity regulates its protein stabilization, we evaluated PIM1 degradation kinetics by conducting cycloheximide (CHX) chase experiments that prevent PIM1 translation. In cells pre-treated with the PIM inhibitor, PIM447, we observed a significant increase in endogenous PIM1 protein half-life from approximately 1 hour in vehicle-treated cells, to more than 4 h in cells pre-treated with PIM447 (Figure 1C). Identical findings were observed in cells transfected with PIM1, where the protein half-life also increased from 1 hour to more than 4 hours after incubation with PIM447 (Figure 1D). Similar results were observed with a second PIM inhibitor, AZD1208, which significantly increased the half-life of transfected PIM1 from 1.1 hours to 2.2. hours (Figure S1C). To further corroborate that the stabilization of PIM1 was the result of inhibiting its catalytic activity, we conducted CHX-chase experiments in cells transfected with wild-type PIM1 or with a catalytically inactive mutant (PIM1 K67M) that was generated by mutating the conserved lysine of the VAIK motif to a methionine. As expected, we observed that inactive PIM1 was more stable than its wild-type counterpart (Figure 1D, S1C). Combined, these observations support that PIM1 stabilization is directly regulated by its catalytic activity.
Figure 1. Inactive PIM1 has increased protein stability and mediates resistance to docetaxel.

(A) PC3 cells were treated with the indicated inhibitors (3 μM SGI-1776, 3 μM AZD1208, and 1 μM PIM447) for 8 h. Cells were then lysed, and PIM expression and phosphorylation of downstream targets (IRS1 and BAD) were evaluated by immunoblot. (B) Left. HA-PIM1-transfected PC3 cells were incubated with the PIM447 (3 μM) and MG-132 (10 μM) for the times indicated. PIM1 was then immunoprecipitated and its ubiquitination evaluated by immunoblot of the immunoprecipitated fractions. Right. Relative PIM1 ubiquitination was calculated as the ratio ubiquitin/HA ratio in the immunoprecipitates. Data represent mean ± SEM from n = 3 independent experiments. * P < 0.05, t-test. (C) Top. PC3 cells were preincubated with vehicle (DMSO) or PIM447 (3 μM, 30 min) and then treated with cycloheximide (CHX, 10 μM) for the times specified. Lysates were collected to evaluate PIM1 degradation by immunoblot and PIM1 inhibition was assessed as reduced IRS1-Ser1101 phosphorylation. Bottom. Quantification of n = 3 independent experiments; relative PIM1 levels were calculated as the PIM1/Actin ratio for each condition. Data represent mean ± SD. * P < 0.05, t-test. (D) Top. PC3 cells transfected with wild-type or kinase-dead (K67M mutant) HA-tagged PIM1 were pretreated with PIM447 (3 μM, 30 min) where indicated and incubated with cycloheximide (CHX, 10 μM) for the times specified. Lysates were collected to evaluate PIM1 degradation by immunoblot. Bottom. Relative PIM1 levels (HA/Actin) from n = 3 independent experiments. Data represent mean ± SD. * P < 0.05, t-test. (E) PIM1 was knocked out (KO) in PC3-LN4 cells, and cells were reconstituted with wild-type or kinase-dead PIM1. PIM1 levels and Bad phosphorylation were evaluated by immunoblot. (F) PIM1 KO PC3-LN4 cells as in (E) were treated with increasing concentrations of docetaxel for 72 hours. Cell viability was evaluated by staining the cells with crystal violet and quantified by measuring absorbance at 595 nm. Data represent mean ± SD from n = 3 independent experiments. (G) PC3 cells with stable expression wild-type or kinase-dead PIM1 were inoculated subcutaneously into SCID mice and tumor volume was monitored. Mean tumor volumes ± SEM are shown, n = 8 tumors/group. * P < 0.05; Student’s t-test.
We next sought to investigate the functional consequences of inactive PIM1 in promoting resistance to chemotherapy. We knocked out PIM1 using CRISPR in PC3-LN4 cells and reconstituted these cells with either wild-type PIM1 or a kinase-dead (PIM1 K67M) mutant achieving PIM1 levels similar to endogenous PIM1 in PC3 cells (Figure 1E). Cell viability was then assessed after treatment with increasing concentrations of docetaxel. Depletion of PIM1 rendered PC3 cells more sensitive to docetaxel, whereas the expression of either wild-type or kinase-dead PIM1 significantly reduced the sensitivity of PC3 cells to treatment with docetaxel (Figure 1F), indicating that PIM1 has pro-survival functions that do not rely upon its catalytic activity. To further corroborate that the pro-oncogenic functions of PIM1 are partly independent of its catalytic activity, we established mouse xenograft models of PC3 cells stably expressing wild-type or kinase-dead PIM1 and found that increased PIM1 levels significantly increased PC3 tumor growth in vivo, independent of PIM1 catalytic activity (Figure 1G, Figure S1D, S1E). Combined, our results show that PIM1 stability is self-regulated by its catalytic activity and that small-molecule PIM inhibitors lead to protein stabilization. Moreover, our findings indicate that PIM1 promotes chemoresistance and tumor growth through catalytic-independent mechanisms.
Development and biochemical characterization of PIM PROTACs.
Our observations above suggest that increased PIM1 expression after treatment with PIM kinase inhibitors could trigger therapeutic resistance in cancer cells through non-catalytic mechanisms. To target PIM1 for degradation and suppress its non-catalytic effects on tumorigenesis, we generated PROTACs from three pan-PIM kinase inhibitors, SGI-1776, AZD1208, and PIM447 (Figure 2A). To generate the first set of PIM-targeting PROTACs, we coupled SGI-1776 to different E3-ubiquitin ligase ligands to yield PROTACs SGI-1776-VHL-01 (targeting the von Hippel-Lindau [VHL] Cullin 2-Ring ubiquitin ligase), SGI-1776-CRBN-01 (targeting the Cereblon Cullin 4-Ring ubiquitin ligase), and SGI-1776-IAP-01 (targeting the Inhibitors of Apoptosis Proteins ubiquitin E3-ligase) (Figure 2B). We next evaluated the efficacy of these PROTACs to degrade PIM1 in PC3 cells expressing doxycycline-inducible PIM1 (PC3-dox-PIM1 cells). SGI-1776-VHL-01 and SGI-1776-IAP-01 caused PIM1 degradation in a dose-dependent manner, with maximal PIM1 degradation achieved at 0.75 μM and 1.5 μM, respectively, with PIM1 degradation being reduced at PROTAC concentrations above 3.75 μM (Figure S2). This observation is consistent with a “hook effect,” a well-recognized phenomenon of PROTACs at high concentrations17; this effect was stronger for SGI-1776-IAP-01 than for SGI-1776-VHL-01. Of note, no PIM1 degradation was observed after treatment with the SGI-1776-CRBN-01 PROTAC (Figure S2). In conclusion, SGI-1776-VHL-01 was the most efficient PROTAC for degrading PIM1 from this first series of PROTACs; we therefore focused on PROTACs targeting VHL.
Figure 2. Generation of PIM PROTACs from PIM kinase catalytic inhibitors.

(A) Chemical structures of the PIM kinase inhibitors used to generate PIM proteolysis-targeting chimeras (PROTACs). (B) Chemical structures of the different PIM PROTACs and their epimer controls used in this study.
We next sought to optimize the efficacy of the SGI-1776-VHL-01 PROTAC to degrade PIM1, as data suggest that this isoform has a predominant role in prostate cancer (reviewed in Luszczak and colleagues18). Previous studies have confirmed that small changes in the PROTAC linker can significantly affect the degradation efficacy; therefore, we generated the SGI-1776-VHL-02 PROTAC by replacing the 2-PEG linker with a suberoyl linker (Figure 2B). In PC3-dox-PIM1 cells, SGI-1776-VHL-02 efficiently triggered PIM1 degradation at concentrations of 0.75 μM, with no “hook effect” observed at concentrations up to 10 μM (Figure 3A).
Figure 3. Biochemical characterization of PIM PROTACs in PC3 cells with doxycycline-inducible PIM1 (PC3-dox-PIM1) expression.

(A and B) PIM1 was induced with doxycycline (1 μg/ml, 24 h), and SGI-1776-VHL-02, AZD1208-VHL-01, or PIM447-VHL-01 was added at the indicated concentrations (24 h). Cells were lysed, and PIM1 expression was analyzed by immunoblot. (C and D) PIM1 was induced with doxycycline (1 μg/ml, 24 h). Cells were then pre-treated for 30 minutes with the following inhibitors: MG-132 (10 μM), MLN4924 (3 μM), and VH-298 (50 μM). The SGI-1776-VHL-02 or PIM447-VHL-01 PROTACs were then added (0.75 μM, 4 h). Cells were lysed and PIM1 levels were evaluated by immunoblot. (E and F) PIM1 was induced with doxycycline (1 μg/ml, 24 h). Cells were treated with PROTACs (SGI-1776-VHL-02 or PIM447-VHL-01), or their epimer controls (SGI-1776-cis-VHL-02 or PIM447-cis-VHL-01) were added at the indicated concentrations for 24 h. Cells were then lysed, and PIM1 expression was analyzed. (G and H) PIM1 was induced with doxycycline (1 μg/ml, 24 h). DMSO or PROTACs (SGI-1776-VHL-02 or PIM447-VHL-01, at 0.75 μM) were added for the times indicated, and PIM1 degradation was assessed by immunoblot. All experiments were conducted twice.
Because SGI-1776-VHL-02 was more potent than SGI-1776-VHL-01, we used the suberoyl linker to generate two additional PROTACs from AZD1208 and PIM447 and coupled them to the VHL ligand, yielding AZD1208-VHL-01 and PIM447-VHL-01 PROTACs, respectively (Figure 2B). Treatment of PC3-dox-PIM1 cells with AZD1208-VHL-01 triggered a dose-dependent reduction in PIM1 levels, with maximal degradation at 6.25 μM, whereas PIM447-VHL-01 effectively degraded PIM1 at all concentrations tested (0.75 – 10 μM), without the “hook effect” being observed (Figure 3B). Therefore, SGI-1776-VHL-02 and PIM447-VHL-01 were the most potent PROTACs generated for targeting PIM1 for degradation.
We then verified that SGI-1776-VHL-02 and PIM447-VHL-01 reduced PIM1 levels via the ubiquitin-proteasome pathway. PIM1 degradation in response to each PROTAC was prevented by treatment with the proteasome inhibitor MG-132 and the neddylation inhibitor MLN4924 (Figure 3C and D). In addition, treatment with excess VHL ligand, VH298, rescued PIM1 expression (Figure 3C and D). Furthermore, we generated two control compounds (SGI-1776-cis-VHL-02 and PIM447-cis-VHL-01) that have an inverted stereocenter in the critical hydroxyl-proline group in the VHL ligand. These control compounds cannot trigger the VHL ligase due to the high stereoselectivity of VHL and, thus, will not degrade PIM119,20. As predicted, PIM1 degradation was prevented by treatment with the cis-epimers of both PROTACs, confirming that PIM1 was degraded in a VHL-dependent manner (Figure 3E and F).
We then analyzed the dynamics of degradation of doxycycline-induced PIM1 after PROTAC treatment in kinetic experiments in PC3-dox-PIM1 cells. PIM1 degradation by SGI-1776-VHL-02 occurred within 1 h of treatment, was maximal at 4h post-treatment, and sustained up to 72 h after the addition of the PROTAC (Figure 3G). PIM447-VHL-01 displayed a similar PIM1 degradation kinetics, with maximal degradation at 2 h after addition of the compound and sustained degradation for 48 h after addition of the PROTAC (Figure 3H). PIM1 expression began to recover at 72 h after the addition of PIM447-VHL-01.
PIM PROTACs preferentially degrade PIM1.
SGI-1776-VHL-02 and PIM447-VHL-01 effectively reduced doxycycline-induced PIM1 expression; therefore, we proceeded to evaluate their efficacy in an endogenous system and to assess their target specificity. We conducted experiments under hypoxic conditions, as hypoxia is known to stabilize PIM1 in prostate cancer cells21–23. SGI-1776-VHL-02 and PIM447-VHL-01 displayed similar ability to degrade endogenous PIM1, with both PROTACs achieving maximal PIM1 degradation at 0.75 μM and no “hook effect” detected at the concentrations tested (0.75 – 10 μM) (Figure 4A and B). Similarly, PIM1 degradation by both PROTACs was prevented by treatment with a proteasome inhibitor (MG-132), a neddylation inhibitor (MLN4924), or excessive doses of the VHL ligand (VH298) (Figure 4C and D). We next depleted VHL levels to further verify the VHL E3 ligase requirement for SGI-1776-VHL-02- and PIM447-VHL-01-induced PIM1 degradation. RNAi-mediated VHL knockdown in PC3 cells did not affect PIM1 levels, but it did prevent the degradation of PIM1 after treatment with both PROTACs (Figure 4E). Finally, we verified that PIM1 mRNA levels were not affected by treatment with SGI-1776-VHL-02 or PIM447-VHL-01, indicating PIM1 downregulation by these PROTACs was not due to transcriptional effects (Figure 4F). Combined, these observations thoroughly validate that the SGI-1776-VHL-02 and PIM447-VHL-01 PROTACs degraded PIM1 through an E3 ligase-mediated mechanism of ubiquitination and subsequent proteasomal target degradation.
Figure 4. PIM PROTACs efficiently degrade endogenous PIM1 in PC3 cells.

(A and B) PC3 cells were incubated under normoxic or hypoxic (1% O2) conditions for 24 h. SGI-1776-VHL-02 or PIM447-VHL-01 were added at the indicated concentrations. After 24 h, cells were lysed, and PIM1 degradation was analyzed by immunoblot. (C and D) PC3 cells were cultured in normoxia or hypoxia for 24 h. Cells were pre-treated (30 minutes) with the indicated inhibitors: MG-132 (10 μM), MLN4924 (3 μM), and VH-298 (50 μM). The SGI-1776-VHL-02 or PIM447-VHL-01 PROTACs were then added (0.75 μM, 4 h). Cells were lysed and PIM1 levels were evaluated by immunoblot. (E) VHL was knocked down with RNAi (50 nM). 24 h-post-transfection, cells were treated with DMSO or PROTACs (SGI-1776-VHL-02 or PIM447-VHL-01, at 1.5 μM). Twenty-four hours later, cells were collected and PIM1 and VHL levels were evaluated by immunoblot. (F) PC3 cells were treated with DMSO or the indicated PROTACs (SGI-1776-VHL-02 or PIM447-VHL-01, at 1.5 μM) or small-molecule inhibitors (SGI-1776 or PIM447, at 1.5 μM) for 24 h. RNA was then isolated and PIM1 mRNA levels were assessed by RT-qPCR. Data represent mean ± SD from three independent experiments. (G and H) PC3 cells were incubated in normoxia or hypoxia, as indicated above, for 24 h. PROTACs (SGI-1776-VHL-02 or PIM447-VHL-01, at 0.75 μM) or DMSO were added for the times indicated, and endogenous PIM1 degradation was assessed by immunoblot. (I and J) PC3 cells were incubated in normoxia or hypoxia for 24 h, followed by incubation with DMSO or PROTACs (SGI-1776-VHL-02 or PIM447-VHL-01, at 0.75 μM) for an additional 24 h. The medium was then replaced, and cells were allowed to grow for the indicated times to recover PIM1 levels. All experiments were conducted three independent times.
We also evaluated the degradation dynamics of endogenous PIM1 for timed maximal degradation and recovery of PIM1 expression after PROTAC removal. SGI-1776-VHL-02 and PIM447-VHL-01 effectively degraded endogenous PIM1 within 1 h of treatment, with complete degradation maintained up to 72 h post-PROTAC addition for both compounds (Figure 4G and H). We then monitored the duration of SGI-1776-VHL-02 and PIM447-VHL-01 effects in wash-out experiments. PC3 cells were treated with the PROTACs for 24 h, at which point the media was then removed, and cells were washed three times with fresh media and cultured for an additional 72 h. In cells treated with SGI-1776-VHL-02, PIM1 expression remained reduced for up to 72 h after washout of the PROTAC (Figure 4I). In contrast, in cells treated with PIM447-VHL-01, PIM1 levels began to recover at 48 h after the PROTAC was removed, suggesting reduced intracellular stability of PIM447-VHL-01 (Figure 4J).
SGI-1776 and PIM447 can target all three of the PIM kinase isoforms, although SGI-1776 is more selective towards PIM1 (the IC50 of SGI-1776 for PIM2 and PIM3 are 50- and 10-fold higher, respectively, than that for PIM124,25). We next evaluated the SGI-1776-VHL-02 and PIM447-VHL-01 PROTACs to determine whether they also degrade endogenous PIM2 and PIM3. PC3 cells were treated with these PROTACs for 24 h. SGI-1776-VHL-02 degraded PIM2 and PIM3 at 3.75 μM and 1.5 μM, respectively, with no “hook effect” observed in the range of concentrations tested (Figure S3). Conversely, PIM447-VHL-01 did not degrade PIM2 or PIM3 (Figure S3). Combined, our results indicate that SGI-1776-VHL-02 has the potential to degrade all three PIM kinase isoforms, while PIM447-VHL-01 is a PIM1-specific PROTAC.
PIM PROTACs inhibit the growth of PC3 cells and increase the apoptotic effect of docetaxel.
To evaluate the impact of degrading PIM kinases on prostate cancer cell growth, we determined the effect of SGI-1776-VHL-02 and PIM447-VHL-01 treatments on the viability of three different prostate cancer cell lines, PC3, LNCaP, and C4–2, using an MTS assay. Treatment with SGI-1776-VHL-02 reduced cell viability in the three cell lines tested, with IC50s ranging from 1.0 to 1.6 μM (Figure S4A). However, PIM447-VHL-01 treatment did not affect viability in any of the cell lines (Figure S4A). We next compared the effects of inhibiting the activity of PIM kinases with small-molecule catalytic inhibitors vs. targeting their activity-dependent and -independent functions using PROTACs. Long-term treatment (10 days) of PC3, LNCap, and C4–2 cells with the PIM inhibitor SGI-1776 reduced their colony formation capacity at 6.25 μM, whereas the SGI-1776-VHL-02 PROTAC showed a more potent effect in the three cell lines tested (Figure 5A, S4B). Despite inhibiting PIM activity and efficiently degrading PIM1, neither PIM447 nor PIM447-VHL-01 affected the colony formation capacity of PC3 cells (Figure 5A); however, LNCaP and C4–2 cells were slightly sensitive to PIM447 or its derivative PROTAC, though SGI-1776-VHL-02 reduced LNCaP and C4–2 colony formation capacity to a greater extent (Figure S4B).
Figure 5. PIM PROTACs inhibit the growth of PC3 cells and increase the apoptotic effect of docetaxel.

(A) Colony formation assay. PC3 cells were treated with the corresponding PIM PROTACs (SGI-1776-VHL-02 or PIM447-VHL-01) or inhibitors (SGI-1776 or PIM447) at the indicated concentrations for 10 days. Media and treatments were replaced every 96 h. (B) PC3 cells were treated with DMSO or the corresponding PROTACs or inhibitors (all at 3.75 μM, 24 h). Cells were lysed and c-myc levels were evaluated by immunoblot. (C and D) PC3 cells were pre-treated with DMSO or the corresponding PROTACs or inhibitors (all at 3.75 μM) for 4 h. Cells were then treated with docetaxel (2 nM) where indicated and allowed to grow for 48 h. Apoptosis was evaluated by flow cytometry using Annexin V-Propidium iodide staining. The percentages of apoptotic cells detected after the corresponding treatments (mean ± SD) are plotted. (E). Representative dot-plots of experiments conducted as in (C and D) are shown. * P < 0.05, *** P < 0.001, **** P < 0.0001, n.s., not significant; one-way ANOVA, Tukey multiple comparisons post-test.
As indicated above, SGI-1776-VHL-02 degraded PIM1, 2, and 3, whereas PIM447-VHL-01 was a PIM1-selective PROTAC. We evaluated the effect of long-term treatment (10 days) with the PROTACs. In agreement with our previous observations, we verified that treatment with SGI-1776-VHL-02 efficiently degraded all three PIM isoforms (Figure S4C, S4E, S4G). Treatment with the PIM447-VHL-01 PROTAC degraded PIM1 primarily and minimally reduced PIM2 or PIM3 levels (Figure S4D, S4F, S4H). These observations suggest that PIM2/3 can compensate for PIM1 loss in cells treated with PIM447-VHL-01 since this PROTAC does not degrade PIM2/3, but these isoforms are degraded by SGI-1776-VHL-02 (Figure 5A, S4D). Supporting the enhanced effect of SGI-1776-VHL-02 compared with those of PIM447-VHL-01 and small-molecule PIM inhibitors, we found that c-myc was only downmodulated after treatment with SGI-1776-VHL-02 (Figure 5B, S3).
One function of PIM kinases is to promote resistance to chemotherapy11. Our observations suggest that PIM1 can mediate resistance to docetaxel through catalytic-independent mechanisms (Figure 1D). PROTACs directed against protein kinases abolish both catalytic-dependent and -independent functions, as PROTACs trigger the degradation of their intended target. We tested the effect of inhibiting or degrading PIM kinases in combination with sub-lethal doses of docetaxel to evaluate whether degrading PIM kinases has an increased synergistic effect on promoting apoptosis compared to inhibition of catalytic activity. At a low dose, docetaxel induced apoptosis in 12.37 ± 3.19% of the cells, whereas inhibition of PIM catalytic activity with either SGI-1776 or PIM447 did not significantly increase the percentage of apoptotic cells compared to the vehicle control (i.e., 7.12 ± 1.77% of apoptotic cells after SGI-1776 treatment, 7.83 ± 0.36 after PIM447 treatment, and 5.93 ± 1.28% after DMSO treatment) (Figure 5C, 5E). Treatment of PC3 cells with the SGI-1776-VHL-02 PROTAC significantly increased apoptosis to 24.02 ± 0.96% (Figure 5C, 5E). Treatment with PIM447-VHL-01 also increased the percentage of apoptotic cells to 13.88 ± 0.10%, although this change was not statistically significant (Figure 5D, 5E). We also evaluated the effect of combination treatments. Consistent with the role of PIM kinases in promoting chemoresistance, co-treatment of PC3 cells with docetaxel and either SGI-1776 or PIM447 significantly increased the level of apoptotic cells (12.37 ± 3.19% of apoptotic cells after treatment with docetaxel vs. 22.87 ± 7.07% after treatment with docetaxel + SGI-1776, and 25.40 ± 6.86% after treatment with docetaxel + PIM447) (Figure 5C-E). Co-treatment of PC3 cells with docetaxel and SGI-1776-VHL-02 significantly increased the percentage of apoptotic cells compared to the combination containing SGI-1776 (i.e., 40.85 ± 0.72% of apoptotic cells after treatment with docetaxel + SGI-1776-VHL-02 vs. 22.87 ± 7.07% after treatment with docetaxel + SGI-1776) (Figure 5C, 5E). The combination of PIM447-VHL-01 and docetaxel did not significantly induce more apoptosis than co-treatment with PIM447 and docetaxel (i.e., 26.83 ± 1.66% of apoptotic cells after treatment with docetaxel + PIM447-VHL-01 vs. 25.40 ± 6.86% after treatment with docetaxel + PIM447) (Figure 5D, 5E). Similar results were obtained in LNCaP and C4–2 prostate cancer cell lines, in which combined treatment with SGI-1776-VHL-02 and docetaxel significantly decreased cell viability compared to the treatment with single agents or the combination of SGI-1776 with docetaxel (Figure S5A, S5B). In conclusion, this further supports that co-targeting the three PIM kinase isoforms for degradation will be a superior therapeutic intervention strategy to sensitize prostate cancer cell lines to chemotherapy.
Degrading PIM kinases triggers pro-apoptotic pathways.
To gain mechanistic insights of why SGI-1776-VHL-02 decreased cell viability and tumor growth more efficiently than SGI-1776, we conducted RNA-seq analysis in PC3 cells to compare global transcriptomic changes that result from degrading and inhibiting PIM kinases. This analysis showed that inhibiting or degrading PIM kinases upregulates or downregulates multiple common transcripts (Figure S5C, S5D). We identified a subset of genes specifically induced in the presence of SGI-1776-VHL-02 treated cells enriched in pro-apoptotic genes through gene set enrichment analysis (Figure S5C, S5E). This is consistent with our findings showing increased apoptosis after treatment with SGI-1776-VHL-02 either alone or in combination with docetaxel. These results further reinforce the concept that PIM kinases contribute to cell viability through catalytic and non-catalytic mechanisms which warrants additional investigation.
Discussion
PIM kinases have emerged as important targets in hematological malignancies and multiple solid tumor types, where they not only promote oncogenic traits but also have a prominent role in mediating resistance to radio- and chemotherapy1,11. Consequently, multiple PIM kinase inhibitors have entered clinical trials. We found that treatment of prostate cancer cell lines with different PIM kinase inhibitors increased the expression of all PIM kinase isoforms by affecting their proteasomal turnover and rendering the inhibited kinases more stable (Figure 1, S1). This finding is important as evidence supports that PIM kinases have oncogenic functions independent of their catalytic activity26–28. However, the functional consequences of this increase in PIM expression after inhibitor treatment has not been explored in the context of resistance to chemotherapy. We investigated the functional consequences of increased PIM1 expression by reconstituting PIM1 knockout (KO) PC3 cells with wild-type or kinase-dead PIM1 with levels similar to those of the endogenous protein. Interestingly, both wild-type PIM1 and a PIM1 mutant lacking catalytic activity (K67M) promoted resistance of PC3 cells to docetaxel (Figure 1). These data further support that PIM1 promotes tumorigenesis through catalytic-independent mechanisms. Additionally, we observed that expression of kinase-dead PIM1 in PC3 cells significantly increased PC3 xenograft tumor formation in vivo by this cell line, comparable to that of cells expressing wild-type PIM1 (Figure 1). Thus, our observations support the premise that PIM kinases contribute to tumorigenesis through activity-independent mechanisms, such as acting as a scaffold for signaling complexes, that will not be blocked by catalytic inhibitors. These non-catalytic functions of PIM1 warrant further study.
We reasoned that targeting PIM kinases for degradation would offer superior efficacy compared to inhibition of activity since their degradation abrogates both activity-dependent and -independent mechanisms of tumorigenesis. From the different modalities of targeted protein degradation, we focused on the design of PROTACs by coupling various E3-ubiquitin ligase warheads to three unique PIM kinase inhibitors via a linker. Although we designed several PROTACs sharing the same pharmacophore (SGI-1776) and linker, we found that PROTACs that triggered the VHL E3-ligase complexes were the most potent at degrading PIM1; of note, the PROTAC triggering the Cereblon E3 ligase failed to degrade PIM1 (Figure 2, S2). We then focused on establishing PROTACs that engaged the VHL E3-ligase complex and found that the PROTACs SGI-1776-VHL-02 and PIM447-VHL-01 were the most efficient at triggering PIM1 degradation (Figures 2 and 3). We also observed that the PROTACs we generated displayed a preference towards degradation of PIM1. While SGI-1776 preferentially inhibits PIM124, the PIM447 inhibitor has no selectivity towards any PIM isoform25; nonetheless, we found that the SGI-1776-VHL-02 could also degrade PIM2 and PIM3, while PIM447-VHL-01 was a selective PIM1 degrader (Figure S3). These differences among the PROTACs in their ability to degrade PIM1 or additional PIM isoforms likely rely on the formation of a ternary complex with a conformation that allows ubiquitination and subsequent protein degradation. Notably, this represents the first selective strategy for targeting PIM1, an effect that has not been achieved using small molecule inhibitors and can be an important tool to decode PIM1 specific functions, particularly those not reliant on its catalytic activity. Importantly, we verified that the designed PROTACs induced PIM1 degradation through the expected mechanism of action, as PIM1 degradation was prevented by inhibiting the proteasome, inhibiting the neddylation enzyme Nedd8, out-competing VHL with excess VHL-ligand, using an epimer control that does not bind to the VHL protein, and knocking-down VHL (Figures 3 and 4). Of note, we observed that long-term treatment with the PIM inhibitors at high concentrations could induce the destabilization of some PIM isoforms (Figure S4C-4H). While we do not have a mechanistic explanation for this phenomenon at this stage, and this warrants further study, we hypothesize that prolonged occupancy by these inhibitors might affect the binding of these kinases to chaperone proteins, such as Cdc37, which will ultimately result in protein destabilization. Although we are not aware of such mechanisms for the PIM kinases, this mechanism has been described for other kinases and warrants further investigation29,30.
Consistent with the PROTAC-associated degradation profile, we found that long-term treatment of three different prostate cancer cell lines with either PIM447 or the PIM447-VHL-01 PROTAC showed minimal effects on their long-term growth (Figure 5, S4B); however, treatment of PC3, LNCaP, and C4–2 cells with the SGI-1776-VHL-02 PROTAC had a more potent effect than treatment with SGI-1776 (Figure 5, S4B), although high concentrations were needed for a biological effect.
Our in vitro findings showing limited antitumor efficacy of PIM inhibitors agree with results from clinical trials that show reduced benefit from PIM inhibitor monotherapy, and indicate that the clinical potential of PIM inhibitors relies on their use in combination therapies11. We, therefore, evaluated the potential synergy between PIM inhibitors or PROTACs with sublethal doses of docetaxel (Figure 5, S5). Although both PIM inhibitors, SGI-1776 and PIM447, significantly increased the apoptotic capacity of low-dose docetaxel, only the combination of docetaxel with the SGI-1776-VHL-02 PROTAC significantly increased the percentage of apoptotic cells compared to the combination containing the inhibitor. As stated above, while the SGI-1776-VHL-02 PROTAC could also trigger PIM2 and PIM3 degradation, the PIM447-VHL-01 PROTAC selectively degraded PIM1. These results suggest that the remaining PIM2/3 can compensate for the loss of PIM1, although further studies are necessary. Consistent with these observations, we conducted RNA-seq analysis and observed that SGI-1776-VHL-02 treatment specifically increased the expression of pro-apoptotic genes, providing a mechanistic insight into why this compound had higher activity than its parent compound and indicating that efficient targeting of PIM1/2/3 is needed to maximize the use of PIM-targeting molecules.
In summary, we provide evidence that inhibition of PIM activity can promote intrinsic resistance to PIM inhibitors through stabilization of the PIM kinases; therefore, the use of PROTACs to target PIM kinases for degradation offers an attractive strategy to ultimately target PIM-mediated oncogenic functions. Future studies will examine and pinpoint the exact critical regulators of apoptosis and look to combine therapies promoting apoptosis to completely suppress tumor growth in vivo.
Limitations of the study
In this study, we provide evidence that PIM kinases can have oncogenic functions independent of their kinase activity. For this purpose, we coupled PIM inhibitors to E3-ubiquitin ligands to generate PROTACs and trigger PIM kinase degradation. However, off-target effects of these inhibitors have been acknowledged. For example, SGI-1776 has been shown to inhibit Flt-3 (fms-related receptor tyrosine kinase 3) and TrKA (neurotrophic receptor tyrosine kinase 1) at concentrations that effectively inhibit PIM124. Although PROTACs often display higher selectivity than the parental inhibitors31,32, we cannot completely exclude that some observed effects may result from targeting these alternative kinases.
We aimed to evaluate the antitumor efficacy of the PROTACs generated in this study in xenograft models of prostate cancer, but these studies were limited by the PROTAC’s low solubility for in vivo applications. This phenomenon is commonly observed with PROTACs at early stages of development due to their high molecular weight33,34, thus restricting the use of our first-generation PIM PROTACs beyond proof-of-concept studies at this stage.
In closing, future efforts will be directed into generating second-generation PIM PROTACs with exquisite selectivity towards PIM kinases and improved pharmacokinetic and pharmacodynamic properties.
STAR Methods
RESOURCE AVAILABILITY
Lead contact
Further information and requests for resources and reagents should be directly addressed to the lead contact, John Brognard (john.brognard@nih.gov).
Materials availability
Antibodies, reagents, and cell lines used in this study were obtained from the commercial or academic sources described in the STAR Methods section.
Data and Code Availability
Bulk RNA-seq data have been deposited at GEO and are publicly available as of the date of publication. Accession numbers are listed in the key resources table.
This paper does not report original code.
Any additional information required to reanalyze the data reported in this paper is available from the lead contact upon request.
KEY RESOURCES TABLE
| REAGENT or RESOURCE | SOURCE | IDENTIFIER |
|---|---|---|
| Antibodies | ||
| PIM1 (C93F2) Rabbit monoclonal antibody (1:1000 or 1:500) | Cell Signaling Technology | Cat. #3247S, RRID:AB_2299591 |
| PIM2 (D1D2) Rabbit monoclonal antibody (1:1000) | Cell Signaling Technology | Cat. #4730S, RRID:AB_2163921 |
| PIM3 (D17C9) Rabbit monoclonal antibody (1:1000) | Cell Signaling Technology | Cat. #4165S, RRID:AB_1904094 |
| Rabbit anti- p-IRS1 S1101 (1:500) | Cell Signaling Technology | Cat. #2385S, RRID:AB_330363 |
| Rabbit anti- IRS-1 (1:1000) | Cell Signaling Technology | Cat. #2382, RRID:AB_330333 |
| Phospho-BAD (Ser112) (40A9) Rabbit monoclonal antibody (1:1000) | Cell Signaling Technology | Cat. #5284, RRID:AB_560884 |
| Rabbit anti- BAD (1:1000) | Cell Signaling Technology | Cat. #9292, RRID:AB_331419 |
| Rabbit anti- Ubiquitin (1:2000) | Cell Signaling Technology | Cat. #3933, RRID:AB_2180538 |
| HA (C29F4) Rabbit monoclonal antibody (1:2000) | Cell Signaling Technology | Cat. #3724, RRID:AB_1549585 |
| β-actin (8H10D10) Mouse monoclonal antibody (1:5000) | Cell Signaling Technology | Cat. #3700, RRID:AB_2242334 |
| Recombinant Anti-c-Myc antibody [Y69] (1:1000) | Abcam | Cat. ab32072, RRID:AB_731658 |
| Sheep Anti-Mouse IgG - Horseradish Peroxidase (1:3000) | Global Life Sciences Solutions | Cat. NA931, RRID:AB_772210 |
| Donkey Anti-Rabbit IgG, Whole Ab ECL Antibody, HRP Conjugated (1:3000) | Global Life Sciences Solutions | Cat. NA934, RRID:AB_772206 |
| Pierce™ Anti-HA Magnetic Beads | Thermo Fisher Scientific | Cat. 88837; RRID:AB_2749815 |
| Bacterial and virus strains | ||
| One Shot™ Stbl3™ Chemically Competent E. coli | Thermo Fisher Scientific | Cat. C737303 |
| Chemicals, peptides, and recombinant proteins | ||
| AZD1208 | MedChemExpress | Cat HY-15604, CAS No. : 1204144–28-4 |
| PIM447 | MedChemExpress | Cat. HY-19322, CAS No. : 1210608–43-7 |
| SGI-1776 | MedChemExpress | Cat. HY-13287, CAS No. : 1025065–69-3 |
| SGI-1776-VHL-01 | This paper | N/A |
| SGI-1776-VHL-02 | This paper | N/A |
| AZD1208-VHL-01 | This paper | N/A |
| PIM447-VHL-01 | This paper | N/A |
| MG-132 | MedChemExpress | Cat. HY-13259, CAS No. : 133407–82-6 |
| VH-298 | MedChemExpress | Cat. HY-100947, CAS No. : 2097381–85-4 |
| Cycloheximide | Millipore-Sigma | Cat. C7698, CAS No.: 66–81-9 |
| Doxycycline | Millipore-Sigma | Cat. D3072, CAS No.: 10592–13-9 |
| cOmplete™, EDTA-free Protease Inhibitor Cocktail | Millipore-Sigma | Cat. 5056489001 |
| Phosphatase Inhibitor Cocktail 2 | Millipore-Sigma | Cat. P5726 |
| Phosphatase Inhibitor Cocktail 3 | Millipore-Sigma | Cat. P0044 |
| PEG300 | Sigma-Aldrich | Cat. 1546423, CAS No.: 25322–68-3 |
| Docetaxel | Hikma Pharmaceuticals USA Inc. | Cat. NDC: 00143–9204-01, CAS No. : 114977–28-5 |
| Critical commercial assays | ||
| CellTiter 96 AQueous One Solution Cell Proliferation Assay | Promega | Cat. G3580 |
| Annexin V-FITC apoptosis detection kit | Invitrogen | Cat. BMS500FI-100; RRID:AB_2575598 |
| Power SYBR Green RNA-to-CT 1-Step Kit | Applied Biosystems; Thermo Scientific | Cat. 4389986 |
| Deposited data | ||
| Raw and analyzed RNAseq data of PC3 cells treated with PIM PROTACs | This paper | GEO: GSE237256 |
| Experimental models: Cell lines | ||
| PC3 | National Cancer Institute Repository | RRID:CVCL_0035 |
| PC3-LN4 | ATCC | RRID:CVCL_D578 |
| LNCaP | ATCC | RRID:CVCL_0395 |
| C4–2 | ATCC | RRID:CVCL_4782 |
| PC3-dox-PIM1 | Zemskova et al.35 | N/A |
| PC3-LN4 CRISPR PIM1 | Bearss et al.36 | N/A |
| Experimental models: Organisms/strains | ||
| Mouse: CBySmn.Cg-Prkdcscid/J (Balb/c scid) | The Jackson Laboratory | JAX: 001803 |
| Oligonucleotides | ||
| PIM1 Forward: 5’ CGACATCAAGGACGAAAACATC | This paper | N/A |
| PIM1 Reverse: 5’ ACTCTGGAGGGCTATACACTC | This paper | N/A |
| PIM2 Forward: 5’ GAACATCCTGATAGACCTACGC | This paper | N/A |
| PIM2 Reverse: 5’ CATGGTACTGGTGTCGAGAG | This paper | N/A |
| PIM3 Forward: 5’ GACATCCCCTTCGAGCAG | This paper | N/A |
| PIM3 Reverse: 5’ ATGGGCCGCAATCTGATC | This paper | N/A |
| GAPDH Forward: 5’ CAGCAATGCATCCTGCACC | This paper | N/A |
| GAPDH Reverse: 5’ TGGACTGTGGTCATGAGCCC | This paper | N/A |
| Recombinant DNA | ||
| pcDNA3-HA-PIM1 | Zemskova et al.35 | N/A |
| pcDNA3-HA-PIM1 (K67M) | Zemskova et al.35 | N/A |
| psPAX2 | Addgene | Cat. 12260, RRID:Addgene_12260 |
| pMD2.G | Addgene | Cat. 12259, RRID:Addgene_12259 |
| pCIP | Young et al.37; Addgene | Cat. 79009 |
| pCIP-HA-PIM1 | This paper | N/A |
| pCIP-HA-PIM1 K67M | This paper | N/A |
| ON-TARGETplus Human VHL siRNA | Horizon | Cat. LQ-003936–00-0002 |
| Software and algorithms | ||
| Prism 8 | GraphPad Software | RRID:SCR_002798 |
| ImageJ | Schneider et al.45 | RRID:SCR_003070 |
| GSEA | http://www.broadinstitute.org/gsea/index.jsp | RRID:SCR_003199 |
| FlowJo | FlowJo LLC | RRID:SCR_008520 |
| StudyLog | Studylog Systems | RRID:SCR_016682 |
| Other | ||
| jetPRIME® | Polyplus | Cat. 101000046 |
| RNeasy kit | Qiagen | Cat. 74104 |
| RIPA | Sigma-Aldrich | Cat. R0278 |
| Pierce™ 660nm Protein Assay Reagent | Thermo Scientific | Cat. 22660 |
| RPMI 1640 | Quality Biological | 112–024-101 |
| Glutamax | Gibco | 35050061 |
| Sodium pyruvate | Gibco | 11460070 |
| Penicillin-streptomycin | Gibco | 15140122 |
| Chemidoc | BioRAD | RRID:SCR_019037 |
EXPERIMENTAL MODEL AND SUBJECT DETAILS
Cell lines.
Human prostate cancer cells PC3 (RRID:CVCL_0035) were obtained from the National Cancer Institute Repository. PC3-LN4 (RRID:CVCL_D578), LNCaP (RRID:CVCL_0395), and C4–2 (RRID:CVCL_4782) were purchased from ATCC. PC3-dox-PIM1 and PC3-LN4 CRISPR PIM1 cells were kindly donated by Dr. Andrew S. Kraft (University of Arizona)35,36. All cells were expanded (one to two passages) upon receipt, and several vials were frozen. Cell lines were maintained at 5% CO2 at 37 °C. Cells were cultured in RPMI 1640 (Quality Biological, cat. 112–024-101) + 10% fetal bovine serum (FBS, Atlanta Biologicals) + GlutaMAX (Gibco, cat. 35050061) + 100 nM sodium pyruvate (Gibco, cat. 11360070) + 1% penicillin-streptomycin (pen-strep; Gibco, cat. 15140122).
PC3 xenograft assays.
To generate stable cell lines, HA-PIM1 and HA-PIM1 K67M were cloned into the pCIP vector (Addgene, Cat. 79009; kindly donated by Reuben Shaw)37 for lentiviral expression. PC3 cells were transduced, and stable pools were selected using puromycin. All animal studies were approved by the Institutional Animal Care and Use Committee of the University of Arizona. Male SCID mice at 6–8 weeks of age were used. One million PC3 cells stably expressing vector, PIM1, or PIM1-K67M in PBS were injected subcutaneously into the rear flanks of each (n = 4 mice/group and 2 tumors/mouse). Tumor volume was measured over time by caliper and calculated using the equation: V = (tumor width)2 × tumor volume/2. All of this work is completed under our IACUC protocol 07–029 approved 1/30/2019 and PHS Assurance #A3248–01-USDA # 86-R-003. All mice were male, as these were prostate cancer studies, which is a male-specific disease, and there is no influence of gender on this study.
PROTAC efficacy studies were conducted at the National Cancer Institute (NCI) at Frederick and were approved by the Animal Care and Use Committee of the NCI-Frederick. Briefly, 5×10⁶ PC3 were implanted subcutaneously onto 8-week-old male athymic nude mice (Charles River). When tumors were detectable, mice were randomly assigned to vehicle (5% DMSO, 45% PEG 300 [Sigma Aldrich]) or treatment groups using the Studylog software (Studylog Systems, RRID:SCR_016682). AZD1208 (30 mg/Kg) was administered orally on a 5 days ON/2 days OFF schedule. SGI-1776-VHL-02 (10 mg/Kg or 25 mg/Kg) and PIM447-VHL-01 (10 mg/Kg or 25 mg/Kg) were administered intratumorally. Mice showing signs of ulceration due to tumor growth or treatment were humanely euthanized and not considered for the analysis.
METHOD DETAILS
Plasmids, siRNA, and transfections
HA-PIM1 and HA-PIM1-K67M in pcDNA3 vector were gifts from Dr. Andrew S Kraft (University of Arizona)35. ON-TARGETplus Human VHL siRNA set of 4 was purchased from Horizon. Cells were transfected with the corresponding DNA plasmid or siRNA (50 nM final concentration, equimolar concentration of each RNAi) with JetPrime (Polyplus) according to the manufacturer’s protocol.
Cell lysis and immunoblots.
Following drug treatment, whole-cell extracts were prepared by lysing the cells on ice using RIPA (Sigma-Aldrich, cat. R0278) lysis buffer with the addition of EDTA-free protease inhibitors (Roche, cat. 05 056 489 001) and phosphatase inhibitor cocktail 2 and 3 (Sigma-Aldrich, cat. P2850 and P5726). Lysates were cleared (12,500 × g, 15 minutes, 4 °C), and protein concentration was assessed using the Pierce™ 660nm Protein Assay Reagent (Thermo Scientific, cat. 22660). Lysates prepared with equal amounts of protein were resolved by sodium dodecyl sulfate–polyacrylamide gel electrophoresis (SDS-PAGE) in 4–20% gradient gels (Bio-Rad) and transferred onto low fluorescence polyvinylidene fluoride membranes.
Immunoprecipitation and PIM ubiquitination assays.
To assess the ubiquitination of PIM1, PC3 cells were transfected with HA-tagged PIM1. Cells were then treated with PIM447 or DMSO prior to MG-132 addition for the indicated times. Cells were harvested in IP lysis buffer (20 mM Tris HCl pH 8, 137 mM NaCl, 10% glycerol, 1% Nonidet P-40, and 2 mM EDTA) with protease inhibitors. Lysates were incubated overnight at 4 °C with HA magnetic beads (Pierce Biotechnology, Waltham, MA, USA, cat. 88836; RRID:AB_2749815) and subjected to immunoblotting.
Protein degradation assays
To assess changes in protein degradation, PC3 cells were transfected with HA-PIM1 or HA PIM1 (K67M) or a control vector. The following day, cells were treated with 10 μM cycloheximide with or without PIM447 and lysates were harvested at the stated timepoints. Immunoblotting was performed as described above.
RNA extraction and RT-qPCR
PC3 cells were seeded into 6-well plates (2000 cells/well) and treated with PIM inhibitors or PROTACs at the concentrations and times indicated (see corresponding figure legends). RNA was then extracted using the RNeasy kit (Qiagen, cat. 74104) according to the manufacturer’s protocol. PIM1, PIM2, and PIM3 mRNA levels were measured by RT-qPCR with the Power SYBR Green RNA-to-CT 1-Step Kit (Applied Biosystems; Thermo Scientific cat. 4389986) following the protocol recommended by the manufacturer. The primers used are listed in the Key Resources Table.
RNA-seq
Messenger RNA was purified from total RNA using poly-T oligo-attached magnetic beads. After fragmentation, the first strand cDNA was synthesized using random hexamer primers, followed by the second strand cDNA synthesis using dUTP for directional library. The library was ready after end repair, A-tailing, adapter ligation, size selection, USER enzyme digestion, amplification, and purification. The library was checked with Qubit and real-time PCR for quantification and bioanalyzer for size distribution detection.
RNA-seq deconvolution, data filtering, and clustering.
Raw data (raw reads) in fastq format was firstly processed through in-house perl scripts. In this step, clean data (clean reads) was obtained by removing reads containing adapter, reads containing ploy-N and low-quality reads from raw data. At the same time, Q20, Q30 and GC content were calculated. All the downstream analyses were based on the clean data with high quality.
Mapping reads to the reference genome.
Reference genome and gene model annotation files were downloaded from genome website directly. Index of the reference genome was built using Hisat2 v2.0.5 and paired-end clean reads were aligned to the reference genome using Hisat2 v2.0.5. We selected Hisat238 as the mapping tool for that Hisat2 can generate a database of splice junctions based on the gene model annotation file and generate a better mapping result than other non-splice mapping tools.
Quantification of gene expression level.
FeatureCounts39 v1.5.0-p3 was used to count the number of reads mapped to each gene. Then FPKM of each gene was calculated based on the length of the gene and reads count mapped to this gene.
Differential expression analysis.
Differential expression40 analysis of two conditions/groups (two biological replicates per condition, each with three technical replicates) was performed using the DESeq2R package (1.20.0)41. DESeq2 provide statistical routines for determining differential expression in digital gene expression data using a model based on the negative binomial distribution. The resulting P-values were adjusted using the Benjamini and Hochberg’s approach for controlling the false discovery rate. Genes with an adjusted P-value ≤ 0.05 found by DESeq2 were assigned as differentially expressed. DESeq2 results were filtered to include only the top 50 differentially expressed genes after log2 fold change shrinkage at FDR <0.05. This list of genes was used to subset the transformed data to calculate Z-scores for clustering.
Gene Ontology (GO) and KEGG e nrichment analysis of differentially expressed genes.
GO42 enrichment analysis of differentially expressed genes was implemented by the clusterProfiler R package, in which gene length bias was corrected. GO terms with corrected Pvalue less than 0.05 were considered significantly enriched by differential expressed genes. KEGG is a database resource for understanding high-level functions and utilities of the biological system, such as the cell, the organism and the ecosystem, from molecular-level information, especially large-scale molecular datasets generated by genome sequencing and other high-throughput experimental technologies (http://www.genome.jp/kegg/). We used clusterProfiler R package to test the statistical enrichment of differential expression genes in KEGG43 pathways.
Gene Set Enrichment Analysis (GSEA).
To determine if a pre-defined Gene Set can show a significant consistent difference between two biological states, the genes were ranked according to the degree of differential expression in the two samples. Then the predefined Gene Sets were tested to see if they were enriched at the top or bottom of the list. A local version of the GSEA analysis tool (http://www.broadinstitute.org/gsea/index.jsp) was used. GO and KEGG data set were used for GSEA independently.
Annexin V Apoptosis Assay
PC3 cells were pre-treated with PROTAC compounds or inhibitors in equivalent doses for 4 hours, and then incubated with DMSO or docetaxel for additional 48 hours. After the treatment, cells were harvested and stained using the Annexin V-FITC apoptosis detection kit (cat. BMS500FI-100, Invitrogen; RRID:AB_2575598), according to the manufacturer’s instructions. Flow cytometry analysis was performed with LSR II Fortessa (BD Biosciences), and the results were analyzed using FlowJo (RRID:SCR_008520).
Cell viability assay
Ten thousand cells were plated onto a 96-well plate and allowed to grow for 24 h prior to the addition drug. Assays were performed after 48 h incubation with the indicated drugs. For crystal violet assays, media was removed from the cells by aspiration, 50 μL crystal violet solution (0.5% in 25% Methanol) was added to each well, and plates were incubated for 30 min at 37°C. After incubation, the solution was removed and 100 μL of 1% SDS was added to each well for 15 min, and the absorbance was read at 595 nm.
MTS cell viability assays
MTS cell viability assay was conducted as previously reported44. The IC50 value for each PROTAC was calculated with Prism 8 (GraphPad Software; RRID:SCR_002798).
Colony formation assay
PC3, LnCap, and C4–2 cells were seeded into 6-well plates (2000 cells/well) and treated with increasing concentrations of PROTAC compounds (SGI-1776-VHL-02 or PIM447-VHL-01) or small-molecule inhibitors. Media containing fresh PROTAC compounds or inhibitors were replaced every 96 hours for a total of 10 days. Following the treatment, plates were washed with PBS, fixed with 4% paraformaldehyde solution, and stained with crystal violet. Next, wells were thoroughly washed with water and air-dried. Pictures of the plates were taken with a Chemidoc (BioRad; RRID:SCR_019037). Quantification of the area covered by colonies in each well, as a surrogate of cell viability, was performed using ImageJ (RRID:SCR_003070)45.
CHEMICAL SYNTHESIS AND CHARACTERIZATION
NMR spectra are provided in Supplementary Data S1.
General information for chemical synthesis.
Starting materials were used as received unless otherwise noted. All moisture sensitive reactions were performed in an inert atmosphere of argon with oven dried glassware. Reagent grade solvents were used for extractions and flash chromatography. Reaction progress was monitored by LC-MS analysis performed on an Agilent UPLC/MS instrument equipped with a RP-C18 column (Poroshell 120 SB-C18, 4.6 X 50 mm, 2.7 μm or Zorbax 300SB-C18, 4.6 X 50 mm, 3.5 μm), dual atmospheric pressure chemical ionization (APCI)/electrospray (ESI) mass spectrometry detector, and photodiode array detector. Flash chromatography was performed by using a RediSepRf NP-silica (40–63 μm 60 Å) or a Teledyne RediSepRf Gold RP-C18 column (20–40 μm 100 Å) in a Teledyne ISCO CombiFlash Rf 200 purification system unless otherwise specified. 1H NMR spectra were recorded on an Agilent 400 MHz spectrometer and are reported in parts per million (ppm) on the δ scale relative to CDCl3 (δ 7.26) and DMSO-d6 (δ 2.50) as internal standards. Data are reported as follows: chemical shift, multiplicity (s = singlet, d = doublet, t = triplet, q = quartet, b = broad, m = multiplet), coupling constants (Hz), and integration. 13C-NMR spectra were recorded on an Agilent 100 MHz and are reported in parts per million (ppm) on the δ scale relative to CDCl3 (δ 77.00), CD3OD and DMSO-d6 (δ 39.52).
Synthesis and characterization data.
SGI-1776-VHL-01, SGI-1776-VHL-02, SGI-1776-VHL-02-epimer, SGI-1776-CRBN-01, SGI-1776-IAP-01, AZD1208-VHL-01, PIM447-VHL-01, and PIM447-VHL-01-epimer were synthesized according to the procedures described below and characterization data (1H NMR, 13C NMR, 19F NMR and high-resolution mass spectrometry (HRMS)) are included.
Synthesis of (2S,4R)-1-((S)-3,3-dimethyl-2-(3-(2-(2-(4-(((3-(3-(trifluoromethoxy)phenyl)imidazo[1,2-b]pyridazin-6-yl)amino)methyl)piperidin-1-yl)ethoxy)ethoxy)propanamido)butanoyl)-4-hydroxy-N-((S)-1-(4-(4-methylthiazol-5-yl)phenyl)ethyl)pyrrolidine-2-carboxamide (SGI-1776-VHL-01).
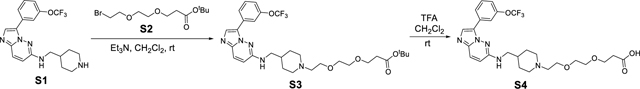
N-(piperidin-4-ylmethyl)-3-(3-(trifluoromethoxy)phenyl)imidazo[1,2-b]pyridazin-6-amine S1 (400 mg, 1.02 mmol) in CH2Cl2 (10 mL) was taken into round bottom flask under argon, and then tert-butyl 3-(2-(2-bromoethoxy)ethoxy)propanoate S2 (333 mg, 1.12 mmol) in CH2Cl2 (2 mL) and Et3N (0.3 mL, 2.04 mmol) were added. The reaction mixture was than stirred overnight, which was quenched with aqueous NaHCO3 solution, extract with CH2Cl2 and dried (Na2SO4). After concentration, the crude product was purified by an ISCO combi flash silica gel column (CH2Cl2/MeOH) to give tert-butyl 3-(2-(2-(4-(((3-(3-(trifluoromethoxy)phenyl)imidazo[1,2-b]pyridazin-6-yl)amino)methyl)piperidin-1-yl)ethoxy)ethoxy)propanoate S3 (520 mg, 84%). 1H NMR (400 MHz, cdcl3) δ 8.28 (s, 1H), 7.90 – 7.74 (m, 2H), 7.66 (dd, J = 9.7, 0.5 Hz, 1H), 7.45 (t, J = 8.1 Hz, 1H), 7.20 – 7.08 (m, 1H), 6.59 (d, J = 9.6 Hz, 1H), 5.31 (d, J = 9.3 Hz, 1H), 3.88 – 3.72 (m, 2H), 3.67 (td, J = 6.4, 0.5 Hz, 2H), 3.64 – 3.54 (m, 4H), 3.49 (d, J = 11.7 Hz, 2H), 3.40 (t, J = 5.7 Hz, 2H), 3.01 (t, J = 4.9 Hz, 2H), 2.59 (s, 2H), 2.46 (td, J = 6.4, 0.5 Hz, 2H), 2.03 (d, J = 14.4 Hz, 1H), 1.91 (d, J = 8.6 Hz, 4H), 1.42 (s, 9H). 13C NMR (101 MHz, cdcl3) δ 170.84, 153.28, 149.34, 138.03, 130.73, 129.71, 126.33, 126.19, 124.42, 119.10, 118.33, 111.99, 80.63, 70.39, 70.11, 66.84, 66.61, 56.96, 53.57, 46.68, 36.23, 33.05, 28.05, 27.49. 19F NMR (376 MHz, cdcl3) δ −57.45. HRMS (m/z): [M+H]+ calcd. for C30H41F3N5O5, 608.3060; found, 608.3063.
In a round bottom flask, the tert-butyl ester S3 (300 mg, 0.49 mmol) was dissolved with 4 mL CH2Cl2/TFA (1:1) and stirred for 1 hour at room temperature (monitored by LC-MS). The solvent and TFA were removed under reduced pressure and lyophilized for overnight to provide the crude product 3-(2-(2-(4-(((3-(3- (trifluoromethoxy)phenyl)imidazo[1,2-b]pyridazin-6-yl)amino)methyl)piperidin-1-yl)ethoxy)ethoxy)propanoic acid (S4), which was used for the next step without further purification. 1H NMR (400 MHz, cd3od) δ 8.34 – 8.11 (m, 2H), 8.06 – 7.95 (m, 1H), 7.90 (s, 1H), 7.61 (t, J = 8.1 Hz, 1H), 7.45 – 7.26 (m, 1H), 7.13 (d, J = 8.7 Hz, 1H), 3.80 (dd, J = 5.9, 4.0 Hz, 2H), 3.77 – 3.54 (m, 6H), 3.41 – 3.23 (m, 6H), 3.08 – 2.89 (m, 2H), 2.51 (t, J = 6.1 Hz, 2H), 2.08 (d, J = 14.6 Hz, 3H), 1.61 (d, J = 13.7 Hz, 2H). 13C NMR (101 MHz, cd3od) δ 173.81, 155.28, 149.20, 149.18, 130.23, 129.07, 125.68, 124.39, 121.84, 121.51, 120.78, 119.36, 119.29, 117.96, 69.82, 69.79, 66.31, 66.14, 64.04, 56.35, 52.66, 46.06, 34.39, 34.23, 32.47, 27.27. 19F NMR (376 MHz, cd3od) δ −58.95. HRMS (m/z): [M+H]+ calcd. for C26H33F3N5O5, 552.2434; found, 552.2437.

The crude acid S4 (90 mg, 0.16 mmol) was dissolved in DMF (2 mL) under argon, and then (2S,4R)-1-((S)-2-amino-3,3-dimethylbutanoyl)-4-hydroxy-N-((S)-1-(4-(4-methylthiazol-5-yl)phenyl)ethyl)pyrrolidine-2-carboxamide hydrochloride salt E3 ligase ligand 1 (0.16 mmol, 78 mg), 1-[bis(dimethylamino)methylene]-1H-1,2,3-triazolo[4,5-b]pyridinium 3-oxid hexafluorophosphate, N-[(dimethylamino)-1H-1,2,3-triazolo-[4,5-b]29yridazi-1-ylmethylene]-N-methylmethanaminium hexafluorophosphate N-oxide (HATU) (81 mg, 0.21 mmol) and N,N-diisopropylethylamine (DIPEA) (120 μL, 0.64 mmol) were added to the reaction mixture. The reaction mixture was than stirred for 2 hours (monitored by LC-MS) and the crude material was purified by a preparatory HPLC with a Xbridge BEH C18 OBD Prep Column, 130Å, 5 μm, 30 mm X 150 mm reversed-phase column as the stationary phase. Water (buffered with 0.05% trifluoroacetic acid) and MeCN (buffered with 0.05% trifluoroacetic acid) were used as the mobile phase and HPLC conditions: UV collection 254 nm, flow rate 30 mL/min, 20% MeCN as linear gradient for 5 min and 20% → 48% MeCN for 5 to 20 min. The HPLC fractions were combined and lyophilized to yield SGI-1776-VHL-01 (55 mg, 35%). 1H NMR (400 MHz, dmso) δ 9.26 (s, 1H), 8.97 (d, J = 0.4 Hz, 1H), 8.43 – 8.26 (m, 3H), 8.08 (ddd, J = 8.0, 1.6, 0.9 Hz, 1H), 7.94 (d, J = 9.8 Hz, 1H), 7.84 (d, J = 9.4 Hz, 1H), 7.72 – 7.59 (m, 2H), 7.44 – 7.33 (m, 4H), 6.99 (d, J = 9.6 Hz, 1H), 4.96 – 4.79 (m, 1H), 4.51 (d, J = 9.3 Hz, 1H), 4.39 (t, J = 8.1 Hz, 1H), 4.27 (d, J = 3.6 Hz, 1H), 3.71 (t, J = 5.0 Hz, 2H), 3.63 – 3.48 (m, 10H), 3.29 – 3.18 (m, 5H), 2.94 (q, J = 11.7 Hz, 2H), 2.58 – 2.50 (m, 1H), 2.43 (d, J = 0.3 Hz, 3H), 2.33 (dt, J = 14.7, 6.1 Hz, 1H), 2.09 – 1.86 (m, 4H), 1.77 (ddd, J = 12.9, 8.6, 4.6 Hz, 1H), 1.47 (dd, J = 20.2, 3.7 Hz, 1H), 1.35 (d, J = 7.0 Hz, 3H), 0.90 (s, 9H). 13C NMR (101 MHz, dmso) δ 171.00, 170.26, 169.86, 154.87, 151.94, 149.00, 148.19, 145.05, 131.55, 131.15, 130.61, 130.16, 129.27, 126.83, 126.05, 125.66, 124.26, 121.89, 120.58, 119.33, 118.55, 116.23, 70.01, 69.63, 69.20, 67.32, 64.67, 59.02, 56.76, 55.84, 55.36, 52.36, 48.14, 46.55, 38.22, 36.06, 35.82, 32.56, 27.54, 26.82, 22.81, 16.42. 19F NMR (376 MHz, dmso) δ −56.52. HRMS (m/z): [M+H]+ calcd. for C49H63F3N9O7S, 978.4523; found, 978.4532.
Synthesis of N-(2-((2-(2,6-dioxopiperidin-3-yl)-1,3-dioxoisoindolin-5-yl)amino)ethyl)-3-(2-(2-(4-(((3-(3-(trifluoromethoxy)phenyl)imidazo[1,2-b]30yridazine-6-yl)amino)methyl)piperidin-1-yl)ethoxy)ethoxy)propenamide (SGI-1776-CRBN-01).
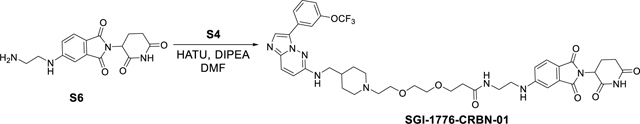
SGI-1776-CRBN-01 was synthesized using the same reaction procedure as SGI-1776-VHL-01. Starting materials S4 (35 mg, 0.06 mmol), 5-((2-aminoethyl)amino)-2-(2,6-dioxopiperidin-3-yl)isoindoline-1,3-dione S6 (22 mg, 0.06 mmol), HATU (30 mg, 0.08 mmol) and DIPEA (0.24 mmol, 47 μL) were used. The reaction mixture was than stirred for 2 hours (monitored by LC-MS) and the crude material was purified by a preparatory HPLC with a Xbridge BEH C18 OBD Prep Column, 130Å, 5 μm, 30 mm X 150 mm reversed-phase column as the stationary phase. Water (buffered with 0.05% trifluoroacetic acid) and MeCN (buffered with 0.05% trifluoroacetic acid) were used as the mobile phase and HPLC conditions: UV collection 254 nm, flow rate 30 mL/min, 20% MeCN as linear gradient for 5 min and 20% → 60% MeCN for 5 to 20 min. The HPLC fractions were combined and lyophilized to yield SGI-1776-CRBN-01 (22 mg, 43%). 1H NMR (400 MHz, dmso) δ 11.07 (s, 1H), 9.35 (s, 1H), 8.38 (s, 1H), 8.22 – 8.01 (m, 2H), 7.95 (s, 1H), 7.74 – 7.47 (m, 3H), 7.44 – 7.32 (m, 1H), 7.13 (d, J = 8.6 Hz, 1H), 7.06 – 6.89 (m, 2H), 6.77 – 6.60 (m, 1H), 5.03 (dd, J = 12.8, 5.4 Hz, 1H), 3.70 (t, J = 5.0 Hz, 2H), 3.63 – 3.44 (m, 8H), 3.33 (t, J = 6.0 Hz, 2H), 3.20 (dd, J = 11.0, 4.6 Hz, 6H), 3.04 – 2.77 (m, 3H), 2.61 – 2.50 (m, 2H), 2.28 (t, J = 6.5 Hz, 2H), 2.08 – 1.86 (m, 4H), 1.58 – 1.38 (m, 2H). 13C NMR (101 MHz, dmso) δ 173.25, 171.04, 170.53, 169.16, 167.71, 154.88, 149.01, 149.00, 146.76, 136.62, 132.64, 131.14, 130.77, 125.65, 124.43, 121.88, 120.57, 119.33, 118.58, 117.54, 116.18, 111.01, 109.70, 69.97, 69.67, 67.09, 66.33, 64.67, 55.81, 52.36, 48.98, 46.56, 41.86, 38.49, 36.46, 34.83, 32.54, 31.42, 27.53, 22.60. 19F NMR (376 MHz, dmso) δ −56.54. HRMS (m/z): [M+H]+ calcd. for C41H47F3N9O8, 850.3500; found, 850.3502.
Synthesis of (2S,4S)-1-((S)-2-cyclohexyl-2-((S)-2-(methylamino)propanamido)acetyl)-N-(®−1,2,3,4-tetrahydronaphthalen-1-yl)-4-(3-(2-(2-(4-(((3-(3-(trifluoromethoxy)phenyl)imidazo[1,2-b]31yridazine-6-yl)amino)methyl)piperidin-1-yl)ethoxy)ethoxy)propanamido)pyrrolidine-2-carboxamide (SGI-1776-IAP-01).
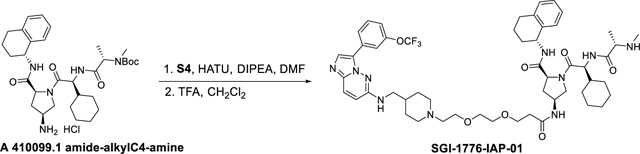
SGI-1776-IAP-01 was synthesized using the same reaction procedure as SGI-1776-VHL-01. The acid S4 (50 mg, 0.09 mmol) was dissolved in CH3CN (5 mL) under argon, and then tert-butyl ((S)-1-(((S)-2-((2S,4S)-4-amino-2-(((R)-1,2,3,4-tetrahydronaphthalen-1-yl)carbamoyl)pyrrolidin-1-yl)-1-cyclohexyl-2-oxoethyl)amino)-1-oxopropan-2-yl)(methyl)carbamate hydrochloride A 410099.1 amide-alkylC4-amine (0.08 mmol, 52 mg), HATU (42 mg, 0.11 mmol) and DIPEA (67 μL, 0.36 mmol) were added to the reaction mixture. The reaction mixture was then stirred for 2 hours at room temperature at which point LC-MS indicated the complete consumption of S4. The solvent was evaporated, water was added to the reaction mixture and product extracted with EtOAc (3 × 10 mL) dried over anhydrous Na2SO4. The concentrated crude material was used for the next step without further purification. The crude SGI-1776-IAP-Boc amine was subjected to 1 mL CH2Cl2/TFA (1:1) and stirred for 1 hour (monitored by LC-MS). The solvent and TFA were removed under reduced pressure and the crude material was purified by a preparatory HPLC with a XBridge BEH C18 OBD Prep Column, 130Å, 5 μm, 30 mm X 150 mm reversed-phase column as the stationary phase. Water (buffered with 0.05% trifluoroacetic acid) and MeCN (buffered with 0.05% trifluoroacetic acid) were used as the mobile phase and HPLC conditions: UV collection 254 nm, flow rate 30 mL/min, 20% MeCN as linear gradient for 5 min and 20% → 60% MeCN for 5 to 20 min. The HPLC fractions were combined and lyophilized to yield SGI-1776-IAP-01 (8 mg, 10%). 1H NMR (400 MHz, dmso) δ 9.44 (s, 1H), 8.91 (bs, 1H), 8.81 (bs, 1H), 8.75 (d, J = 8.1 Hz, 1H), 8.46 – 8.34 (m, 1H), 8.21 (d, J = 7.5 Hz, 1H), 8.08 (dt, J = 8.0, 1.2 Hz, 1H), 7.87 (d, J = 9.7 Hz, 1H), 7.60 (t, J = 8.1 Hz, 1H), 7.56 – 7.49 (m, 1H), 7.36 – 7.29 (m, 1H), 7.29 – 7.25 (m, 1H), 7.18 – 6.99 (m, 3H), 6.88 (d, J = 9.4 Hz, 1H), 4.95 – 4.85 (m, 2H), 4.44 – 4.19 (m, 4H), 4.15 – 4.04 (m, 2H), 3.87 – 3.80 (m, 2H), 3.72 (t, J = 4.9 Hz, 2H), 3.65 – 3.46 (m, 6H), 3.33 – 3.16 (m, 5H), 3.14 – 3.02 (m, 1H), 3.01 – 2.89 (m, 2H), 2.78 – 2.65 (m, 2H), 2.41 – 2.22 (m, 3H), 2.08 – 1.36 (m, 14H), 1.30 (d, J = 6.9 Hz, 3H), 1.26 – 0.76 (m, 7H). 13C NMR (101 MHz, dmso) δ 171.14, 170.33, 169.64, 169.04, 158.32, 154.48, 149.04, 137.73, 137.41, 131.35, 131.02, 129.02, 128.79, 127.13, 126.09, 125.25, 121.90, 119.96, 119.35, 118.09, 114.69, 69.95, 69.63, 66.98, 64.74, 58.82, 56.27, 55.88, 55.79, 52.67, 52.40, 48.12, 47.11, 46.56, 46.16, 38.53, 36.51, 34.72, 32.57, 31.19, 30.26, 29.17, 28.97, 28.52, 27.55, 26.24, 26.14, 25.94, 20.62, 16.16, 9.04. 19F NMR (376 MHz, dmso) δ −56.52. HRMS (m/z): [M+H]+ calcd. for C53H72F3N10O7, 1017.5538; found, 1017.5558.
Synthesis of (2S,4R)-1-((S)-3,3-dimethyl-2-(8-oxo-8-(4-(((3-(3-(trifluoromethoxy)phenyl)imidazo[1,2-b]pyridazin-6-yl)amino)methyl)piperidin-1-yl)octanamido)butanoyl)-4-hydroxy-N-((S)-1-(4-(4-methylthiazol-5-yl)phenyl)ethyl)pyrrolidine-2-carboxamide (SGI-1776-VHL-02).
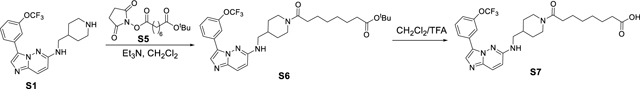
Amine S1 (200 mg, 0.51 mmol) was dissolved in CH2Cl2 (5 mL) under argon, and then 1-(tert-butyl) 8-(2,5-dioxopyrrolidin-1-yl) octanedioate S5 (200 mg, 0.61 mmol) and Et3N (220 μL, 1.53 mmol) were added to the reaction mixture. The reaction mixture was than stirred for overnight, which was quenched with aqueous NaHCO3 solution, extract with CH2Cl2 and dried (Na2SO4). After concentration, the crude product tert-butyl 8-oxo-8-(4-(((3-(3-(trifluoromethoxy)phenyl)imidazo[1,2-b]pyridazin-6-yl)amino)methyl)piperidin-1-yl)octanoate S6 was subjected to 1 mL CH2Cl2/TFA (1:1) and stirred for 1 hour (monitored by LC-MS). The solvent and TFA were removed under reduced pressure and the crude material was purified by an ISCO combi flash silica gel column (CH2Cl2/MeOH) to give 8-oxo-8-(4-(((3-(3-(trifluoromethoxy)phenyl)imidazo[1,2-b]pyridazin-6-yl)amino)methyl)piperidin-1-yl)octanoic acid S7 (165 mg, 59%, over two steps). 1H NMR (400 MHz, cd3od) δ 8.28 (s, 1H), 8.11 (s, 1H), 8.00 – 7.90 (m, 1H), 7.82 (d, J = 9.8 Hz, 1H), 7.57 (t, J = 8.1 Hz, 1H), 7.33 (ddt, J = 8.3, 2.3, 1.1 Hz, 1H), 7.04 (d, J = 9.8 Hz, 1H), 4.54 (d, J = 13.2 Hz, 1H), 3.97 (d, J = 13.7 Hz, 1H), 3.63 (s, 1H), 3.30 – 3.27 (m, 1H), 3.06 (ddd, J = 14.4, 12.6, 2.7 Hz, 1H), 2.60 (td, J = 12.8, 2.8 Hz, 1H), 2.36 (t, J = 7.6 Hz, 2H), 2.28 (dt, J = 11.3, 7.4 Hz, 2H), 2.04 (ddd, J = 11.2, 7.4, 4.0 Hz, 1H), 1.95 – 1.79 (m, 2H), 1.58 (td, J = 7.1, 4.1 Hz, 4H), 1.35 (dq, J = 7.3, 3.6 Hz, 4H), 1.31 – 1.07 (m, 2H). 13C NMR (101 MHz, cd3od) δ 176.12, 174.49, 172.46, 155.17, 149.20, 134.57, 130.11, 129.31, 127.23, 125.46, 122.66, 121.74, 120.58, 119.23, 117.37, 50.57, 46.70, 45.60, 41.51, 35.15, 33.46, 33.30, 32.70, 30.51, 29.61, 28.67, 28.52, 25.06, 24.49. 19F NMR (376 MHz, cd3od) δ −58.90. HRMS (m/z): [M+H]+ calcd. for C27H33F3N5O5, 548.2485; found, 548.2481.
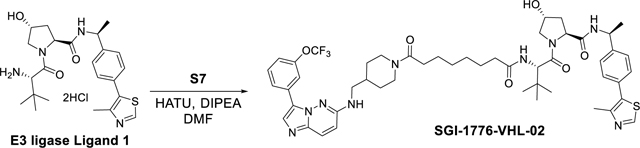
SGI-1776-VHL-02 was synthesized using the same reaction procedure as SGI-1776-VHL-01. Starting materials S7 (62 mg, 0.11 mmol), E3 ligase ligand 1 (54 mg, 0.11 mmol) and DIPEA (62 μL, 0.33 mmol) were used. The reaction mixture was than stirred for 2 hours (monitored by LC-MS) and the crude material was purified by a preparatory HPLC with a XBridge BEH C18 OBD Prep Column, 130Å, 5 μm, 30 mm X 150 mm reversed-phase column as the stationary phase. Water (buffered with 0.05% trifluoroacetic acid) and MeCN (buffered with 0.05% trifluoroacetic acid) were used as the mobile phase and HPLC conditions: UV collection 254 nm, flow rate 30 mL/min, 20% MeCN as linear gradient for 5 min and 20% → 60% MeCN for 5 to 24 min. The HPLC fractions were combined and lyophilized to yield SGI-1776-VHL-02 (55 mg, 51%). 1H NMR (400 MHz, cdcl3) δ 8.62 (s, 1H), 8.28 (dt, J = 2.6, 1.3 Hz, 1H), 7.91 – 7.73 (m, 2H), 7.72 – 7.55 (m, 2H), 7.39 (t, J = 8.1 Hz, 1H), 7.36 – 7.29 (m, 4H), 7.11 (ddt, J = 8.2, 2.3, 1.1 Hz, 1H), 6.57 (d, J = 9.7 Hz, 1H), 6.49 (dd, J = 9.0, 2.2 Hz, 1H), 5.72 (dt, J = 12.4, 5.8 Hz, 1H), 5.06 (p, J = 7.0 Hz, 1H), 4.69 (t, J = 7.9 Hz, 1H), 4.63 – 4.53 (m, 2H), 4.48 (s, 1H), 4.01 (d, J = 11.1 Hz, 1H), 3.81 (d, J = 13.3 Hz, 1H), 3.61 (dd, J = 11.1, 3.8 Hz, 1H), 3.38 – 3.16 (m, 2H), 2.95 (t, J = 12.8 Hz, 1H), 2.54 – 2.41 (m, 4H), 2.38 – 2.21 (m, 2H), 2.20 – 1.93 (m, 3H), 1.81 (t, J = 12.7 Hz, 2H), 1.55 (q, J = 7.0 Hz, 4H), 1.44 (d, J = 6.9 Hz, 3H), 1.33 – 1.20 (m, 4H), 1.14 (q, J = 9.3 Hz, 1H), 1.00 (s, 9H). 13C NMR (101 MHz, cdcl3) δ 173.64, 171.75, 171.56, 170.23, 153.46, 150.36, 149.31, 148.33, 143.38, 137.77, 131.60, 131.37, 130.70, 130.10, 129.69, 129.45, 126.43, 126.36, 125.74, 124.37, 121.81, 119.21, 118.39, 112.43, 69.75, 58.87, 57.44, 56.88, 48.76, 47.25, 45.68, 41.72, 36.20, 35.39, 35.31, 35.27, 33.16, 30.67, 29.82, 28.86, 28.69, 26.50, 25.31, 25.08, 22.17, 16.03. 19F NMR (376 MHz, cdcl3) δ −57.39. HRMS (m/z): [M+H]+ calcd. for C50H63F3N9O6S, 974.4574; found, 974.4586.
Synthesis of (2S,4S)-1-((S)-3,3-dimethyl-2-(8-oxo-8-(4-(((3-(3-(trifluoromethoxy)phenyl)imidazo[1,2-b]pyridazin-6-yl)amino)methyl)piperidin-1-yl)octanamido)butanoyl)-4-hydroxy-N-((S)-1-(4-(4-methylthiazol-5-yl)phenyl)ethyl)pyrrolidine-2-carboxamide (SGI-1776-VHL-02-epimer).
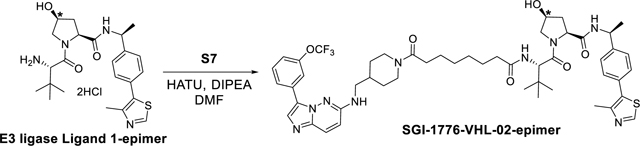
SGI-1776-VHL-02-epimer was synthesized using the same reaction procedure as SGI-1776-VHL-02. Starting materials S7 (30 mg, 0.06 mmol), (2S,4S)-1-((S)-2-amino-3,3-dimethylbutanoyl)-4-hydroxy-N-((S)-1-(4-(4-methylthiazol-5-yl)phenyl)ethyl)pyrrolidine-2-carboxamide hydrochloride E3 ligase ligand 1-epimer (34 mg, 0.06 mmol) and DIPEA (35 μL, 0.18 mmol) were used. The reaction mixture was than stirred for 2 hours (monitored by LC-MS) and the crude material was purified by a preparatory HPLC with a XBridge BEH C18 OBD Prep Column, 130Å, 5 μm, 30 mm X 150 mm reversed-phase column as the stationary phase. Water (buffered with 0.05% trifluoroacetic acid) and MeCN (buffered with 0.05% trifluoroacetic acid) were used as the mobile phase and HPLC conditions: UV collection 254 nm, flow rate 30 mL/min, 20% MeCN as linear gradient for 5 min and 20% → 60% MeCN for 5 to 24 min. The HPLC fractions were combined and lyophilized to yield SGI-1776-VHL-02-epimer (23 mg, 40%). 1H NMR (400 MHz, cdcl3) δ 10.22 (s, 1H), 9.07 (s, 1H), 8.19 (d, J = 9.4 Hz, 1H), 8.12 (s, 1H), 7.87 (s, 1H), 7.71 (t, J = 8.7 Hz, 1H), 7.55 (t, J = 8.1 Hz, 1H), 7.46 – 7.28 (m, 6H), 6.94 (d, J = 9.7 Hz, 1H), 6.38 (d, J = 8.7 Hz, 1H), 5.08 (q, J = 7.4 Hz, 1H), 4.79 – 4.40 (m, 4H), 3.98 – 3.79 (m, 3H), 3.31 (s, 2H), 3.03 (t, J = 12.9 Hz, 1H), 2.62 – 2.49 (m, 4H), 2.39 – 2.12 (m, 6H), 2.08 – 1.75 (m, 3H), 1.67 – 1.44 (m, 7H), 1.26 (d, J = 49.7 Hz, 3H), 1.10 – 1.02 (m, 11H). 13C NMR (101 MHz, cdcl3) δ 173.90, 172.40, 171.73, 170.53, 156.80, 155.71, 152.02, 149.37, 143.62, 143.16, 133.06, 130.52, 129.67, 129.62, 129.28, 128.04, 127.64, 126.81, 125.83, 122.02, 121.21, 120.07, 119.79, 118.94, 114.31, 70.99, 60.25, 58.54, 57.49, 49.30, 47.09, 45.81, 41.95, 36.07, 35.12, 35.02, 34.96, 34.88, 33.06, 30.52, 29.64, 28.66, 28.48, 26.40, 25.25, 21.80, 14.56. 19F NMR (376 MHz, cdcl3) δ −57.38. HRMS (m/z): [M+H]+ calcd. for C50H63F3N9O6S, 974.4574; found, 974.4581.
Synthesis of N1-((S)-1-(3-((Z)-(2,4-dioxothiazolidin-5-ylidene)methyl)-[1,1’-biphenyl]-2-yl)piperidin-3-yl)-N8-((S)-1-((2S,4R)-4-hydroxy-2-(((S)-1-(4-(4-methylthiazol-5-yl)phenyl)ethyl)carbamoyl)pyrrolidin-1-yl)-3,3-dimethyl-1-oxobutan-2-yl)octanediamide (AZD1208-VHL-01).
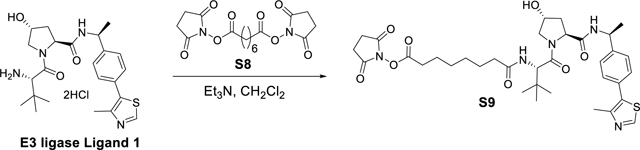
E3 ligase Ligand 1 (3 g, 6.24 mmol) and di-N-succinimidyl suberate S8 (2.8 g, 7.5 mmol) in CH2Cl2 (30 mL) was added Et3N (2 mL, 13.72 mmol). The suspension was stirred overnight, then concentrated under reduced pressure. The residue was subjected to flash chromatography (CH2Cl2/MeOH) to yield 2.3 g (53% yield) of the desired product 2,5-dioxopyrrolidin-1-yl 8-(((S)-1-((2S,4R)-4-hydroxy-2-(((S)-1-(4-(4-methylthiazol-5-yl)phenyl)ethyl)carbamoyl)pyrrolidin-1-yl)-3,3-dimethyl-1-oxobutan-2-yl)amino)-8-oxooctanoate S9 as a colorless glassy residue. 1H NMR (400 MHz, cdcl3) δ 8.80 (s, 1H), 7.46 – 7.34 (m, 5H), 6.39 (d, J = 8.8 Hz, 1H), 5.08 (p, J = 7.0 Hz, 1H), 4.66 (t, J = 8.0 Hz, 1H), 4.57 (d, J = 8.8 Hz, 1H), 4.51 (s, 1H), 4.16 – 4.07 (m, 1H), 3.60 (dd, J = 11.4, 3.5 Hz, 1H), 2.82 (s, 4H), 2.59 (t, J = 7.3 Hz, 2H), 2.55 (s, 3H), 2.44 (ddd, J = 12.9, 8.0, 4.6 Hz, 1H), 2.25 (td, J = 7.3, 3.3 Hz, 2H), 2.10 (dd, J = 13.5, 8.1 Hz, 1H), 1.73 (p, J = 7.3 Hz, 2H), 1.63 (dq, J = 11.7, 6.9 Hz, 2H), 1.48 (d, J = 6.9 Hz, 3H), 1.46 – 1.28 (m, 4H), 1.03 (s, 9H). 13C NMR (101 MHz, cdcl3) δ 174.16, 171.99, 169.85, 169.46, 168.71, 150.91, 147.48, 143.64, 142.11, 130.17, 129.53, 126.57, 70.05, 58.58, 57.59, 56.85, 48.86, 35.81, 35.68, 35.02, 30.80, 28.06, 27.91, 26.46, 25.43, 25.00, 24.34, 22.19, 15.59. HRMS (m/z): [M+H]+ calcd. for C25H47N5O8S, 698.3224; found, 698.3222.
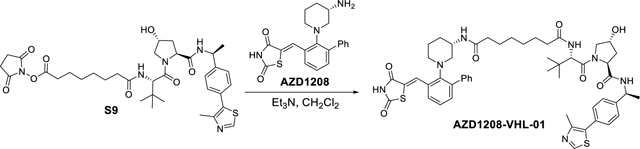
NHS ester S9 (66 mg, 0.09 mmol) and AZD1208 (36 mg, 0.09 mmol) in CH2Cl2 (2 mL) was added Et3N (16 μL, 13.72 mmol) at room temperature under argon atmosphere. The reaction mixture was than stirred for overnight, which was quenched with aqueous NaHCO3 solution, extract with CH2Cl2 and dried (Na2SO4). After concentration, the crude product was purified by an ISCO combi flash silica gel column (CH2Cl2/MeOH) to provide AZD1208-VHL-01 (46 mg, 52% yield). 1H NMR (400 MHz, cdcl3) δ 12.09 (s, 1H), 8.73 (s, 1H), 8.21 (s, 1H), 7.65 – 7.30 (m, 9H), 7.26 – 7.14 (m, 5H), 6.23 (s, 1H), 5.23 – 5.02 (m, 1H), 4.80 – 4.60 (m, 2H), 4.55 (s, 1H), 4.15 (d, J = 11.5 Hz, 1H), 3.84 (s, 1H), 3.69 (dd, J = 11.3, 3.5 Hz, 1H), 3.09 (s, 1H), 2.94 – 2.76 (m, 1H), 2.68 (s, 2H), 2.52 (s, 3H), 2.46 – 1.77 (m, 8H), 1.71 – 1.43 (m, 9H), 1.25 (d, J = 39.1 Hz, 5H), 1.05 (s, 9H). 13C NMR (101 MHz, cdcl3) δ 174.73, 174.34, 172.54, 172.38, 172.28, 169.87, 150.55, 148.14, 143.42, 140.87, 140.23, 134.80, 131.87, 131.40, 130.55, 129.49, 129.33, 129.21, 128.25, 128.09, 127.62, 127.46, 126.61, 126.58, 123.90, 70.06, 59.27, 57.51, 57.16, 56.25, 53.43, 48.97, 44.70, 36.26, 36.14, 35.33, 35.19, 28.00, 27.82, 26.48, 25.45, 25.31, 24.83, 22.12, 21.34, 15.93. HRMS (m/z): [M+H]+ calcd. for C52H64N7O7S2, 962.4309; found, 962.4309.
Synthesis of N1-((1S,5S)-3-(3-(6-(2,6-difluorophenyl)-5-fluoropicolinamido)pyridin-4-yl)-5-methylcyclohexyl)-N8-((S)-1-((2S,4R)-4-hydroxy-2-(((S)-1-(4-(4-methylthiazol-5-yl)phenyl)ethyl)carbamoyl)pyrrolidin-1-yl)-3,3-dimethyl-1-oxobutan-2-yl)octanediamide (PIM447-VHL-01).
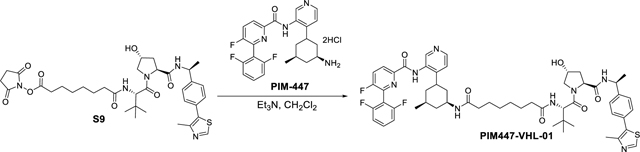
PIM447-VHL-01 PROTAC was synthesized using the same method as SGI1776-VHL-01. Starting materials S9 (41 mg, 0.06 mmol), PIM447 (30 mg, 0.06 mmol) and Et3N (35 μL, 0.24 mmol) were used to provide PIM447-VHL-01 (37 mg, 61%). 1H NMR (400 MHz, cdcl3) δ 9.91 (s, 1H), 9.32 (s, 1H), 8.64 (s, 1H), 8.51 – 8.27 (m, 1H), 7.74 (t, J = 8.5 Hz, 1H), 7.57 – 7.42 (m, 2H), 7.42 – 7.29 (m, 4H), 7.17 (d, J = 5.2 Hz, 1H), 7.08 (t, J = 8.2 Hz, 2H), 6.31 (d, J = 8.8 Hz, 1H), 5.89 (d, J = 7.8 Hz, 1H), 5.07 (p, J = 7.0 Hz, 1H), 4.69 (t, J = 7.9 Hz, 1H), 4.57 (d, J = 8.9 Hz, 1H), 4.47 (s, 1H), 4.01 (d, J = 11.2 Hz, 1H), 3.87 (dtd, J = 11.6, 7.8, 3.9 Hz, 1H), 3.60 (dd, J = 11.2, 3.8 Hz, 1H), 2.94 – 2.83 (m, 1H), 2.49 (s, 3H), 2.41 (ddd, J = 12.8, 7.9, 4.7 Hz, 1H), 2.24 – 2.01 (m, 6H), 1.95 (d, J = 12.5 Hz, 1H), 1.80 (d, J = 13.0 Hz, 1H), 1.62 – 1.49 (m, 5H), 1.45 (d, J = 6.9 Hz, 3H), 1.38 (q, J = 12.0 Hz, 1H), 1.24 (q, J = 4.8 Hz, 5H), 1.01 (s, 9H), 0.98 – 0.83 (m, 1H), 0.83 – 0.77 (m, 4H). 13C NMR (101 MHz, cdcl3) δ 173.51, 172.42, 171.86, 169.91, 161.78, 160.99, 159.21, 158.36, 150.31, 148.42, 145.85, 145.45, 145.29, 143.74, 143.24, 137.04, 136.86, 131.93, 131.56, 130.81, 129.50, 126.43, 125.52, 125.32, 124.73, 121.05, 112.03, 111.78, 69.85, 58.66, 57.43, 56.77, 48.78, 47.98, 41.06, 40.62, 37.24, 36.55, 36.48, 36.22, 35.92, 35.29, 31.57, 28.50, 28.44, 26.50, 25.42, 25.27, 22.21, 21.88, 16.07. 19F NMR (376 MHz, cdcl3) δ −112.56 (dt), −114.90 (tdd). HRMS (m/z): [M+H]+ calcd. for C55H66F3N8O6S, 1023.4778; found, 1023.4778.
Synthesis of N1-((1S,5S)-3-(3-(6-(2,6-difluorophenyl)-5-fluoropicolinamido)pyridin-4-yl)-5-methylcyclohexyl)-N8-((S)-1-((2S,4S)-4-hydroxy-2-(((S)-1-(4-(4-methylthiazol-5-yl)phenyl)ethyl)carbamoyl)pyrrolidin-1-yl)-3,3-dimethyl-1-oxobutan-2-yl)octanediamide (PIM447-VHL-01-epimer).
PIM447-VHL-01 epimer synthesis.
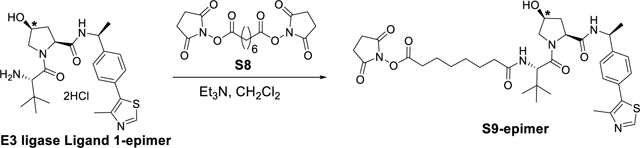
NHS ester S9-epimer was synthesized using the same reaction procedure as S9. Starting materials E3 ligase Ligand 1-epimer (200 mg, 0.52 mmol), S8 (574 mg, 1.56 mmol) and Et3N (150 μL, 1.06 mmol) were used to provide S9-epimer (235 mg, 65%). 1H NMR (400 MHz, cdcl3) δ 8.76 (s, 1H), 7.59 (d, J = 7.9 Hz, 1H), 7.44 – 7.33 (m, 4H), 6.23 (d, J = 9.0 Hz, 1H), 5.07 (p, J = 7.1 Hz, 1H), 4.68 (d, J = 8.9 Hz, 1H), 4.56 (d, J = 9.0 Hz, 1H), 4.45 (s, 1H), 3.95 (dd, J = 11.1, 4.2 Hz, 1H), 3.83 (dd, J = 11.1, 1.4 Hz, 1H), 2.82 (s, 4H), 2.59 (t, J = 7.3 Hz, 2H), 2.53 (s, 3H), 2.37 – 2.05 (m, 4H), 1.69 (dp, J = 37.0, 7.4 Hz, 5H), 1.49 (d, J = 6.9 Hz, 3H), 1.47 – 1.22 (m, 4H), 1.04 (s, 9H). 13C NMR (101 MHz, cdcl3) δ 173.27, 172.52, 172.02, 171.55, 168.58, 150.89, 146.45, 142.63, 137.02, 130.76, 129.64, 126.55, 71.01, 60.00, 58.64, 57.07, 49.28, 35.89, 35.06, 34.90, 30.86, 28.32, 28.04, 26.41, 25.42, 25.01, 24.37, 21.88, 15.75. HRMS (m/z): [M+H]+ calcd. for C35H48N5O8S, 698.3224; found, 698.3226.
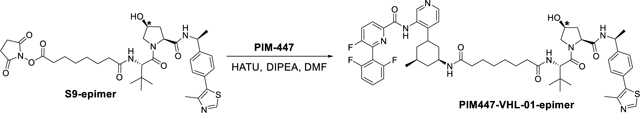
PIM447-VHL-01-epimer was synthesized using the same reaction procedure as PIM447-VHL-01. Starting materials S9-epimer (41 mg, 0.06 mmol), PIM447 (30 mg, 0.06 mmol) and Et3N (35 μL, 0.24 mmol) were used. 1H NMR (400 MHz, cdcl3) δ 10.22 (s, 1H), 8.68 (s, 1H), 8.41 (dd, J = 8.6, 3.9 Hz, 1H), 7.79 (t, J = 8.5 Hz, 1H), 7.68 (d, J = 7.9 Hz, 1H), 7.56 – 7.43 (m, 2H), 7.42 – 7.33 (m, 4H), 7.11 (t, J = 8.4 Hz, 2H), 6.09 (d, J = 9.0 Hz, 1H), 5.66 (d, J = 7.8 Hz, 1H), 5.07 (p, J = 7.0 Hz, 1H), 4.74 (d, J = 9.0 Hz, 1H), 4.56 (d, J = 9.0 Hz, 1H), 4.44 (t, J = 4.4 Hz, 1H), 3.95 – 3.80 (m, 2H), 2.97 (t, J = 10.1 Hz, 1H), 2.52 (s, 3H), 2.31 (d, J = 14.5 Hz, 1H), 2.25 – 2.08 (m, 6H), 1.99 (d, J = 12.3 Hz, 1H), 1.87 (d, J = 12.9 Hz, 1H), 1.66 – 1.41 (m, 9H), 1.37 – 1.27 (m, 5H), 1.04 (s, 9H), 0.96 – 0.80 (m, 5H). 13C NMR (101 MHz, cdcl3) δ 172.95, 172.32, 172.27, 171.55, 161.77, 161.29, 160.86, 159.26, 158.63, 150.34, 144.53, 142.44, 137.32, 137.13, 132.12, 131.15, 129.64, 129.57, 126.46, 126.37, 125.82, 125.62, 125.11, 125.05, 112.09, 111.84, 70.98, 59.92, 58.58, 56.96, 49.25, 47.85, 40.88, 40.07, 37.17, 36.85, 36.63, 36.33, 35.13, 34.90, 31.72, 28.76, 28.73, 26.45, 25.49, 25.33, 21.94, 21.78, 16.06. 19F NMR (376 MHz, cdcl3) δ −112.56, −113.61. HRMS (m/z): [M+H]+ calcd. for C55H66F3N8O6S, 1023.4778; found, 1023.4805.
QUANTIFICATION AND STATISTICAL ANALYSIS
Immunoblots, crystal violet cell viability assays, and colony formation assays were quantified with ImageJ45 as described in the corresponding method section. Data are expressed as mean ± standard deviation (SD) or mean ± standard error of the mean (SEM), as indicated in the corresponding figure legends. Statistical significance was determined using Student t-test or one-way ANOVA with Tukey multiple comparisons posttest, as indicated in the corresponding figure legends. Statistical analyses were performed in Prism 8 (GraphPad Software; RRID:SCR_002798). Significance was set at P < 0.05.
Supplementary Material
Significance.
PIM kinases have important oncogenic roles; however, inhibition of their catalytic activity shows limited antitumor efficacy. Using proteolysis targeting chimeras (PROTACs), we show that degradation of PIM kinases has higher potency than inhibiting kinase activity alone. This opens new avenues for improved targeting of oncogenic PIM kinase functions.
Highlights.
Small-molecule PIM inhibitors stabilize the PIM Kinases.
PIM1 drives tumor growth and drug resistance by catalytic and non-catalytic mechanisms.
We discover and validate PIM PROTACs to effectively degrade the PIM kinases.
PIM degradation is more efficient at reducing cell viability than catalytic inhibition.
Acknowledgments
We would like to thank the Experimental Mouse Shared Resource at the University of Arizona Cancer Center for their help and support. We thank the LASP (Laboratory Animal Sciences Program) Animal Research Technical Support at the Frederick National Laboratory for Cancer Research for logistical support. This research was supported by federal funds from the National Cancer Institute, National Institutes of Health, project number 1ZIABC011691–01 and a National Cancer Institute FLEX award to John Brognard. This research was also supported by a DoD PCRP Idea Development Award (W81XWH-19-PRCRP-HA) to Noel A Warfel, and Temple University (Lewis Katz School of Medicine) Research start-up budget to Pedro Torres-Ayuso. Dawid Mehlich and Anna A. Marusiak were supported by grants from the Polish National Science Centre (2021/41/N/NZ3/02997 and 2021/42/E/NZ5/00227) and the Polish National Agency for Academic Exchange (PPN/WAL/2020/1/00018). The graphical abstract was created with BioRender (https://biorender.com; RRID:SCR_018361). Research reported in this publication was supported by the National Cancer Institute of the National Institutes of Health to the University of Arizona Cancer Center under award number P30 CA023074.
The content of this publication does not necessarily reflect the views or policies of the Department of Health and Human Services, nor does mention of trade names, commercial products, or organizations imply endorsement by the U.S. government.
Inclusion and Diversity
We support inclusive, diverse, and equitable conduct of research.
Footnotes
Competing Interest Statement
Pedro Torres-Ayuso, John Brognard, Dawid Mehlich, Rolf Swenson, Noel Warfel, and Venkata Sabbasani declare the filing of a patent application covering the PROTACs described in this manuscript.
Torres-Ayuso et al. found that PIM inhibitors stabilize PIM kinases, which can contribute to prostate cancer growth and therapy resistance via non-catalytic mechanisms. To target non-catalytic PIM functions, a set of PIM degraders was designed. PIM kinase degraders were more efficient at reducing cancer cell viability than catalytic inhibitors.
Publisher's Disclaimer: This is a PDF file of an unedited manuscript that has been accepted for publication. As a service to our customers we are providing this early version of the manuscript. The manuscript will undergo copyediting, typesetting, and review of the resulting proof before it is published in its final form. Please note that during the production process errors may be discovered which could affect the content, and all legal disclaimers that apply to the journal pertain.
References
- 1.Nawijn MC, Alendar A, and Berns A. (2011). For better or for worse: the role of Pim oncogenes in tumorigenesis. Nat Rev Cancer 11, 23–34. 10.1038/nrc2986. [DOI] [PubMed] [Google Scholar]
- 2.Szydlowski M, Garbicz F, Jablonska E, Gorniak P, Komar D, Pyrzynska B, Bojarczuk K, Prochorec-Sobieszek M, Szumera-Cieckiewicz A, Rymkiewicz G, et al. (2021). Inhibition of PIM Kinases in DLBCL Targets MYC Transcriptional Program and Augments the Efficacy of Anti-CD20 Antibodies. Cancer Res 81, 6029–6043. 10.1158/0008-5472.CAN-21-1023. [DOI] [PubMed] [Google Scholar]
- 3.Cibull TL, Jones TD, Li L, Eble JN, Ann Baldridge L, Malott SR, Luo Y, and Cheng L. (2006). Overexpression of Pim-1 during progression of prostatic adenocarcinoma. J Clin Pathol 59, 285–288. 10.1136/jcp.2005.027672. [DOI] [PMC free article] [PubMed] [Google Scholar]
- 4.Braso-Maristany F, Filosto S, Catchpole S, Marlow R, Quist J, Francesch-Domenech E, Plumb DA, Zakka L, Gazinska P, Liccardi G, et al. (2016). PIM1 kinase regulates cell death, tumor growth and chemotherapy response in triple-negative breast cancer. Nat Med 22, 1303–1313. 10.1038/nm.4198. [DOI] [PMC free article] [PubMed] [Google Scholar]
- 5.Weirauch U, Beckmann N, Thomas M, Grunweller A, Huber K, Bracher F, Hartmann RK, and Aigner A. (2013). Functional role and therapeutic potential of the pim-1 kinase in colon carcinoma. Neoplasia 15, 783–794. 10.1593/neo.13172. [DOI] [PMC free article] [PubMed] [Google Scholar]
- 6.Jimenez-Garcia MP, Lucena-Cacace A, Robles-Frias MJ, Ferrer I, Narlik-Grassow M, Blanco-Aparicio C, and Carnero A. (2017). Inflammation and stem markers association to PIM1/PIM2 kinase-induced tumors in breast and uterus. Oncotarget 8, 58872–58886. 10.18632/oncotarget.19438. [DOI] [PMC free article] [PubMed] [Google Scholar]
- 7.Xu J, Xiong G, Cao Z, Huang H, Wang T, You L, Zhou L, Zheng L, Hu Y, Zhang T, and Zhao Y. (2016). PIM-1 contributes to the malignancy of pancreatic cancer and displays diagnostic and prognostic value. J Exp Clin Cancer Res 35, 133. 10.1186/s13046-016-0406-z. [DOI] [PMC free article] [PubMed] [Google Scholar]
- 8.Zhang X, Song M, Kundu JK, Lee MH, and Liu ZZ (2018). PIM Kinase as an Executional Target in Cancer. J Cancer Prev 23, 109–116. 10.15430/JCP.2018.23.3.109. [DOI] [PMC free article] [PubMed] [Google Scholar]
- 9.Mou S, Wang G, Ding D, Yu D, Pei Y, Teng S, and Fu Q. (2016). Expression and function of PIM kinases in osteosarcoma. Int J Oncol 49, 2116–2126. 10.3892/ijo.2016.3708. [DOI] [PubMed] [Google Scholar]
- 10.Brunen D, de Vries RC, Lieftink C, Beijersbergen RL, and Bernards R. (2018). PIM Kinases Are a Potential Prognostic Biomarker and Therapeutic Target in Neuroblastoma. Mol Cancer Ther 17, 849–857. 10.1158/1535-7163.MCT-17-0868. [DOI] [PubMed] [Google Scholar]
- 11.Toth RK, and Warfel NA (2021). Targeting PIM Kinases to Overcome Therapeutic Resistance in Cancer. Mol Cancer Ther 20, 3–10. 10.1158/1535-7163.MCT-20-0535. [DOI] [PubMed] [Google Scholar]
- 12.Qian KC, Studts J, Wang L, Barringer K, Kronkaitis A, Peng C, Baptiste A, LaFrance R, Mische S, and Farmer B. (2005). Expression, purification, crystallization and preliminary crystallographic analysis of human Pim-1 kinase. Acta Crystallogr Sect F Struct Biol Cryst Commun 61, 96–99. 10.1107/S1744309104029963. [DOI] [PMC free article] [PubMed] [Google Scholar]
- 13.Shay KP, Wang Z, Xing PX, McKenzie IF, and Magnuson NS (2005). Pim-1 kinase stability is regulated by heat shock proteins and the ubiquitin-proteasome pathway. Mol Cancer Res 3, 170–181. 10.1158/1541-7786.MCR-04-0192. [DOI] [PubMed] [Google Scholar]
- 14.Park YK, Obiang-Obounou BW, Lee KB, Choi JS, and Jang BC (2018). AZD1208, a pan-Pim kinase inhibitor, inhibits adipogenesis and induces lipolysis in 3T3-L1 adipocytes. J Cell Mol Med 22, 2488–2497. 10.1111/jcmm.13559. [DOI] [PMC free article] [PubMed] [Google Scholar]
- 15.Kreuz S, Holmes KB, Tooze RM, and Lefevre PF (2015). Loss of PIM2 enhances the anti-proliferative effect of the pan-PIM kinase inhibitor AZD1208 in non-Hodgkin lymphomas. Mol Cancer 14, 205. 10.1186/s12943-015-0477-z. [DOI] [PMC free article] [PubMed] [Google Scholar]
- 16.Chauhan SS, Toth RK, Jensen CC, Casillas AL, Kashatus DF, and Warfel NA (2020). PIM kinases alter mitochondrial dynamics and chemosensitivity in lung cancer. Oncogene 39, 2597–2611. 10.1038/s41388-020-1168-9. [DOI] [PMC free article] [PubMed] [Google Scholar]
- 17.Alabi SB, and Crews CM (2021). Major advances in targeted protein degradation: PROTACs, LYTACs, and MADTACs. J Biol Chem 296, 100647. 10.1016/j.jbc.2021.100647. [DOI] [PMC free article] [PubMed] [Google Scholar]
- 18.Luszczak S, Kumar C, Sathyadevan VK, Simpson BS, Gately KA, Whitaker HC, and Heavey S. (2020). PIM kinase inhibition: co-targeted therapeutic approaches in prostate cancer. Signal Transduct Target Ther 5, 7. 10.1038/s41392-020-0109-y. [DOI] [PMC free article] [PubMed] [Google Scholar]
- 19.Frost J, Galdeano C, Soares P, Gadd MS, Grzes KM, Ellis L, Epemolu O, Shimamura S, Bantscheff M, Grandi P, et al. (2016). Potent and selective chemical probe of hypoxic signalling downstream of HIF-alpha hydroxylation via VHL inhibition. Nat Commun 7, 13312. 10.1038/ncomms13312. [DOI] [PMC free article] [PubMed] [Google Scholar]
- 20.Testa A, Lucas X, Castro GV, Chan KH, Wright JE, Runcie AC, Gadd MS, Harrison WTA, Ko EJ, Fletcher D, and Ciulli A. (2018). 3-Fluoro-4-hydroxyprolines: Synthesis, Conformational Analysis, and Stereoselective Recognition by the VHL E3 Ubiquitin Ligase for Targeted Protein Degradation. J Am Chem Soc 140, 9299–9313. 10.1021/jacs.8b05807. [DOI] [PMC free article] [PubMed] [Google Scholar]
- 21.Warfel NA, Sainz AG, Song JH, and Kraft AS (2016). PIM Kinase Inhibitors Kill Hypoxic Tumor Cells by Reducing Nrf2 Signaling and Increasing Reactive Oxygen Species. Mol Cancer Ther 15, 1637–1647. 10.1158/1535-7163.MCT-15-1018. [DOI] [PMC free article] [PubMed] [Google Scholar]
- 22.Casillas AL, Toth RK, Sainz AG, Singh N, Desai AA, Kraft AS, and Warfel NA (2018). Hypoxia-Inducible PIM Kinase Expression Promotes Resistance to Antiangiogenic Agents. Clin Cancer Res 24, 169–180. 10.1158/1078-0432.CCR-17-1318. [DOI] [PMC free article] [PubMed] [Google Scholar]
- 23.Toth RK, Solomon R, and Warfel NA (2022). Stabilization of PIM Kinases in Hypoxia Is Mediated by the Deubiquitinase USP28. Cells 11. 10.3390/cells11061006. [DOI] [PMC free article] [PubMed] [Google Scholar]
- 24.Chen LS, Redkar S, Bearss D, Wierda WG, and Gandhi V. (2009). Pim kinase inhibitor, SGI-1776, induces apoptosis in chronic lymphocytic leukemia cells. Blood 114, 4150–4157. 10.1182/blood-2009-03-212852. [DOI] [PMC free article] [PubMed] [Google Scholar]
- 25.Burger MT, Nishiguchi G, Han W, Lan J, Simmons R, Atallah G, Ding Y, Tamez V, Zhang Y, Mathur M, et al. (2015). Identification of N-(4-((1R,3S,5S)-3-Amino-5-methylcyclohexyl)pyridin-3-yl)-6-(2,6-difluorophenyl)- 5-fluoropicolinamide (PIM447), a Potent and Selective Proviral Insertion Site of Moloney Murine Leukemia (PIM) 1, 2, and 3 Kinase Inhibitor in Clinical Trials for Hematological Malignancies. J Med Chem 58, 8373–8386. 10.1021/acs.jmedchem.5b01275. [DOI] [PubMed] [Google Scholar]
- 26.Gaidano G, Pasqualucci L, Capello D, Berra E, Deambrogi C, Rossi D, Maria Larocca L, Gloghini A, Carbone A, and Dalla-Favera R. (2003). Aberrant somatic hypermutation in multiple subtypes of AIDS-associated non-Hodgkin lymphoma. Blood 102, 1833–1841. 10.1182/blood-2002-11-3606. [DOI] [PubMed] [Google Scholar]
- 27.Kumar A, Mandiyan V, Suzuki Y, Zhang C, Rice J, Tsai J, Artis DR, Ibrahim P, and Bremer R. (2005). Crystal structures of proto-oncogene kinase Pim1: a target of aberrant somatic hypermutations in diffuse large cell lymphoma. J Mol Biol 348, 183–193. 10.1016/j.jmb.2005.02.039. [DOI] [PubMed] [Google Scholar]
- 28.Kuo HP, Ezell SA, Hsieh S, Schweighofer KJ, Cheung LW, Wu S, Apatira M, Sirisawad M, Eckert K, Liang Y, et al. (2016). The role of PIM1 in the ibrutinib-resistant ABC subtype of diffuse large B-cell lymphoma. Am J Cancer Res 6, 2489–2501. [PMC free article] [PubMed] [Google Scholar]
- 29.Polier S, Samant RS, Clarke PA, Workman P, Prodromou C, and Pearl LH (2013). ATP-competitive inhibitors block protein kinase recruitment to the Hsp90-Cdc37 system. Nat Chem Biol 9, 307–312. 10.1038/nchembio.1212. [DOI] [PMC free article] [PubMed] [Google Scholar]
- 30.Dawson JC, Serrels B, Byron A, Muir MT, Makda A, Garcia-Munoz A, von Kriegsheim A, Lietha D, Carragher NO, and Frame MC (2020). A Synergistic Anticancer FAK and HDAC Inhibitor Combination Discovered by a Novel Chemical-Genetic High-Content Phenotypic Screen. Mol Cancer Ther 19, 637–649. 10.1158/1535-7163.MCT-19-0330. [DOI] [PMC free article] [PubMed] [Google Scholar]
- 31.Bondeson DP, Smith BE, Burslem GM, Buhimschi AD, Hines J, Jaime-Figueroa S, Wang J, Hamman BD, Ishchenko A, and Crews CM (2018). Lessons in PROTAC Design from Selective Degradation with a Promiscuous Warhead. Cell Chem Biol 25, 78–87 e75. 10.1016/j.chembiol.2017.09.010. [DOI] [PMC free article] [PubMed] [Google Scholar]
- 32.Donovan KA, Ferguson FM, Bushman JW, Eleuteri NA, Bhunia D, Ryu S, Tan L, Shi K, Yue H, Liu X, et al. (2020). Mapping the Degradable Kinome Provides a Resource for Expedited Degrader Development. Cell 183, 1714–1731 e1710. 10.1016/j.cell.2020.10.038. [DOI] [PMC free article] [PubMed] [Google Scholar]
- 33.Cecchini C, Pannilunghi S, Tardy S, and Scapozza L. (2021). From Conception to Development: Investigating PROTACs Features for Improved Cell Permeability and Successful Protein Degradation. Front Chem 9, 672267. 10.3389/fchem.2021.672267. [DOI] [PMC free article] [PubMed] [Google Scholar]
- 34.Torres-Ayuso P, and Brognard J. (2022). Degraders: The Ultimate Weapon Against Amplified Driver Kinases in Cancer. Mol Pharmacol 101, 191–200. 10.1124/molpharm.121.000306. [DOI] [PMC free article] [PubMed] [Google Scholar]
- 35.Zemskova MY, Song JH, Cen B, Cerda-Infante J, Montecinos VP, and Kraft AS (2015). Regulation of prostate stromal fibroblasts by the PIM1 protein kinase. Cell Signal 27, 135–146. 10.1016/j.cellsig.2014.10.010. [DOI] [PMC free article] [PubMed] [Google Scholar]
- 36.Bearss JJ, Padi SK, Singh N, Cardo-Vila M, Song JH, Mouneimne G, Fernandes N, Li Y, Harter MR, Gard JM, et al. (2021). EDC3 phosphorylation regulates growth and invasion through controlling P-body formation and dynamics. EMBO Rep 22, e50835. 10.15252/embr.202050835. [DOI] [PMC free article] [PubMed] [Google Scholar]
- 37.Young NP, Kamireddy A, Van Nostrand JL, Eichner LJ, Shokhirev MN, Dayn Y, and Shaw RJ (2016). AMPK governs lineage specification through Tfeb-dependent regulation of lysosomes. Genes Dev 30, 535–552. 10.1101/gad.274142.115. [DOI] [PMC free article] [PubMed] [Google Scholar]
- 38.Mortazavi A, Williams BA, McCue K, Schaeffer L, and Wold B. (2008). Mapping and quantifying mammalian transcriptomes by RNA-Seq. Nat Methods 5, 621–628. 10.1038/nmeth.1226. [DOI] [PMC free article] [PubMed] [Google Scholar]
- 39.Liao Y, Smyth GK, and Shi W. (2014). featureCounts: an efficient general purpose program for assigning sequence reads to genomic features. Bioinformatics 30, 923–930. 10.1093/bioinformatics/btt656. [DOI] [PubMed] [Google Scholar]
- 40.Anders S, and Huber W. (2010). Differential expression analysis for sequence count data. Genome Biol 11, R106. 10.1186/gb-2010-11-10-r106. [DOI] [PMC free article] [PubMed] [Google Scholar]
- 41.Love MI, Huber W, and Anders S. (2014). Moderated estimation of fold change and dispersion for RNA-seq data with DESeq2. Genome Biol 15, 550. 10.1186/s13059-014-0550-8. [DOI] [PMC free article] [PubMed] [Google Scholar]
- 42.Young MD, Wakefield MJ, Smyth GK, and Oshlack A. (2010). Gene ontology analysis for RNA-seq: accounting for selection bias. Genome Biol 11, R14. 10.1186/gb-2010-11-2-r14. [DOI] [PMC free article] [PubMed] [Google Scholar]
- 43.Kanehisa M, and Goto S. (2000). KEGG: kyoto encyclopedia of genes and genomes. Nucleic Acids Res 28, 27–30. 10.1093/nar/28.1.27. [DOI] [PMC free article] [PubMed] [Google Scholar]
- 44.Torres-Ayuso P, An E, Nyswaner KM, Bensen RC, Ritt DA, Specht SI, Das S, Andresson T, Cachau RE, Liang RJ, et al. (2021). TNIK Is a Therapeutic Target in Lung Squamous Cell Carcinoma and Regulates FAK Activation through Merlin. Cancer Discov 11, 1411–1423. 10.1158/2159-8290.CD-20-0797. [DOI] [PMC free article] [PubMed] [Google Scholar]
- 45.Schneider CA, Rasband WS, and Eliceiri KW (2012). NIH Image to ImageJ: 25 years of image analysis. Nat Methods 9, 671–675. 10.1038/nmeth.2089. [DOI] [PMC free article] [PubMed] [Google Scholar]
Associated Data
This section collects any data citations, data availability statements, or supplementary materials included in this article.
Supplementary Materials
Data Availability Statement
Bulk RNA-seq data have been deposited at GEO and are publicly available as of the date of publication. Accession numbers are listed in the key resources table.
This paper does not report original code.
Any additional information required to reanalyze the data reported in this paper is available from the lead contact upon request.
KEY RESOURCES TABLE
| REAGENT or RESOURCE | SOURCE | IDENTIFIER |
|---|---|---|
| Antibodies | ||
| PIM1 (C93F2) Rabbit monoclonal antibody (1:1000 or 1:500) | Cell Signaling Technology | Cat. #3247S, RRID:AB_2299591 |
| PIM2 (D1D2) Rabbit monoclonal antibody (1:1000) | Cell Signaling Technology | Cat. #4730S, RRID:AB_2163921 |
| PIM3 (D17C9) Rabbit monoclonal antibody (1:1000) | Cell Signaling Technology | Cat. #4165S, RRID:AB_1904094 |
| Rabbit anti- p-IRS1 S1101 (1:500) | Cell Signaling Technology | Cat. #2385S, RRID:AB_330363 |
| Rabbit anti- IRS-1 (1:1000) | Cell Signaling Technology | Cat. #2382, RRID:AB_330333 |
| Phospho-BAD (Ser112) (40A9) Rabbit monoclonal antibody (1:1000) | Cell Signaling Technology | Cat. #5284, RRID:AB_560884 |
| Rabbit anti- BAD (1:1000) | Cell Signaling Technology | Cat. #9292, RRID:AB_331419 |
| Rabbit anti- Ubiquitin (1:2000) | Cell Signaling Technology | Cat. #3933, RRID:AB_2180538 |
| HA (C29F4) Rabbit monoclonal antibody (1:2000) | Cell Signaling Technology | Cat. #3724, RRID:AB_1549585 |
| β-actin (8H10D10) Mouse monoclonal antibody (1:5000) | Cell Signaling Technology | Cat. #3700, RRID:AB_2242334 |
| Recombinant Anti-c-Myc antibody [Y69] (1:1000) | Abcam | Cat. ab32072, RRID:AB_731658 |
| Sheep Anti-Mouse IgG - Horseradish Peroxidase (1:3000) | Global Life Sciences Solutions | Cat. NA931, RRID:AB_772210 |
| Donkey Anti-Rabbit IgG, Whole Ab ECL Antibody, HRP Conjugated (1:3000) | Global Life Sciences Solutions | Cat. NA934, RRID:AB_772206 |
| Pierce™ Anti-HA Magnetic Beads | Thermo Fisher Scientific | Cat. 88837; RRID:AB_2749815 |
| Bacterial and virus strains | ||
| One Shot™ Stbl3™ Chemically Competent E. coli | Thermo Fisher Scientific | Cat. C737303 |
| Chemicals, peptides, and recombinant proteins | ||
| AZD1208 | MedChemExpress | Cat HY-15604, CAS No. : 1204144–28-4 |
| PIM447 | MedChemExpress | Cat. HY-19322, CAS No. : 1210608–43-7 |
| SGI-1776 | MedChemExpress | Cat. HY-13287, CAS No. : 1025065–69-3 |
| SGI-1776-VHL-01 | This paper | N/A |
| SGI-1776-VHL-02 | This paper | N/A |
| AZD1208-VHL-01 | This paper | N/A |
| PIM447-VHL-01 | This paper | N/A |
| MG-132 | MedChemExpress | Cat. HY-13259, CAS No. : 133407–82-6 |
| VH-298 | MedChemExpress | Cat. HY-100947, CAS No. : 2097381–85-4 |
| Cycloheximide | Millipore-Sigma | Cat. C7698, CAS No.: 66–81-9 |
| Doxycycline | Millipore-Sigma | Cat. D3072, CAS No.: 10592–13-9 |
| cOmplete™, EDTA-free Protease Inhibitor Cocktail | Millipore-Sigma | Cat. 5056489001 |
| Phosphatase Inhibitor Cocktail 2 | Millipore-Sigma | Cat. P5726 |
| Phosphatase Inhibitor Cocktail 3 | Millipore-Sigma | Cat. P0044 |
| PEG300 | Sigma-Aldrich | Cat. 1546423, CAS No.: 25322–68-3 |
| Docetaxel | Hikma Pharmaceuticals USA Inc. | Cat. NDC: 00143–9204-01, CAS No. : 114977–28-5 |
| Critical commercial assays | ||
| CellTiter 96 AQueous One Solution Cell Proliferation Assay | Promega | Cat. G3580 |
| Annexin V-FITC apoptosis detection kit | Invitrogen | Cat. BMS500FI-100; RRID:AB_2575598 |
| Power SYBR Green RNA-to-CT 1-Step Kit | Applied Biosystems; Thermo Scientific | Cat. 4389986 |
| Deposited data | ||
| Raw and analyzed RNAseq data of PC3 cells treated with PIM PROTACs | This paper | GEO: GSE237256 |
| Experimental models: Cell lines | ||
| PC3 | National Cancer Institute Repository | RRID:CVCL_0035 |
| PC3-LN4 | ATCC | RRID:CVCL_D578 |
| LNCaP | ATCC | RRID:CVCL_0395 |
| C4–2 | ATCC | RRID:CVCL_4782 |
| PC3-dox-PIM1 | Zemskova et al.35 | N/A |
| PC3-LN4 CRISPR PIM1 | Bearss et al.36 | N/A |
| Experimental models: Organisms/strains | ||
| Mouse: CBySmn.Cg-Prkdcscid/J (Balb/c scid) | The Jackson Laboratory | JAX: 001803 |
| Oligonucleotides | ||
| PIM1 Forward: 5’ CGACATCAAGGACGAAAACATC | This paper | N/A |
| PIM1 Reverse: 5’ ACTCTGGAGGGCTATACACTC | This paper | N/A |
| PIM2 Forward: 5’ GAACATCCTGATAGACCTACGC | This paper | N/A |
| PIM2 Reverse: 5’ CATGGTACTGGTGTCGAGAG | This paper | N/A |
| PIM3 Forward: 5’ GACATCCCCTTCGAGCAG | This paper | N/A |
| PIM3 Reverse: 5’ ATGGGCCGCAATCTGATC | This paper | N/A |
| GAPDH Forward: 5’ CAGCAATGCATCCTGCACC | This paper | N/A |
| GAPDH Reverse: 5’ TGGACTGTGGTCATGAGCCC | This paper | N/A |
| Recombinant DNA | ||
| pcDNA3-HA-PIM1 | Zemskova et al.35 | N/A |
| pcDNA3-HA-PIM1 (K67M) | Zemskova et al.35 | N/A |
| psPAX2 | Addgene | Cat. 12260, RRID:Addgene_12260 |
| pMD2.G | Addgene | Cat. 12259, RRID:Addgene_12259 |
| pCIP | Young et al.37; Addgene | Cat. 79009 |
| pCIP-HA-PIM1 | This paper | N/A |
| pCIP-HA-PIM1 K67M | This paper | N/A |
| ON-TARGETplus Human VHL siRNA | Horizon | Cat. LQ-003936–00-0002 |
| Software and algorithms | ||
| Prism 8 | GraphPad Software | RRID:SCR_002798 |
| ImageJ | Schneider et al.45 | RRID:SCR_003070 |
| GSEA | http://www.broadinstitute.org/gsea/index.jsp | RRID:SCR_003199 |
| FlowJo | FlowJo LLC | RRID:SCR_008520 |
| StudyLog | Studylog Systems | RRID:SCR_016682 |
| Other | ||
| jetPRIME® | Polyplus | Cat. 101000046 |
| RNeasy kit | Qiagen | Cat. 74104 |
| RIPA | Sigma-Aldrich | Cat. R0278 |
| Pierce™ 660nm Protein Assay Reagent | Thermo Scientific | Cat. 22660 |
| RPMI 1640 | Quality Biological | 112–024-101 |
| Glutamax | Gibco | 35050061 |
| Sodium pyruvate | Gibco | 11460070 |
| Penicillin-streptomycin | Gibco | 15140122 |
| Chemidoc | BioRAD | RRID:SCR_019037 |