

SUMMARY
Neurodegeneration is a protracted process involving progressive changes in myriad cell types that ultimately result in the death of vulnerable neuronal populations. To dissect how individual cell types within a heterogeneous tissue contribute to the pathogenesis and progression of a neurodegenerative disorder, we performed longitudinal single-nucleus RNA sequencing of mouse and human spinocerebellar ataxia type 1 (SCA1) cerebellar tissue, establishing continuous dynamic trajectories of each cell population. Importantly, we defined the precise transcriptional changes that precede loss of Purkinje cells and, for the first time, identified robust early transcriptional dysregulation in unipolar brush cells and oligodendroglia. Finally, we applied a deep learning method to predict disease state accurately and identified specific features that enable accurate distinction of wild-type and SCA1 cells. Together, this work reveals new roles for diverse cerebellar cell types in SCA1 and provides a generalizable analysis framework for studying neurodegeneration.
Keywords: spinocerebellar ataxia type 1, SCA1, ataxin-1, neurodegeneration, single-nucleus RNA sequencing, Purkinje cell, unipolar brush cells, oligodendrocyte progenitor cell, oligodendrocyte, machine learning
Graphical Abstract

eTOC Blurb:
In neurodegeneration, vulnerable neuronal populations are highly influenced by concomitant changes in surrounding cells, including glia. Here, Tejwani et al. performed longitudinal single-nucleus profiling of the mouse and human SCA1 cerebellum, which elucidated the progressive dysregulation of Purkinje cells and revealed early transcriptional changes in oligodendroglia and unipolar brush cells.
INTRODUCTION
SCA1 is a progressive neurodegenerative disorder in the family of polyglutamine (polyQ) diseases and is caused by expansion of the CAG trinucleotide repeat tract in ATXN1, encoding the ataxin-1 protein.1 Although ATXN1 is ubiquitously expressed,2 the Purkinje cells (PCs) display the most marked degeneration in the SCA1 cerebellum,3 and thus have been the primary focus of most studies. Evidence from animal models suggests that profound cerebellar circuit dysfunction precedes overt PC loss,4 which can be attributed to PC-intrinsic changes or perturbations in the many cell types that directly or indirectly modulate PC activity. Recent studies have suggested the involvement of additional cerebellar cell types in disease;5–8 however, the effects of the SCA1 mutation on other populations are not well-understood and are further obscured by their low relative abundance compared to cerebellar granule cells.
In SCA1 and other neurodegenerative diseases, efforts to interrogate the roles of individual cell types in disease have primarily relied on the development of conditional animal models by restricting mutant gene expression to a candidate cell type, which in the case of late-onset neurodegenerative diseases, can be extremely laborious and time-consuming. In recent years, droplet-based single-cell sequencing has emerged as a scalable tool for profiling many cells of heterogenous tissues,9,10 and several groups have applied this to human post-mortem samples from patients with neurodegenerative disorders.11–22 While these studies have revealed some insights into how certain cell types are unexpectedly perturbed, they reflect the end-stage transcriptional changes in surviving populations of cells, falling short of accurately describing the progressive course of disease, which occurs over decades in humans. Additionally, the mechanisms through which various cell types contribute to disease are constantly changing. Therefore, approaches geared towards elucidating the molecular dynamics throughout a disease process at a single-cell resolution are desirable. Here, we integrate cutting-edge genomics and analytical approaches to examine the complex and dynamic interplay between diverse cell populations in the SCA1 cerebellum over time.
RESULTS
Single-nucleus RNA-sequencing (snRNA-seq) of the SCA1 cerebellum
To profile the transcriptional dynamics of the SCA1 cerebellum comprehensively throughout the disease at a single-cell level, we performed snRNA-seq of 10 control (CTRL) and 10 SCA1 primary human post-mortem cerebellar cortex tissues (Table S1), and 15 SCA1 knock-in (SCA1 KI; Atxn1154Q/+) and 15 wild-type (WT) littermate control mice at five timepoints (5, 12, 18, 24, and 30 weeks of age) (Figure 1A). We selected these timepoints to capture all major processes throughout disease, from the early onset of behavioral deficits (5–6 weeks) to eventual cell loss and premature lethality, which typically begins around 32 weeks of age.4,23 Following removal of cells that did not meet quality control criteria (see STAR★Methods), our snRNA-seq yielded datasets of 237,554 and 313,447 high-quality single-nucleus transcriptomes from human and mouse, respectively (Figure 1A; Table S1). Cell type labels were assigned to pre-clusters based on expression of established marker genes, as well as novel markers from a recently published single-cell atlas of the adult WT mouse cerebellum,24 and pre-clusters with similar identities were merged when appropriate (Figures 1B–1E; Figures S1 and S2; Table S1).
Figure 1. Single-cell transcriptional profiling of the SCA1 human and mouse cerebellum.

(A) Schematic pipeline of SCA1 snRNA-seq and analysis of human post-mortem (n=20 human) and mouse (n=30 mice) cerebellum.
(B and C) UMAP embeddings of 237,554 human (B) and 313,447 mouse (C) single-nucleus transcriptomes. Nuclei from 20 human post-mortem (CTRL, n=10; SCA1, n=10) and 30 mouse (WT, n=3; SCA1, n=3 per timepoint; timepoints= 5, 12, 18, 24, 30 weeks) tissues were sequenced.
(D and E) Normalized violin plots showing expression of cell type-specific marker genes for each human (D) and mouse (E) cluster used for cell type annotation.
(F and G) Relative proportions of each cell type within each genotype for the human (F) and mouse (G) datasets.
(H) Dot plot displaying mean scaled expression of previously reported effectors of SCA1 toxicity (rows) in WT mouse cerebellar cell types (columns) averaged over time.
(I) Heatmap displaying mean expression profiles of 238 ataxin-1 physical interactors (rows) in WT mouse cerebellar cell types (columns) averaged over time.
(J and K) Number of down-regulated, up-regulated, and total differentially expressed genes (DEGs) in the human (J) and mouse (K) snRNA-seq datasets.
See also Figures S1–S7, and Tables S1–S10.
The resource presented here describes the single-nuclei transcriptomes of 13 human and 14 mouse clusters that represent the major cell types of the cerebellum including granule cells (GC), deep cerebellar nuclei neurons (DCN), unipolar brush cells (UBC), Purkinje cells (PC), three classes of GABAergic interneurons including two molecular layer interneuron populations (MLI1, MLI2) and Golgi cells (GoC), astrocytes (AS), Bergmann glia (BG), oligodendrocyte progenitor cells (OPC), oligodendrocytes (OL), microglia (MG), pericytes (PER), and endothelial cells (END). Relative proportions of cells and sequencing quality were largely comparable across genotypes in both the human and mouse datasets (Figures 1F and 1G; Figures S3A–S3I).
Expression networks of ataxin-1 interactors
Ataxin-1 is ubiquitously expressed and serves key functions as a transcriptional co-regulator and splicing co-factor through its interactions with various proteins.25 In SCA1, the majority of gain-of-function pathogenic changes are thought to be mediated through altered incorporation of polyQ-expanded ataxin-1 into its native protein complexes,26–28 which typically depends on post-translational modification of ataxin-1.26,27,29–32 Although several key protein interactors of ataxin-1 have been demonstrated to be central to PC pathology, it is unclear if these same molecular mechanisms are responsible for dysfunction of other cerebellar cell types, as many of the studies investigating these genetic interactions have relied on constitutive whole-body deletion of putative mediators in all cell types. Thus, we aimed to use our snRNA-seq dataset to determine the extent to which various protein interactors or reported disease modifiers could potentially influence gene expression across the heterogenous cell types of the cerebellum.
We hypothesized that for a particular protein interactor to contribute to cell-autonomous pathogenic changes in a given cell type, its simultaneous co-expression with ATXN1 in the same cell is obligatory. Therefore, we first examined the cell type-specific expression of previously described effectors of polyQ-expanded ataxin-1 pathogenic functions, including genes encoding proteins involved in transcriptional regulation,26,33–38 protein levels and localization,30,39–43 splicing factors,27,32 and others.44–48 This analysis revealed that although many previously reported mediators of ataxin-1 toxicity are expressed at high levels in PCs, many are also robustly expressed by other cell types of the mouse and human cerebellum (Figure 1H; Figure S3J). For example, RORα and co-activator Tip60 (encoded by gene Kat5) are expressed at comparable or higher levels in various inhibitory interneuron populations (MLI1, MLI2, GoC) as PCs in both the mouse and human cerebellum, suggesting this complex may similarly contribute to gene expression changes in these cells as previously shown for PCs in a PC-specific transgenic model of SCA1 (SCA1 B05).35 On the other hand, although reduction of Nlk and Msk1 (encoded by gene Rps6ka5) may ameliorate SCA1 deficits through direct modulation of ataxin-1 phosphorylation in PCs,40,42 reduction of proteins like Pak1 may confer partial protection to SCA1 phenotypes through alternate mechanisms in other cell types,43 as its expression is higher in these other populations than in PCs (Figure 1H). Extension of this analysis to a broader set of transcripts encoding over 200 ataxin-1 physical interactors49 revealed several groups with the most similar expression profiles, including a group of interneuron subtypes (UBC, MLI1, MLI2, GoC) and DCN neurons, and an astroglial group (AS, BG), with distinct interactor expression profiles in each of the other cell types (Figure 1I), suggesting that the primary molecular mechanisms governing pathogenesis in different cell types may be distinct and dependent on co-expression patterns of these interactors with ataxin-1 (Table S2). Importantly, although mRNA expression profiles of putative mediators of mutant ataxin-1 toxicity across the heterogenous cerebellum may be useful for future targeted investigation of the molecular mechanisms underlying cell type-specific gene expression changes in SCA1, additional post-transcriptional modifications that affect interactor protein levels, localization, and function must also be considered.
Differential gene expression in the SCA1 cerebellum
To identify cell type-specific gene expression changes between WT/CTRL and SCA1, we first performed differential gene expression analyses for all cell types, subsampling the data to control for differences in the number of nuclei across genotypes and timepoints. Because we aimed to broadly describe how the diverse populations of cerebellar neurons and glia are affected in SCA1, we merged pre-clusters belonging to the same cell type to perform differential expression analyses across genotypes for each major cell type. As a result, and due to the distributional nature of heterogenous gene expression across single nuclei within a merged population, we not only calculated the fold-change in mean expression between groups, but also computed the Earth Mover’s Distance (EMD) between genotypes for each gene in each cell type, as this approach retained information regarding both the magnitude of change and the proportion of cells undergoing alterations.50
We identified differentially expressed genes (DEGs) in individual cell types at each timepoint, with different cell types having different numbers of DEGs across the discrete timepoints (Figures 1J and 1K; Figure S4; Tables S3–S7). The timepoints sampled from the SCA1 KI mouse span the course of disease, from the onset of mild motor behavioral impairments (5 weeks) through the late-stage neuropathological changes (30 weeks) prior to premature lethality resulting from bulbar dysfunction. Examination of the number of DEGs in each cell type at discrete timepoints along disease progression revealed several key pieces of information. First, UBCs had the greatest number of DEGs at early timepoints immediately prior to the onset of behavioral deficits (Figure 1K). Overall, the 24-week timepoint had the highest number of DEGs averaged across all cell types in the mouse dataset (Figure 1K). Between the different cell types, the UBC, PC, OPC, and MG clusters displayed the highest number of DEGs averaged over time (Figure 1K). Because of their high number of DEGs over time (Figure 1K; Tables S3–S6), we focused on analyzing the UBC, PC, and OPC/OL clusters in greater detail.
UBC gene expression is highly dysregulated during early disease
As described above, SCA1 is characterized by early behavioral deficits that precede cell loss and degeneration. Although we observed differential gene expression in all cell types of the cerebellum at early stages, UBCs, an excitatory glutamatergic interneuron population, displayed the greatest dysregulation (Figure 1K). Intriguingly, UBCs are enriched in cerebellar lobules IX and X,51 the region that undergoes the earliest atrophy in SCA1 patients,52,53 suggesting a potential contribution to regional vulnerability and early SCA1 phenotypes. In the cerebellar circuitry, UBCs transform and amplify synaptic input from a single mossy fiber via its numerous connections with GCs or other UBCs,54,55 and this transformation via altered glutamatergic signaling underlies diverse temporal representation of synaptic inputs.56 Historically, UBCs have been broadly classified into mGluR1α/Trpc3-positive “ON” or calretinin-positive “OFF” UBC subtypes, referring to exclusive protein immunoreactivity and their firing activity in response to glutamatergic input.57–60 Recently, however, advances in transcriptional profiling of UBCs have revealed that rather than being functionally and molecularly discrete subpopulations, cerebellar UBCs display continuous molecular variation across subtypes,24,61 which has been suggested to relate to a continuum of functional properties through which cells can display biphasic physiological responses.
To explore the identities of the UBCs captured by our snRNA-seq approach, we first examined expression of reported UBC subpopulation markers in our mouse dataset (Figures S5A–S5C). This analysis confirmed the inverse graded expression of ON UBC markers Grm1 (encoding mGluR1α) and Plcb4, and OFF UBC markers Calb2 (encoding calretinin) and Plcb1 mRNA across the continuous UBC population (Figures S5B and S5C).24 Expression of these marker genes more accurately segregated UBC subclusters than age or genotype labels did (Figures S5D–S5F); therefore, cells were assigned ON or OFF labels (based on marker gene expression) for downstream analyses. To determine additional genes that can be used to discriminate between subsets of UBCs, we performed differential gene expression analyses between ON and OFF UBC subclusters, which revealed several novel markers for ON (e.g. Ntng1, Cdh18, and Slc24a2) and OFF UBCs (e.g. Nrg1, Fam155a, and Sgcd) (Figures S5G and S5H; Table S8). Similar to established UBC marker genes,24 these genes displayed graded transcript expression levels across the entire UBC cluster. Whether cells with intermediate expression of ON- and OFF-enriched marker genes display intermediate functional properties remains to be determined.
We next aimed to interrogate genotype-dependent differences in UBCs in SCA1. Although transcript levels of marker genes were continuous across the UBC cluster, protein immunoreactivity of Trpc3 and calretinin was completely non-overlapping (Figure S5I). Therefore, we first assessed numbers of Trpc3-positive (predominantly ON) and calretinin-positive (predominantly OFF) UBCs in the SCA1 cerebellum. Interestingly, the number of Tbr2-positive total UBCs, calretinin-positive OFF UBCs, and Trpc3-positive ON UBCs were all decreased in SCA1 at early stages (Figures S5J–S5M). Additionally, although gene ontology (GO) analysis of UBC DEGs over time revealed dynamic enrichment in different pathways over the course of disease, there was an enrichment in changes related to glutamate receptor signaling that emerged at early timepoints and persisted throughout disease (Figures S6A and S6B; Table S9), suggesting that changes in responsiveness to mossy fiber excitatory inputs may occur in SCA1. Electrophysiological analysis of UBCs at early timepoints revealed no significant alterations in intrinsic firing patterns at baseline (Figures S6C and S6D). Furthermore, pre-synaptic vGlut2 levels (likely from mossy fiber terminals) onto ON or OFF UBCs were unchanged in 12-week SCA1 mice (Figures S6E and S6F). Collectively, these data suggest that although overt functional changes in baseline electrophysiological properties and connectivity between UBCs and synaptic partners were not observed in SCA1 KI mice, altered UBC numbers may contribute to motor behavioral deficits, consistent with a previous report that loss of specific UBCs can lead to early ataxia-like behaviors in mice.59
Finally, to determine the degree of overlap between UBCs from human SCA1 patient post-mortem tissue and SCA1 KI mice, we first compared the enriched pathways of UBC DEGs from the two species, aggregating DEGs across the mouse timepoints. Pathways related to neurotransmitter secretion and synaptic vesicles were among the top enriched pathways for down-regulated genes across both species (Figures S7A and S7B; Table S10). Although all top enriched pathways from the upregulated gene list of human UBCs were similarly enriched in the mouse dataset, mouse UBCs displayed a unique enrichment in upregulated genes related to synapse assembly, which was not observed in human UBCs (Figures S7A and S7B; Table S10). Additionally, mouse (and not human) UBCs displayed a down-regulation of genes related to mitochondrial ATP synthesis coupled electron transport (Figures S7A and S7B; Table S10), some of which emerged at early timepoints (Table S6). After removal of DEGs without known orthologs between mouse and humans, individual UBC gene lists were compared, which revealed over 500 common DEGs between the two species. Repeating the pathway analysis on only these shared UBC DEGs uncovered an enrichment in genes related to splicing, dendrite development, and synaptic functions, among others (Figure S7D; Table S10). Future studies aimed at understanding how these gene expression changes across the heterogenous UBC subpopulations specifically impact their physiology and manifest in synaptic and circuit dysfunction, possibly through altering response dynamics to pre-synaptic inputs, may help to explain a role for UBCs in SCA1 pathogenesis.
Longitudinal dynamics of PCs throughout SCA1
PCs undergo substantial gene expression changes prior to eventual cell death in SCA1.62 Bulk RNA-seq of the SCA1 mouse cerebellum has revealed several tissue-level changes that have been suggested to be the result of PC perturbations;63–65 however, due to their relative rarity in the heterogenous cerebellum, it remains unclear to what degree this interpretation is confounded by changes in other cell types. Therefore, we sought to define the PC-specific transcriptional dynamics with single-cell accuracy throughout multiple stages of disease for the first time. To characterize the progressive transcriptional dysregulation in SCA1 PCs, we first examined overall differential gene expression in the mouse at 5, 12, 18, 24, and 30 weeks of age. Although gene expression differences were observed in PCs at all timepoints (Figure 1K; Tables S3–S6), hierarchical clustering of WT and SCA1 PCs revealed the largest overall transcriptional divergence between genotypes at 24 weeks of age (Figure 2A), driven both by number of DEGs and the degree of differential expression. Surprisingly, of all timepoints sampled, PCs from the 18- and 24-week mice displayed the largest differential expression between genotypes, which was partially corrected in late-stage 30-week animals (Figure 2A). This relative normalization of PC gene expression changes between genotypes at late stages of disease was not only reflected in the number of DEGs, but also in the degree to which DEGs were dysregulated (Figures 1K and 2A–2C; Table S6), raising the possibility of homeostatic adaptation (see Discussion).
Figure 2. SCA1 Purkinje cell dynamics over time.

(A) Heatmap of relative normalized expression for DEGs in mouse PCs over time.
(B and C) Smoothed histograms displaying time-dependent alterations in distribution of normalized gene expression for selected genes that are down-regulated (B) and up-regulated (C) in SCA1 mouse PCs.
(D) Heatmap of significantly enriched pathways in the PC population over time.
(E) Western blots validating time-dependent changes of several PC-enriched genes/proteins in the SCA1 KI mouse cerebellum (WT, n=4; SCA1, n=4 mice per timepoint). The target band for Prkg1 is denoted with a closed arrow and a non-specific band with an open arrowhead. For quantification data, target expression was normalized to a loading control (vinculin) and then to the average of WT mice at each timepoint.
(F) Representative images of detected RNA foci of PC markers from MERFISH analysis of the WT and SCA1 KI cerebellum of 18 week mice.
(G and H) Representative images of detected RNA foci (G) and smoothed histograms (H) displaying differential expression of selected up- and down-regulated genes in PCs of the 18 week WT and SCA1 cerebellum, as determined using MERFISH.
Data presented in (E) are mean±s.e.m. Student’s t-tests were performed to compare genotypes within each timepoint. *P<0.05, **P<0.01, ***P<0.001.
See also Figures S8–S12, and Tables S11–S13.
Pathway analyses of DEGs in PCs at early timepoints revealed the highest enrichment in genes related to synaptic long-term depression (LTD), neurovascular coupling signaling, and synaptogenesis signaling (Figure 2D; Figure S8; Table S11). Because synaptic LTD at the parallel fiber (PF) to PC synapse requires type 1 glutamatergic signaling, which has been previously reported to be dysfunctional in multiple cerebellar disorders,66 including SCA1,64,67–69 we aimed to define the precise molecular changes in this signaling pathway in PCs. Among all down-regulated protein-coding genes in PCs, the most reduced gene (by EMD) at most timepoints was Grid2 (Figure S8C; Table S6), which encodes the glutamate receptor subunit delta-2 (Gluδ2). Gluδ2 functions as a post-synaptic regulator of mGluR1 specifically at the parallel fiber (PF) to PC synapse70 and is necessary for cerebellar LTD, motor learning, and proper establishment of PF and climbing fiber (CF) territories on PCs.71,72 In humans, GRID2 deletion mutations cause a recessive ataxia73,74 and its reduction contributes to cerebellar dysfunction in essential tremor.75 Furthermore, loss-of-function hotfoot mutations of Grid2 in rodents (for which over 20 alleles have been described) result in severe ataxia and cerebellar atrophy.76 Thus, the early and progressive reduction of Grid2 in SCA1 KI mice may contribute to the onset of motor deficits, as well as the pathological abnormalities in spatial distribution of CF inputs onto PCs observed in SCA1.77–79
Beyond Grid2 down-regulation, extensive early changes in other post-synaptic molecules involved in LTD at the PF to PC synapse were also observed at 5 weeks of age, including dysregulation of AMPA receptor subunit-encoding Gria1, Gria3, and Gria4; mGluR1-dependent signal transduction molecules Plcb1, Plcb3, and Prkca; and nitric oxide/cGMP-dependent protein kinase Prkg1 (Table S6). As disease progressed, additional genes central to cerebellar LTD, PF to PC signaling, and calcium handling were also dysregulated (Figure 2B; Figure S8). Many of these genes were the most differentially expressed at 18 weeks (Figure 2B; Table S6), which we also validated for several PC-enriched genes at the protein level using bulk mouse cerebellar tissue (Figure 2E) and multiplexed error-robust fluorescence in situ hybridization (MERFISH) for simultaneously probing 140 different genes, including PC DEGs of interest identified by our snRNA-seq analysis (Figures 2F–2H; Figure S9; Table S12). Although PF-evoked synaptic responses in SCA1 PCs have been reported to be grossly normal,79 pre-symptomatic mice display a decline in efficiency in PF-PC signaling,80 which may contribute to early plasticity-related deficits at this synapse in SCA1.69 Because the downstream signaling pathways at this synapse identified in our snRNA-seq analyses are critical for the complex functions of the cerebellum, including various forms of plasticity and motor learning, dysregulation is likely to compromise proper cerebellar functionality.
In addition to these LTD-related changes (Figure S10), a persistent down-regulation of genes involved in calcium handling was observed starting from 5 weeks of age, which progressed in magnitude of down-regulation, as well as in a number of genes by later timepoints Figure S8B; Table S6 and S11). This early disruption of calcium homeostasis in PCs is consistent with recent studies of SCA1 B05 animals,81 as well as SCA7 transgenic mice.82 Starting at 12 weeks of age, the most enriched pathways were related to netrin and synaptogenesis signaling (Figure 2D; Figure S8A; Table S11), suggesting potential alterations in neuronal cell-cell communication and cerebellar circuit stability. Among these DEGs, many cell adhesion and axon guidance signaling molecules involved in synapse formation and maintenance were up-regulated (Figure 2C; Figure S8A; Tables S5, S6, and S9), and these DEGs persisted through all timepoints examined. We confirmed increased protein expression of Caspr2 (encoded by Cntnap2) in bulk protein lysates of 24-week SCA1 KI mice (Figures S11A and S11B). Furthermore, although Dlg4 (encodes PSD-95) was not differentially expressed at the transcript level in our mouse snRNA-seq dataset (Table S6), we observed increased PSD-95-positive puncta and vGlut1/PSD-95 double-positive co-localized puncta in PC dendrites of 24-week SCA1 KI mice (Figures S11C and S11D), suggesting compensatory changes in PF to PC connectivity, likely in response to broad synaptic dysfunction. Collectively, these data highlight the PF to PC synapse as a potential site of early, persistent, and progressive transcriptional dysfunction that coincides with the onset and progression of behavioral impairments in SCA1, warranting further electrophysiological studies of PF-PC synaptic plasticity.
Similar to our cross-species examination of UBCs, we performed a comparative analysis of SCA1 human and mouse PCs. Although only a small number of top enriched pathways were shared between the two PC datasets (Figures S12A and S12B; Table S13), over 300 DEGs were commonly changed in the two datasets, many of which encode key genes involved in key PC functions (Figure S12C). Pathway analysis of the shared DEGs demonstrated an enrichment of genes related to glutamatergic transmission (Figure S12D; Table S13). Interestingly, human PCs displayed a downregulation of many nuclear-encoded genes involved in mitochondrial electron transport and ATP synthesis, which was not observed at any analyzed timepoint in SCA1 KI mice (Figure S12C). Although functional mitochondrial deficits have previously been reported in SCA1 KI83 and transgenic84 mouse models, identification of robust transcriptional changes in mitochondrial genes in SCA1 PCs may require assessment of terminal timepoints of disease, beyond 30 weeks. Overall, in addition to revealing several differences between SCA1 PCs in humans and mice, this analysis further reinforced glutamatergic signaling deficits as a core dysregulated pathway in PCs across species in SCA1.
Analysis of PC subclusters
The cerebellum is functionally organized into distinct domains that differ in input source and target projections to coordinate its various motor and non-motor functions. In addition to regional differences in the connectivity of the cerebellar cortex microcircuitry,85 individual cells of the cerebellum, including PCs, display regional molecular specializations that can influence their function in the healthy and diseased brain.24 To explore PC heterogeneity in SCA1, we examined if PCs from the mouse cerebellum could be segregated into subclusters based on overall transcriptional similarity. To this end, we first assessed the number of distinct subclusters that could be recovered with increasing clustering resolution, which revealed 5 major subpopulations that comprised the majority of all PCs, which we labeled as PC0, PC1, PC2, PC3, and PC4 (Figure 3A; Figure S13A). These subclusters were present at all sampled timepoints (Figures S13B and S13C) but differentially represented across the two genotypes, with PC0 and PC4 being increased and PC2 being reduced in SCA1 relative to the proportions observed in WT mice (Figures 3B and 3C). Differential expression analysis between subclusters revealed sets of candidate marker genes to distinguish between subclusters, including Car10 and Pde4b (PC0), Chst8 (PC1), Atp6ap1l (PC2), Cux2 (PC3), Hs6st3 (PC4) (Figure S13D), among others (Figures 3D and 3E; Table S14).
Figure 3. Analysis of Purkinje cell subpopulations in SCA1.

(A and B) UMAP embeddings displaying five major subclusters (A) and genotypes (B) of mouse PCs.
(C) Relative proportions of each PC subcluster aggregated over time in the WT and SCA1 mouse cerebellum snRNA-seq dataset.
(D) Heatmap of non-imputed expression z-score for the top 20 marker genes for each of the five PC subclusters.
(E) Dot plots displaying non-imputed relative expression of selected marker genes for each of the five PC subclusters.
(F and G) UMAP embeddings displaying non-imputed expression of Aldoc and Kctd16 (F) and zebrin II (Aldoc)-subcluster assignment of mouse PCs (G).
(H) Dot plots displaying non-imputed expression of DEGs in Aldoc+ and Aldoc− PC subpopulations averaged over time.
(I) Representative smFISH images acquired with identical intensity parameters for detection of Aldoc RNA foci showing distinct Aldoc+ and Aldoc− PC populations in the 18-week WT cerebellum. (J-M) Representative images of detected RNA foci (J,L) and smoothed histograms (K,M) showing differential expression between genotypes in 18-week Aldoc+ (J,K) or Aldoc− (L,M) PCs.
See also Figure S13, and Table S14.
Historically, individual markers have been reported to label exclusive PC subtypes. Among these distinguishing markers, the parasagittal striping of Aldoc (zebrin II)-expressing and zebrin II-negative PCs is of considerable interest in neurodegenerative disorders, as these subpopulations have been shown to display differential susceptibility to degeneration in response to certain experimental, genetic, and pathological perturbations.86–89 Therefore, we next examined if the PC subclusters identified in our snRNA-seq dataset could be segregated based on Aldoc expression. Although not entirely distinguishable by Aldoc expression, our 5 PC subclusters could largely be classified as Aldoc-positive/Kctd16-negative (PC0, PC2, PC3) or Aldoc-negative/Kctd16-positive (PC1, PC4) (Figures 3E–3G). To explore the effect of SCA1 mutations on Aldoc-positive and Aldoc-negative PCs, we examined differential non-imputed expression between genotypes overall (Figure 3H) and between genotypes at each timepoint (Figure S13E) within each PC subpopulation. Consistent with a recent study,90 assessment of PC DEGs in these subclusters revealed similar SCA1-dependent transcriptional responses in both PC subpopulations (Figure 3H; Figure S13E), which we also confirmed using single-molecule fluorescence in situ hybridization (smFISH) (Figures 3I–3M). These data demonstrate that both Aldoc-positive and Aldoc-negative PCs are affected in SCA1 KI mice; therefore, we proceeded to analyze the aggregated mouse PC cluster for downstream analyses.
Myelination is impaired in SCA1
Our snRNA-seq analysis of SCA1 mouse and human post-mortem tissue revealed a large number of DEGs in glial clusters (Figures 1J and 1K; Tables S3–S6), with a high number of DEGs identified in the oligodendroglial lineage (OPC and OL), a glial population suggested to be involved in several other neurodegenerative disorders,91,92 including at least two other polyQ diseases.93–98 OLs, the myelin-producing cells of the central nervous system, serve essential functions in promoting efficient action potential conduction through myelination and in providing metabolic support to axons.99–102 Specifically within the cerebellum, myelination of PC axons is necessary for precise synaptic transmission onto deep cerebellar nuclei neurons,103 which integrate information from the cerebellar cortex with excitatory inputs from extracerebellar regions and subsequently project to their target output regions throughout the central nervous system.
Pathway analysis of human OLs revealed the highest enrichment for pathways related to myelin, driven primarily by down-regulated genes (Figure 4A; Table S15). Examination of DEGs revealed an overall reduction of mature OL transcripts, including nearly all genes encoding the most abundant human myelin proteins recently identified by mass spectrometry104 (Figure 4B and 4C). We validated these findings by immunoblotting in cerebellar lysates from CTRL and SCA patient post-mortem tissues, which demonstrated a reduction of myelin proteins in SCA1 and SCA3 patient tissues, but not SCA6 (Figures 4D and 4E), consistent with neuroimaging studies.105,106 Human tissue-level changes in myelination were further confirmed by quantitative RT-PCR (Figure S14A) and immunohistochemistry in the cerebellar cortex of a larger cohort of SCA1 patients (Figures 4F and 4G; Figures S14B–S14I).
Figure 4. Oligodendrocyte impairments and myelin deficits in SCAs.

(A) Gene ontology (biological process) analysis of total, down-regulated, and up-regulated DEGs in human OL cluster. Top five pathways with the highest fold enrichment for each gene set are displayed.
(B) Volcano plot displaying DEGs of the human OL cluster.
(C) Smoothed histograms displaying distribution of expression of major myelin protein-encoding transcripts in the human OL cluster, showing significant decreases in SCA1.
(D and E) Validation of myelin protein reduction in the SCA1, SCA3, and SCA6 human post-mortem cerebellar cortex relative to controls (CTRL) (CTRL, n=3; SCA1, n=3; SCA3, n=5; SCA6, n=1 patient).
(F and G) Immunohistochemistry (F) and quantification (G) of OL number (i.e. opalin+ cells) and myelination (MBP+ staining) in the granule cell layer (GCL) of the human post-mortem cerebellar cortex (CTRL, n=10; SCA1, n=10 patients). Opalin, scale bar=100μm. MBP, scale bar=100μm.
(H) Heatmap of significantly differentially expressed OPC/OL genes from bulk RNA sequencing of the 12-week WT and SCA1 KI mouse cerebellum (WT, n=3; SCA1, n=3 mice).
(I and J) Western blots confirming myelin protein reduction in the 12-week SCA1 KI mouse cerebellum (WT, n=3; SCA1, n=3 mice).
(K-M) Transmission electron microscopy of PC axons from the 13-week WT and SCA1 KI mouse cerebellum (K) revealed a reduction in percentage of myelinated PC axons (L) and increased g-ratio (M) in SCA1 KI mice. Scale bar=2μm. Red asterisks indicate nonmyelinated axons.
For bar plots, data are mean±s.e.m. The following statistical tests were used: Student’s t-tests to compare across genotypes for (G, J, and L); one-way ANOVA with multiple comparisons to compare across genotypes for (E). *P<0.05, **P<0.01, ***P<0.001, ****P<0.0001.
See also Figures S14 and S15, and Table S15.
Because we observed robust myelin deficits in post-mortem tissues of late-stage SCA1 patients, we next aimed to interrogate the course of myelin impairments during SCA1 progression by examining oligodendroglia throughout time in SCA1 KI animals. Although OPCs and OLs comprise a small fraction of the total cells of the cerebellum (Figures 1F and 1G; Figures S3A, S3B, and S3E–S3G), the consequences of their dysfunction were observed at the tissue level in the cerebellum as early as 12 weeks of age, as demonstrated by bulk RNA-sequencing63 (Figure 4H) and biochemical analysis of myelin proteins (Figures 4I and 4J). This reduction in key myelin transcripts was also observed in the SCA1 cerebral cortex (CX) and inferior olive (IO) of the brainstem, two brain regions that display differential susceptibility in SCA1 (Figures S15A–S15D),63,64,107 suggesting that reduced myelination may contribute to diverse disease-associated pathologies across multiple brain regions. Ultrastructurally, SCA1 KI mice displayed an age-dependent progressive reduction in myelination of PCs, with minor changes in myelin ultrastructure at 6 weeks of age that became more pronounced by 13 weeks of age (Figures 4K–4M; Figures S15E–S15G). Collectively, these data demonstrate that myelin deficiencies may contribute to cerebellar circuit dysfunction from early stages of disease through adulthood; however, confirming this will involve conditional animal studies to selectively express or ablate mutant ataxin-1 in select oligodendroglial populations.
Progressive impairments in OPC to OL differentiation
The proper maintenance and plasticity of myelin through adulthood require continual remyelination, a process in which adult OPCs terminally differentiate into myelin-forming OLs in response to appropriate stimuli.108–110 Additionally, adult remyelination and myelin plasticity are essential for motor learning,111–114 a major function of the cerebellum that is impaired at early timepoints in SCA1 KI mice.4 Because there was a large dysregulation of genes in mouse and human oligodendroglia, including multiple transcription factors involved in OL formation and maturation (OLIG1, OLIG2, NKX6–2, ZNF24, ZNF488, ZNF536, MYRF) (Figure S16A), and many significantly down-regulated genes of the SCA1 OL cluster encode proteins restricted to terminally-differentiated OLs (Figures 4B and 4C), we hypothesized that transcriptional dysregulation at multiple stages during differentiation may impair the formation of OLs and remyelination during adulthood, and contribute to a failure to maintain appropriate expression of pro-myelinating genes.
To study the conversion of OPCs to OL in vivo (Figure 5A), we crossed transgenic Plp1-EGFP/+ reporter mice115 with SCA1 KI animals and analyzed the number of undifferentiated OPCs (Olig2+/Plp1-EGFP−) and differentiating/mature OLs (Olig2+/Plp1-EGFP+) (Figure 5B). Although the total number of oligodendroglia (OPCs and OLs; Olig2+) was unchanged (Figures 5C and S16B), the relative proportion of OLs decreased in SCA1 by 12 weeks of age, with a greater percentage of Olig2+ cells remaining as OPCs (Figure 5D), which was not observed in younger, 5-week mice (Figure S16C). Because OPC differentiation is regulated both by cell intrinsic mechanisms and microenvironmental signals from surrounding cells,116,117 including PCs of the cerebellum,118 we next wanted to determine if the observed OPC differentiation block was due to primary oligodendroglial changes or secondary to PC dysfunction. To this end, we examined cerebellar myelination in a SCA1 animal model in which polyQ-expanded ataxin-1 expression is highly over-expressed but restricted to PCs (SCA1 B05; Pcp2-ATXN1[82Q]/+). Ultrastructurally, PC axons of SCA1 B05 mice displayed moderately increased myelination (Figures 5E–5G), contrary to the finding of severe hypomyelination in SCA1 KI mice in which mutant ataxin-1 is ubiquitously expressed in all cell types (Figure 5H). Furthermore, primary OPCs isolated from SCA1 KI mice and differentiated in vitro in the absence of other cell types failed to up-regulate key myelin transcripts (Myrf, Plp1, and Mbp) upon directed terminal differentiation into myelinating OLs, while retaining expression of OPC markers (Cspg4 and Pdgfra) (Figures 5I–5K). Collectively, these data suggest that the early myelin-related changes observed in SCA1 KI mice and patients are not secondary to PC dysfunction, but rather, at least in part due to cell autonomous primary deficiencies in oligodendroglia.
Figure 5. SCA1 OPCs undergo a cell autonomous differentiation block.

(A) PHATE embedding of human oligodendroglia lineage (OPC+OL clusters).
(B-D) Immunohistochemistry (B) and quantification of total oligodendroglia number (C; Olig2+; WT, n=6; SCA1, n=6 mice) and relative OPC and OL proportions (D; Olig2+Plp1-EGFP− and Olig2+Plp1-EGFP+, respectively; WT, n=3; SCA1, n=3 mice) in the cerebellum of the 12-week WT and SCA1 KI mice. Scale bar=100μm.
(E) Representative transmission electron microscopy images of myelinated PC axons from 15-week WT and SCA1 B05 mouse cerebellum. Scale bar=2μm.
(F-H) Quantification of g-ratio from 15-week WT and SCA1 B05 mice (F and G) and 13-week WT and SCA1 KI animals (H) (WT, n=351; SCA1 B05, n=441 axons from 2 animals per genotype; WT, n=660; SCA1 KI, n=716 axons from 3 animals per genotype).
(I) Schematic of primary OPC isolation and in vitro differentiation into OLs.
(J and K) qRT-PCR for OPC (J) and OL (K) marker genes in primary OLs differentiated in vitro for 17 days (WT, n=3; SCA1, n=3 animals).
For bar plots, data presented are mean±s.e.m. The following statistical tests were used: Student’s t-tests to compare across genotypes for (C,D,G,H,J and K). *P<0.05, **P<0.01, ****P<0.0001.
See also Figure S16.
Interestingly, ultrastructural analysis of myelinated cerebellar axons also revealed a progressive reduction in axon caliber (Figures S16D and S16E), which was more pronounced in SCA1 KI animals compared to SCA1 PC-specific transgenic B05 animals (Figure S16F). Because the SCA1 B05 animal is a model of severe PC dysfunction in the disease, the relatively lesser degree of axon diameter reduction in these animals suggests non-cell autonomous mechanisms can contribute to changes in PC integrity in SCA1 KI mice and patients. Given the role of OLs in metabolically supporting axons99,102 and the well-documented phenomenon of demyelination-induced axon caliber reduction,119–121 it is possible that the primary oligodendroglial deficits we report here influence long-term PC structure involving adaptive responses to preserve proper physiology within the cerebellar circuitry in SCA1; however, a causal relationship between oligodendroglial dysfunction and PC axon ultrastructural changes remains to be determined.
Continuous transcriptional dynamics throughout disease
Although the differential gene expression analysis of time-series data above provides a granular view of transcriptional alterations at specific timepoints throughout disease, chronic neurodegenerative disorders involve long-term, progressive changes that are not necessarily able to be categorized into a small number of discrete stages. Furthermore, individual cells sampled at a specific timepoint exist on a continuum of transcriptional profiles that may resemble those from other timepoints. Recently developed trajectory inference methods have been applied to successfully reconstruct complex lineages of varying topologies through pseudotemporal ordering of cells from single-cell datasets that undergo profound transcriptional changes over time, such as during differentiation122,123 or cellular reprogramming.124 Similar studies of cell trajectories in the context of neurodegenerative diseases have involved sampling single cells captured from a single biological timepoint, usually post-mortem.11,14,19 Because these analyses order cells along an axis of transcriptional variation between healthy and diseased cells, the inferred trajectories do not necessarily capture the chronological processes that underlie progressive age-dependent pathological changes. Furthermore, although pseudotemporal analyses of time-series single-cell data from animal models of neurodegeneration have enabled the identification of emergent populations that are mostly found in late-stages of disease,125–127 how these methods perform in capturing more subtle age-related transcriptional changes in cells that retain their same overall transcriptional state over time remains to be determined.
To broadly characterize each cerebellar cell type’s variable contribution to SCA1, we aimed to generate cell trajectories that capture continuous gene expression changes over both chronological time and disease progression. To computationally infer continuous cell type-specific gene expression dynamics from our SCA1 KI mouse time-series data, we first compared the relationship of pseudotemporal ordering of single cells calculated using several methods123,128–131 with chronological time (Figure S17). Overall, the continuous trajectories constructed using MELD matched best with biological age (Figure 6A; Figures S17M–S17P), also visualized by PHATE (Figure S18). By constructing these trajectories, we were able to examine longitudinal expression patterns for individual genes or groups of genes, simultaneously comparing the heterogeneous dynamics of differential expression between genotypes over the course of disease in each cell type.
Figure 6. Cell trajectories and deep learning to predict disease state and progression.
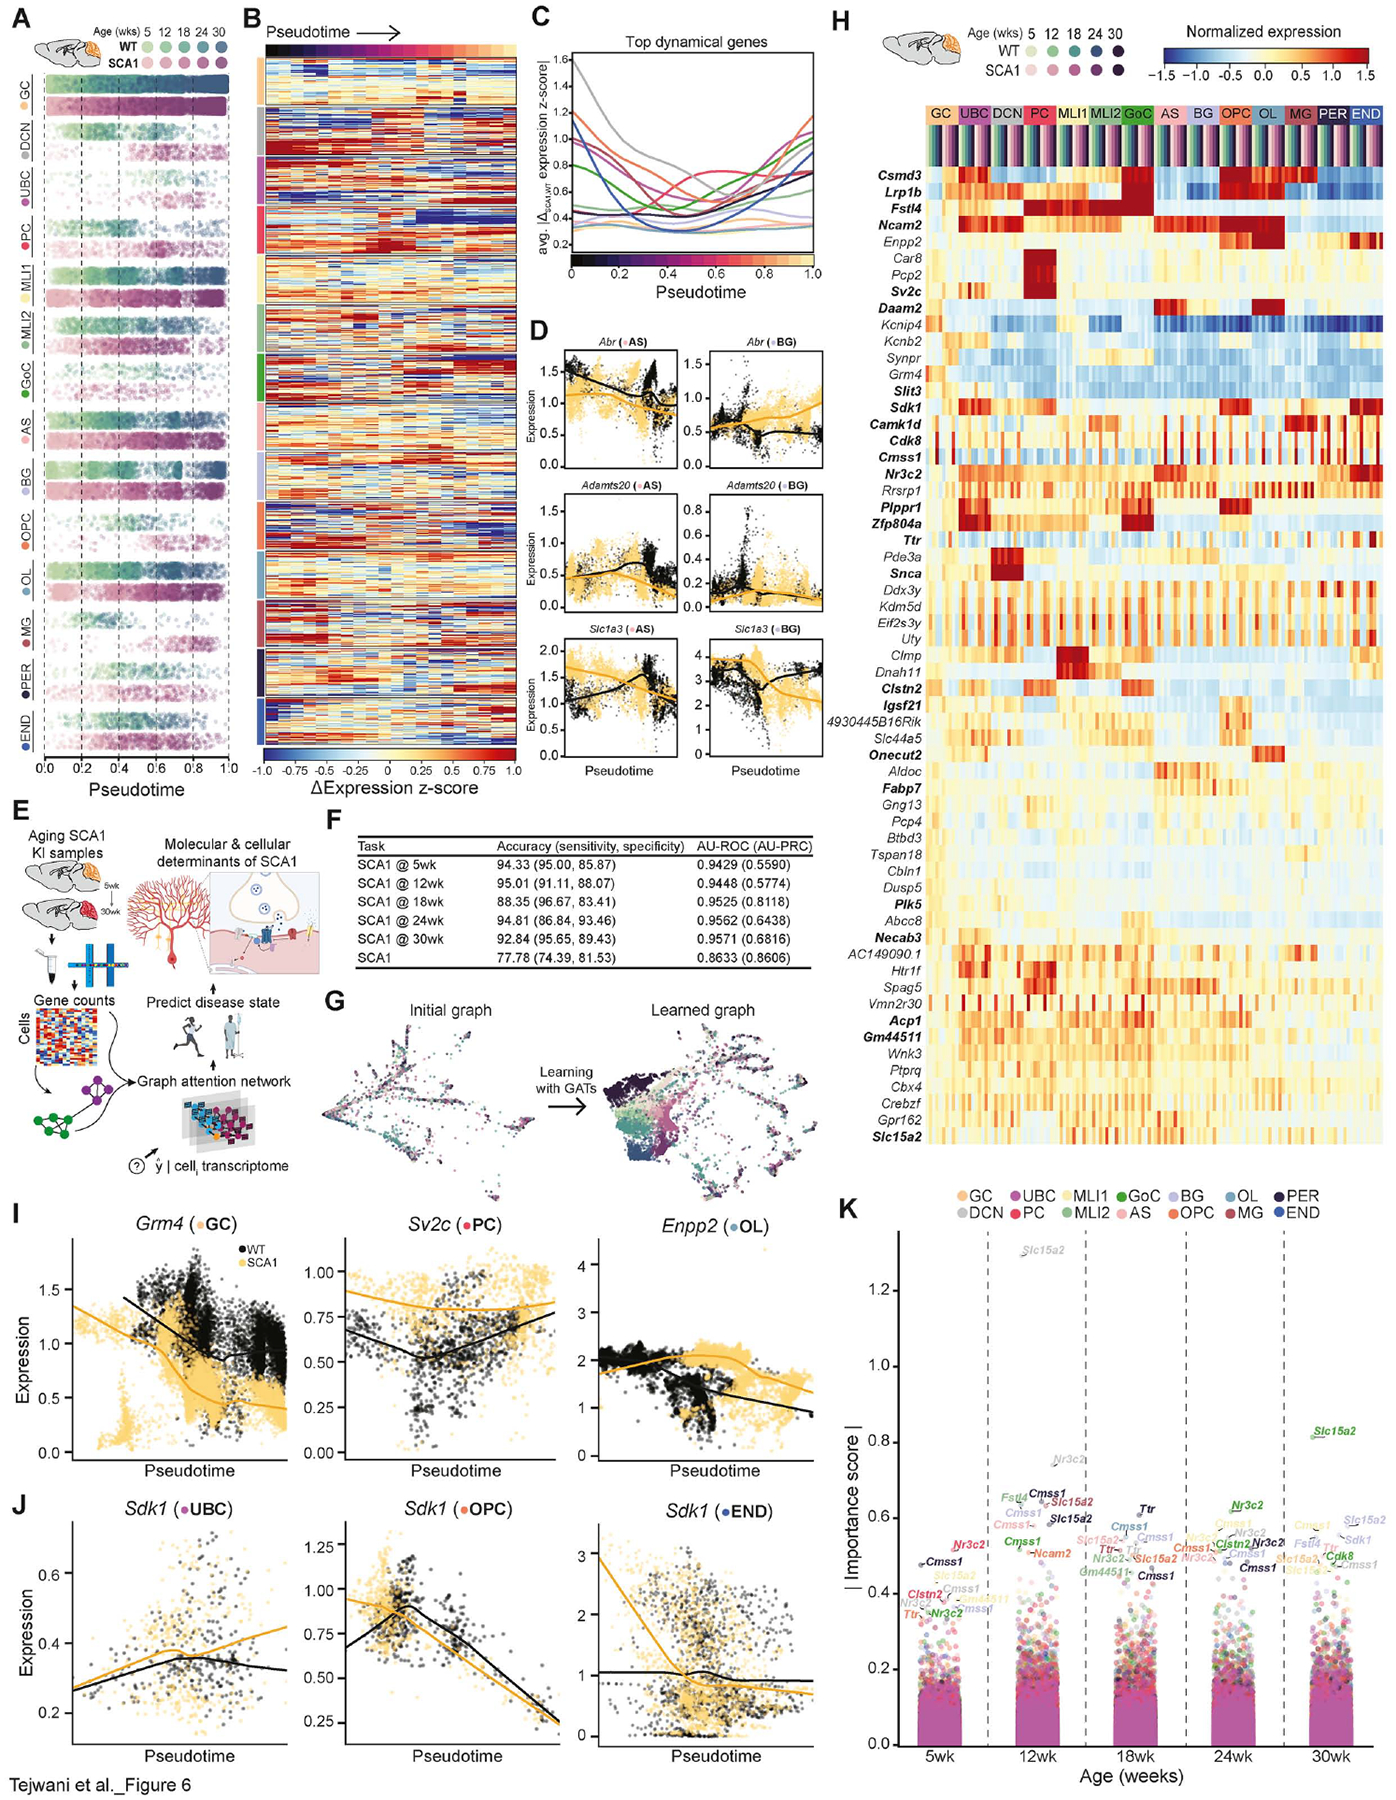
(A) Pseudotemporal ordering of mouse time-series data using MELD to generate continuous progressions for each cell type cluster.
(B) Heatmap displaying ΔSCA1-WT expression z-score for top 100 WT and SCA1 dynamical genes within each cell type over pseudotime.
(C) Average |Δexpression| between genotypes of the top 100 WT and SCA1 dynamical genes within each cell type over pseudotime to highlight timing of each cell type’s dysregulation. Expression was represented as z-score to standardize the displayed units.
(D) Expression dynamics of select dynamical genes over pseudotime show differential patterns between AS (left) and BG (right) clusters.
(E) Schematic overview of approach using geometric deep learning on snRNA-seq data to predict disease state at single-cell resolution to gain insights into pathophysiology.
(F) Performance and evaluation of each model on the test set across 6 binary classification tasks.
(G) PHATE embeddings of test set cells based on the original cell-similarity graph (left), which served as input to each GAT model, and the graph learned by one of the attention heads in the GAT model discriminating between genotypes (right).
(H) Heatmap of z-score of mean expression of top 20 salient protein-coding genes per attention head in the five binary classification tasks predicting SCA1 at various timepoints.
(I and J) Expression dynamics of select salient genes from (H) over pseudotime shows that the GAT model pays attention to genes that are highly differentially expressed between genotypes (I), as well as genes with more nuanced patterns of differential expression (J).
(K) Importance scores for each gene across various cellular subsets. Importance was calculated by computing Integrated Gradients for the average expression of each cell subset across the test set, relative to a baseline of no expression. The top 10 important protein-coding genes for each timepoint are labeled. Bolded genes in (H and K) are salient/important for both the GAT and Integrated Gradient approaches.
See also Figures S17–S19, and Tables S16–S18.
Because Capicua (Cic) has been described to be the primary mediator of PC toxicity in SCA1,33 we first examined the expression dynamics of Cic target genes in each cell trajectory using a list of genes from Cic chromatin immunoprecipitation with sequencing (ChIP-seq) in the developing brain.132 Assessing differential expression trajectories of known Cic target genes for each cell type revealed several key insights. First, expression dynamics of Cic target genes were different across each cerebellar cell type, with DCN, PC, OPC, MG, and END populations displaying the largest differences between genotypes (Figure S19A). Additionally, consistent with previous studies,132,133 Cic target genes displayed both patterns of de-repression and hyper-repression that were dynamic over time. Examination of individual gene dynamics within the PC cluster revealed that a large number of Cic motif-containing genes was differentially down- (Grid2, Cdh18, etc.) or up-regulated (Nrxn1, Cntn4, Cntnap2, Cntn5, Lrp1b, Nrg3, etc.) in our dataset (Figure S19B; Table S6). Similarly, many Cic target genes were differentially expressed in the OPC cluster, with dynamic trajectories for many genes displaying a strong, early down-regulation (Figure S19C). These data demonstrate that for clusters that displayed the greatest overall differential expression and also showed robust differences in Cic target gene trajectories (i.e. PC, OPC, MG) (Figure 1K; Figure S19), alterations in ataxin-1-Cic signaling may be driving the observed gene expression changes. However, for cell types with high differential expression but minimal changes in Cic target gene expression, such as UBC (Figure 1K; Figure S19A), it is likely that alternate signaling complexes are involved in their transcriptional dysregulation.
We next utilized these trajectories to assess the top dynamical genes, as these were most likely to be involved in progressive events as the animals aged. To calculate dynamical genes, we used a machine learning model to regress the pseudotime per cell given each cell’s transcriptome, ranking features by information gain and selecting the top 100 WT and SCA1 predictive genes within each cell type (Table S16). By comparing the mean expression difference between WT and SCA1 for each dynamical gene across pseudotime (Figure 6B; Table S16) and averaging across all top dynamical genes within a cell type, we generated a roadmap of the SCA1 cerebellum that describes the degree of overall perturbation for each cell type throughout all points during disease (Figure 6C). In addition to confirming the results of our differential gene expression analyses regarding early dysfunction of UBCs and OPCs (Figure 1K) and the peak dysregulation of PCs at mid-late disease stages (Figure 2), this analysis also provided an overview of the transcriptional dysregulation in all other cell types over time. We also performed a targeted examination of specific dynamical genes in AS and BG (a specialized type of unipolar AS), which revealed varying longitudinal expression profiles between these related cell types (Figure 6D), highlighting the utility of our single-cell approach in precisely understanding diverse individual gene and gene set expression patterns in different cell populations.
Supervised geometric deep learning to nominate putative disease drivers
Conventional differential gene expression analyses rely on gene-by-gene comparisons to associate genes with disease but may fail to identify interaction effects between genes, as well as marginal signals that, although weaker, are nonetheless associated with disease.134,135 Deep artificial neural networks with supervised optimization can be used to identify complex non-linear interactions between input features; however, neural networks are challenging to train and difficult to interpret. To better understand the complex dependencies between a cell’s transcriptome, developmental trajectory, and cell type in SCA1, we trained a geometric deep learning model on a subset of our longitudinal SCA1 snRNA-seq data to perform multiple tasks and applied a novel explainability approach to interpret the features underlying task performance of these black-box models (see STAR★Methods).
To do this, we used Graph Attention Networks (GATs), a geometric deep learning architecture, to train models in an inductive setting across 6 binary classification tasks (Figure 6E). In predicting whether an individual cell exhibits transcriptional signatures of SCA1 at each timepoint, this approach yielded a minimum area under the receiver-operating characteristic curve (AU-ROC) of 0.94229 and accuracy of 88.35%, suggesting that our models learn to detect unique SCA1 signatures at various timepoints (Figure 6F). In addition, this approach allowed us to take a single cell, of any timepoint or cell type, and determine with ~78% accuracy (AU-ROC, 0.8633) whether the cell exhibits a SCA1 transcriptional signature. As such, we can use deep learning to determine SCA1 status at any point during the lifetime of the mouse at the organismal scale with high accuracy, as well as to detect cells that exhibit early signs of SCA1 within cerebellar tissue. Importantly, these data demonstrate that our models can effectively learn biologically meaningful patterns from our snRNA-seq dataset.
After confirming the predictive accuracies of our models (Figure 6F) and constructing new weighted embeddings based on aggregated learned coefficients (Figure 6G), we next applied local and global algorithms to interpret the features within the dataset to which the models pay the most attention when predicting age and disease status labels, which we refer to as “gene saliency” (Figure 6H; Table S17). We hypothesized that because expression patterns within these genes were crucial for the highly accurate genotype and age label predictions, these genes may represent features that are important to the pathogenesis and/or progression of SCA1. To more specifically interrogate how the top globally salient genes contribute to SCA1 biology, we first examined their expression within individual cell types over time using our longitudinal mouse snRNA-seq dataset (Figure 6H). Among the genes enriched in specific cell types, robust gene expression differences between genotypes were observed for some salient genes within that population (Figure 6I), while for other genes, significant differential expression was not apparent (Figure 6J), demonstrating that GATs pay attention to a combination of diverse transcriptional signals.
Examining global gene saliency may omit subtle differences between various types of cells. To overcome this limitation, we applied a recently developed approach in the field of explainable AI (XAI), Integrated Gradients,136 to each model in order to attribute the models’ output to the variable importance of input features for cells of different cell types and timepoints. Rather than looking at global model saliency for a single input layer, Integrated Gradients calculates the adjustment that the learned model would make for a given input transcriptome throughout the computation graph. This analysis revealed a second, independent set of important genes, many of which overlapped with top salient genes from the GAT, which we considered high-confidence salient genes (Figures 6H and 6K; Tables S17 and S18). In addition to validating our earlier deep learning approach, this method revealed the specific cell types and timepoints during which each important gene had the highest importance score (Figure 6K), providing additional granularity and interpretability of this approach. Collectively, these deep learning approaches identified both prominent and nuanced transcriptional signatures that potentially contribute to SCA1 pathogenesis and progression and offer a complementary approach to traditional clustering and differential expression analysis of single-cell data.
DISCUSSION
Here, we have generated a longitudinal transcriptomic atlas of the mouse and human SCA1 cerebellum that describes the simultaneous transitions of individual cell types within a heterogenous tissue with single-cell precision. These data reveal new insights into the molecular and cellular underpinnings of SCA1 pathogenesis, with broad implications for other cerebellar and neurodegenerative disorders. First, we have comprehensively examined the transcriptional dysregulation in PCs, the major cerebellar cell type lost in SCA1, throughout disease. Surprisingly, our snRNA-seq revealed a partial normalization of PC gene expression at late stages in our mouse dataset, which we validated using two additional modalities (MERFISH and immunoblotting) in distinct cohorts of mice. Although it is possible that the most severely affected PCs had already degenerated by the 30-week timepoint and that the data reflect the transcriptomes of the less-affected, surviving PCs, this is unlikely to be the sole explanation, as this timepoint immediately precedes the bulk of cell loss in the SCA1 KI model. Follow-up histological studies that longitudinally examine the relative quantities of PC subpopulations are necessary to conclusively rule out the possibility of differential abundance in PC subpopulations as an explanation for the observed partial transcriptional normalization at late stages. Furthermore, we have also detailed the transcriptional changes that affect the PF to PC synapse, a major site of dysfunction in SCA1. In doing so, we have not only validated the findings of earlier studies,63,64,67,137 but also provided a great degree of additional granularity into the extent and the precise timing of events underlying the impairment of glutamatergic signaling transmission at this synapse.
Next, our data also revealed a profound transcriptional dysregulation in various glial populations, including oligodendroglia. Although OPCs receive bona fide synaptic input from multiple neuron populations to stimulate their terminal differentiation,138–140 our data demonstrate that the early OL deficits observed in SCA1 are, at least in part, cell autonomous and result from an OPC differentiation block. Whether the impairments in OL differentiation reported here are solely due to cell autonomous expression of mutant ataxin-1 in differentiating OPCs or are also induced by dysfunction in additional populations of cells with which they interact, such as CFs from the inferior olivary nucleus,140 remains to be determined. Furthermore, although PC-specific expression of polyQ-expanded ataxin-1 may drive late-stage myelin deficits, as white matter atrophy has been reported at very late stages in the SCA1 B05 mouse model,141 high overexpression of polyQ-expanded ataxin-1 in PCs is not sufficient to induce early cerebellar demyelination, highlighting the importance of using multiple experimental models to discern primary and secondary glial changes in neurodegenerative disorders. Nonetheless, due to their integral role in regulating the metabolic health and survival of axons,99,102 and due to the well-documented observation that demyelination induces ataxia,142 future studies aimed at determining the extent to which oligodendroglial deficits specifically contribute to SCA1 behavioral and pathological phenotypes, both cerebellar and extracerebellar, are warranted. Beyond PCs and OPCs/OLs, this study uncovers the unique molecular signatures of all major cell types of the cerebellum, including UBCs, throughout the course of SCA1 and will serve as a resource for the future experimental dissection of the complex interplay between these cell types in cerebellar health and disease. Importantly, many DEGs were conserved between the mouse and human snRNA-seq datasets, validating genetically accurate animal models as reliable tools for studying disease pathogenesis.
In addition to revealing specific insights into the pathogenesis of SCA1, the analysis pipeline developed here represents an important advance in the integration of single-cell technologies with novel computational tools to better understand dynamic events. By constructing continuous single-cell trajectories of densely sampled chronic time-series data, we have enabled the examination of progressive gene expression changes within a cell type over the course of disease, overcoming limitations of traditional approaches in which analysis of gene expression differences is restricted to and within a small number of discrete timepoints. We have also applied an XAI approach that not only accurately predicts labels related to cells in the snRNA-seq dataset but can also be used to interpret the molecular determinants of those labels that underlie the models’ predictive power, going beyond gene-by-gene comparisons at discrete timepoints to include patterns in multi-gene dynamics that concomitantly contribute to disease. Although we have applied this approach to SCA1, a monogenic disorder with a known genetic cause, the application of our XAI approach to similar datasets for idiopathic disorders may reveal early disease signatures and molecular drivers of disease. In summary, we believe the pipeline developed here and applied to SCA1 can serve as a prototype for future studies of the dynamics of a variety of large-scale quantitative data in the context of neurodegeneration or any progressive event.
LIMITATIONS OF THIS STUDY
Here, we have generated a single-cell transcriptomic atlas for the SCA1 cerebellum by extensively profiling a well-characterized rodent model of the disease, as well as human patient post-mortem cerebellar tissue using snRNA-seq. Due to the rarity of SCA1, access to a large number of high-quality frozen age- and sex-matched patient samples is limited; therefore, although we sequenced ten unique control and ten SCA1 patient samples, our sampling of SCA1 human tissue remains a limitation of the present study due to variability in patient age at death, polyQ length, sampled cerebellar subregion, and post-mortem interval. As additional patient samples are made available (with accompanying clinical and pathological characterization), it will be imperative to determine the extent to which findings from our dataset, as well as from SCA1 KI animals, are generalizable across diverse SCA1 patient cohorts that vary in age, polyQ length, ethnicity, and other parameters that may influence transcriptional readouts, and to evaluate how these transcriptional changes reflect clinical disease severity.
An additional limitation of the present study is related to the deep learning approach for our mouse snRNA-seq dataset. By having a relatively small sample size for a machine learning application, having completely independent cohorts of mice on which to train our models and to test their predictive accuracies was challenging; therefore, nuclei from the same 30 mouse cohort were assigned to the (non-intersecting) training, validation, or test sets. Although validation of the diagnostic utility of our models would require testing on truly independent holdout samples from the training set, these high predictive accuracies support the application of our models for the purpose of biological inference, as these data demonstrate the models’ ability to effectively learn features that distinguish WT and SCA1 nuclei in the present dataset beyond genes that emerge from differential expression analyses between groups. That said, the biological effect sizes of various salient genes from these XAI studies have yet to be determined. How and to what extent individual gene perturbations are related to specific SCA1 phenotypes remain outstanding questions. Future studies that experimentally interrogate individual genes identified with our approach will provide new insights into key dysregulated pathways and disease signatures in SCA1.
STAR★METHODS
RESOURCE AVAILABILITY
Lead Contact
Further information and requests should be addressed to and will be fulfilled by the Lead Contact, Janghoo Lim (janghoo.lim@yale.edu).
Materials Availability
This study did not generate new unique reagents.
Data and Code Availability
All raw fastq data files from human and mouse snRNA-seq were deposited into GEO under accession GSE246183. The data and additional details of protocols used for this study are available from the Lead Contact upon reasonable request. Scripts used to analyze the snRNA-seq data and the software for the Graph Attention Networks and Integrated Gradients with noise tunnels are also available at the following link for academic use: https://github.com/ChrLeeee/SCA1_snRNAseq_CB.
EXPERIMENTAL MODEL AND SUBJECT DETAILS
Animal Husbandry
All animal procedures were performed in accordance with the National Institutes of Health Guide for Care and Use of Experimental animals and approved by the Yale University Institutional Animal Care and Use Committee. SCA1 knock-in (SCA1 KI; Atxn1154Q/+)4 and PC-specific transgenic (SCA1 B05; Pcp2-ATXN1[82Q]/+),143 and Plp1-EGFP/+ reporter mice,115 along with their littermate controls, were maintained on a pure C57BL/6J background. Mice were maintained on a 12 hours light and 12 hours dark cycle with standard mouse chow and water ad libitum. For animal PCR genotyping, tail snips for DNA extraction were taken for between P14-P17 for all animals. Both male and female mice were used for biochemical and sequencing analyses (see Table S1). Mouse tissue for biochemical analysis was collected as previously described.63
Human Tissue Samples and Patient Information
Frozen human post-mortem tissue used for snRNA-seq, qRT-PCR, and western blotting was provided by the Michigan Brain Bank through Dr. Vikram Shakkottai and Dr. Hayley McLoughlin, the Center for NeuroGenetics (Florida) through Dr. Laura Ranum, the New York Brain Bank and NIH-Maryland through Dr. Phyllis Faust, and from Baylor College of Medicine through Dr. Huda Zoghbi. For histological analyses, ten human SCA1 cerebellar samples were obtained from a hereditary ataxia specimen repository at the Veterans Affairs Medical Center in Albany, New York (courtesy of Dr. A.H. Koeppen). Six age-matched control cerebellar samples were from the New York Brain Bank, acquired from prospectively followed individuals that were clinically free of neurodegenerative disorders on serial neurological examinations through the Alzheimer’s Disease Research Center or the Washington Heights Inwood Columbia Aging Project at Columbia University, and subsequently confirmed with neuropathological examination of the post-mortem brain.144 Four control brains were obtained from the National Institutes of Health NeuroBioBank (University of Miami, Miami, FL, USA). Standardized measurements of brain weight (grams) and post-mortem interval (hours between death and placement of brain in a cold room or upon ice) were recorded. Brains from male and female donors were used for all analyses. All individuals signed informed consent forms approved by the respective university or institutional ethics boards.
Primary Mouse OPC Cultures
Purification and culturing of primary mouse oligodendroglia were performed as previously described,145 with minor modifications. Briefly, P0-P2 mice were sacrificed and the cerebral cortex was dissected in ice-cold MEM. Dissected pieces of cortex were transferred to a 1.5mL microcentrifuge tube containing 350μL ice-cold MEM and gently broken into smaller fragments by pipetting through a P1000 tip. OPC papain solution [1.54mg/mL Papain solution (Worthington Biochemical; LS003126), 360μg/mL L-cysteine (Sigma-Aldrich; C7352), 60μg/mL DNase I (Roche; 1010159001)] was freshly prepared and pre-warmed to 37°C for 20 minutes. Cortex suspensions were also warmed to 37°C for three minutes and 75μL of OPC papain solution was added to each tube of cortex suspension. The cell mixture was transferred to a 15 mL tube and papain digestion was performed at 37°C for 20 minutes with gentle mechanical agitation every 2 minutes. 2mL of mixed glia culture medium (DMEM supplemented with 10% heat-inactivated FBS, 100units/mL Penicillin and 100μg/mL Streptomycin) was then added to each tube and allowed to incubate at room temperature for 10 minutes. The cell suspension was gently triturated 15 times with a Pasteur pipette to dissociate into a single-cell suspension. An additional 2mL of mixed glia medium was then added to each tube, and cells were centrifuged at 1,200rpm for 5 minutes. Cell pellets from each brain sample were resuspended in 1mL of mixed glia medium, plated onto a poly-L-lysine-coated (Sigma-Aldrich; P2636) T25 flask, and cultured at 37°C with 8.5% CO2. A complete medium change was performed 3~4 hours after plating, and the flask was returned to the incubator to allow further expansion of a mixed glial cell culture. Three days later, a 2/3 media change with mixed glial media was performed.
After another six days, another 2/3 medium change was performed and 5μg/mL insulin (Sigma-Aldrich; I0516) was supplemented to promote oligodendroglial development. On day 9, the flask was transferred to an orbital shaker in the incubator with 5% CO2. One hour later, the flask was shaken at 50rpm for 45 minutes to remove loosely attached contaminant cells, followed by a media change with mixed glia media supplemented with 5μg/mL insulin. The flask was returned to the orbital shaker and equilibrated in the incubator without shaking for two hours. Next, the flasks were securely fastened and shaken at 220rpm for 16 hours. Meanwhile, coverslips or tissue culture dishes were coated with Matrigel (BD; 354230) in the incubator with 8.5% CO2 overnight. The next day, cell suspensions were collected and transferred to a 10cm tissue culture dish. The cell suspension was incubated in the incubator with 5% CO2 for 30 minutes with gentle agitation after 15 minutes. The cell suspension was collected and OPCs were centrifuged at 1,200rpm for five minutes. The pellet containing OPCs was resuspended in one mL of OL medium (DMEM, 5μg/mL insulin, 1% GlutaMAX (Gibco; 35050–061), 49.5μg/mL Holo-transferrin (Sigma-Aldrich; T0665), 2% B27 (Gibco; 0080085-SA), 0.5% FBS, 0.05ng/mL CNTF (PeproTech Inc; 450–50), and 1% OL supplement). The OL supplement contains 10.2mg/mL BSA (Sigma-Aldrich; A4503), 6μg/mL Progesterone (Sigma-Aldrich; P8783), 1.61mg/mL Putrescine (Sigma-Aldrich; P7505), 0.5μg/mL Sodium Selenite (Sigma-Aldrich; S5261) and 40μg/mL 3,3’,5-Triiodo-L-thyronine (Sigma-Aldrich; 1368008). 25,000 to 50,000 OPCs were then plated on Matrigel-coated coverslips or tissue culture plates directly and cultured in the incubator with 8.5% CO2 with OL medium changed every other day.
METHOD DETAILS
Isolation of Nuclei from Frozen Tissue
Nuclei were isolated from frozen tissue as previously described.10 For mouse snRNA-seq, hemicerebella of three animals per genotype (WT and SCA1 KI) per timepoint (5, 12, 18, 24, and 30 weeks) were used, for a total of 30 animals. For human post-mortem samples, pieces of cerebellar cortex were harvested from frozen tissue of ten unique individuals per diagnosis (CTRL and SCA1), for a total of 20 human samples. Briefly, frozen mouse or human tissue was gently dounce homogenized in 2mL of ice-cold Nuclei EZ Prep buffer (Sigma; NUC101–1KT) with large clearance pestle “A” and then a small clearance pestle “B” for 25 strokes each, then incubated on ice for five minutes with an additional 2mL of cold EZ Prep buffer. Nuclei were centrifuged at 500xg for five minutes at 4°C. Pelleted nuclei were then washed in 4mL of cold EZ Prep buffer, incubated on ice at five minutes, and centrifuged again at 500xg for five minutes at 4°C. Pelleted nuclei were then washed in 4mL of Nuclei Suspension Buffer (NSB) containing 1x phosphate buffered saline (PBS), 0.01% BSA, and 0.1% RNase inhibitor (Clontech/Takara; 2313B) and centrifuged at 500xg for five minutes at 4°C. Finally, nuclei were resuspended in 1mL of NSB, filtered through a 40μm cell strainer (Fisher Scientific; 22-363-547), and counted using a Countess II FL Cell Counter (Applied Biosystems; A27978). Single-nucleus suspensions were diluted to approximately 1000 nuclei per μl in NSB.
10x Genomics snRNA-seq
Libraries were prepared from diluted single-nucleus suspensions using the 10x Genomics Chromium Single Cell 3’ Reagent Kits v.3 (mouse dataset) or v.3.1 (human dataset) through the Yale Center for Genome Analysis (YCGA). Briefly, 10,000 cells per sample were added to RT Master Mix, loaded on the Single Cell A Chip, and portioned with a pool of about 750,000 barcoded gel beads to form nanoliter-scale Gel Beads-In-Emulsions (GEMs). Each gel bead has primers containing the following: an Illumina R1 sequence (read 1 sequencing primer), a 16-nucleotide barcode, a 12-nucleotide unique molecular identifier (UMI), and a 30-nucleotide poly-dT primer sequence. Upon dissolution of the Gel Beads in a GEM, the primers were released and mixed with the cell lysate and Master Mix. Incubation of the GEMs then produced barcoded, full-length cDNA from poly-adenylated mRNA. Silane magnetic beads were then used to remove leftover biochemical reagents from the post-GEM reaction mixture.
Full-length, barcoded cDNA was then amplified by PCR to generate sufficient mass for library construction, and enzymatic fragmentation and size selection were used to optimize the cDNA amplicon size prior to library construction. P5, P7, a sample index, and R2 (read 2 primer sequence) were added during library construction via end repair, A-tailing, adaptor ligation, and PCR. The final libraries contained the P5 and P7 primers used in Illumina bridge amplification. Libraries were sequenced using the NovaSeq6000 at the YCGA.
Sample concentrations were normalized to 1.2nM and loaded onto an Illumina NovaSeq S4 flow cell at a concentration that yielded 20k-50k passing filter clusters per cell per sample. Samples were sequenced using paired-end sequencing on an Illumina NovaSeq6000 instrument according to Illumina protocols using 10x sequencing specifications. The 8bp index was read during an additional sequencing read that automatically followed the completion of read 1. Data generated during sequencing runs were simultaneously transferred to the YCGA high-performance computing cluster. A positive control (prepared bacteriophage Phi X library) provided by Illumina was spiked into every lane at a concentration of 0.3% to monitor quality in real time. Signal intensities were converted to individual base calls during a run using the system’s Real Time Analysis (RTA) software. Base calls were transferred from the machine’s dedicated personal computer to the Yale high-performance computing cluster via a 1 Gigabit network mount for downstream analysis.
Mouse Cerebellum Histology and Microscopy
For all mouse immunohistochemical analyses, animals were anesthetized with isofluorane and transcardially perfused with cold 1x PBS for two minutes, 4% paraformaldehyde (PFA) for four minutes, and then in 1x PBS for two additional minutes. Brains were dissected and post-fixed in 4% PFA for an additional 24 hours, sequentially dehydrated in 20% and 30% sucrose solutions in PBS, cryoprotected in TissueTek O.C.T. Compound (Sakura; 4583), and serially sectioned into 30μm-thick sagittal sections. Four to six sections from matched cerebellar regions of each animal were washed three times in PBS-X [1x PBS + 0.025% Triton X-100 (American Bioanalytical; AB02025)] for five minutes each, blocked with blocking buffer [5% normal goat serum (NGS; Jackson ImmunoResearch; 005-000-121) diluted in PBS-X] for one hour at room temperature, and incubated in primary antibodies diluted in blocking buffer overnight at 4°C. The following day, sections were washed three times with PBS-X for five minutes each, incubated with secondary antibodies diluted in blocking buffer for one hour at room temperature protected from light, washed three times with PBS-X for five minutes each, and mounted onto slides using VECTASHIELD HardSet Antifade Mounting Medium with DAPI (Vector Laboratories; NC9029229). Tiled images were acquired from each section using a Zeiss LSM800 confocal microscope with a 20x objective (OPC Plp1-EGFP experiments) or 40x objective (PF-PC synaptic co-localization experiments) by an experimenter blinded to genotype. UBC synaptic experiments were imaged on a VS200 slide scanner with a 40x objective.
The following primary antibodies were used: chicken anti-vGlut1 (Synaptic Systems; 135316; 1:500), rabbit anti-PSD-95 (Abcam; ab238135; 1:100), mouse anti-Calb1 (Millipore; C9848; 1:1000), rabbit anti-Trpc3 (Cell Signaling; 77934; 1:500), chicken anti-Tbr2 (Millipore; AB15894; 1:100), mouse anti-calretinin (Millipore; MAB1568; 1:500), guinea pig anti-vGlut2 (Synaptic Systems; 135404; 1:500), rabbit anti-Olig2 (Abcam; ab109186; 1:500), and chicken anti-GFP (Abcam; ab13970; 1:1,000), The following secondary antibodies were used: goat anti-mouse IgG Alexa Fluor 488 (ThermoFisher; A11001; 1:500), goat anti-chicken IgY Alexa Fluor 647 (ThermoFisher; A32932; 1:500), goat anti-rabbit IgG Alexa Fluor 488 (ThermoFisher; A32931; 1:500), goat anti-mouse IgG Alexa Fluor 555 (ThermoFisher; A32728; 1:500), goat anti-chicken IgY Alexa Fluor 488 (Abcam; 150169; 1:500), and goat anti-rabbit IgG Alexa Fluor 568 (ThermoFisher; A-11011; 1:500), and goat anti-guinea pig IgG Alexa Fluor 488 (ThermoFisher; A-11073; 1:500).
MERFISH and smFISH Probe Design, Synthesis, and Antibody-Oligo Conjugation
For each of the 140 target transcripts, 48 RNA MERFISH template oligonucleotides were designed using ProbeDealer.146 Each oligonucleotide was 130 nucleotides (nt) long and consists of the following regions from 5’ to 3’: 1) a 20-nt forward priming region; 2) a 20-nt readout region; 3) a 30-nt targeting region; 4) a second 20-nt readout region; 5) a third 20-nt readout region; and 6) a 20-nt reverse priming region. The sequences for targeting regions were selected based on the following criteria: melting temperatures of the sequences are between 66°C and 100°C; melting temperatures of potential secondary structures in the sequences are not more than 76°C; melting temperatures of products of cross-hybridization with other targeting sequences do not exceed 72°C; GC contents of the sequences are between 30% and 90%; oligonucleotides do not contain more than five consecutive repetitive nucleotides (e.g., GGGGG); and no overlaps between the targeting sequences. Finally, the selected sequences were examined by BLAST+147 against the transcriptome to ensure that each sequence was unique and specific for the desired RNA species. For readout regions, we used 16 fast-binding readout sequences as previously reported.148,149 The oligonucleotides for each RNA species were assigned a unique 16-bit Modified Hamming Distance 4 (MHD4) binary code150 with four “1” bits corresponding to four unique readout sequences. In the 48 template oligonucleotides for each RNA species, oligoucleotides were rotated to carry different combination of three out of four readout sequences, so that the four readout sequences are included 36 times each. The template oligonucleotide sequences are listed in Table S12. The RNA MERFISH template oligonucleotide pool was ordered from CustomArray (GenScript) and the RNA MERFISH primary probes were synthesized as previously described.151 Briefly, the template oligonucleotide pool was first amplified via limited-cycle PCR and in vitro transcription. Then, the primary oligonucleotide probes were produced by reverse transcription and purified after alkaline hydrolysis. All primers and dye-labeled secondary probes were ordered from Integrated DNA Technology (IDT), Inc. For smFISH probe design, 36 probes were designed for each target transcript following the same criteria as described above. Each oligonucleotide was 50-nt long and consists of a 30-nt targeting region and a 20-nt readout region from 5’ to 3’. The readout regions were the same as those in the MERFISH design. The primary probes for smFISH were directly ordered from IDT and the sequences are listed in Table S12.
In order to perform simultaneous immunofluorescence and MERFISH in gel-embedded and tissue-cleared sample, secondary antibodies (Invitrogen; 31238; 1:500) were conjugated to acrydite- and azide-modified oligonucleotides, as previously described.152 Briefly, 1.34μL 1mM DBCO-PEG5-NHS ester (Kerafast) was combined with 20μL 1.3mg/ml azide and BSA-free antibody in Dulbecco’s PBS (DPBS; Gibco). After a two-hour incubation at RT, the reaction was terminated by dialysis at RT for four hours. Next, 13.4μL of 100μM 3′-azide-modified oligonucleotide (/5Acryd/CGGTACGCACTTCCGTCGACGCAATAGCTC/3AzideN/ (IDT)] was combined with the purified DBCO-labeled antibody and incubated at 4°C overnight. The following day, the oligonucleotide-conjugated antibody was purified using 50kDa Ultra Centrifugal Filters (Amicon).
MERFISH and smFISH Tissue Preparation
For spatial transcriptomics of the mouse cerebellum using MERFISH or smFISH, animals were transcardially perfused with cold 1x PBS for five minutes, followed by immediate dissection, embedding in TissueTek O.C.T. Compound (Sakura; 4583), and freezing of the hemicerebella. Frozen tissues were then stored at −80°C. Prior to tissue sectioning, frozen tissues were equilibrated to −18°C for 30 minutes and subsequently sectioned sagittally as 10μm-thick sections onto the centers of poly-L-lysine-treated silanized coverslips. Silanized coverslips were prepared as previously described.153 Briefly, coverslips (Bioptechs; 0420-0323-2) were washed in a 1:1 mixture of 37% HCl and methanol for 30 minutes at RT, rinsed three times in deionized water, once 70% ethanol, and dried in a 70°C oven. Next, coverslips were immersed in a buffer containing 0.1% triethylamine (Millipore; TX1200) and 0.2% allyltrichlorosilane (Sigma; 107778) in chloroform. After a 30-minute incubation at RT, coverslips were sequentially rinsed with chloroform then ethanol. Then, coverslips were dehydrated in a 70°C oven for one hour, desiccated, and stored at RT before usage. Finally, prior to sectioning, the silanized coverslips were coated with 0.01% poly-L-lysine (Millipore; A-005-C) at RT for 15 minutes. After briefly thawing on coverslips at RT, tissue sections were fixed with 4% PFA in DPBS for 15 minutes and washed with DPBS twice for three minutes each. The tissue slices were then either immediately used for MERFISH or smFISH probe hybridization or stored in ethanol at −80°C for subsequent analyses.
For MERFISH probe hybridization, tissue sections were first permeabilized with 0.5% Triton X-100 (Sigma; T8787) in DPBS for 20 minutes at RT, washed twice with DPBS, and incubated in pre-hybridization buffer [30% formamide, 2mM Ribonucleoside vanadyl complexes (Sigma-Aldrich; R3380) and 1000x diluted murine RNase inhibitor (New England Biolabs; M0314L) in 2x saline-sodium citrate (SSC)] buffer for 30 minutes at RT. Next, the coverslip was inverted and placed onto 25μL probe mixture [30% formamide, 0.1% w/v yeast tRNA (Life Technologies; 15401011), 10% v/v dextran sulfate (Sigma; D8906–50G), and 100x diluted murine RNase inhibitor mixed in 2x SSC with 15–20μM MERFISH probes and 2μM polyA-anchor probe (IDT)] on parafilm and hybridized at 37°C for two days. The polyA-anchor probe contains a poly-T region for RNA binding, a readout probe binding region for total RNA staining, and 5’ acrydite modification for RNA anchoring during the gel embedding and tissue clearing procedure (described below). The sequence of the polyA-anchor probe is /5Acryd/TTGAGTGGATGGAGTGTAATT+TT+TT+TT+TT+TT+TT+TT+TT+TT+T (T+ indicates locked nucleic acid). After the two-day hybridization, tissue sections were washed twice with washing buffer (30% formamide and 2000x diluted murine RNase inhibitor in 2x SSC) for 15 minutes at RT. Then, the sections were further washed twice with 2x SSC for three minutes each at RT. For smFISH probe hybridization, all steps were the same except 0.8μM smFISH probes for each target transcript were used instead of 15–20μM MERFISH probes.
To perform cell membrane labeling for cell segmentation, immunofluorescence staining for PMCA1 was performed after MERFISH probe hybridization. Tissue sections were first blocked with blocking buffer [1% w/v BSA, 22.52mg/mL glycine (AmericanBIO; 56-40-6), 0.1% v/v Tween 20, and 1000x diluted murine RNase inhibitor in DPBS] at RT for 30 minutes. Then, samples were incubated with rabbit anti-PMCA1 primary antibody (Abcam; ab3528; 1:100) with 100x diluted murine RNase inhibitor in blocking buffer for one hour at RT. After three DPBS washes for five minutes each, the tissue sections were incubated with 500x diluted oligonucleotide-conjugated secondary antibody (Invitrogen; 31238) in blocking buffer for one hour at RT. Then, the samples were further washed three times in DPBS for five minutes each. Finally, coverslips were incubated for 10 minutes with 0.1μm yellow-green beads (Invitrogen; F8803) resuspended in 2x SSC, which serve as fiducial markers for the correction of sample drift during multiple rounds of hybridization and imaging.
To reduce the imaging background, we then performed gel embedding and tissue clearing, as previously described.153 Briefly, tissue sections were first incubated with degassed gel solution comprised of 4% v/v 19:1 acrylamide/bis-acrylamide (BioRad; 1610144), 60mM Tris·HCl pH 8 (ThermoFisher; AM9856), and 0.3M NaCl (ThermoFisher; AM9759) for 20 minutes. Then, ammonium persulfate (Sigma; A3678) and TEMED (Sigma; T9281) were added into the gel solution at final concentrations of 0.03% (w/v) and 0.15% (v/v), respectively. 50μL of the gel solution was added to the top of a GelSlick-(Lonza; 50640) treated glass plates (TED Pella; 26005) and the coverslips were flipped and placed onto the solution. After two hours of gel formation, the coverslips were gently lifted with a blade and placed into digestion buffer containing 2% v/v sodium dodecyl sulfate (SDS; ThermoFisher; AM9823), 0.5% Triton X-100, and 1:100 proteinase K (New England Biolabs; P8107S) in 2x SSC. The samples were digested for 48 hours at 37°C, and the digestion buffer was refreshed after the first day. After digestion, the samples were washed in 2x SSC four times for five minutes each. The samples were then immediately processed for imaging or stored at 4°C in 2x SSC with 100x diluted murine RNase inhibitor for less than one week before imaging.
MERFISH and smFISH Imaging
For imaging, we built a custom microscope equipped with an oil-immersion objective lens (60x; numerical aperture= 1.4; Nikon CFI Plan Apo Lambda), an active autofocusing system, a sCMOS camera (Hamamatsu; model no. Orca Flash 4.0 V3), a piezo z positioner (Mad City Labs, Nano-F100S) and a motorized x-y stage (SCAN IM 112×74, Marzhauser) on a Nikon Ti2-U inverted microscope body. A 750-nm laser (MPB Communications; 2RU-VFL-P-500–750-B1R), a 647-nm laser (MPB Communications; 2RU-VFL-P-1000–647-B1R), a 560-nm laser (MPB Communications; 2RU-VFL-P-1000–560-B1R), and a 488-nm laser (MPB Communications; 2RU-VFL-P-500-488-B1R) were used for epifluorescence illumination. A penta-band dichroic mirror (ZT405/488/51/647/752rpc_UF2, Chroma) was used on the illumination path. A penta-band notch filter (Chroma; ZET405/488/561/647-656/752m) was used to block the back-reflected excitation lasers from reaching the camera. To control the laser intensities, we used an acousto-optic tunable filter (AOTF; Gooch & Housego; 97-03309-01) to attenuate the laser beam and mechanical shutters (Vincent Associates; LS3S2Z0) to control the laser on-off.
Before imaging, probe wash buffer [10% v/v ethylene carbonate (Sigma; E26258), 0.1 % Triton X-100, and 2000x diluted murine RNase inhibitor in 2x SSC] and imaging buffer [50 mM Tris·HCl pH 8, 10% (w/v) glucose, 2mM Trolox (Sigma-Aldrich; 238813), 0.5mg/mL glucose oxidase (Sigma-Aldrich; G2133), 40μg/mL catalase (Sigma-Aldrich; C30), and 2000x diluted murine RNase inhibitor in 2x SSC] were prepared. Imaging buffer was covered with a layer of mineral oil (Sigma; 330779) in a 50-mL tube to prevent continuous oxidation. Alexa Fluor 750-conjugated 20-nt secondary probes for 16 rounds of MERFISH or smFISH hybridization was diluted to 3nM in probe wash buffer. After buffer preparation, the sample was assembled into a FCS2 flow chamber (Bioptechs) for automatic buffer changes in our computer-controlled and home-built fluidics system.151 For each round of hybridization and imaging, secondary probe was first flowed into the chamber and incubated for 15 minutes at RT. Then, the sample was washed by flowing 2mL probe wash buffer. After subsequently flowing 2mL imaging buffer, z-stack images (0.6μm per z stepping for 20 total steps) with 750-nm and 488-nm laser illuminations for MERFISH/smFISH and fiducial bead signals were captured at each selected field of view (40–60 fields of view/sample were imaged). Next, 2x SSC was flowed into chamber and samples were photobleached by simultaneous illumination with the 750-nm, 647-nm, and 560-nm lasers for 25 seconds. After 16 rounds of MERFISH imaging, one more round of hybridization and imaging using 3nM Alexa Fluor 750-conjugated polyA-anchor readout probe and 6nM ATTO 565-conjugated antibody readout probe was performed.
Protein Extraction and Western Blotting
For all biochemical validation experiments, tissues from both male and female mice of each genotype were used. Total protein lysates were obtained from frozen mouse or human cerebellar tissue by dounce homogenization in Triple lysis buffer (0.5% NP-40, 0.5% Triton X-100, 0.1% SDS, 20mM Tris-HCl [pH 8.0], 180mM NaCl, 1mM EDTA, Roche cOmplete protease inhibitor cocktail, and PhosStop protease inhibitors), rotated for 15 minutes at 4°C, and centrifuged for 10 minutes at 13,000rpm at 4°C. The supernatant was isolated and total protein concentration was measured with the BCA protein assay kit (ThermoFisher). Equal protein amounts were boiled at 95°C for 10 minutes and analyzed by SDS-PAGE (BioRad). Separated proteins from gels were transferred for one hour at 100V onto nitrocellulose membranes at 4°C. Membranes were then washed with TBST (Tris-buffered saline, 0.1% Tween-20) three times for ten minutes each, blocked by 5% non-fat dry milk in TBST for one hour at room temperature, followed by incubation with primary antibody in 5% non-fat dry milk in TBST at 4°C overnight. On the next day, membranes were washed with TBST three times for ten minutes each and incubated with sheep anti-mouse or donkey anti-rabbit IgG-conjugated with horseradish peroxidase (HRP) (GE Healthcare; 1:4,000) for 90 minutes at room temperature. Membranes were then washed with TBST three times for ten minutes and developed using SuperSignal West Pico Plus Chemiluminescent substrate (Pierce; 34580) and visualized using a KwikQuant Imager (Kindle Biosciences).
The following primary antibodies were used: rabbit anti-GRID2 (Abcam; ab198499; 1:5,000), rabbit anti-ITPR1 (Invitrogen; PA1–901; 1:1,000), rabbit anti-PRKG1 (MyBioSource; MBS1493952; 1:1,000), rabbit anti-RGS8 (Novus Biologicals; NBP2–20153; 1:1,000), mouse anti-Calbindin-D-28K (Sigma-Aldrich; C9848; 1:1,000), rabbit anti-Pchd9 (Proteintech; 25090–1-AP; 1:1,000), rabbit anti-Caspr2 (ThermoFisher; MA5–37891; 1:1,000), mouse anti-Nlgn1 (Proteintech; 66964–1-lg; 1:10,000), mouse anti-CNPase (Abcam; ab6319; 1:200), rabbit anti-MOBP (Bioss; bs-11184R; 1:300), rabbit anti-Plp1 (Abcam; ab28486; 1:1,000), mouse anti-MBP (Abcam; ab62631; 1:1,000), mouse anti-MOG (Millipore; MAB5680; 1:1,000); mouse anti-Vinculin (Sigma-Aldrich; V9264; 1:10,000), rabbit anti-transferrin (Abcam; ab82411; 1:1,000); and mouse anti β-Actin (Sigma; A5316; 1:10,000). The following secondary antibodies were used: sheep anti-mouse IgG HRP-conjugated (GE Healthcare; NXA931–1ML; 1:4,000) and donkey anti-rabbit IgG HRP-conjugated (GE Healthcare; NA934; 1:4,000).
Acute Mouse Slice Preparation for UBC Electrophysiology
Patch clamp electrophysiology was performed as described previously.154 Briefly, artificial CSF (aCSF) was prepared in the following manner (in mmol/L): 125mM NaCl, 3.8mM KCl, 26mM NaHCO3, 1.25mM NaH2PO4, 2mM CaCl2, 1mM MgCl2, 10mM glucose. Mice were deeply anesthetized using isoflurane inhalation, decapitated, and brains were rapidly removed for slice preparation. Slices were prepared at 300μM on a VT1200 vibratome (Leica Biosystems, Buffalo Grove, IL) using the “hot cut” technique155, and solutions were maintained between 33° and 36°C during tissue sectioning. Slices were sectioned, incubated, and stored in pre-warmed, carbogen-bubbled (95% O2, 5% CO2) aCSF.
Patch-clamp Recordings of UBCs
Borosilicate glass patch pipets of 2–4MΩ were filled with an internal pipet solution containing (in mmol/L): 140mM K-gluconate, 4mM NaCl, 4mM Mg-ATP, 0.01mM EGTA, 0.001mM CaCl2, and 10mM HEPES, at pH 7.3 and osmolarity 290mOsm. Patch-clamp recordings were performed at 33°C. Pre-warmed, carbogen-bubbled aCSF was perfused at a rate of 150mL/hour for all recordings. Recordings were acquired using an Axopatch 200B amplifier, Digidata 1440A interface, and pClamp-10 software (Molecular Devices, San Jose, CA). Current clamp data were acquired at 100kHz in the fast current-clamp mode with bridge balance compensation and filtered at 2kHz. Cells were included only if the series resistance did not exceed 15MΩ at any point during the recording, and if the series resistance did not change by more than 20% during the course of the recording. All presented voltage clamp data have been corrected for a10mV liquid junction potential.
Total RNA Extraction and quantitative RT-PCR
RNA was extracted from mouse cerebellum, comparable regions of frozen human post-mortem cerebellar tissue, or mouse primary OLs using the Qiagen RNeasy Mini Kit as recommended by the manufacturer’s instructions. For quantitative RT-PCR (qRT-PCR), cDNA was synthesized using oligo-dT primers and the iScript cDNA synthesis kit (BioRad). qRT-PCRs were performed using Taqman probes with iTaq Universal Probe Supermix on a C1000 Thermal Cycler (BioRad) equipped with BioRad CFX Manager software. The following Taqman probes (Applied Biosystems) were used: CNP (Hs00263981_m1), MOBP (Hs00197813_m1), PLP1 (Hs00166914_m1), MBP (Hs00921945_m1), MOG (Hs01555268_m1), ACTB (Hs01060665_g1), GAPDH (Hs_02758991_g1), HPRT1 (Hs02800695_m1), Cspg4 (Mm00507257_m1), Pdgfra (Mm00440701_m1), Myrf (Mm0119495_m1), Mbp (Mm01266402_m1), Plp1 (Mm01297210), Actb (#4352933E), and Hprt (Mm03024075_m1). Expression data were determined by normalizing target expression to housekeeping genes (ACTB, GAPDH, and HPRT1 for human; Actb and Hprt for mouse) using BioRad CFX Manager software and plotted using Prism 8 (GraphPad).
Electron Microscopy
Mice were anesthetized with isoflurane and transcardially perfused with 1x PBS for one minute, 4% PFA in PBS for four minutes, and then in 1x PBS for one additional minute. Whole brains were removed and fixed in EM fixative solution 1 (2.5% glutaraldehyde and 2% PFA in 0.1M sodium cacodylate pH 7.4) overnight at 4°C. The cerebellum was sectioned coronally in cold PBS using a vibratome (Leica VT1000) at a thickness of 150μm. A single 150μm section from a comparable cerebellar depth from each individual animal was used for downstream processing. Sections were further post-fixed in EM fixative solution 2 (1% OsO4 and 0.8% potassium ferricyanide in 0.1M sodium cacodylate pH 7.4) for one hour at room temperature, then washed three times for five minutes in EM rinse buffer (0.1M sodium cacodylate pH 7.4). Specimens were then stained en bloc with 2% aqueous uranyl acetate for 30 minutes, dehydrated in a graded series of ethanol to 100%, substituted with propylene oxide, and embedded in EMbed 812 resin. Sample blocks were polymerized in an oven at 60°C overnight. Thin 60nm sections were cut with a UC7 ultramicrotome (Leica) and post-stained with 2% uranyl acetate and lead citrate. Regions within the white matter containing bundles of PC axons, as determined by an enrichment of cells with orthogonally-oriented microtubules (20–25 fields of view per animal), were examined with a FEI Tecnai transmission electron microscope at 90kV accelerating voltage and digital images were recorded with an Olympus Morada CCD camera and iTEM imaging software at the Yale University CCMI Electron Microscopy Facility. Images were acquired by an investigator blinded to the genotypes and further analyzed as described below.
Human Cerebellum Histology and Microscopy
Formalin fixed tissue was embedded in paraffin and 7μm-thick cerebellar sections were stained with luxol fast blue-hematoxylin and eosin (LH&E). Purkinje cells were counted as previously described,156 and the number of Purkinje cell axonal torpedoes in the entire section was normalized by dividing the Purkinje cell layer length to account for variations in the amount of cerebellar cortex in the tissue block (expressed as mm−1).
For immunohistochemistry, 7μm-thick paraffin-embedded cerebellar sections were rehydrated and antigen-retrieval was performed with Trilogy solution (Sigma-Aldrich; 920P) in a conventional steamer for 40 minutes, followed by a 20-minute cooldown at room temperature. Endogenous peroxidase was inactivated by incubation in 3% H2O2. Sections were blocked for two hours at room temperature in 10% normal goat serum, 1% BSA, 0.1% Triton X-100 in PBS, pH 7.4, and then incubated overnight at 4°C in primary antibody. The next day, after several washes in 0.1% Tween-20 in PBS, sections were incubated with goat anti-mouse (1:500) or goat anti-rabbit (1:200) biotinylated secondary antibodies (Vector Labs), followed by peroxidase substrate (Vectastain ABC kit) and developed with 3,3’-diaminobenzidine in Dako DAB+ Chromogen solution (Agilent; K3468). The following primary antibodies were used: mouse anti-MBP (Biolegend; SMI-99P; 1:5,000) and rabbit anti-opalin (Abcam; ab121425; 1:100). Brightfield microscopic images were acquired blindly on an Olympus Bx43 microscope with a Lumenera Infinity 3 digital camera.
QUANTIFICATION AND STATISTICAL ANALYSIS
Integration and Clustering of snRNA-seq Data
Following alignment of sequencing reads to the pre-mRNA-containing mouse or human reference genomes (mm10 or GRCh38, respectively) using the cellranger count function (10x Genomics), we followed the standard scRNA-seq analysis pipeline for pre-processing scRNA-seq count data.157 All snRNA-seq data were analyzed with Python (version 3.8.2) and pre-processing was performed using SCANPY v1.6.0.158 Briefly we removed genes that were expressed in fewer than 3 nuclei and removed nuclei that expressed fewer than 200 genes prior to imputation, as well as nuclei in which greater than 10% of the total counts aligned to mitochondrial genes. The resulting UMI counts were normalized to library size and square-root transformed. Doublet detection was performed on the mouse and human snRNA-seq datasets using Scrublet,159 which yielded estimated doublet counts of 0.4% and 0.7%, respectively, lower than the expected 5.0% (data not shown).
To integrate snRNA-seq samples from different samples within a species, we compared various integration methods (i.e. Seurat v3, COMBAT, LIGER, Mutual nearest neighbors, and Harmony)160–164 and ultimately used an approximate batch-balanced KNN (BBKNN) graph for batch-effect correction, manifold learning, and clustering, based on its scalability for large datasets and its ability to integrate data while preserving nuanced biological variation. Following a hyperparameter search to determine optimal settings for the integration of individual samples, this approach allowed the quick and accurate generation of the two mouse and human snRNA-seq pooled datasets.165 We utilized SCANPY’s fast approximation implementation of BBKNN with 100 principal components to calculate pairwise Euclidean distances but otherwise default parameters.158,160 BBKNN assumes that at least some cell types are shared across batches and that differences between batches for the same cell type are lower than differences between cells of different types within a batch. For each cell, the 3 nearest neighboring cells in each condition were identified by Euclidean distance in 100-dimensional Principal Component Analysis (PCA) space. This kNN graph was used as the basis for downstream analysis.
To visualize the snRNA-seq data, we implemented various non-linear dimension reduction methods with the BBKNN batch-corrected connectivity matrix as input for uniform manifold approximation and projection (UMAP) and potential of heat-diffusion for affinity-based trajectory embedding (PHATE).166,167 UMAP projections were generated using a minimum distance of 0.5 and PHATE projections were generated with a gamma parameter of 1. For clustering nuclei, we used the Louvain community detection method applied to the BBKNN graph with high resolution (resolution=3, otherwise default parameters using SCANPY’s implementation), which facilitated cell type annotation. We used the BBKNN graph for gene expression imputation using Markov affinity-based graph imputation of cells (MAGIC).168 Then, pre-clusters of the same major cerebellar cell type were merged when appropriate and manually annotated based on imputed expression of previously described cell type-specific marker genes to yield 1 of 14 cell types. Unless otherwise noted, these merged clusters (representing the major distinct cerebellar cell populations), rather than individual pre-/subclusters, were used for downstream analyses.
Differential Expression and Pathway Analysis
Because subclusters of cells belonging to the same cell type identity (e.g. GC, UBC, etc.) were aggregated prior to differential expression analyses, the distributions of gene expression within a population were not assumed to be identical across genotypes or different cell types. Therefore, in order to identify global gene expression changes across a population of cells, as well as complex variations that emerge from heterogenous changes in subsets of cells or alterations in population subcluster composition,169 we used a combination of three metrics to determine DEGs: the Wasserstein or Earth Mover’s distance (EMD), an adjusted P-value from a two-sided Mann-Whitney U/Wilcoxon rank-sum test with a continuity correction and a P-value adjustment using the Benjamini-Hochberg correction, and the binary logarithm of fold change between mean counts. The EMD can be defined as the minimal cost to transform one distribution to another and has been used to assess gene expression that significantly differs between conditions.170,171 We performed binary comparisons of genotype for each timepoint and cell type for non-imputed and imputed expression (batch-effect corrected and conditioned on genotype) and for normalized and transformed raw data (data not shown) separately after subsampling dataset to control for differences in number of nuclei across genotypes and timepoints. Because data imputation of snRNA-seq data may potentially generate false positive differential expression results,172 we determined the extent to which our differential gene expression analyses were impacted by data imputation. To do so, we systematically compared the DEGs and enriched pathways with different diffusion times (t) and number of neighbors (k), two variable parameters of MAGIC that can influence the final imputed data. Importantly, the majority of DEGs and enriched pathways were present and conserved before and after imputation, demonstrating the overall robustness of data imputation with MAGIC for our dataset, consistent with previous reports.168,173 Because imputation of our dataset with MAGIC minimized technical noise resulting from dropout in snRNA-seq analyses without generating substantial false positive, the differential expression analyses reported here reflect changes in imputed expression between genotypes, unless otherwise noted. However, we also included gene lists for differential expression analyses of the non-imputed datasets.
Genes with Pcorrected<0.01 and |EMD|≥0.1 were considered significant. Pathway enrichment analyses of significantly differentially expressed genes in PCs and UBCs were performed using Ingenuity Pathway Analysis (QIAGEN Inc., https://www.qiagenbioinfor-matics.com/products/ingenuitypathway-analysis). Enriched canonical pathways were considered significant above a threshold of [-log(Pcorrected)>1.3] after Benjamini-Hochberg correction for multiple testing. For gene ontology analysis of human OLs, as well as mouse/human UBC and PC comparisons, PANTHER Overrepresentation testing was performed using the Fisher’s exact test with Bonferroni correction, using the GO biological process complete annotation dataset (GO database 10.5281/zenodo.5228828).
Subcluster analysis of UBCs and PCs
To identify subpopulations within the UBC and PC clusters, the Louvain community detection method was applied to the BBKNN graphs of UBC and PC nuclei. For UBCs, Louvain resolution of 1.2 was applied to yield 8 subclusters, which were annotated as ON or OFF UBCs based on expression of the previously described subpopulation marker genes.24 For PCs, Louvain resolutions of 1.0, 1.05, 1.1 and 1.5 were applied to yield 3, 12, 23, and 101 subclusters, respectively. Because three to five main subclusters remained even with the incremental resolutions, we proceeded to identify marker genes of the five largest subclusters of PC at resolution= 1.5. Marker genes of each subtype of UBC or PC were determined by performing differential expression analysis of non-imputed gene expression as described above, using EMD, log2(fc), and Pcorrected<0.01 to identify genes that distinguish individual subpopulations of genes.
Expression of Ataxin-1 Interactors
Ataxin-1 protein interactors have been previously identified using a yeast two-hybrid approach49. The comprehensive list of these interactors and several others was obtained from the Biological General Repository for Interaction Datasets (BioGRID).174 To visualize the cell type-specific expression of these ataxin-1 interactors, we first standardized expression for each gene at each timepoint, removing the average expression across cell type and genotype and dividing by the standard deviation (z-score). We then averaged the z-score in each cell type and hierarchically clustered the expression data with a Euclidean distance metric for agglomeration using scipy (version 1.5.2). The resulting averaged, z-scored expression for all expressed interactors in WT cerebellar cells was plotted in a heatmap.
Image Analysis
For all mouse immunohistological analyses of UBC and OL numbers, tiled whole-mount cerebellum images from four to six sections per animal were blindly acquired and analyzed. Quantification of UBC or OL numbers from de-identified maximum intensity projection images was either manually quantified using ImageJ or automated using a custom pipeline in the open-source software CellProfiler,175 respectively. Briefly, signals in each channel [DAPI, Olig2, GFP (Plp1)] were extracted and segmented. To exclude false positive signals and cells that were out of focus, masks were set in the Olig2 and GFP channels over the segmented nuclei to quantify the total number of OPC/OL nuclei and differentiated OLs, respectively. Cell counts were normalized to the sampled area and averaged across sections from the same animal. The accuracy of the automated quantification pipeline was tested and highly correlated with manual quantification of OL lineage cells. The experimenter was blinded to animal genotype during image acquisition and analysis.
For mouse immunohistological analysis of UBC synaptic changes, cerebellum images from three to four sections per animal were blindly acquired and analyzed. Image z-stacks were flattened to maximum intensity z-projection, converted to 8-bit images, and thresholded using identical acquisition and processing parameters across all images. ROI manager was used to measure equal areas across images. For vGlut2 fluorescent intensity quantification in UBC populations, Trpc3 and calretinin images were thresholded and overlaid onto vGlut2 images, and the mean gray intensity value per UBC was recorded. Clumped UBCs were split using the watershed function, and only UBCs greater than 40μm2 included in analyses.
For mouse immunohistological analysis of PF-PC synaptic changes, images from lobules III/IV of three to four sections per animal were blindly acquired and analyzed using Imaris 10.0.1. Briefly, PC dendrites were identified using the surface module based on Calb1 intensity. Next, the vGlut1 and PSD-95 channels were masked using the Calb1 PC surface. Pre- and post-synaptic structures on PCs were detected using the spot module based on the Calb1-masked vGlut1 and PSD-95 channels, respectively. Finally, co-localization pre- and post-synaptic spots within 1μM of each other was reciprocally calculated. Two sets of distinct detection thresholds were uniformly applied across all WT and SCA KI sections and the average spot number (normalized to Calb1 volume) between the two analyses was reported.
For electron microscopy studies, 20–25 images were obtained for each animal and quantified blindly using the Fiji package of ImageJ. Following de-identification of images, percentage of myelinated axons in each image was manually quantified using the Cell Counter plugin and averaged across all acquired images within an animal. The longest outer myelin diameter and overlapping inner myelin diameter (axon diameter) were measured and the g-ratio was calculated by dividing the inner myelin diameter by the outer myelin diameter. Axons were excluded if microtubule organization appeared non-orthogonal to the sectioned plane being imaged.
For quantitative histology studies of human post-mortem cerebellar tissue, whole slide scanning was performed on a Leica Biosystems Aperio AT2 scanner and analyzed with Aperio ImageScope software (v.12.4.0). Areas of cerebellar cortex were outlined, the number of MBP-labeled profiles were quantified using the positive pixel count v9 algorithm, and cells in the granule cell layer with a distinct rim of cytoplasmic opalin staining were quantified with the counting function. The area of white matter and total cerebellar cortex were outlined on MBP immunostained sections in StereoInvestigator software (MicroBrightfield) using the tracing function.
MERFISH and smFISH Analysis
All MERFISH and smFISH imaging analyses were performed using MATLAB (version R2020b). Codes were adapted from a previously published MERFISH work.148 First, the x-y positions of the fiducial bead markers were fitted with 2D Gaussian functions in each round of imaging and a transformation file for each field of view in each round was created, which was used to subtract the movement between rounds of imaging by image translation. Next, for decoding the identities of different RNA foci, background images were generated by image opening with a disk-shaped morphological structuring element with a radius of five pixels for each drift-corrected raw image. After subtracting the background from the raw images, the regional maxima were identified with different thresholds. To determine optimal thresholds for regional maxima identification, an adaptive procedure to screen multiple threshold values for each round of imaging was used, so that the relative MERFISH foci number fit the relative expected foci number based on the bulk RNA-seq data and the MERFISH codebook. The regional maxima were potential MERFISH foci to be identified. Then, for each field of view, 16 binarized images with “1” values only at the maxima for each round of image were generated and overlayed into a stack. Later, the 16 values of each xy pixel in the image stack image was compared with the MERFISH codebook and the corresponding RNA species was identified. All adjacent pixels determined to contain the same RNA species were counted as one copy of that RNA species. Finally, the MERFISH RNA copy number for each gene was corelated with the fragments per kilobase of transcript per million mapped reads (FPKM) value from bulk RNA-seq of the WT cerebellum63 and the thresholds that generated the best correlation were selected.
For cell segmentation, cell bodies for cerebellar granule layer cells, PCs, and molecular layer cells were segmented separately using PMCA1 immunostaining, MERFISH signal, and total RNA staining, respectively. First, a mask to separate the molecular layer and granular layer in each field of view was generated. The total RNA staining images in each z-stack was averaged along the z-plane and the average image was normalized so that the maximum pixel intensity was 1. Then, we binarized the image using the locally adaptive threshold with a sensitivity factor of 0.5. Next, image closing and opening were performed by sequential reconstruction with a disk-shaped morphological structuring element with a radius of 60 pixels and 20 pixels, respectively. As a result, images were binarized and separated into two parts, with the region with value 1 representing cells in the granule cell layer. For the granule layer cell segmentation, averaged z projection PMCA1 images were generated and normalized so that the maximum pixel intensity was equal to 1 and the minimum pixel intensity was 0. Then, background images of each averaged PMCA1 image were generated using the adaptthresh function in MATLAB with a sensitivity of 0.1 and a neighborhood size of 41 pixels. The image was flattened by the background through division and the image was then thresholded by setting the 1st and 99th percentiles of the pixel intensities to zero and one, respectively. The granule layer mask was applied so that the pixel intensities of the other region were set to zero. Finally, image closing with a disk-shaped morphological structuring element with a radius of 15 pixels was performed and the watershed algorithm in MATLAB was applied to identify segmentation boundaries.
For PC segmentation, cells were separated based on thresholded MERFISH images from a single round of imaging due to the much higher MERFISH pixel intensities in PCs relative to all other cerebellar cell types. First, averaged z projection images of the first round of MERFISH imaging were calculated and normalized. Next, the center of each Purkinje cell was identified by thresholding with the imbinarize function in MATLAB with an adaptive threshold and sensitivity of 0.8. The binarized images were further processed with imaging opening and closing with a disk-shaped morphological structuring element with a radius of 15 pixels. Then, the activecontour function in MATLAB, a region-growing image segmentation algorithm, was used by evolving the contour for a maximum of 100 iterations. For the Purkinje cells that were adjacent and not separated, watershed-based segmentation algorithm was applied to draw boundaries between Purkinje cells.
To segment cells in the molecular layer, averaged z-projection total RNA staining images were generated and the background profile was calculated using the adaptthresh function with a neighborhood size of 121 pixels. Then, the images were flattened by the background profiles through division and were binarized with a globally determined threshold. The images were further processed with image opening with a disk-shaped morphological structuring element with a radius of 15 pixels and cells were separated by connected components analysis. Finally, all segmented cells were combined in each field of view, and granule layer and molecular layer cells that have 40% overlap with Purkinje cells were removed.
For smFISH analysis, the background was subtracted from raw images and RNA foci that surpassed a threshold as regional maxima were identified. To perform cell segmentation for PCs, the average image from different rounds of sequential smFISH imaging was generated and segmented using the watershed algorithm. Then, misidentified cells were manually removed and RNA foci number in each PC was quantified. To perform differential expression analysis for MERFISH and smFISH, the RNA count number from each cell was summed and then normalized by PC number in each condition. Then the RNA fold change was calculated using the normalized RNA counts between SCA1 and WT at each time point. Wilcoxon rank sum tests were performed between genotypes using single-cell RNA counts from each cell, with correction for the false discovery rate (Benjamini-Hochberg method).
Trajectory Analysis
To quantify the temporal ordering of cells, we relied on the extent to which an individual cell is transcriptionally similar to a known timepoint sample, inferring pseudotime based on a graph signal processing approach called Manifold Enhancement of Latent Dimensions (MELD).128 We encoded a raw experimental score for each cell in the dataset such that −1, −0.5, 0, 0.5, and 1 corresponded to cells from 5, 12, 18, 24, or 30wk mice, respectively. Using the kernel from the BBKNN graph (described above), these raw scores were smoothed in the graph domain, yielding a pseudotime per cell. We visualized these results by plotting expression against the pseudotime and fitting a smooth line to these data, using locally estimated scatterplot smoothing or local regression (LOESS) with two-thirds of the data in each of the three residual based re-weightings, as implemented with statsmodels (version 0.11.1). This method can be thought of as a linear trajectory for a particular gene across a particular timepoint, where pseudotime is calculated for each cell type independently.
To determine which genes drive the dynamics of transcriptomic changes in WT and SCA1 mice across development and aging, we used a machine learning approach to regress pseudotime given gene expression. Namely, for each cell type and genotype, we took the cell by genes feature matrix and used it as input to a model to predict each cell’s pseudotime, where, f represents a machine learning model; in our case, we used a gradient boosting tree model to approximate the inferred time per cell i, given its gene expression x. To improve predictive performance, evaluated as mean squared error of the predicted cellular time compared to the inferred pseudotime, we imputed data conditioned on genotype, achieving an average R2 = 0.92 across cell type, genotype, and cross-validation folds. To implement our gradient boosting tree model, we used XGBoost (Python implementation, version 1.2.0).176 We used Bayesian optimization with a Tree Parzen estimator to select hyperparameters that maximized performance.177 Briefly, we used a learning rate of 0.3, a max tree depth of 100, a minimum Hessian needed in a child of 5, 80% subsampling of training instance per boosting iteration, and a 25% sample of features used for each tree, leaf, and node. Otherwise, default hyperparameters were used. Each fold was trained for a maximum of 5,000 epochs with a patience of 500 epochs on the cross-validation fold dataset. We used 10-fold cross-validation to select the best model for feature engineering. Using the best model over cross-validation folds per cell type and genotype, we determined dynamical genes by capitalizing on tree-based model’s implicit feature importance algorithm: tree-based models add splits to a tree when there is a wrongly classified element upstream such that each of the branches from a new split are more accurate. Thus, we used information gain to rank which genes are important to predicting inferred time, sorting genes by the improvement in accuracy that each gene feature provides to the branches that it is on in the final model. The top 100 genes most important, by information gain, to predicting a cell’s time, across the training data, were considered to be the top 100 dynamical genes.
Deep Learning of snRNA-seq Data
Deep learning is able to model non-linear and higher-order dependencies between features within a dataset. The first challenge of any neural network is to train, i.e., to learn, how to classify cells given their transcriptome and generalize to unseen data with good performance accuracy. As such, we developed a deep learning approach and applied it to our mouse snRNA-seq dataset to identify transcriptomic determinants of disease that may have escaped detection in differential gene expression analyses. Graph Attention Networks (GAT) have been shown to achieve much better performance on single-cell datasets than other models, which suggested that we could use this graph neural network (GNN) architecture to learn to discriminate transcriptomic signatures of SCA1 from WT at single-cell resolution.178,179 GNNs rely on a message-passing scheme, in which features are aggregated according to a graphical structure and a new representation of the input graph and features are learned by gradient-based optimization and backpropagation. GATs have a self-attention mechanism that builds on graph convolutional neural networks (GCNs), allowing the network to attend to different neighbors’ features with learnable weights, which helps GATs achieve state-of-the-art performance on node classification tasks in an inductive setting.180 In our application of GATs to snRNA-seq data, we follow the exposition of Veličković et al. We first learned an approximate kNN graph (k=30) based on cell-to-cell pairwise Euclidean distances in 100-dimensional PCA space. The input to the GAT is a set of node features, h = {h1, …, hN}, where N is the number of nodes, and each vector hi corresponds to range-scaled, filtered and normalized gene counts for a particular node, hi ∈ [0,1]F, where F is the number of features, i.e., genes (F=26,374). Each GAT layer produced a new set of node features, h′ = {h1′, …, hN′}, where with cardinality F′.
To obtain h′, first, a linear transformation was applied across nodes with a weight matrix, . GAT layers differ from graph convolutional layers by including an attention mechanism. To calculate self-attention on nodes, we used a single-layer feedforward neural network with non-linear activations (LeakyReLU), yielding a single coefficient per edge, eij = a(Whi, Whj). These coefficients were normalized via a softmax function across all of neighbors of node i, where ηi tracks the neighborhood of node i; in our sparse implementation, we only considered the first-order neighborhood of each node. With these normalized attention coefficients, we can compute the linear combination of features to get the new node representation, where σ is the logistic sigmoid function. We used multi-head attention and, prior to the final prediction layer, the new node feature representations were concatenated across heads and passed to the next GAT layer. In the final prediction layer, the node representations were averaged over the heads and a final non-linearity was applied (logistic sigmoid), for K attention heads. Exponentiating the output of this final layer gave the predicted probability that a given node belongs to a particular class.
We used GATs to train 6 different models: 5 models that learn to discriminate SCA1 at each timepoint from other cells, and 1 model to discriminate transcriptional signatures of SCA1 across mouse development (these 6 models comprise a binary, node classification task). We randomly assigned cells to a training, validation, and test set to acquire three datasets such that 𝒟train ∩ 𝒟val ∩ 𝒟test = ∅, where each is a subset of the full mouse snRNA-seq dataset 𝒟, comprising 33%, 7%, and 7% of the total number of cells, respectively, formulating our tasks in an inductive setting (where the deep learning model has not seen the evaluation set graphs). We allowed each model to train for a maximum of 2,000 epochs, but set a patience of 100 epochs, evaluated on the validation set. The parameters were trained according to the objective function, which minimizes the negative log likelihood loss, with Adagrad optimization.181,182 We used Glorot initialization for the weight matrices, Wℓ. For all models we used 2 layers with a hidden unit size of F’=8 across K=8 attention heads. We used cosine decay with 1000 first decay steps as our learning rate scheduler and a weight decay of 5e-3 for regularization. We used 50% dropout with alpha=0.2 as the slope in the LeakyReLU activation. We used Cluster-GCN to break up our kNN graph into sub-graphs with 5,000 partitions, facilitating mini-batching and stochastic gradient descent.183 To evaluate our models, we report accuracy, sensitivity, and specificity at a threshold identified by Youden’s J-index for binary classification tasks (maximizing sensitivity and specificity). For multi-class problems, we report evaluation metrics with a one-vs.-rest heuristic evaluation scheme and take a prevalence-weighted averages such that each metric is adjusted for the number of class instances. Due to class imbalance and the desire to ensure our models learn interesting transcriptional signatures for distinguishing SCA1 at each time point (which comprise ~10% of each dataset), we also report areas under the Receiving Operator Characteristic curve and Precision-Recall curve for each model. To implement and evaluate all models, we used PyTorch (version 1.6.0) and PyTorch Geometric (version 1.6.1) on a Nvidia GTX 1080-Ti GPU with CUDA v10.1 and 64-GB of CPU memory for graph pre-processing.
Given the excellent performance of our models across classification tasks, we sought to determine which transcriptional signatures our black-box models used to predict various labels, which allowed us to generate hypotheses as to the molecular mechanisms of SCA1 across brain development and aging. To identify the molecular determinants of SCA1 at a particular timepoint, given the appropriate model, we first looked at what transcripts the model highly weighted in making its decision, similar to saliency maps used in interpreting image classifiers.184 We extracted the learned weight matrix, , where k=1 indicates that the weight matrix is taken from the first layer for a given attention head and . In this case, the transpose of the learned matrix was a 26,374 × 8 matrix. To identify highly weighted genes from , we sorted the absolute value of the weights per head and concatenated the result across heads, taking the union of weights up to an indexing variable for m top genes, . For each model, these weights can be found in and thought of as the transcripts important to discriminating between classes.
To visualize the important genes, we took the gene identities and visualized standardized expression across subsets of interest (cell type, genotype, and timepoint), representing expression with an average z-score from each subset (removing the mean from filtered and normalized expression values and dividing by the standard deviation across 𝒟test). This amounted to a single-layer attribution method, which, although has been previously used with single-cell data, may omit contribution of downstream layers or interactions between layers in attributing the output of the deep network to input features.136 In addition, looking at gene saliency globally may omit subtle differences between different types of cells. To simultaneously overcome both limitations, we also used the local interpretability approach of Integrated Gradients, which was developed around the axioms of sensitivity and implementation invariance.136 Integrated Gradients assign an importance score to each input feature, i.e., each gene, by summing the gradients across the computation graph for an input, with respect to baseline, which we define to be no expression. For single-cell data and our GAT models, this amounted to , where F is a function that represents our deep network, is the gradient of F(h) along the gene feature dimension, f, and h is a vector in which filtered and normalized gene expression is averaged over cells of the same cell type, genotype, and timepoint and range-scaled, hi ∈ [0,1]F. To smooth this gradient-based sensitivity map of output from features, we applied the SmoothGrad to our Integrated Gradients attribution approach.185 Using a SmoothGrad noise tunnel, we computed the attribution N=10 times, adding Gaussian noise, 𝒩(0,1), each iteration to each input h. In the SmoothGrad approach, the mean of the sampled attributions is returned as the importance score, which effectively smooths the attribution vector with a Gaussian Kernel. We calculated the importance score as the absolute value of the smoothed Integrated Gradients per feature and input, Importancef = |< NoiseTunnel (IntegratedGradsf(h)) >|, which yielded an importance score for each gene feature and averaged expression input, i.e., 14 cell types × 2 genotypes × 5 timepoints × 26,734 gene features or ~3.4 million importance scores per model. Finally, to correct for sex imbalances in the samples at different timepoints, we performed ordinary least squares linear regression, implemented with the sklearn package v1.0.1, and evaluated our model for the influence of sex on gene importance by calculating the mean-absolute error on a holdout set (70/30 train/test split for importance scores calculated on the GAT’s test set, which yielded MAE=0.01 in units of range-scaled expression). After learning the coefficient that modeled the influence of sex on the importance scores, we regressed out the influence of sex, yielding a metadata-adjusted score.
To implement this attribution approach, we used PyTorch Captum (version 0.2.0) and custom functions to adapt these attribution methods to GNNs. Finally, to potentially identify unique, phenotypic populations, and to segregate single-cell embeddings by genotype and timepoint, we used PHATE and the attention coefficients from our 10-label GAT model to visualize the new graphs learned by each attention head. We constructed a matrix in which the i-th and j-th entry is given by , the normalized attention coefficients described above for a particular attention head. These matrices are normalized adjacency matrices, yielding a directed graph. This graph can then be fed as a precursor to popular manifold learning methods such as UMAP and PHATE. The new low-dimensional embeddings learned by PHATE after inputting the graphs learned by various attention heads tend to segregate individual cells by the label, as each attention head learns a pattern in accordance with optimization of the objective function. To facilitate the use of state-of-the-art deep learning approaches for scientific interpretability and hypothesis-generation with other single-cell datasets, we have made all code publicly available for these deep learning modeling and interpretability approaches (see link in the Data Availability section).
Statistical Analysis
Statistical analysis of snRNA-seq data was performed using Python (version 3.8.2), numpy (version 1.19.1), scipy (version 1.5.2), and various other open-source packages, described in further detail in the relevant sections. All other data were analyzed with Prism 8 (GraphPad) by two-tailed, unpaired Student’s t-test (comparing two experimental groups), one-way analysis of variance (ANOVA) (more than two experimental groups), or Kolmogorov-Smirnov tests (distributions of data) to assess statistical significance, unless otherwise noted. P<0.05 was considered to be statistically significant.
Supplementary Material
Table S1. Tissue information for mouse and human post-mortem samples used in this study, Related to Figure 1.
Details of control (CTRL) and SCA patient cerebellar cortex samples used for each experiment (PMI=post-mortem interval, snRNA-seq=single-nucleus RNA-seq, qRT-PCR=quantitative RT-PCR, WB=western blotting, IHC=immunohistochemistry, n.d.=not determined). Information regarding sample ID, age, genotype, sex, PMI, and number of cells for each mouse and human cerebellar cortex sample sequenced are provided.
Table S2. Expression of transcripts encoding ataxin-1 interactors in different cerebellar cell types, Related to Figure 1.
Expression z-score of transcripts encoding ataxin-1 interactors49 with mouse orthologs across each cell type in the WT mouse cerebellum averaged over time. Order of list corresponds to heatmap of ataxin-1 interactor expression from Figure 1I.
Table S3. Non-imputed differential gene expression between CTRL and SCA1 human post-mortem cerebellum, Related to Figure 1.
Lists of up- and down-regulated genes in each of the 13 human cerebellar cell types (before imputation) organized by sheet. Data were subsampled to control for differential nuclei abundance across different genotypes prior to performing differential gene expression analyses. EMD and log2(fc) were calculated to compare distributions.
Table S4. Non-Imputed differential gene expression between WT and SCA1 KI mouse cerebellum at each timepoint, Related to Figure 1.
Lists of up- and down-regulated genes in each of the 14 mouse cerebellar cell types at each timepoint (before imputation) organized by sheet. Data were subsampled to control for differential nuclei abundance across different genotypes and timepoints prior to performing differential gene expression analyses. EMD and log2(fc) were calculated to compare distributions.
Table S5. Imputed differential gene expression between CTRL and SCA1 human post-mortem cerebellum, Related to Figure 1.
Lists of up- and down-regulated genes in each of the 13 human cerebellar cell types (after imputation within genotype) organized by sheet. Data were subsampled to control for differential nuclei abundance across different genotypes prior to performing differential gene expression analyses. EMD and log2(fc) were calculated to compare distributions and |EMD|≥0.1 and Benjamini-Hochberg adjusted P-value (Pval_corrected<0.01) were used to determine significance.
Table S6. Imputed differential gene expression between WT and SCA1 KI mouse cerebellum at each timepoint, Related to Figure 1.
Lists of up- and down-regulated genes in each of the 14 mouse cerebellar cell types at each timepoint (after imputation within genotype) organized by sheet. Data were subsampled to control for differential nuclei abundance across different genotypes and timepoints prior to performing differential gene expression analyses. EMD and log2(fc) were calculated to compare distributions and |EMD|≥0.1 and Benjamini-Hochberg adjusted P-value (Pval_corrected<0.01) were used to determine significance.
Table S7. Effect of data imputation by MAGIC on 5-week PC enriched pathways, Related to Figure 1.
Lists of enriched ingenuity canonical pathways from lists of all significant DEGs (up and down) calculated from 5-week mouse PCs after varying t (diffusion time) and k (# of neighbors) parameters for imputation with MAGIC. Significant pathways were determined by a cut-off of −log(Benjamini-Hochberg corrected P-value<0.05)>1.3.
Table S8. Differentially expressed genes between different UBC subpopulations in mouse snRNA-seq dataset, Related to Figure 1.
Lists of top 100 enriched genes in each UBC subpopulation (ON, OFF) in the mouse snRNA-seq dataset, ranked by EMD.
Table S9. Gene ontology of differentially expressed genes at each timepoint in SCA1 KI mouse UBCs, Related to Figure 1.
Lists of enriched ingenuity canonical pathways from lists of all DEGs (up and down), up-regulated genes only, or down-regulated genes only at each timepoint in mouse UBCs after subsampling data to control for differential abundance in nuclei between conditions.
Table S10. Gene ontology of differentially expressed genes in SCA1 KI mouse and human post-mortem UBCs, Related to Figure 1.
Lists of enriched PANTHER pathway annotations among significantly down- or up-regulated genes only in mouse or human UBCs, as well as common DEGs between the mouse and human datasets. For the common DEGs, genes without known mouse-human orthologs were excluded.
Table S11. Gene ontology of differentially expressed genes in SCA1 KI mouse PCs, Related to Figure 2.
Lists of enriched ingenuity canonical pathways from lists of all DEGs (up and down), up-regulated genes only, or down-regulated genes only at each timepoint in mouse PCs after subsampling data to control for differential abundance in nuclei between conditions.
Table S12. List oligonucleotides targeting 140 (MERFISH) and 4 (smFISH) transcripts of interest for differential expression analysis of PC-related genes, Related to Figure 2.
Lists of MERFISH and smFISH probe sequences used to detect 140 and 4 unique mRNA species, respectively, in the mouse cerebellum. Differential expression from MERFISH analysis of selected genes in 5-week, 18-week, and 30-week WT and SCA1 KI mouse PCs was calculated.
Table S13. Gene ontology of differentially expressed genes in SCA1 KI mouse and human post-mortem PCs, Related to Figure 2.
Lists of enriched PANTHER pathway annotations among significantly down- or up-regulated genes only in mouse or human PCs, as well as common DEGs between the mouse and human datasets. For the common DEGs, genes without known mouse-human orthologs were excluded.
Table S14. Differentially expressed genes between different PC subpopulations in mouse snRNA-seq dataset, Related to Figure 3.
Lists of top 100 enriched genes in each PC subpopulation (PC0, PC1, PC2, PC3, PC4) in the mouse snRNA-seq dataset, ranked by EMD.
Table S15. Gene ontology of differentially expressed genes in SCA1 OLs, Related to Figure 4.
Lists of enriched GO pathways (biological process) from lists of all DEGs (up and down), up-regulated genes only, or down-regulated genes only at each timepoint in human OLs and OPCs.
Table S16. Expression of top dynamical genes for each cell type in the WT and SCA1 KI mouse cerebellum, Related to Figure 6.
Lists of the top 50 dynamical genes for each genotype within each cell type. Expression differences for each gene were calculated between genotypes (SCA1-WT) for each pseudotime bin. Importance ratings refer to the information gain (improvement in accuracy to the branches that a gene feature is on).
Table S17. Top salient genes for GAT, Related to Figure 6.
List of top 20 salient genes per GAT model for predicting disease status label at each timepoint based on ranking the first GAT layer’s learned weight matrix, transforming input features to their hidden unit representations.
Table S18. Top important genes based on local interpretability from Integrated Gradients analysis, Related to Figure 6.
List of top 50 most important genes the Integrated Gradients analysis with a SmoothGrad noise tunnel for each representative cell type and timepoint, based on average expression in each subset.
KEY RESOURCES TABLE
| REAGENT or RESOURCE | SOURCE | IDENTIFIER |
|---|---|---|
| Antibodies | ||
| chicken anti-vGlut1 | Synaptic Systems | Cat# 135316 |
| rabbit anti-PSD-95 | Abcam | Cat# ab238135 |
| guinea pig anti-vGlut2 | Synaptic Systems | Cat# 135404 |
| rabbit anti-Pcdh9 | Proteintech | Cat# 25090–1-AP |
| rabbit anti-Caspr2 | ThermoFisher | Cat# MA5–37891 |
| mouse anti-Nlgn1 | Proteintech | Cat# 66964–1-lg |
| rabbit anti-Grid2 | Abcam | Cat# ab198499 |
| rabbit anti-Itpr1 | Invitrogen | Cat# PA1–901 |
| rabbit anti-Prkg1 | MyBioSource | Cat# MBS1493952 |
| rabbit anti-Rgs8 | Novus Biologicals | Cat# NBP2–20153 |
| mouse anti-Calbindin-D-28K | Sigma-Aldrich | Cat# C9848 |
| mouse anti-CNPase | Abcam | Cat# ab6319 |
| rabbit anti-MOBP | Bioss | Cat# bs-11184R |
| rabbit anti-Plp1 | Abcam | Cat# ab28486 |
| mouse anti-MBP | Abcam | Cat# ab62631 |
| mouse anti-MOG | Millipore | Cat# MAB5680 |
| mouse anti-Vinculin | Sigma-Aldrich | Cat# V9264 |
| rabbit anti-transferrin | Abcam | Cat# ab82411 |
| mouse anti β-Actin | Sigma | Cat# A5316 |
| mouse anti-MBP | Biolegend | Cat# SMI-99P |
| rabbit anti-opalin | Abcam | Cat# ab121425 |
| chicken anti-GFP | Abcam | Cat# ab13970 |
| rabbit anti-Olig2 | Abcam | Cat# ab109186 |
| chicken anti-Tbr2 | Millipore | Cat# AB15894 |
| rabbit anti-Trpc3 | Cell Signaling | Cat# 77934 |
| mouse anti-calretinin | Millipore | Cat# MAB1568 |
| rabbit anti-PMCA1 | Abcam | Cat# ab3528 |
| goat anti-chicken IgY, Alexa Fluor 647 | ThermoFisher | Cat# A32932 |
| goat anti-rabbit IgG, Alexa Fluor 488 | ThermoFisher | Cat# A32931 |
| goat anti-mouse IgG, Alexa Fluor 555 | ThermoFisher | Cat# A32728 |
| goat anti-mouse IgG, Alexa Fluor 488 | ThermoFisher | Cat# A11001 |
| goat anti-guinea pig IgG, Alexa Fluor 488 | ThermoFisher | Cat# A11073 |
| goat anti-chicken IgY, Alexa Fluor 488 | Abcam | Cat# 150169 |
| goat anti-rabbit IgG, Alexa Fluor 568 | ThermoFisher | Cat# A-11011 |
| sheep anti-mouse IgG HRP-conjugated | GE Healthcare | Cat# NXA931–1ML |
| donkey anti-rabbit IgG HRP-conjugated | GE Healthcare | Cat# NA934–1ML |
| goat anti-mouse IgG, biotinylated | Vector Laboratories | Cat# BA-9200 |
| goat anti-rabbit IgG, biotinylated | Vector Laboratories | Cat# BA-1000 |
| Biological Samples | ||
| Six healthy human control cerebellar samples (fixed) | New York Brain Bank (Alzheimer’s Disease Research Center or Washington Heights Inwood Columbia Aging Project @ Columbia University) | (http://www.newyorkbrainbank.org/) |
| Four healthy human control cerebellar samples (fixed) | National Institutes of Health NeuroBioBank (University of Miami) | (https://neurobiobank.nih.gov/) |
| Ten human SCA1 cerebellar samples (fixed) | Hereditary ataxia specimen repository (Veterans Affairs Medical Center; Albany, New York; courtesy of Dr. A.H. Koeppen) | (https://www.albany.va.gov/) |
| Ten healthy human control cerebellar samples (frozen) | Michigan Brain Bank (courtesy of Dr. Vikram Shakkottai and Dr. Hayley McLoughlin); New York Brain Bank (courtesy of Dr. Phyllis Faust) | (http://www.brainbank.umich.edu/) |
| Ten human SCA1 cerebellar samples (frozen) | The Center for NeuroGenetics (Florida; courtesy of Dr. Laura Ranum); NIH-Maryland (courtesy of Dr. Phyllis Faust); Dr. Huda Zoghbi | (https://neurogenetics.med.ufl.edu/) |
| Three human SCA3 cerebellar samples (frozen) | Michigan Brain Bank (courtesy of Dr. Vikram Shakkottai) | (http://www.brainbank.umich.edu/) |
| Two human SCA3 cerebellar samples (frozen) | The Center for NeuroGenetics (Florida; courtesy of Dr. Laura Ranum) | (https://neurogenetics.med.ufl.edu/) |
| One human SCA6 cerebellar sample (frozen) | Michigan Brain Bank (courtesy of Dr. Vikram Shakkottai) | (http://www.brainbank.umich.edu/) |
| Chemicals, Peptides, and Recombinant Proteins | ||
| Recombinant ribonuclease (RNase) inhibitor | Clontech/Takara | Cat# 2313B |
| PhosSTOP phosphatase inhibitor | Roche | Cat# 4906837001 |
| cOmplete ULTRA mini protease inhibitor | Roche | Cat# 5892791001 |
| SuperSignal West Pico Plus chemiluminescent substrate | Pierce | Cat# 34580 |
| O.C.T. Compound | Sakura | Cat# 4583 |
| Critical Commercial Assays | ||
| Nuclei Isolation Kit: Nuclei EZ Prep | Sigma-Aldrich | Cat# NUC101–1KT |
| Chromium Single Cell 3’ Reagent Kit v.3 | 10x Genomics | Cat# PN-1000075 |
| Chromium Single Cell 3’ Reagent Kit v.3.1 | 10x Genomics | Cat# PN-1000121 |
| Pierce™ BCA Protein Assay Kit | Thermo Scientific | Cat# 23225 |
| RNeasy Plus Mini Kit | Qiagen | Cat# 74136 |
| iScript Reverse Transcription Kit | Bio-Rad | Cat# 1708841 |
| iTaq Universal Probes Supermix | Bio-Rad | Cat# 1725135 |
| Deposited Data | ||
| Raw and analyzed data | This paper | GEO: xxxxxx |
| Experimental Models: Organisms/Strains | ||
| Mouse: Atxn1154Q/+ (SCA1 knock-in) | Laboratory of Dr. Huda Zoghbi (Watase et al., Neuron 2002) | The Jackson Laboratory (#005601) |
| Mouse: Pcp2-ATXN1[82Q]/+ (SCA1 B05) | Laboratory of Dr. Harry Orr (Burright et al., Cell 1995) | N/A |
| Mouse: PLP-EGFP/+ | (Mallon et al., Journal of Neuroscience, 2002) | The Jackson Laboratory (#033357) |
| Oligonucleotides | ||
| Genotyping Atxn1154Q/+ mouse For- ACCTTCCAGTTCATTGGGTC Rev- GCTCTGTGGAGAGCTGGA |
Sigma-Aldrich | N/A |
| Genotyping Pcp2-ATXN1[82Q]/+ mouse For- CAACATGGGCAGTCTGAG Rev- CTGGAAATGTGGACGTAC |
Sigma-Aldrich | N/A |
| CNP (Hs00263981_m1) | Thermo Fisher | Cat# 4331182 |
| MOBP (Hs00197813_m1) | Thermo Fisher | Cat# 4331182 |
| PLP1 (Hs00166914_m1) | Thermo Fisher | Cat# 4331182 |
| MBP (Hs00921945_m1) | Thermo Fisher | Cat# 4331182 |
| MOG (Hs01555268_m1) | Thermo Fisher | Cat# 4331182 |
| ACTB (Hs01060665_g1) | Thermo Fisher | Cat# 4331182 |
| GAPDH (Hs_02758991_g1) | Thermo Fisher | Cat# 4331182 |
| HPRT1 (Hs02800695_m1) | Thermo Fisher | Cat# 4331182 |
| Cspg4 (Mm005072569_m1) | Thermo Fisher | Cat# 4331182 |
| Pdgfra (Mm00440701_m1) | Thermo Fisher | Cat# 4331182 |
| Myrf (Mm0119495_m1) | Thermo Fisher | Cat# 4331182 |
| Mbp (Mm01266402_m1) | Thermo Fisher | Cat# 4331182 |
| Plp1 (Mm01297210_m1) | Thermo Fisher | Cat# 4331182 |
| Hprt (Mm03024075_m1) | Thermo Fisher | Cat# 4331182 |
| Actb | Applied Biosystems | Cat# 4352933E |
| Software and Algorithms | ||
| cellranger (version 6.1.2, mouse; version 7.0.0, human) | 10x Genomics | (https://support.10xgenomics.com/single-cell-geneexpression/software/overview/welcome) |
| Python (version 3.8.2) | Python Software Foundation | (https://www.python.org/downloads/) |
| MATLAB (version R2020b) | MathWorks | (https://www.mathworks.com/products/new_products/release2020b.html) |
| SCANPY (version 1.6.0) | Wolf et al., 2018 | (https://github.com/theislab/scanpy) |
| BBKNN | Polanski et al., 2019 | (https://github.com/theislab/scanpy/tree/master/scanpy/external) |
| MAGIC (version 2.0.3) | van Dijk et al., 2018 | (https://github.com/KrishnaswamyLab/MAGIC) |
| PHATE (version 1.0.4) | Moon et al., 2019 | (https://github.com/KrishnaswamyLab/PHATE) |
| pandas (version 1.1.2) | McKinney et al., 2010 | (https://github.com/pandas-dev/pandas) |
| NumPy (version 1.19.1) | van der Walt et al., 2011 | (https://github.com/numpy/numpy) |
| SciPy (version 1.5.2) | Virtanen et al., 2020 | (https://github.com/scipy/scipy) |
| Scikit-learn (version 0.23.2) | Pedregosa et al., 2011 | (https://github.com/scikit-learn/scikit-learn) |
| PyTorch (version 1.6.0) | Paszke et al., 2019 | (https://github.com/pytorch/pytorch) |
| Captum (version 0.2.0) | Kokhlikyan et al., 2020 | (https://github.com/pytorch/captum) |
| PyTorch Geometric (version 1.6.1) | Fey et al., 2019 | (https://github.com/rusty1s/pytorch_geometric) |
| statsmodels (version 0.11.1) | Seabold et al., 2010 | (https://github.com/statsmodels/statsmodels) |
| XGBoost (version 1.2.0) | Chen et al., 2016 | (https://github.com/dmlc/xgboost/tree/master/python-package) |
| Hyperopt (version 0.2.4) | Bergstra et al., 2015 | (https://github.com/hyperopt/hyperopt) |
| MELD (version 0.3.2) | Burkhardt et al., 2021 | (https://github.com/KrishnaswamyLab/MELD) |
| seaborn (version 0.11.0) | Waskam et al., 2020 | (https://github.com/mwaskom/seaborn) |
| CellProfiler (version 3.0) | McQuin et al., 2018 | (https://github.com/carpenterlab/2018_mcquin_PLOSBio) |
| Ingenuity Pathway Analysis (version 01—16) | Qiagen | (https://www.qiagenbioinformatics.com/products/ingenuitypathway-analysis) |
| ProbeDealer | Hu et al., 2020 | (https://www.nature.com/articles/s41598-020-76439-x) |
| NucleotideBLAST | NIH | (https://blast.ncbi.nlm.nih.gov/Blast.cgi) |
| ImageStudio Lite (version 5.2.5) | Li-Cor | (https://www.licor.com/bio/image-studio-lite/) |
| iTEM imaging software | Olympus | (https://www.olympus-sis.com/) |
| Bio-Rad CFX Manager | Bio-Rad | N/A |
| Fiji (version 2.0.0) | NIH | (https://imagej.net/Fiji) |
| ImageJ (version 1.53b) | NIH | (https://imagej.nih.gov/ij/) |
| Aperio ImageScope software (version 12.4.0) | Leica | (https://www.leicabiosystems.com/digital-pathology/manage/aperio-imagescope/) |
| StereoInvestigator Software | MicroBrightfield | (https://www.mbfbioscience.com/stereo-investigator) |
| Prism 8 | GraphPad Software | (https://www.graphpad.com/scientificsoftware/prism/) |
| graphtools (version 1.5.2) | N/A | (https://github.com/KrishnaswamyLab/graphtools) |
| Imaris (version 10.0.1) | Oxford Instruments | (https://imaris.oxinst.com/) |
Highlights:
Over 500,000 single-nucleus transcriptomes from the control and SCA1 cerebellum
Multimodal analysis of SCA1-associated changes in Purkinje cell subpopulations
Unipolar brush cell and oligodendroglial impairments emerge at early disease stages
Continuous trajectories that capture dynamics of all cerebellar cell types
ACKNOWLEDGMENTS
We thank Dr. Thomas Biederer and all members of the Lim and van Dijk laboratories for useful feedback, critiques, and comments. We are grateful to Matthew Perkins (University of Michigan Brain Bank), Dr. Arnulf H. Koeppen (Veterans Affairs Medical Center, Albany, New York, USA), the New York Brain Bank (Columbia University, New York, New York, USA), and the National Institutes of Health Neuro-BioBank (University of Miami Brain Endowment Bank, Miami, FL, USA) for post-mortem materials and would like to thank all the patients and families that contributed to brain donation. We would also like to thank Dr. Guilin Wang (Yale Center for Genome Analysis) for assistance with snRNA-seq and Dr. Xinran Liu (Yale Center for Cellular and Molecular Imaging) for assistance with electron microscopy. The University of Michigan Brain Bank is supported by the NIH (P01 AG053760). This work was supported by National Institutes of Health grants NS083706 (J.L.), NS088321 (J.L.), MH119803 (J.L.), AG066447 (J.L.), AG074609 (J.L.), AG076154 (J.L.), T32 NS041228 (L.T., K.L.), T32 NS007224 (L.T.), NS085054 (V.G.S), HG011245 (S.W.), the Lo Graduate Fellowship for Excellence in Stem Cell Research (L.T.), the Gruber Science Fellowship (L.T.), the National Ataxia Foundation Graduate Research Fellowship (C.L.), the China Scholarship Council (CSC) grants (Y.C.), the UCSF Medical School Summer Explore Research Fellowship (B.N.), and the Yale College First-Year Fellowship in the Sciences & Engineering (J.Y., H.R.).
INCLUSION AND DIVERSITY
One or more of the authors of this paper self-identifies as a member of the LGBTQ+ community. While citing references scientifically relevant for this work, we also actively worked to promote gender balance in our reference list.
Footnotes
Publisher's Disclaimer: This is a PDF file of an unedited manuscript that has been accepted for publication. As a service to our customers we are providing this early version of the manuscript. The manuscript will undergo copyediting, typesetting, and review of the resulting proof before it is published in its final form. Please note that during the production process errors may be discovered which could affect the content, and all legal disclaimers that apply to the journal pertain.
DECLARATION OF INTERESTS
S.W. is an inventor on a patent applied for by Harvard University related to MERFISH, and a consultant and shareholder of Translura, Inc. The other authors declare no competing interests.
REFERENCES
- 1.Orr HT, Chung MY, Banfi S, Kwiatkowski TJ Jr., Servadio A, Beaudet AL, McCall AE, Duvick LA, Ranum LP, and Zoghbi HY (1993). Expansion of an unstable trinucleotide CAG repeat in spinocerebellar ataxia type 1. Nat Genet 4, 221–226. 10.1038/ng0793-221. [DOI] [PubMed] [Google Scholar]
- 2.Servadio A, Koshy B, Armstrong D, Antalffy B, Orr HT, and Zoghbi HY (1995). Expression analysis of the ataxin-1 protein in tissues from normal and spinocerebellar ataxia type 1 individuals. Nat Genet 10, 94–98. 10.1038/ng0595-94. [DOI] [PubMed] [Google Scholar]
- 3.Koeppen AH (2005). The pathogenesis of spinocerebellar ataxia. Cerebellum 4, 62–73. 10.1080/14734220510007950. [DOI] [PubMed] [Google Scholar]
- 4.Watase K, Weeber EJ, Xu B, Antalffy B, Yuva-Paylor L, Hashimoto K, Kano M, Atkinson R, Sun Y, Armstrong DL, et al. (2002). A Long CAG Repeat in the Mouse Sca1 Locus Replicates SCA1 Features and Reveals the Impact of Protein Solubility on Selective Neurodegeneration. Neuron 34, 905–919. 10.1016/s0896-6273(02)00733-x. [DOI] [PubMed] [Google Scholar]
- 5.Edamakanti CR, Do J, Didonna A, Martina M, and Opal P (2018). Mutant ataxin1 disrupts cerebellar development in spinocerebellar ataxia type 1. Journal of Clinical Investigation 128, 2252–2265. 10.1172/jci96765. [DOI] [PMC free article] [PubMed] [Google Scholar]
- 6.Kim JH, Lukowicz A, Qu W, Johnson A, and Cvetanovic M (2018). Astroglia contribute to the pathogenesis of spinocerebellar ataxia Type 1 (SCA1) in a biphasic, stage-of-disease specific manner. Glia 66, 1972–1987. 10.1002/glia.23451. [DOI] [PMC free article] [PubMed] [Google Scholar]
- 7.Cvetanovic M, Ingram M, Orr H, and Opal P (2015). Early activation of microglia and astrocytes in mouse models of spinocerebellar ataxia type 1. Neuroscience 289, 289–299. 10.1016/j.neuroscience.2015.01.003. [DOI] [PMC free article] [PubMed] [Google Scholar]
- 8.Luttik K, Tejwani L, Ju H, Driessen T, Smeets C, Edamakanti CR, Khan A, Yun J, Opal P, and Lim J (2022). Differential effects of Wnt-beta-catenin signaling in Purkinje cells and Bergmann glia in spinocerebellar ataxia type 1. Proc Natl Acad Sci U S A 119, e2208513119. 10.1073/pnas.2208513119. [DOI] [PMC free article] [PubMed] [Google Scholar]
- 9.Macosko EZ, Basu A, Satija R, Nemesh J, Shekhar K, Goldman M, Tirosh I, Bialas AR, Kamitaki N, Martersteck EM, et al. (2015). Highly Parallel Genome-wide Expression Profiling of Individual Cells Using Nanoliter Droplets. Cell 161, 1202–1214. 10.1016/j.cell.2015.05.002. [DOI] [PMC free article] [PubMed] [Google Scholar]
- 10.Habib N, Avraham-Davidi I, Basu A, Burks T, Shekhar K, Hofree M, Choudhury SR, Aguet F, Gelfand E, Ardlie K, et al. (2017). Massively parallel single-nucleus RNA-seq with DroNc-seq. Nat Methods 14, 955–958. 10.1038/nmeth.4407. [DOI] [PMC free article] [PubMed] [Google Scholar]
- 11.Grubman A, Chew G, Ouyang JF, Sun G, Choo XY, McLean C, Simmons RK, Buckberry S, Vargas-Landin DB, Poppe D, et al. (2019). A single-cell atlas of entorhinal cortex from individuals with Alzheimer’s disease reveals cell-type-specific gene expression regulation. Nat Neurosci 22, 2087–2097. 10.1038/s41593-019-0539-4. [DOI] [PubMed] [Google Scholar]
- 12.Jakel S, Agirre E, Mendanha Falcao A, van Bruggen D, Lee KW, Knuesel I, Malhotra D, Ffrench-Constant C, Williams A, and Castelo-Branco G (2019). Altered human oligodendrocyte heterogeneity in multiple sclerosis. Nature 566, 543–547. 10.1038/s41586-019-0903-2. [DOI] [PMC free article] [PubMed] [Google Scholar]
- 13.Mathys H, Davila-Velderrain J, Peng Z, Gao F, Mohammadi S, Young JZ, Menon M, He L, Abdurrob F, Jiang X, et al. (2019). Single-cell transcriptomic analysis of Alzheimer’s disease. Nature 570, 332–337. 10.1038/s41586-019-1195-2. [DOI] [PMC free article] [PubMed] [Google Scholar]
- 14.Schirmer L, Velmeshev D, Holmqvist S, Kaufmann M, Werneburg S, Jung D, Vistnes S, Stockley JH, Young A, Steindel M, et al. (2019). Neuronal vulnerability and multilineage diversity in multiple sclerosis. Nature 573, 75–82. 10.1038/s41586-019-1404-z. [DOI] [PMC free article] [PubMed] [Google Scholar]
- 15.Zhou Y, Song WM, Andhey PS, Swain A, Levy T, Miller KR, Poliani PL, Cominelli M, Grover S, Gilfillan S, et al. (2020). Human and mouse single-nucleus transcriptomics reveal TREM2-dependent and TREM2-independent cellular responses in Alzheimer’s disease. Nat Med 26, 131–142. 10.1038/s41591-019-0695-9. [DOI] [PMC free article] [PubMed] [Google Scholar]
- 16.Al-Dalahmah O, Sosunov AA, Shaik A, Ofori K, Liu Y, Vonsattel JP, Adorjan I, Menon V, and Goldman JE (2020). Single-nucleus RNA-seq identifies Huntington disease astrocyte states. Acta Neuropathol Commun 8, 19. 10.1186/s40478-020-0880-6. [DOI] [PMC free article] [PubMed] [Google Scholar]
- 17.Lee H, Fenster RJ, Pineda SS, Gibbs WS, Mohammadi S, Davila-Velderrain J, Garcia FJ, Therrien M, Novis HS, Gao F, et al. (2020). Cell Type-Specific Transcriptomics Reveals that Mutant Huntingtin Leads to Mitochondrial RNA Release and Neuronal Innate Immune Activation. Neuron. 10.1016/j.neuron.2020.06.021. [DOI] [PMC free article] [PubMed] [Google Scholar]
- 18.Masuda T, Sankowski R, Staszewski O, Bottcher C, Amann L, Sagar, Scheiwe C, Nessler S, Kunz P, van Loo G, et al. (2019). Spatial and temporal heterogeneity of mouse and human microglia at single-cell resolution. Nature 566, 388–392. 10.1038/s41586-019-0924-x. [DOI] [PubMed] [Google Scholar]
- 19.Morabito S, Miyoshi E, Michael N, Shahin S, Martini AC, Head E, Silva J, Leavy K, Perez-Rosendahl M, and Swarup V (2021). Single-nucleus chromatin accessibility and transcriptomic characterization of Alzheimer’s disease. Nat Genet 53, 1143–1155. 10.1038/s41588-021-00894-z. [DOI] [PMC free article] [PubMed] [Google Scholar]
- 20.Gerrits E, Giannini LAA, Brouwer N, Melhem S, Seilhean D, Le Ber I, Kamermans A, Kooij G, de Vries HE, Boddeke EWGM, et al. (2022). Neurovascular dysfunction in GRN-associated frontotemporal dementia identified by single-nucleus RNA sequencing of human cerebral cortex. Nature Neuroscience. 10.1038/s41593-022-01124-3. [DOI] [PubMed] [Google Scholar]
- 21.Sadick JS, O’Dea MR, Hasel P, Dykstra T, Faustin A, and Liddelow SA (2022). Astrocytes and oligodendrocytes undergo subtype-specific transcriptional changes in Alzheimer’s disease. Neuron 110, 1788–1805 e1710. 10.1016/j.neuron.2022.03.008. [DOI] [PMC free article] [PubMed] [Google Scholar]
- 22.Absinta M, Maric D, Gharagozloo M, Garton T, Smith MD, Jin J, Fitzgerald KC, Song A, Liu P, Lin JP, et al. (2021). A lymphocyte-microglia-astrocyte axis in chronic active multiple sclerosis. Nature 597, 709–714. 10.1038/s41586-021-03892-7. [DOI] [PMC free article] [PubMed] [Google Scholar]
- 23.Jafar-Nejad P, Ward CS, Richman R, Orr HT, and Zoghbi HY (2011). Regional rescue of spinocerebellar ataxia type 1 phenotypes by 14-3-3epsilon haploinsufficiency in mice underscores complex pathogenicity in neurodegeneration. Proc Natl Acad Sci U S A 108, 2142–2147. 10.1073/pnas.1018748108. [DOI] [PMC free article] [PubMed] [Google Scholar]
- 24.Kozareva V, Martin C, Osorno T, Rudolph S, Guo C, Vanderburg C, Nadaf N, Regev A, Regehr WG, and Macosko E (2021). A transcriptomic atlas of mouse cerebellar cortex comprehensively defines cell types. Nature 598, 214–219. 10.1038/s41586-021-03220-z. [DOI] [PMC free article] [PubMed] [Google Scholar]
- 25.Zoghbi HY, and Orr HT (2009). Pathogenic mechanisms of a polyglutamine-mediated neurodegenerative disease, spinocerebellar ataxia type 1. J Biol Chem 284, 7425–7429. 10.1074/jbc.R800041200. [DOI] [PMC free article] [PubMed] [Google Scholar]
- 26.Lam YC, Bowman AB, Jafar-Nejad P, Lim J, Richman R, Fryer JD, Hyun ED, Duvick LA, Orr HT, Botas J, and Zoghbi HY (2006). ATAXIN-1 interacts with the repressor Capicua in its native complex to cause SCA1 neuropathology. Cell 127, 1335–1347. 10.1016/j.cell.2006.11.038. [DOI] [PubMed] [Google Scholar]
- 27.Lim J, Crespo-Barreto J, Jafar-Nejad P, Bowman AB, Richman R, Hill DE, Orr HT, and Zoghbi HY (2008). Opposing effects of polyglutamine expansion on native protein complexes contribute to SCA1. Nature 452, 713–718. 10.1038/nature06731. [DOI] [PMC free article] [PubMed] [Google Scholar]
- 28.Tejwani L, and Lim J (2020). Pathogenic mechanisms underlying spinocerebellar ataxia type 1. Cell Mol Life Sci. 10.1007/s00018-020-03520-z. [DOI] [PMC free article] [PubMed] [Google Scholar]
- 29.Ju H, Kokubu H, and Lim J (2014). Beyond the glutamine expansion: influence of posttranslational modifications of ataxin-1 in the pathogenesis of spinocerebellar ataxia type 1. Mol Neurobiol 50, 866–874. 10.1007/s12035-014-8703-z. [DOI] [PMC free article] [PubMed] [Google Scholar]
- 30.Chen H-K, Fernandez-Funez P, Acevedo SF, Lam YC, Kaytor MD, Fernandez MH, Aitken A, Skoulakis EMC, Orr HT, Botas J, and Zoghbi HY (2003). Interaction of Akt-Phosphorylated Ataxin-1 with 14-3-3 Mediates Neurodegeneration in Spinocerebellar Ataxia Type 1. Cell 113, 457–468. 10.1016/s0092-8674(03)00349-0. [DOI] [PubMed] [Google Scholar]
- 31.Bolger TA, Zhao X, Cohen TJ, Tsai CC, and Yao TP (2007). The neurodegenerative disease protein ataxin-1 antagonizes the neuronal survival function of myocyte enhancer factor-2. J Biol Chem 282, 29186–29192. 10.1074/jbc.M704182200. [DOI] [PubMed] [Google Scholar]
- 32.de Chiara C, Menon RP, Strom M, Gibson TJ, and Pastore A (2009). Phosphorylation of S776 and 14-3-3 binding modulate ataxin-1 interaction with splicing factors. PLoS One 4, e8372. 10.1371/journal.pone.0008372. [DOI] [PMC free article] [PubMed] [Google Scholar]
- 33.Rousseaux MWC, Tschumperlin T, Lu HC, Lackey EP, Bondar VV, Wan YW, Tan Q, Adamski CJ, Friedrich J, Twaroski K, et al. (2018). ATXN1-CIC Complex Is the Primary Driver of Cerebellar Pathology in Spinocerebellar Ataxia Type 1 through a Gain-of-Function Mechanism. Neuron 97, 1235–1243 e1235. 10.1016/j.neuron.2018.02.013. [DOI] [PMC free article] [PubMed] [Google Scholar]
- 34.Gehrking KM, Andresen JM, Duvick L, Lough J, Zoghbi HY, and Orr HT (2011). Partial loss of Tip60 slows mid-stage neurodegeneration in a spinocerebellar ataxia type 1 (SCA1) mouse model. Hum Mol Genet 20, 2204–2212. 10.1093/hmg/ddr108. [DOI] [PMC free article] [PubMed] [Google Scholar]
- 35.Serra HG, Duvick L, Zu T, Carlson K, Stevens S, Jorgensen N, Lysholm A, Burright E, Zoghbi HY, Clark HB, et al. (2006). RORalpha-mediated Purkinje cell development determines disease severity in adult SCA1 mice. Cell 127, 697–708. 10.1016/j.cell.2006.09.036. [DOI] [PubMed] [Google Scholar]
- 36.Tsuda H, Jafar-Nejad H, Patel AJ, Sun Y, Chen HK, Rose MF, Venken KJ, Botas J, Orr HT, Bellen HJ, and Zoghbi HY (2005). The AXH domain of Ataxin-1 mediates neurodegeneration through its interaction with Gfi-1/Senseless proteins. Cell 122, 633–644. 10.1016/j.cell.2005.06.012. [DOI] [PubMed] [Google Scholar]
- 37.Tsai CC, Kao HY, Mitzutani A, Banayo E, Rajan H, McKeown M, and Evans RM (2004). Ataxin 1, a SCA1 neurodegenerative disorder protein, is functionally linked to the silencing mediator of retinoid and thyroid hormone receptors. Proc Natl Acad Sci U S A 101, 4047–4052. 10.1073/pnas.0400615101. [DOI] [PMC free article] [PubMed] [Google Scholar]
- 38.Goold R, Hubank M, Hunt A, Holton J, Menon RP, Revesz T, Pandolfo M, and Matilla-Duenas A (2007). Down-regulation of the dopamine receptor D2 in mice lacking ataxin 1. Hum Mol Genet 16, 2122–2134. 10.1093/hmg/ddm162. [DOI] [PubMed] [Google Scholar]
- 39.Lai S, O’Callaghan B, Zoghbi HY, and Orr HT (2011). 14-3-3 Binding to ataxin-1(ATXN1) regulates its dephosphorylation at Ser-776 and transport to the nucleus. J Biol Chem 286, 34606–34616. 10.1074/jbc.M111.238527. [DOI] [PMC free article] [PubMed] [Google Scholar]
- 40.Ju H, Kokubu H, Todd TW, Kahle JJ, Kim S, Richman R, Chirala K, Orr HT, Zoghbi HY, and Lim J (2013). Polyglutamine disease toxicity is regulated by Nemo-like kinase in spinocerebellar ataxia type 1. J Neurosci 33, 9328–9336. 10.1523/JNEUROSCI.3465-12.2013. [DOI] [PMC free article] [PubMed] [Google Scholar]
- 41.Jorgensen ND, Andresen JM, Lagalwar S, Armstrong B, Stevens S, Byam CE, Duvick LA, Lai S, Jafar-Nejad P, Zoghbi HY, et al. (2009). Phosphorylation of ATXN1 at Ser776 in the cerebellum. J Neurochem 110, 675–686. 10.1111/j.1471-4159.2009.06164.x. [DOI] [PMC free article] [PubMed] [Google Scholar]
- 42.Park J, Al-Ramahi I, Tan Q, Mollema N, Diaz-Garcia JR, Gallego-Flores T, Lu HC, Lagalwar S, Duvick L, Kang H, et al. (2013). RAS-MAPK-MSK1 pathway modulates ataxin 1 protein levels and toxicity in SCA1. Nature 498, 325–331. 10.1038/nature12204. [DOI] [PMC free article] [PubMed] [Google Scholar]
- 43.Bondar VV, Adamski CJ, Onur TS, Tan Q, Wang L, Diaz-Garcia J, Park J, Orr HT, Botas J, and Zoghbi HY (2018). PAK1 regulates ATXN1 levels providing an opportunity to modify its toxicity in spinocerebellar ataxia type 1. Hum Mol Genet 27, 2863–2873. 10.1093/hmg/ddy200. [DOI] [PMC free article] [PubMed] [Google Scholar]
- 44.Matilla A, Koshy BT, Cummings CJ, Isobe T, Orr HT, and Zoghbi HY (1997). The cerebellar leucine-rich acidic nuclear protein interacts with ataxin-1. Nature 389, 974–978. 10.1038/40159. [DOI] [PubMed] [Google Scholar]
- 45.Cvetanovic M, Kular RK, and Opal P (2012). LANP mediates neuritic pathology in Spinocerebellar ataxia type 1. Neurobiol Dis 48, 526–532. 10.1016/j.nbd.2012.07.024. [DOI] [PMC free article] [PubMed] [Google Scholar]
- 46.Lee S, Hong S, and Kang S (2008). The ubiquitin-conjugating enzyme UbcH6 regulates the transcriptional repression activity of the SCA1 gene product ataxin-1. Biochem Biophys Res Commun 372, 735–740. 10.1016/j.bbrc.2008.05.125. [DOI] [PubMed] [Google Scholar]
- 47.Davidson JD, Riley B, Burright EN, Duvick LA, Zoghbi HY, and Orr HT (2000). Identification and characterization of an ataxin-1-interacting protein: A1Up, a ubiquitin-like nuclear protein. Hum Mol Genet 9, 2305–2312. 10.1093/oxfordjournals.hmg.a018922. [DOI] [PubMed] [Google Scholar]
- 48.Hong S, Kim SJ, Ka S, Choi I, and Kang S (2002). USP7, a ubiquitin-specific protease, interacts with ataxin-1, the SCA1 gene product. Mol Cell Neurosci 20, 298–306. 10.1006/mcne.2002.1103. [DOI] [PubMed] [Google Scholar]
- 49.Lim J, Hao T, Shaw C, Patel AJ, Szabo G, Rual JF, Fisk CJ, Li N, Smolyar A, Hill DE, et al. (2006). A protein-protein interaction network for human inherited ataxias and disorders of Purkinje cell degeneration. Cell 125, 801–814. 10.1016/j.cell.2006.03.032. [DOI] [PubMed] [Google Scholar]
- 50.Nabavi S, Schmolze D, Maitituoheti M, Malladi S, and Beck AH (2016). EMDomics: a robust and powerful method for the identification of genes differentially expressed between heterogeneous classes. Bioinformatics 32, 533–541. 10.1093/bioinformatics/btv634. [DOI] [PMC free article] [PubMed] [Google Scholar]
- 51.Mugnaini E, Dino MR, and Jaarsma D (1997). The unipolar brush cells of the mammalian cerebellum and cochlear nucleus: cytology and microcircuitry. Prog Brain Res 114, 131–150. 10.1016/s0079-6123(08)63362-2. [DOI] [PubMed] [Google Scholar]
- 52.Martins CR Junior, Martinez ARM, Vasconcelos IF, de Rezende TJR, Casseb RF, Pedroso JL, Barsottini OGP, Lopes-Cendes I, and Franca MC Jr. (2018). Structural signature in SCA1: clinical correlates, determinants and natural history. J Neurol 265, 2949–2959. 10.1007/s00415-018-9087-1. [DOI] [PubMed] [Google Scholar]
- 53.Jacobi H, Reetz K, du Montcel ST, Bauer P, Mariotti C, Nanetti L, Rakowicz M, Sulek A, Durr A, Charles P, et al. (2013). Biological and clinical characteristics of individuals at risk for spinocerebellar ataxia types 1, 2, 3, and 6 in the longitudinal RISCA study: analysis of baseline data. The Lancet Neurology 12, 650–658. 10.1016/s1474-4422(13)70104-2. [DOI] [PubMed] [Google Scholar]
- 54.Nunzi MG, Birnstiel S, Bhattacharyya BJ, Slater NT, and Mugnaini E (2001). Unipolar brush cells form a glutamatergic projection system within the mouse cerebellar cortex. J Comp Neurol 434, 329–341. 10.1002/cne.1180. [DOI] [PubMed] [Google Scholar]
- 55.Diño MR, Schuerger RJ, Liu YB, Slater NT, and Mugnaini E (2000). Unipolar brush cell: a potential feedforward excitatory interneuron of the cerebellum. Neuroscience 98, 625–636. 10.1016/s0306-4522(00)00123-8. [DOI] [PubMed] [Google Scholar]
- 56.van Dorp S, and De Zeeuw CI (2014). Variable timing of synaptic transmission in cerebellar unipolar brush cells. Proc Natl Acad Sci U S A 111, 5403–5408. 10.1073/pnas.1314219111. [DOI] [PMC free article] [PubMed] [Google Scholar]
- 57.Borges-Merjane C, and Trussell LO (2015). ON and OFF unipolar brush cells transform multisensory inputs to the auditory system. Neuron 85, 1029–1042. 10.1016/j.neuron.2015.02.009. [DOI] [PMC free article] [PubMed] [Google Scholar]
- 58.Nunzi MG, Shigemoto R, and Mugnaini E (2002). Differential expression of calretinin and metabotropic glutamate receptor mGluR1alpha defines subsets of unipolar brush cells in mouse cerebellum. J Comp Neurol 451, 189–199. 10.1002/cne.10344. [DOI] [PubMed] [Google Scholar]
- 59.Sekerková G, Kim JA, Nigro MJ, Becker EB, Hartmann J, Birnbaumer L, Mugnaini E, and Martina M (2013). Early onset of ataxia in moonwalker mice is accompanied by complete ablation of type II unipolar brush cells and Purkinje cell dysfunction. J Neurosci 33, 19689–19694. 10.1523/JNEUROSCI.2294-13.2013. [DOI] [PMC free article] [PubMed] [Google Scholar]
- 60.Sekerková G, Watanabe M, Martina M, and Mugnaini E (2014). Differential distribution of phospholipase C beta isoforms and diaglycerol kinase-beta in rodents cerebella corroborates the division of unipolar brush cells into two major subtypes. Brain Struct Funct 219, 719–749. 10.1007/s00429-013-0531-9. [DOI] [PMC free article] [PubMed] [Google Scholar]
- 61.Guo C, Huson V, Macosko EZ, and Regehr WG (2021). Graded heterogeneity of metabotropic signaling underlies a continuum of cell-intrinsic temporal responses in unipolar brush cells. Nat Commun 12, 5491. 10.1038/s41467-021-22893-8. [DOI] [PMC free article] [PubMed] [Google Scholar]
- 62.Lin X, Antalffy B, Kang D, Orr HT, and Zoghbi HY (2000). Polyglutamine expansion down-regulates specific neuronal genes before pathologic changes in SCA1. Nat Neurosci 3, 157–163. 10.1038/72101. [DOI] [PubMed] [Google Scholar]
- 63.Driessen TM, Lee PJ, and Lim J (2018). Molecular pathway analysis towards understanding tissue vulnerability in spinocerebellar ataxia type 1. eLife 7. 10.7554/eLife.39981. [DOI] [PMC free article] [PubMed] [Google Scholar]
- 64.Friedrich J, Kordasiewicz HB, O’Callaghan B, Handler HP, Wagener C, Duvick L, Swayze EE, Rainwater O, Hofstra B, Benneyworth M, et al. (2018). Antisense oligonucleotide-mediated ataxin-1 reduction prolongs survival in SCA1 mice and reveals disease-associated transcriptome profiles. JCI Insight 3. 10.1172/jci.insight.123193. [DOI] [PMC free article] [PubMed] [Google Scholar]
- 65.Ingram M, Wozniak EAL, Duvick L, Yang R, Bergmann P, Carson R, O’Callaghan B, Zoghbi HY, Henzler C, and Orr HT (2016). Cerebellar Transcriptome Profiles of ATXN1 Transgenic Mice Reveal SCA1 Disease Progression and Protection Pathways. Neuron 89, 1194–1207. 10.1016/j.neuron.2016.02.011. [DOI] [PMC free article] [PubMed] [Google Scholar]
- 66.Kano M, and Watanabe T (2017). Type-1 metabotropic glutamate receptor signaling in cerebellar Purkinje cells in health and disease. F1000Res 6, 416. 10.12688/f1000research.10485.1. [DOI] [PMC free article] [PubMed] [Google Scholar]
- 67.Serra HG, Byam CE, Lande JD, Tousey SK, Zoghbi HY, and Orr HT (2004). Gene profiling links SCA1 pathophysiology to glutamate signaling in Purkinje cells of transgenic mice. Hum Mol Genet 13, 2535–2543. 10.1093/hmg/ddh268. [DOI] [PubMed] [Google Scholar]
- 68.Power EM, Morales A, and Empson RM (2016). Prolonged Type 1 Metabotropic Glutamate Receptor Dependent Synaptic Signaling Contributes to Spino-Cerebellar Ataxia Type 1. J Neurosci 36, 4910–4916. 10.1523/JNEUROSCI.3953-15.2016. [DOI] [PMC free article] [PubMed] [Google Scholar]
- 69.Shuvaev AN, Hosoi N, Sato Y, Yanagihara D, and Hirai H (2017). Progressive impairment of cerebellar mGluR signalling and its therapeutic potential for cerebellar ataxia in spinocerebellar ataxia type 1 model mice. J Physiol 595, 141–164. 10.1113/JP272950. [DOI] [PMC free article] [PubMed] [Google Scholar]
- 70.Kato AS, Knierman MD, Siuda ER, Isaac JT, Nisenbaum ES, and Bredt DS (2012). Glutamate receptor delta2 associates with metabotropic glutamate receptor 1 (mGluR1), protein kinase Cgamma, and canonical transient receptor potential 3 and regulates mGluR1-mediated synaptic transmission in cerebellar Purkinje neurons. J Neurosci 32, 15296–15308. 10.1523/JNEUROSCI.0705-12.2012. [DOI] [PMC free article] [PubMed] [Google Scholar]
- 71.Kohda K, Kakegawa W, Matsuda S, Yamamoto T, Hirano H, and Yuzaki M (2013). The delta2 glutamate receptor gates long-term depression by coordinating interactions between two AMPA receptor phosphorylation sites. Proc Natl Acad Sci U S A 110, E948–957. 10.1073/pnas.1218380110. [DOI] [PMC free article] [PubMed] [Google Scholar]
- 72.Kashiwabuchi N, Ikeda K, Araki K, Hirano T, Shibuki K, Takayama C, Inoue Y, Kutsuwada T, Yagi T, Kang Y, et al. (1995). Impairment of motor coordination, Purkinje cell synapse formation, and cerebellar long-term depression in GluRδ2 mutant mice. Cell 81, 245–252. 10.1016/0092-8674(95)90334-8. [DOI] [PubMed] [Google Scholar]
- 73.Utine GE, Haliloglu G, Salanci B, Cetinkaya A, Kiper PO, Alanay Y, Aktas D, Boduroglu K, and Alikasifoglu M (2013). A homozygous deletion in GRID2 causes a human phenotype with cerebellar ataxia and atrophy. J Child Neurol 28, 926–932. 10.1177/0883073813484967. [DOI] [PubMed] [Google Scholar]
- 74.Hills LB, Masri A, Konno K, Kakegawa W, Lam AT, Lim-Melia E, Chandy N, Hill RS, Partlow JN, Al-Saffar M, et al. (2013). Deletions in GRID2 lead to a recessive syndrome of cerebellar ataxia and tonic upgaze in humans. Neurology 81, 1378–1386. 10.1212/WNL.0b013e3182a841a3. [DOI] [PMC free article] [PubMed] [Google Scholar]
- 75.Pan MK, Li YS, Wong SB, Ni CL, Wang YM, Liu WC, Lu LY, Lee JC, Cortes EP, Vonsattel JG, et al. (2020). Cerebellar oscillations driven by synaptic pruning deficits of cerebellar climbing fibers contribute to tremor pathophysiology. Sci Transl Med 12. 10.1126/scitranslmed.aay1769. [DOI] [PMC free article] [PubMed] [Google Scholar]
- 76.Lalouette A, Guenet JL, and Vriz S (1998). Hotfoot mouse mutations affect the delta 2 glutamate receptor gene and are allelic to lurcher. Genomics 50, 9–13. 10.1006/geno.1998.5314. [DOI] [PubMed] [Google Scholar]
- 77.Ebner BA, Ingram MA, Barnes JA, Duvick LA, Frisch JL, Clark HB, Zoghbi HY, Ebner TJ, and Orr HT (2013). Purkinje cell ataxin-1 modulates climbing fiber synaptic input in developing and adult mouse cerebellum. J Neurosci 33, 5806–5820. 10.1523/JNEUROSCI.6311-11.2013. [DOI] [PMC free article] [PubMed] [Google Scholar]
- 78.Duvick L, Barnes J, Ebner B, Agrawal S, Andresen M, Lim J, Giesler GJ, Zoghbi HY, and Orr HT (2010). SCA1-like disease in mice expressing wild-type ataxin-1 with a serine to aspartic acid replacement at residue 776. Neuron 67, 929–935. 10.1016/j.neuron.2010.08.022. [DOI] [PMC free article] [PubMed] [Google Scholar]
- 79.Barnes JA, Ebner BA, Duvick LA, Gao W, Chen G, Orr HT, and Ebner TJ (2011). Abnormalities in the climbing fiber-Purkinje cell circuitry contribute to neuronal dysfunction in ATXN1[82Q] mice. J Neurosci 31, 12778–12789. 10.1523/JNEUROSCI.2579-11.2011. [DOI] [PMC free article] [PubMed] [Google Scholar]
- 80.Hourez R, Servais L, Orduz D, Gall D, Millard I, de Kerchove d’Exaerde A, Cheron G, Orr HT, Pandolfo M, and Schiffmann SN (2011). Aminopyridines correct early dysfunction and delay neurodegeneration in a mouse model of spinocerebellar ataxia type 1. J Neurosci 31, 11795–11807. 10.1523/JNEUROSCI.0905-11.2011. [DOI] [PMC free article] [PubMed] [Google Scholar]
- 81.Chopra R, Bushart DD, Cooper JP, Yellajoshyula D, Morrison LM, Huang H, Scoles DR, Pulst SM, Orr HT, and Shakkottai VG (2020). Altered Capicua expression drives regional Purkinje neuron vulnerability through ion channel gene dysregulation in Spinocerebellar ataxia type 1. bioRxiv, 2020.2005.2021.104976. 10.1101/2020.05.21.104976. [DOI] [PMC free article] [PubMed] [Google Scholar]
- 82.Stoyas CA, Bushart DD, Switonski PM, Ward JM, Alaghatta A, Tang MB, Niu C, Wadhwa M, Huang H, Savchenko A, et al. (2020). Nicotinamide Pathway-Dependent Sirt1 Activation Restores Calcium Homeostasis to Achieve Neuroprotection in Spinocerebellar Ataxia Type 7. Neuron 105, 630–644 e639. 10.1016/j.neuron.2019.11.019. [DOI] [PMC free article] [PubMed] [Google Scholar]
- 83.Stucki DM, Ruegsegger C, Steiner S, Radecke J, Murphy MP, Zuber B, and Saxena S (2016). Mitochondrial impairments contribute to Spinocerebellar ataxia type 1 progression and can be ameliorated by the mitochondria-targeted antioxidant MitoQ. Free Radic Biol Med 97, 427–440. 10.1016/j.freeradbiomed.2016.07.005. [DOI] [PubMed] [Google Scholar]
- 84.Ripolone M, Lucchini V, Ronchi D, Fagiolari G, Bordoni A, Fortunato F, Mondello S, Bonato S, Meregalli M, Torrente Y, et al. (2018). Purkinje cell COX deficiency and mtDNA depletion in an animal model of spinocerebellar ataxia type 1. J Neurosci Res 96, 1576–1585. 10.1002/jnr.24263. [DOI] [PubMed] [Google Scholar]
- 85.Cerminara NL, Lang EJ, Sillitoe RV, and Apps R (2015). Redefining the cerebellar cortex as an assembly of non-uniform Purkinje cell microcircuits. Nat Rev Neurosci 16, 79–93. 10.1038/nrn3886. [DOI] [PMC free article] [PubMed] [Google Scholar]
- 86.Williams BL, Yaddanapudi K, Hornig M, and Lipkin WI (2007). Spatiotemporal analysis of purkinje cell degeneration relative to parasagittal expression domains in a model of neonatal viral infection. J Virol 81, 2675–2687. 10.1128/JVI.02245-06. [DOI] [PMC free article] [PubMed] [Google Scholar]
- 87.Perkins EM, Clarkson YL, Suminaite D, Lyndon AR, Tanaka K, Rothstein JD, Skehel PA, Wyllie DJA, and Jackson M (2018). Loss of cerebellar glutamate transporters EAAT4 and GLAST differentially affects the spontaneous firing pattern and survival of Purkinje cells. Hum Mol Genet 27, 2614–2627. 10.1093/hmg/ddy169. [DOI] [PMC free article] [PubMed] [Google Scholar]
- 88.Fletcher CF, Lutz CM, O’Sullivan TN, Shaughnessy JD, Hawkes R, Frankel WN, Copeland NG, and Jenkins NA (1996). Absence Epilepsy in Tottering Mutant Mice Is Associated with Calcium Channel Defects. Cell 87, 607–617. 10.1016/s0092-8674(00)81381-1. [DOI] [PubMed] [Google Scholar]
- 89.Sarna J, Miranda SR, Schuchman EH, and Hawkes R (2001). Patterned cerebellar Purkinje cell death in a transgenic mouse model of Niemann Pick type A/B disease. Eur J Neurosci 13, 1873–1880. 10.1046/j.0953-816x.2001.01564.x. [DOI] [PubMed] [Google Scholar]
- 90.White JJ, Bosman LWJ, Blot FGC, Osorio C, Kuppens BW, Krijnen W, Andriessen C, De Zeeuw CI, Jaarsma D, and Schonewille M (2021). Region-specific preservation of Purkinje cell morphology and motor behavior in the ATXN1[82Q] mouse model of spinocerebellar ataxia 1. Brain Pathol 31, e12946. 10.1111/bpa.12946. [DOI] [PMC free article] [PubMed] [Google Scholar]
- 91.Kang SH, Li Y, Fukaya M, Lorenzini I, Cleveland DW, Ostrow LW, Rothstein JD, and Bergles DE (2013). Degeneration and impaired regeneration of gray matter oligodendrocytes in amyotrophic lateral sclerosis. Nat Neurosci 16, 571–579. 10.1038/nn.3357. [DOI] [PMC free article] [PubMed] [Google Scholar]
- 92.Mot AI, Depp C, and Nave KA (2018). An emerging role of dysfunctional axon-oligodendrocyte coupling in neurodegenerative diseases. Dialogues Clin Neurosci 20, 283–292. [DOI] [PMC free article] [PubMed] [Google Scholar]
- 93.Huang B, Wei W, Wang G, Gaertig, Marta A, Feng Y, Wang W, Li X-J, and Li S (2015). Mutant Huntingtin Downregulates Myelin Regulatory Factor-Mediated Myelin Gene Expression and Affects Mature Oligodendrocytes. Neuron 85, 1212–1226. 10.1016/j.neuron.2015.02.026. [DOI] [PMC free article] [PubMed] [Google Scholar]
- 94.Ramani B, Panwar B, Moore LR, Wang B, Huang R, Guan Y, and Paulson HL (2017). Comparison of spinocerebellar ataxia type 3 mouse models identifies early gain-of-function, cell-autonomous transcriptional changes in oligodendrocytes. Hum Mol Genet 26, 3362–3374. 10.1093/hmg/ddx224. [DOI] [PMC free article] [PubMed] [Google Scholar]
- 95.Costa MDC, Radzwion M, McLoughlin HS, Ashraf NS, Fischer S, Shakkottai VG, Maciel P, Paulson HL, and Oz G (2020). In Vivo Molecular Signatures of Cerebellar Pathology in Spinocerebellar Ataxia Type 3. Mov Disord. 10.1002/mds.28140. [DOI] [PMC free article] [PubMed] [Google Scholar]
- 96.Schuster KH, Putka AF, and McLoughlin HS (2022). Pathogenetic Mechanisms Underlying Spinocerebellar Ataxia Type 3 Are Altered in Primary Oligodendrocyte Culture. Cells 11. 10.3390/cells11162615. [DOI] [PMC free article] [PubMed] [Google Scholar]
- 97.Schuster KH, Zalon AJ, Zhang H, DiFranco DM, Stec NR, Haque Z, Blumenstein KG, Pierce AM, Guan Y, Paulson HL, and McLoughlin HS (2022). Impaired Oligodendrocyte Maturation Is an Early Feature in SCA3 Disease Pathogenesis. J Neurosci 42, 1604–1617. 10.1523/JNEUROSCI.1954-20.2021. [DOI] [PMC free article] [PubMed] [Google Scholar]
- 98.Schuster KH, DiFranco DM, Putka AF, Mato JP, Jarrah SI, Stec NR, Sundararajan VO, and McLoughlin HS (2023). Disease-associated oligodendrocyte signatures are spatiotemporally dysregulated in spinocerebellar ataxia type 3. Front Neurosci 17, 1118429. 10.3389/fnins.2023.1118429. [DOI] [PMC free article] [PubMed] [Google Scholar]
- 99.Lee Y, Morrison BM, Li Y, Lengacher S, Farah MH, Hoffman PN, Liu Y, Tsingalia A, Jin L, Zhang PW, et al. (2012). Oligodendroglia metabolically support axons and contribute to neurodegeneration. Nature 487, 443–448. 10.1038/nature11314. [DOI] [PMC free article] [PubMed] [Google Scholar]
- 100.Simons M, and Nave KA (2015). Oligodendrocytes: Myelination and Axonal Support. Cold Spring Harb Perspect Biol 8, a020479. 10.1101/cshperspect.a020479. [DOI] [PMC free article] [PubMed] [Google Scholar]
- 101.Chamberlain KA, Huang N, Xie Y, LiCausi F, Li S, Li Y, and Sheng ZH (2021). Oligodendrocytes enhance axonal energy metabolism by deacetylation of mitochondrial proteins through transcellular delivery of SIRT2. Neuron. 10.1016/j.neuron.2021.08.011. [DOI] [PMC free article] [PubMed] [Google Scholar]
- 102.Funfschilling U, Supplie LM, Mahad D, Boretius S, Saab AS, Edgar J, Brinkmann BG, Kassmann CM, Tzvetanova ID, Mobius W, et al. (2012). Glycolytic oligodendrocytes maintain myelin and long-term axonal integrity. Nature 485, 517–521. 10.1038/nature11007. [DOI] [PMC free article] [PubMed] [Google Scholar]
- 103.Barron T, Saifetiarova J, Bhat MA, and Kim JH (2018). Myelination of Purkinje axons is critical for resilient synaptic transmission in the deep cerebellar nucleus. Sci Rep 8, 1022. 10.1038/s41598-018-19314-0. [DOI] [PMC free article] [PubMed] [Google Scholar]
- 104.Gargareta VI, Reuschenbach J, Siems SB, Sun T, Piepkorn L, Mangana C, Spate E, Goebbels S, Huitinga I, Mobius W, et al. (2022). Conservation and divergence of myelin proteome and oligodendrocyte transcriptome profiles between humans and mice. Elife 11. 10.7554/eLife.77019. [DOI] [PMC free article] [PubMed] [Google Scholar]
- 105.Lukas C, Schols L, Bellenberg B, Rub U, Przuntek H, Schmid G, Koster O, and Suchan B (2006). Dissociation of grey and white matter reduction in spinocerebellar ataxia type 3 and 6: a voxel-based morphometry study. Neurosci Lett 408, 230–235. 10.1016/j.neulet.2006.09.007. [DOI] [PubMed] [Google Scholar]
- 106.Mandelli ML, De Simone T, Minati L, Bruzzone MG, Mariotti C, Fancellu R, Savoiardo M, and Grisoli M (2007). Diffusion Tensor Imaging of Spinocerebellar Ataxias Types 1 and 2. American Journal of Neuroradiology 28, 1996–2000. 10.3174/ajnr.A0716. [DOI] [PMC free article] [PubMed] [Google Scholar]
- 107.Doss S, Brandt AU, Oberwahrenbrock T, Endres M, Paul F, and Rinnenthal JL (2014). Metabolic evidence for cerebral neurodegeneration in spinocerebellar ataxia type 1. Cerebellum 13, 199–206. 10.1007/s12311-013-0527-2. [DOI] [PubMed] [Google Scholar]
- 108.Young KM, Psachoulia K, Tripathi RB, Dunn SJ, Cossell L, Attwell D, Tohyama K, and Richardson WD (2013). Oligodendrocyte dynamics in the healthy adult CNS: evidence for myelin remodeling. Neuron 77, 873–885. 10.1016/j.neuron.2013.01.006. [DOI] [PMC free article] [PubMed] [Google Scholar]
- 109.Fields RD (2015). A new mechanism of nervous system plasticity: activity-dependent myelination. Nat Rev Neurosci 16, 756–767. 10.1038/nrn4023. [DOI] [PMC free article] [PubMed] [Google Scholar]
- 110.Bonetto G, Belin D, and Karadottir RT (2021). Myelin: A gatekeeper of activity-dependent circuit plasticity? Science, eaba6905. 10.1126/science.aba6905. [DOI] [PubMed] [Google Scholar]
- 111.McKenzie IA, Ohayon D, Li H, de Faria JP, Emery B, Tohyama K, and Richardson WD (2014). Motor skill learning requires active central myelination. Science 346, 318–322. 10.1126/science.1254960. [DOI] [PMC free article] [PubMed] [Google Scholar]
- 112.Xin W, and Chan JR (2020). Myelin plasticity: sculpting circuits in learning and memory. Nat Rev Neurosci 21, 682–694. 10.1038/s41583-020-00379-8. [DOI] [PMC free article] [PubMed] [Google Scholar]
- 113.Xiao L, Ohayon D, McKenzie IA, Sinclair-Wilson A, Wright JL, Fudge AD, Emery B, Li H, and Richardson WD (2016). Rapid production of new oligodendrocytes is required in the earliest stages of motor-skill learning. Nat Neurosci 19, 1210–1217. 10.1038/nn.4351. [DOI] [PMC free article] [PubMed] [Google Scholar]
- 114.Bacmeister CM, Barr HJ, McClain CR, Thornton MA, Nettles D, Welle CG, and Hughes EG (2020). Motor learning promotes remyelination via new and surviving oligodendrocytes. Nat Neurosci 23, 819–831. 10.1038/s41593-020-0637-3. [DOI] [PMC free article] [PubMed] [Google Scholar]
- 115.Mallon BS, Shick HE, Kidd GJ, and Macklin WB (2002). Proteolipid Promoter Activity Distinguishes Two Populations of NG2-Positive Cells throughout Neonatal Cortical Development. The Journal of Neuroscience 22, 876–885. 10.1523/jneurosci.22-03-00876.2002. [DOI] [PMC free article] [PubMed] [Google Scholar]
- 116.Gibson EM, Purger D, Mount CW, Goldstein AK, Lin GL, Wood LS, Inema I, Miller SE, Bieri G, Zuchero JB, et al. (2014). Neuronal activity promotes oligodendrogenesis and adaptive myelination in the mammalian brain. Science 344, 1252304. 10.1126/science.1252304. [DOI] [PMC free article] [PubMed] [Google Scholar]
- 117.Yalcin B, and Monje M (2021). Microenvironmental interactions of oligodendroglial cells. Dev Cell 56, 1821–1832. 10.1016/j.devcel.2021.06.006. [DOI] [PMC free article] [PubMed] [Google Scholar]
- 118.Zonouzi M, Scafidi J, Li P, McEllin B, Edwards J, Dupree JL, Harvey L, Sun D, Hubner CA, Cull-Candy SG, et al. (2015). GABAergic regulation of cerebellar NG2 cell development is altered in perinatal white matter injury. Nat Neurosci 18, 674–682. 10.1038/nn.3990. [DOI] [PMC free article] [PubMed] [Google Scholar]
- 119.Brady ST, Witt AS, Kirkpatrick LL, de Waegh SM, Readhead C, Tu P-H, and Lee VMY (1999). Formation of Compact Myelin Is Required for Maturation of the Axonal Cytoskeleton. The Journal of Neuroscience 19, 7278–7288. 10.1523/jneurosci.19-17-07278.1999. [DOI] [PMC free article] [PubMed] [Google Scholar]
- 120.Kirkpatrick LL, Witt AS, Payne HR, Shine HD, and Brady ST (2001). Changes in Microtubule Stability and Density in Myelin-Deficient Shiverer Mouse CNS Axons. The Journal of Neuroscience 21, 2288–2297. 10.1523/jneurosci.21-07-02288.2001. [DOI] [PMC free article] [PubMed] [Google Scholar]
- 121.Smith CM, Cooksey E, and Duncan ID (2013). Myelin loss does not lead to axonal degeneration in a long-lived model of chronic demyelination. J Neurosci 33, 2718–2727. 10.1523/JNEUROSCI.4627-12.2013. [DOI] [PMC free article] [PubMed] [Google Scholar]
- 122.Kanton S, Boyle MJ, He Z, Santel M, Weigert A, Sanchis-Calleja F, Guijarro P, Sidow L, Fleck JS, Han D, et al. (2019). Organoid single-cell genomic atlas uncovers human-specific features of brain development. Nature 574, 418–422. 10.1038/s41586-019-1654-9. [DOI] [PubMed] [Google Scholar]
- 123.Cao J, Spielmann M, Qiu X, Huang X, Ibrahim DM, Hill AJ, Zhang F, Mundlos S, Christiansen L, Steemers FJ, et al. (2019). The single-cell transcriptional landscape of mammalian organogenesis. Nature 566, 496–502. 10.1038/s41586-019-0969-x. [DOI] [PMC free article] [PubMed] [Google Scholar]
- 124.Schiebinger G, Shu J, Tabaka M, Cleary B, Subramanian V, Solomon A, Gould J, Liu S, Lin S, Berube P, et al. (2019). Optimal-Transport Analysis of Single-Cell Gene Expression Identifies Developmental Trajectories in Reprogramming. Cell 176, 928–943 e922. 10.1016/j.cell.2019.01.006. [DOI] [PMC free article] [PubMed] [Google Scholar]
- 125.Keren-Shaul H, Spinrad A, Weiner A, Matcovitch-Natan O, Dvir-Szternfeld R, Ulland TK, David E, Baruch K, Lara-Astaiso D, Toth B, et al. (2017). A Unique Microglia Type Associated with Restricting Development of Alzheimer’s Disease. Cell 169, 1276–1290 e1217. 10.1016/j.cell.2017.05.018. [DOI] [PubMed] [Google Scholar]
- 126.Habib N, McCabe C, Medina S, Varshavsky M, Kitsberg D, Dvir-Szternfeld R, Green G, Dionne D, Nguyen L, Marshall JL, et al. (2020). Disease-associated astrocytes in Alzheimer’s disease and aging. Nat Neurosci 23, 701–706. 10.1038/s41593-020-0624-8. [DOI] [PMC free article] [PubMed] [Google Scholar]
- 127.Zhang J, Velmeshev D, Hashimoto K, Huang YH, Hofmann JW, Shi X, Chen J, Leidal AM, Dishart JG, Cahill MK, et al. (2020). Neurotoxic microglia promote TDP-43 proteinopathy in progranulin deficiency. Nature 588, 459–465. 10.1038/s41586-020-2709-7. [DOI] [PMC free article] [PubMed] [Google Scholar]
- 128.Burkhardt DB, Stanley JS 3rd, Tong A, Perdigoto AL, Gigante SA, Herold KC, Wolf G, Giraldez AJ, van Dijk D, and Krishnaswamy S (2021). Quantifying the effect of experimental perturbations at single-cell resolution. Nat Biotechnol 39, 619–629. 10.1038/s41587-020-00803-5. [DOI] [PMC free article] [PubMed] [Google Scholar]
- 129.Lange M, Bergen V, Klein M, Setty M, Reuter B, Bakhti M, Lickert H, Ansari M, Schniering J, Schiller HB, et al. (2020). CellRank for directed single-cell fate mapping. bioRxiv. 10.1101/2020.10.19.345983. [DOI] [PMC free article] [PubMed] [Google Scholar]
- 130.Nowotschin S, Setty M, Kuo YY, Liu V, Garg V, Sharma R, Simon CS, Saiz N, Gardner R, Boutet SC, et al. (2019). The emergent landscape of the mouse gut endoderm at single-cell resolution. Nature 569, 361–367. 10.1038/s41586-019-1127-1. [DOI] [PMC free article] [PubMed] [Google Scholar]
- 131.Setty M, Kiseliovas V, Levine J, Gayoso A, Mazutis L, and Pe’er D (2019). Characterization of cell fate probabilities in single-cell data with Palantir. Nat Biotechnol 37, 451–460. 10.1038/s41587-019-0068-4. [DOI] [PMC free article] [PubMed] [Google Scholar]
- 132.Hwang I, Pan H, Yao J, Elemento O, Zheng H, and Paik J (2020). CIC is a critical regulator of neuronal differentiation. JCI Insight 5. 10.1172/jci.insight.135826. [DOI] [PMC free article] [PubMed] [Google Scholar]
- 133.Fryer JD, Yu P, Kang H, Mandel-Brehm C, Carter AN, Crespo-Barreto J, Gao Y, Flora A, Shaw C, Orr HT, and Zoghbi HY (2011). Exercise and genetic rescue of SCA1 via the transcriptional repressor Capicua. Science 334, 690–693. 10.1126/science.1212673. [DOI] [PMC free article] [PubMed] [Google Scholar]
- 134.Cordell HJ (2009). Detecting gene-gene interactions that underlie human diseases. Nat Rev Genet 10, 392–404. 10.1038/nrg2579. [DOI] [PMC free article] [PubMed] [Google Scholar]
- 135.Wang Y, and Blei DM (2020). The Blessings of Multiple Causes. Journal of the American Statistical Association 114, 1574–1596. 10.1080/01621459.2019.1686987. [DOI] [Google Scholar]
- 136.Sundararajan M, Taly A, and Yan Q (2018). Axiomatic Attribution for Deep Networks. International Conference on Learning Represeations. [Google Scholar]
- 137.Ruegsegger C, Stucki DM, Steiner S, Angliker N, Radecke J, Keller E, Zuber B, Ruegg MA, and Saxena S (2016). Impaired mTORC1-Dependent Expression of Homer-3 Influences SCA1 Pathophysiology. Neuron 89, 129–146. 10.1016/j.neuron.2015.11.033. [DOI] [PubMed] [Google Scholar]
- 138.Bergles DE, Roberts JD, Somogyi P, and Jahr CE (2000). Glutamatergic synapses on oligodendrocyte precursor cells in the hippocampus. Nature 405, 187–191. 10.1038/35012083. [DOI] [PubMed] [Google Scholar]
- 139.Chittajallu R, Aguirre A, and Gallo V (2004). NG2-positive cells in the mouse white and grey matter display distinct physiological properties. J Physiol 561, 109–122. 10.1113/jphysiol.2004.074252. [DOI] [PMC free article] [PubMed] [Google Scholar]
- 140.Lin SC, Huck JH, Roberts JD, Macklin WB, Somogyi P, and Bergles DE (2005). Climbing fiber innervation of NG2-expressing glia in the mammalian cerebellum. Neuron 46, 773–785. 10.1016/j.neuron.2005.04.025. [DOI] [PubMed] [Google Scholar]
- 141.Liu CJ, Rainwater O, Clark HB, Orr HT, and Akkin T (2018). Polarization-sensitive optical coherence tomography reveals gray matter and white matter atrophy in SCA1 mouse models. Neurobiol Dis 116, 69–77. 10.1016/j.nbd.2018.05.003. [DOI] [PubMed] [Google Scholar]
- 142.Love S (2006). Demyelinating diseases. J Clin Pathol 59, 1151–1159. 10.1136/jcp.2005.031195. [DOI] [PMC free article] [PubMed] [Google Scholar]
- 143.Burright EN, Brent Clark H, Servadio A, Matilla T, Feddersen RM, Yunis WS, Duvick LA, Zoghbi HY, and Orr HT (1995). SCA1 transgenic mice: A model for neurodegeneration caused by an expanded CAG trinucleotide repeat. Cell 82, 937–948. 10.1016/0092-8674(95)90273-2. [DOI] [PubMed] [Google Scholar]
- 144.Vonsattel JP, Amaya Mdel P, Cortes EP, Mancevska K, and Keller CE (2008). Twenty-first century brain banking: practical prerequisites and lessons from the past: the experience of New York Brain Bank, Taub Institute, Columbia University. Cell Tissue Bank 9, 247–258. 10.1007/s10561-008-9079-y. [DOI] [PMC free article] [PubMed] [Google Scholar]
- 145.O’Meara RW, Ryan SD, Colognato H, and Kothary R (2011). Derivation of enriched oligodendrocyte cultures and oligodendrocyte/neuron myelinating co-cultures from post-natal murine tissues. J Vis Exp. 10.3791/3324. [DOI] [PMC free article] [PubMed] [Google Scholar]
- 146.Hu M, Yang B, Cheng Y, Radda JSD, Chen Y, Liu M, and Wang S (2020). ProbeDealer is a convenient tool for designing probes for highly multiplexed fluorescence in situ hybridization. Sci Rep 10, 22031. 10.1038/s41598-020-76439-x. [DOI] [PMC free article] [PubMed] [Google Scholar]
- 147.Camacho C, Coulouris G, Avagyan V, Ma N, Papadopoulos J, Bealer K, and Madden TL (2009). BLAST+: architecture and applications. BMC Bioinformatics 10, 421. 10.1186/1471-2105-10-421. [DOI] [PMC free article] [PubMed] [Google Scholar]
- 148.Liu M, Lu Y, Yang B, Chen Y, Radda JSD, Hu M, Katz SG, and Wang S (2020). Multiplexed imaging of nucleome architectures in single cells of mammalian tissue. Nat Commun 11, 2907. 10.1038/s41467-020-16732-5. [DOI] [PMC free article] [PubMed] [Google Scholar]
- 149.Moffitt JR, Hao J, Wang G, Chen KH, Babcock HP, and Zhuang X (2016). High-throughput single-cell gene-expression profiling with multiplexed error-robust fluorescence in situ hybridization. Proc Natl Acad Sci U S A 113, 11046–11051. 10.1073/pnas.1612826113. [DOI] [PMC free article] [PubMed] [Google Scholar]
- 150.Chen KH, Boettiger AN, Moffitt JR, Wang S, and Zhuang X (2015). RNA imaging. Spatially resolved, highly multiplexed RNA profiling in single cells. Science 348, aaa6090. 10.1126/science.aaa6090. [DOI] [PMC free article] [PubMed] [Google Scholar]
- 151.Liu M, Yang B, Hu M, Radda JSD, Chen Y, Jin S, Cheng Y, and Wang S (2021). Chromatin tracing and multiplexed imaging of nucleome architectures (MINA) and RNAs in single mammalian cells and tissue. Nat Protoc 16, 2667–2697. 10.1038/s41596-021-00518-0. [DOI] [PMC free article] [PubMed] [Google Scholar]
- 152.Gong H, Holcomb I, Ooi A, Wang X, Majonis D, Unger MA, and Ramakrishnan R (2016). Simple Method To Prepare Oligonucleotide-Conjugated Antibodies and Its Application in Multiplex Protein Detection in Single Cells. Bioconjug Chem 27, 217–225. 10.1021/acs.bioconjchem.5b00613. [DOI] [PubMed] [Google Scholar]
- 153.Moffitt JR, Hao J, Bambah-Mukku D, Lu T, Dulac C, and Zhuang X (2016). High-performance multiplexed fluorescence in situ hybridization in culture and tissue with matrix imprinting and clearing. Proc Natl Acad Sci U S A 113, 14456–14461. 10.1073/pnas.1617699113. [DOI] [PMC free article] [PubMed] [Google Scholar]
- 154.Bushart DD, Huang H, Man LJ, Morrison LM, and Shakkottai VG (2021). A Chlorzoxazone-Baclofen Combination Improves Cerebellar Impairment in Spinocerebellar Ataxia Type 1. Mov Disord 36, 622–631. 10.1002/mds.28355. [DOI] [PMC free article] [PubMed] [Google Scholar]
- 155.Ankri L, Yarom Y, and Uusisaari MY (2014). Slice it hot: acute adult brain slicing in physiological temperature. J Vis Exp, e52068. 10.3791/52068. [DOI] [PMC free article] [PubMed] [Google Scholar]
- 156.Choe M, Cortes E, Vonsattel JP, Kuo SH, Faust PL, and Louis ED (2016). Purkinje cell loss in essential tremor: Random sampling quantification and nearest neighbor analysis. Mov Disord 31, 393–401. 10.1002/mds.26490. [DOI] [PMC free article] [PubMed] [Google Scholar]
- 157.Satija R, Farrell JA, Gennert D, Schier AF, and Regev A (2015). Spatial reconstruction of single-cell gene expression data. Nat Biotechnol 33, 495–502. 10.1038/nbt.3192. [DOI] [PMC free article] [PubMed] [Google Scholar]
- 158.Wolf FA, Angerer P, and Theis FJ (2018). SCANPY: large-scale single-cell gene expression data analysis. Genome Biol 19, 15. 10.1186/s13059-017-1382-0. [DOI] [PMC free article] [PubMed] [Google Scholar]
- 159.Wolock SL, Lopez R, and Klein AM (2019). Scrublet: Computational Identification of Cell Doublets in Single-Cell Transcriptomic Data. Cell Syst 8, 281–291 e289. 10.1016/j.cels.2018.11.005. [DOI] [PMC free article] [PubMed] [Google Scholar]
- 160.Polański K, Young MD, Miao Z, Meyer KB, Teichmann SA, Park J-E, and Berger B (2019). BBKNN: fast batch alignment of single cell transcriptomes. Bioinformatics. 10.1093/bioinformatics/btz625. [DOI] [PMC free article] [PubMed] [Google Scholar]
- 161.Stuart T, Butler A, Hoffman P, Hafemeister C, Papalexi E, Mauck WM 3rd, Hao Y, Stoeckius M, Smibert P, and Satija R (2019). Comprehensive Integration of Single-Cell Data. Cell 177, 1888–1902 e1821. 10.1016/j.cell.2019.05.031. [DOI] [PMC free article] [PubMed] [Google Scholar]
- 162.Welch JD, Kozareva V, Ferreira A, Vanderburg C, Martin C, and Macosko EZ (2019). Single-Cell Multi-omic Integration Compares and Contrasts Features of Brain Cell Identity. Cell 177, 1873–1887 e1817. 10.1016/j.cell.2019.05.006. [DOI] [PMC free article] [PubMed] [Google Scholar]
- 163.Haghverdi L, Lun ATL, Morgan MD, and Marioni JC (2018). Batch effects in single-cell RNA-sequencing data are corrected by matching mutual nearest neighbors. Nat Biotechnol 36, 421–427. 10.1038/nbt.4091. [DOI] [PMC free article] [PubMed] [Google Scholar]
- 164.Korsunsky I, Millard N, Fan J, Slowikowski K, Zhang F, Wei K, Baglaenko Y, Brenner M, Loh PR, and Raychaudhuri S (2019). Fast, sensitive and accurate integration of single-cell data with Harmony. Nat Methods 16, 1289–1296. 10.1038/s41592-019-0619-0. [DOI] [PMC free article] [PubMed] [Google Scholar]
- 165.Luecken MD, Büttner M, Chaichoompu K, Danese A, Interlandi M, Mueller MF, Strobl DC, Zappia L, Dugas M, Colomé-Tatché M, and Theis FJ (2020). Benchmarking atlas-level data integration in single-cell genomics. bioRxiv. 10.1101/2020.05.22.111161. [DOI] [PMC free article] [PubMed] [Google Scholar]
- 166.Moon KR, van Dijk D, Wang Z, Gigante S, Burkhardt DB, Chen WS, Yim K, Elzen AVD, Hirn MJ, Coifman RR, et al. (2019). Visualizing structure and transitions in high-dimensional biological data. Nat Biotechnol 37, 1482–1492. 10.1038/s41587-019-0336-3. [DOI] [PMC free article] [PubMed] [Google Scholar]
- 167.Becht E, McInnes L, Healy J, Dutertre C-A, Kwok IWH, Ng LG, Ginhoux F, and Newell EW (2018). Dimensionality reduction for visualizing single-cell data using UMAP. Nature Biotechnology 37, 38–44. 10.1038/nbt.4314. [DOI] [PubMed] [Google Scholar]
- 168.van Dijk D, Sharma R, Nainys J, Yim K, Kathail P, Carr AJ, Burdziak C, Moon KR, Chaffer CL, Pattabiraman D, et al. (2018). Recovering Gene Interactions from Single-Cell Data Using Data Diffusion. Cell 174, 716–729.e727. 10.1016/j.cell.2018.05.061. [DOI] [PMC free article] [PubMed] [Google Scholar]
- 169.Schefzik R, Flesch J, and Goncalves A (2021). Fast identification of differential distributions in single-cell RNA-sequencing data with waddR. Bioinformatics. 10.1093/bioinformatics/btab226. [DOI] [PMC free article] [PubMed] [Google Scholar]
- 170.Orlova DY, Zimmerman N, Meehan S, Meehan C, Waters J, Ghosn EE, Filatenkov A, Kolyagin GA, Gernez Y, Tsuda S, et al. (2016). Earth Mover’s Distance (EMD): A True Metric for Comparing Biomarker Expression Levels in Cell Populations. PLoS One 11, e0151859. 10.1371/journal.pone.0151859. [DOI] [PMC free article] [PubMed] [Google Scholar]
- 171.Wang T, and Nabavi S (2018). SigEMD: A powerful method for differential gene expression analysis in single-cell RNA sequencing data. Methods 145, 25–32. 10.1016/j.ymeth.2018.04.017. [DOI] [PMC free article] [PubMed] [Google Scholar]
- 172.Andrews TS, and Hemberg M (2018). False signals induced by single-cell imputation. F1000Res 7, 1740. 10.12688/f1000research.16613.2. [DOI] [PMC free article] [PubMed] [Google Scholar]
- 173.Hou W, Ji Z, Ji H, and Hicks SC (2020). A systematic evaluation of single-cell RNA-sequencing imputation methods. Genome Biol 21, 218. 10.1186/s13059-020-02132-x. [DOI] [PMC free article] [PubMed] [Google Scholar]
- 174.Stark C, Breitkreutz BJ, Reguly T, Boucher L, Breitkreutz A, and Tyers M (2006). BioGRID: a general repository for interaction datasets. Nucleic Acids Res 34, D535–539. 10.1093/nar/gkj109. [DOI] [PMC free article] [PubMed] [Google Scholar]
- 175.McQuin C, Goodman A, Chernyshev V, Kamentsky L, Cimini BA, Karhohs KW, Doan M, Ding L, Rafelski SM, Thirstrup D, et al. (2018). CellProfiler 3.0: Next-generation image processing for biology. PLoS Biol 16, e2005970. 10.1371/journal.pbio.2005970. [DOI] [PMC free article] [PubMed] [Google Scholar]
- 176.Chen T, and Guestrin C (2016). XGBoost: A Scalable Tree Boosting System. Proceedings of the 22nd ACM SIGKDD International Conference on Knowledge Discovery & Data Mining, 2016. (Association for Computing Machinery; ), pp. 785–794. [Google Scholar]
- 177.Bergstra J, Yamins D, and Cox DD (2013). Making a Science of Model Search: Hyperparameter Optimization in Hundreds of Dimensions for Vision Architectures. International Conference on Machine Learning, 9. [Google Scholar]
- 178.Sehanobish A, Ravindra N, and van Dijk D (2020). Gaining insight into SARS-CoV-2 infection and COVID-19 severity using self-supervised edge features and Graph Neural Networks. International Conference on Machine Learning, 2020. [Google Scholar]
- 179.Ravindra N, Sehanobish A, Pappalardo JL, Hafler DA, and Dijk D.v. (2020). Disease state prediction from single-cell data using graph attention networks. Proceedings of the ACM Conference on Health, Inference, and Learning. Association for Computing Machinery. [Google Scholar]
- 180.Veličkovic P, Cucurull G, Casanova A, Romero A, Lio P, and Bengio Y (2018). Graph Attention Networks. International Conference on Learning Representations, 12. [Google Scholar]
- 181.Duchi J, Hazan E, and Singer Y (2011). Adaptive Subgradient Methods for Online Learning and Stochastic Optimization. Journal of Machine Learning Research 12, 2121–2159. [Google Scholar]
- 182.Glorot X, and Bengio Y (2010). Understanding the difficulty of training deep feedforward neural networks. 2010/05//. Teh YW, and Titterington M, eds. (JMLR Workshop and Conference Proceedings; ), pp. 249–256. [Google Scholar]
- 183.Chiang W-L, Liu X, Si S, Li Y, Bengio S, and Hsieh C-J (2019). Cluster-GCN: An Efficient Algorithm for Training Deep and Large Graph Convolutional Networks. Proceedings of the 25th ACM SIGKDD International Conference on Knowledge Discovery & Data Mining, 2019. (Association for Computing Machinery; ), pp. 257–266. [Google Scholar]
- 184.Simonyan K, Vedaldi A, and Zisserman A (2014). Deep Inside Convolutional Networks: Visualising Image Classification Models and Saliency Maps. Workshop at International Conference on Learning Representations, 2014. [Google Scholar]
- 185.Smilkov D, Thorat N, Kim B, Viégas F, and Wattenberg M (2017). SmoothGrad: removing noise by adding noise. International Conference on Machine Learning. [Google Scholar]
Associated Data
This section collects any data citations, data availability statements, or supplementary materials included in this article.
Supplementary Materials
Table S1. Tissue information for mouse and human post-mortem samples used in this study, Related to Figure 1.
Details of control (CTRL) and SCA patient cerebellar cortex samples used for each experiment (PMI=post-mortem interval, snRNA-seq=single-nucleus RNA-seq, qRT-PCR=quantitative RT-PCR, WB=western blotting, IHC=immunohistochemistry, n.d.=not determined). Information regarding sample ID, age, genotype, sex, PMI, and number of cells for each mouse and human cerebellar cortex sample sequenced are provided.
Table S2. Expression of transcripts encoding ataxin-1 interactors in different cerebellar cell types, Related to Figure 1.
Expression z-score of transcripts encoding ataxin-1 interactors49 with mouse orthologs across each cell type in the WT mouse cerebellum averaged over time. Order of list corresponds to heatmap of ataxin-1 interactor expression from Figure 1I.
Table S3. Non-imputed differential gene expression between CTRL and SCA1 human post-mortem cerebellum, Related to Figure 1.
Lists of up- and down-regulated genes in each of the 13 human cerebellar cell types (before imputation) organized by sheet. Data were subsampled to control for differential nuclei abundance across different genotypes prior to performing differential gene expression analyses. EMD and log2(fc) were calculated to compare distributions.
Table S4. Non-Imputed differential gene expression between WT and SCA1 KI mouse cerebellum at each timepoint, Related to Figure 1.
Lists of up- and down-regulated genes in each of the 14 mouse cerebellar cell types at each timepoint (before imputation) organized by sheet. Data were subsampled to control for differential nuclei abundance across different genotypes and timepoints prior to performing differential gene expression analyses. EMD and log2(fc) were calculated to compare distributions.
Table S5. Imputed differential gene expression between CTRL and SCA1 human post-mortem cerebellum, Related to Figure 1.
Lists of up- and down-regulated genes in each of the 13 human cerebellar cell types (after imputation within genotype) organized by sheet. Data were subsampled to control for differential nuclei abundance across different genotypes prior to performing differential gene expression analyses. EMD and log2(fc) were calculated to compare distributions and |EMD|≥0.1 and Benjamini-Hochberg adjusted P-value (Pval_corrected<0.01) were used to determine significance.
Table S6. Imputed differential gene expression between WT and SCA1 KI mouse cerebellum at each timepoint, Related to Figure 1.
Lists of up- and down-regulated genes in each of the 14 mouse cerebellar cell types at each timepoint (after imputation within genotype) organized by sheet. Data were subsampled to control for differential nuclei abundance across different genotypes and timepoints prior to performing differential gene expression analyses. EMD and log2(fc) were calculated to compare distributions and |EMD|≥0.1 and Benjamini-Hochberg adjusted P-value (Pval_corrected<0.01) were used to determine significance.
Table S7. Effect of data imputation by MAGIC on 5-week PC enriched pathways, Related to Figure 1.
Lists of enriched ingenuity canonical pathways from lists of all significant DEGs (up and down) calculated from 5-week mouse PCs after varying t (diffusion time) and k (# of neighbors) parameters for imputation with MAGIC. Significant pathways were determined by a cut-off of −log(Benjamini-Hochberg corrected P-value<0.05)>1.3.
Table S8. Differentially expressed genes between different UBC subpopulations in mouse snRNA-seq dataset, Related to Figure 1.
Lists of top 100 enriched genes in each UBC subpopulation (ON, OFF) in the mouse snRNA-seq dataset, ranked by EMD.
Table S9. Gene ontology of differentially expressed genes at each timepoint in SCA1 KI mouse UBCs, Related to Figure 1.
Lists of enriched ingenuity canonical pathways from lists of all DEGs (up and down), up-regulated genes only, or down-regulated genes only at each timepoint in mouse UBCs after subsampling data to control for differential abundance in nuclei between conditions.
Table S10. Gene ontology of differentially expressed genes in SCA1 KI mouse and human post-mortem UBCs, Related to Figure 1.
Lists of enriched PANTHER pathway annotations among significantly down- or up-regulated genes only in mouse or human UBCs, as well as common DEGs between the mouse and human datasets. For the common DEGs, genes without known mouse-human orthologs were excluded.
Table S11. Gene ontology of differentially expressed genes in SCA1 KI mouse PCs, Related to Figure 2.
Lists of enriched ingenuity canonical pathways from lists of all DEGs (up and down), up-regulated genes only, or down-regulated genes only at each timepoint in mouse PCs after subsampling data to control for differential abundance in nuclei between conditions.
Table S12. List oligonucleotides targeting 140 (MERFISH) and 4 (smFISH) transcripts of interest for differential expression analysis of PC-related genes, Related to Figure 2.
Lists of MERFISH and smFISH probe sequences used to detect 140 and 4 unique mRNA species, respectively, in the mouse cerebellum. Differential expression from MERFISH analysis of selected genes in 5-week, 18-week, and 30-week WT and SCA1 KI mouse PCs was calculated.
Table S13. Gene ontology of differentially expressed genes in SCA1 KI mouse and human post-mortem PCs, Related to Figure 2.
Lists of enriched PANTHER pathway annotations among significantly down- or up-regulated genes only in mouse or human PCs, as well as common DEGs between the mouse and human datasets. For the common DEGs, genes without known mouse-human orthologs were excluded.
Table S14. Differentially expressed genes between different PC subpopulations in mouse snRNA-seq dataset, Related to Figure 3.
Lists of top 100 enriched genes in each PC subpopulation (PC0, PC1, PC2, PC3, PC4) in the mouse snRNA-seq dataset, ranked by EMD.
Table S15. Gene ontology of differentially expressed genes in SCA1 OLs, Related to Figure 4.
Lists of enriched GO pathways (biological process) from lists of all DEGs (up and down), up-regulated genes only, or down-regulated genes only at each timepoint in human OLs and OPCs.
Table S16. Expression of top dynamical genes for each cell type in the WT and SCA1 KI mouse cerebellum, Related to Figure 6.
Lists of the top 50 dynamical genes for each genotype within each cell type. Expression differences for each gene were calculated between genotypes (SCA1-WT) for each pseudotime bin. Importance ratings refer to the information gain (improvement in accuracy to the branches that a gene feature is on).
Table S17. Top salient genes for GAT, Related to Figure 6.
List of top 20 salient genes per GAT model for predicting disease status label at each timepoint based on ranking the first GAT layer’s learned weight matrix, transforming input features to their hidden unit representations.
Table S18. Top important genes based on local interpretability from Integrated Gradients analysis, Related to Figure 6.
List of top 50 most important genes the Integrated Gradients analysis with a SmoothGrad noise tunnel for each representative cell type and timepoint, based on average expression in each subset.
Data Availability Statement
All raw fastq data files from human and mouse snRNA-seq were deposited into GEO under accession GSE246183. The data and additional details of protocols used for this study are available from the Lead Contact upon reasonable request. Scripts used to analyze the snRNA-seq data and the software for the Graph Attention Networks and Integrated Gradients with noise tunnels are also available at the following link for academic use: https://github.com/ChrLeeee/SCA1_snRNAseq_CB.