

Abstract
The modeling of TMS-induced electric fields (E-fields) serves as a versatile technique for evaluating and refining brain targeting and dosing strategies, while also providing insights into dose–response relationships in the brain. This review outlines the methodologies employed to derive E-field estimations, covering TMS physics, modeling assumptions, and aspects of subject-specific head tissue and coil modeling. We also summarize various numerical methods for solving the E-field, and their suitability for various applications. Modeling methodologies have been optimized to efficiently execute numerous TMS simulations across diverse scalp coil configurations, facilitating the identification of optimal setups or rapid cortical E-field visualization for specific brain targets. These brain targets are extrapolated from neurophysiological measurements and neuroimaging, enabling precise and individualized E-field dosing in experimental and clinical applications. This necessitates the quantification of E-field estimates using metrics that enable the comparison of brain target engagement, functional localization, and TMS intensity adjustments across subjects. The integration of E-field modeling with empirical data has the potential to uncover pivotal insights into the aspects of E-field responsible for stimulating and modulating brain function and states, enhancing behavioral task performance, and impacting the clinical outcomes of personalized TMS interventions.
Keywords: transcranial magnetic stimulation, electric field, modeling, individualization, brain stimulation, optimal placement
1. Introduction
Transcranial magnetic stimulation (TMS) is a widely used noninvasive brain stimulation technique with applications in both neuroscience research and therapeutic interventions for neurological and psychiatric disorders (1). By delivering brief current pulses through a transducing coil, TMS generates a magnetic field that induces a time-varying electric field (E-field) in the brain. The spatial features of the induced E-field are critical for determining the region and depth of brain tissue stimulated. The spatial properties of the E-field are influenced by several key determinants: coil positioning, individual head anatomy as well as tissue electrical properties (conductivities), and relative orientation of cortical neurons with respect to the E-field. Achieving precise and focal E-field delivery is crucial for target engagement and avoiding undesired effects on off-target regions. The ability to modulate neural activity in specific brain networks with high spatial resolution is key to improving the efficacy and selectivity of TMS interventions.
Computational modeling has emerged as a valuable tool for understanding the properties and effects of the TMS induced E-field. These models enable quantifying the delivered “E-field dose” in terms of strength, focality, and spatial distribution, accounting for subject specific anatomy. They also enable the determination of optimal TMS parameters that maximize the E-field intensity in the region of interest (ROI), and hence target engagement, potentially enhancing the efficiency of TMS interventions (2,3).
In this review, we present the state-of-the-art of using E-field models in personalized TMS interventions. We will discuss computational methods used to optimize coil placement, explore experimental applications of E-field modeling incorporating physiological measures, and highlight the potential for future developments in this field. By organizing the existing knowledge on E-field modeling in TMS, we aim to contribute to a deeper understanding of its implications for improving the efficacy and precision of personalized TMS interventions.
2. Case for individualization
TMS dosing conventionally relies on defining the treatment intensity as the maximum stimulator output (%MSO), whether through a fixed intensity or an individually titrated motor threshold (MT), even for non-motor cortex stimulation. At a fixed %MSO, E-field modeling shows large inter-individual variability in stimulation intensity and spread (4,5). This variability primarily arises from varying coil-to-cortex distances and cortical gyrification across individuals, influenced by factors like age-related brain atrophy (6), sex (7), and cognitive impairment (8). Coil-to-cortex distances significantly impact the E-field, as the E-field strength attenuates with increasing distance (9), and distance-adjusted MT (9,10) have been proposed.
E-field modeling has informed TMS depression treatment by guiding coil targeting and exploring the dose–response relationship between E-field and clinical outcomes. For example, E-field models have been used in patients with alcohol use disorders (AUD) receiving TMS targeting the dorsolateral prefrontal cortex (DLPFC), medial prefrontal cortex (MPFC), and motor cortex (MC) (11). The E-field in MPFC was significantly lower than that in the DLPFC and MC. Patients with AUD, who exhibit decreased gray matter volume compared to healthy controls, may require higher E-field doses to achieve the desired therapeutic effect (11). In another study on depressed adolescents receiving MRI-guided rTMS treatment, E-field modeling was used to compare DLPFC targeting approaches (3). The conventional 5-cm rule targeting resulted in the lowest DLPFC E-field compared to the F3 and MRI-guided targeting, which could partially explain negative clinical trial results utilizing the 5-cm rule in adolescents (12). Furthermore, the F3 method exhibited more variability in the induced E-field across individuals compared to the 5-cm and MRI-guided targets. Higher induced E-field strength in the left DLPFC correlated with greater reductions in Children’s Depression Rating Scale–Revised (CDRS) scores (3). Similarly, adult studies have also reported that higher induced E-field in the left and right DLPFC correlated with greater reduction in Inventory of Depressive Symptomatology (IDS) scores (13,14).
The cost of performing E-field modeling for TMS targeting and dosing involves expenses related to imaging, data processing, computational resources, system equipment, and personnel training. Constructing a subject-specific head model for accurate E-field simulations require at least a high-resolution structural MRI scan (T1-weighted; ideally also a T2-weighted scan, and optionally a diffusion-weighted scan). When acquiring fMRI to guide TMS targeting, the cost of additional structural imaging may be marginal. It may also be feasible to approximate the field strength from a template head model in the absence of individual neuroimaging data (15), though this may result in trade-off with accuracy. The cost of software for E-field modeling can vary. Certain software packages are open-source, easily accessible, and user-friendly, while others are commercial, demanding licensing fees and necessitating a higher degree of specialized expertise to operate. Additional computational resources, such as high-performance computing services may be needed to run optimization algorithms that require many E-field simulations. Finally, to extract the greatest benefit from the simulations and optimization, neuronavigation and coil holder systems are required for precise TMS coil placement and tracking during the intervention.
3. Computational approach
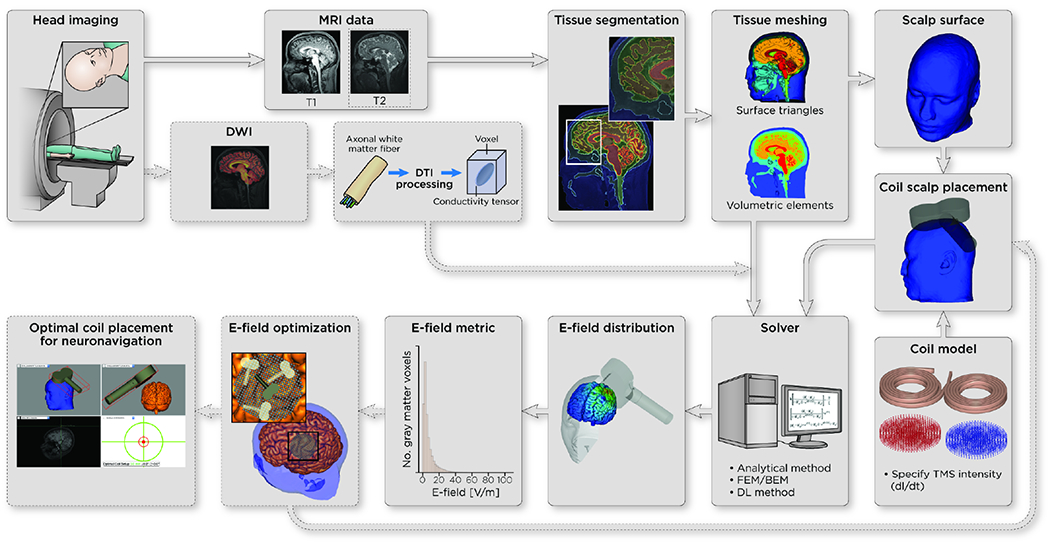
In the following sections, we describe E-field modeling methodology (refer to Figure 1), including TMS physics, coil and head model complexity and various numerical techniques.
Figure 1.
Pipeline of E-field modeling methods: head imaging using magnetic resonance imaging (MRI), tissue segmentation, diffusion weighted/tensor imaging (DWI/DTI), surface or volumetric meshing of the segmentation, coil model selection and intensity specifications, coil placement on scalp, (numerical) E-field solver, E-field extraction/visualization/statistics, and optional repeated utilization to find the most optimal coil scalp placement, and usage in neuronavigation.
3.1. TMS physics and what quantities are being solved
The physics underlying TMS is the phenomenon of electromagnetic induction, a changing magnetic field induces an E-field within a conductor. The magnetic field pulses have relatively low frequencies (< 10 kHz), thus can be analyzed within the quasi-static regime (16). In this regime, conduction currents within the head are assumed to have negligible inductive coupling effects. As a result, the magnetic field can be completely described by the magnetic vector potential (A) induced by the TMS coil within free space. The overall induced E-field (E) is composed of two distinct contributions. The primary component, , is linked to the coil’s changing magnetic field: . To calculate , the Biot-Savart law can be employed (17). The secondary E-field component, , originates from electric charge accumulation at tissue interfaces with varying conductivities, generating an additional effect (; where φ is the electric potential). The determination of involves solving the relationship:
| (Equation 1) |
where σ is the tissue conductivity. This equation is subject to the Neumann boundary condition, which ensures the continuity of the normal component of the current density through any boundary (no charge accumulation in time).
3.2. Head modeling
The TMS-induced E-field is relatively insensitive to nominal changes in tissue (18). Due to the low skull conductivity, generated by charges at the scalp–air and scalp–skull boundaries are largely blocked from reaching the brain. Consequently, the E-fields within the brain predominantly affected by the boundary shapes of intracranial compartments, particularly skull–cerebrospinal fluid (CSF) and CSF–gray matter (GM) interfaces (19,20).
To represent the intricate composition of head tissues, modeling approaches range from approximations using spherical models to more precise mesh-based representations incorporating polyhedra, to account for realistic tissue volume and surface. Concentric sphere and multisphere (21) head model have been used due to its simplified geometry that allows for analytical solutions to be computed (22). However, spherical models fall short in accurately representing head shape or complex geometric details, such as cortical gyrification (23) that substantially influences the local E-field (19). In contrast, anatomically realistic head models derived from individual neuroimaging modalities, such as structural magnetic resonance imaging (MRI), necessitate numerical solutions but provide significantly enhanced E-field predictions compared to spherical approximations. Different tissues (scalp, skull, CSF, GM, white matter (WM)) are first segmented from the structural images of the head, then converted into a mesh of interconnected elements. The accurate representation of the discretized tissues (computational mesh) is generally important to avoid anomalies during the subsequent numerical solving step. Quality of the mesh can be improved by using adaptive mesh refinement for thin tissues (24), as well as preventing intersecting defects, self-intersections, and ensuring an adequate number of elements (25).
Electrical conductivity values are assigned to different tissues based on empirical data or literature. These conductivity values are typically assumed to be constant within the mesh element and tissues. Conductivity anisotropy can be modeled in the WM using tensors derived from diffusion-weighted MRI and has been shown to increase E-field magnitude perpendicular to the gyrus (23). When considering WM conductivity anisotropy, a notable enhancement of up to +7% in WM E-field magnitude is anticipated for strictly perpendicular TMS coil placements, rising to approximately +40% otherwise. In WM regions with large principal fiber bundle directions connecting different lobes of the brain (e.g., corpus callosum, arcuate fasciculus), the anisotropy-caused E-field increase is most pronounced.
3.3. Coil modeling
After the head model generation, the TMS coil geometry and characteristics need to be incorporated. This involves representing the coil’s winding geometry, size, orientation, and current flow. The coil′s field output can be modeled using varying levels of abstraction to strike a balance between computational efficiency and accuracy. These approaches encompass treating the coil’s wire windings as continuous, segmented entities, or even as electric and magnetic dipoles. Gomez et al. (25) recommended to model coil winding with rectangular cross-sections and discrete turn or use over 3000 distributed current dipoles or >200 distributed magnetic dipoles to reduce the numerical error below 2% (25). Recently, calibrated magnetic dipole coil models for the 25 most widely used coil types have been made available (26). Analyzing the E-field characteristics of distinct TMS coils can guide the selection.
3.4. E-field solver
Various approaches (Table S1) are available to solve for the E-field distribution. For spherical head models, analytical expressions can be obtained for the overall E-field (17,27). Numerical techniques primarily adopt a fundamental approach of approximating the unknown field through a summation of basis functions.
Classical numerical methods employed for TMS simulations encompass the finite difference method (FDM), finite element method (FEM), and boundary element method (BEM). FDM starts from a head voxel approximation (e.g., tissue segmentation; (28)) and minimizes the residual error of nodal potentials and gradients in the voxel mesh (29). In contrast, FEM integrates a testing function multiplied with the residual approximating the same solution. FEM holds a distinct advantage over FDM due to its capacity to represent smooth head tissue surfaces through adaptable polyhedral-type elements. BEM formulates the problem as equivalent integral equations assuming constant conductivities between the tissue surfaces (30–34).
To speed up computations, classical numerical techniques can be optimized through modifications, including the adoption of different strategies for direct, using precalculated matrix factorization (35) and inversion (36), or accelerated iterative (37) solvers using multi-grid methods (28). For specific applications, if the E-field is only needed in limited cortical region under the coil (not whole brain), electromagnetic equivalency principles (reciprocity (2,38) or Huygen’s principle (39)) can be exploited.
Novel approaches using machine learning techniques offer possibilities to determine subject-specific E-fields without the time-consuming anatomical head modeling efforts ((40), Table S1). In such approaches, the mapping from individual structural MRI to E-fields (computed by conventional numerical methods) is learned through a supervised learning framework (41). Alternatively, given a head model and , a self-supervised deep learning model can be trained to solve for the total E-field (42).
3.5. Software packages
Open-source and commercial software can be utilized to run parts or an entire TMS E-field modeling pipeline, including coil placement optimization. For example, SimNIBS (35) can take MRI (single T1, optional: T2/DTI) data as inputs, generate head and coil model, and solve TMS simulations numerically. SCIRun (43) is another open-source package that simulate TMS E-fields with an input head model. Other commercial tools such as Sim4Life (44) and other multiphysics packages such as ANSYS Maxwell (45) or COMSOL (46) can also be utilized to perform E-field simulations. Some of these multiphysics tools may require additional software (e.g., SimpleWare ScanIP (47)) to generate the head model from the imaging data, but are more flexible in incorporating non-standard coil models or more complex geometries.
4. Using the E-field: metrics, optimal brain targeting
4.1. E-field metrics
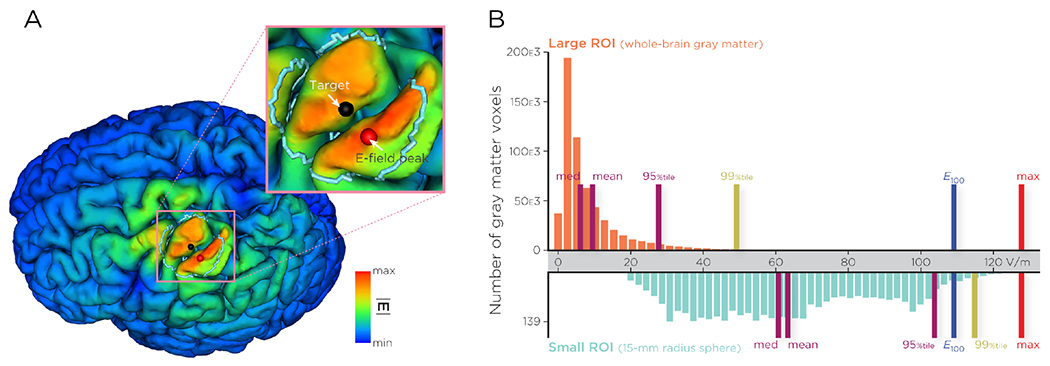
Given a brain ROI, the voxel-wise E-field magnitude can be summarized using standard descriptive statistics such as maximum, mean, median, or percentile. In choosing a suitable summary metric, it is important for the metric to be resilient against computational inaccuracies. Since computational methods adopt a variational framework to reduce the error, pointwise estimates (e.g., the E-field maximum at tissue boundaries) could be inaccurate, even if the solution is globally accurate. In addition, the E-field maximum may not be located within the targeted region due to local gyrification. In an example illustrated in Figure 2A, the TMS coil was placed to maximize the E-field strength at the motor cortex target (black dot), however, since the adjacent gyrus has smaller coil-to-cortex distance, the peak E-field is induced outside of the target (within an arbitrarily chosen ROI of 15mm radius) in the post-central gyrus (red dot). The average E-field within the ROI is also not a reliable metric in many cases, since cortical E-field distribution is skewed to smaller values (Figure 2B). Other metrics such as median and percentiles also depend heavily on the size of the ROI (see Figure 2B). Alternatively, certain metrics aim to determine an E-field value that guarantees a specified volume with the ROI exposed to an E-field exceeding that strength. For instance, the notation “E100” denotes the E-field strength value that at least 100 ROI voxels are exposed to (48,49). The E100 (and its variations such as E50, E20, etc.) is invariant to ROI size (if there are an adequate number of voxels) as illustrated in Figure 2.
Figure 2.
(A) Simulated TMS-induced cortical E-field (Ernie model generated from SimNIBS’s mri2mesh pipeline using MagVenture Cool-B65 coil model at stimulation intensity of 50%MSO). The TMS coil was placed to maximize the E-field strength at the motor cortex target (black dot in precentral gyrus), however, since the adjacent gyrus has smaller coil-to-cortex distance, the peak E-field is induced outside of the target in the postcentral gyrus (red dot). (B) E-field values extracted from a large ROI (whole-brain gray matter) and a smaller ROI (turquoise, 15-mm radius sphere outlined in (A). Different E-field metrics (mean, median, 95%tile, 99%tile, E100, and maximum) are indicated. E100 denotes the E-field strength that at least 100 ROI voxels are exposed to. Note that some E-field metrics, such as the mean, median, and percentiles, depend heavily on the size of the ROI, whereas E100 is invariant to ROI size.
4.2. TMS coil placement optimization for maximal ROI E-field
E-field dosimetry tools offer the capability to select the most favorable coil placement from an array of potential setups, aiming to maximize the E-field delivered to a specific target ROI. These ROIs are commonly derived either from structural or functional neuroimaging data. In this section, we briefly review methods for target identification and strategies for coil optimization.
4.2.1. Target identification
Various approaches are utilized to identify ROIs for TMS targeting, employing both structural and functional neuroimaging methods. Structural-based strategies rely on anatomical (50) or scalp (3) landmarks to pinpoint TMS targets. For example, DTI-guided TMS specifically targets fiber bundles near cortical surfaces anatomically connected to deeper brain structures (51–54). Alternatively, fMRI-guided TMS often employs seed-based functional activation or connectivity during task or at rest (55–57). Individualized fMRI-based targeting has been shown to be more effective than group-based targeting using TMS (58,59). An alternative functional-based method involves positron emission tomography (PET) imaging, which quantifies regional cerebral blood flow within a predefined ROI (60,61). Despite its potential to enhance TMS targeting accuracy, PET-guided rTMS has been found to be equally effective as the 5-cm rule in a depression study (62). These approaches have limitations as they focus solely on the seed region and may not account for activations beyond it (63–65). Graph-based network analysis of fMRI provides a holistic view of whole-brain connectivity to identify ROIs based on connectivity parameters (66–68). Recent studies have integrated fMRI analysis with computational techniques to optimize coil placement and orientation within predefined ROIs (66,69–71).
4.2.2. Coil placement optimization
Identifying optimal coil placements involves evaluating numerous candidate coil configurations to select the one that maximizes the chosen metric of the ROI E-field component or magnitude. Generally, minor variations in coil location and orientation result in gradual spatial changes of the E-field (e.g., (2)). The precision in coil placement that can be achieved by manual or robotic coil holding is on the order of 1 mm and 1° orientation (49,72). The number of candidate coil configurations should be chosen to balance computational effort and practicality of the physical coil placement.
The search through candidate coil configurations represents an optimization problem, which to date, has been solved for TMS using (1) a genetic algorithm (73) and (2) a discrete search approach (e.g., (2,35)). Inspired from natural selection in evolution, genetic algorithms starts with a random set (‘population’) of coil placements and iteratively produce new instances (‘generations’) that, on average, improve the previous ones, eventually converging to the optimal placement (73). The discrete search is another approach, which is implemented in the prominent open-source software package SimNIBS (35). This method uses a search procedure on a discrete grid of candidates to find the optimal coil placement with maximal E-field averaged across the ROI mesh elements. SimNIBS serves also as the computational backbone for three TMS targeting pipelines: TArgeted functional Network Stimulation (TANS, (66)), the TMS targeting pipeline by Balderston et al. (74), and Targeting and Analysis Pipeline (TAP, (49)). In additional to the head model generated by SimNIBS, the labeled target ROI (*.nii NIFTI file format) is provided as input. The TMS targeting pipeline and TANS both aim to determine the best coil placement using fMRI data. The former does so by defining a spherical region around task-evoked peak activity (within a group mask), while the latter maximizes the cortical overlap between resting-state activity and the simulated E-field. Both pipelines have similar computational complexities, and the overall run-time has been reported to be 24–48h (74), including head model generation (up to 15h), solve and output file writing time (20–30minutes per coil position, for several hundred candidate positions). Since each simulation does not depend on another, all simulations could be run in parallel on a high-performance compute cluster. Both pipelines focus on maximizing the ROI E-field magnitude only. Additionally, TANS also allows for minimizing non-ROI E-fields.
SimNIBS offers a more efficient way to perform coil placement optimization, in which only a single target coordinate together with radius specifies all gray matter elements of the ROI. With the Pardiso direct solver a single TMS simulation takes only a few seconds computation time (see Table 1). Alternatively, the auxiliary dipole method (ADM) is implemented in SimNIBS, which offers an even faster technique to find the optimal coil placement. ADM exploits a specific electromagnetic equivalency principle of reciprocity which allows to drastically reduce computation for dense coil placement optimization (i.e., up to millions of candidate positions) time on a regular computer to a few minutes.
TAP uses ADM and allows for additional functionality such as optimizing the coil placement based on an E-field component (i.e., perpendicular to cortex derived from normal direction of closest sulci wall). This optimization constraint is supported by SimNIBS and may restrict the coil orientation with the coil handle also being perpendicular to the sulci wall of a TMS coil. A coil orientation perpendicular to the sulci wall has been reported in studies of the motor cortex (75–77) and is commonly applied in TMS interventions. TAP also offers possibilities to scale the TMS coil current intensity based on %MSO and to deliver a particular ROI-induced E-field value for a chosen metric.
5. Clinical applications
Present E-field modeling aims to develop better methods for achieving consistent TMS dosing across individuals to reduce variability in interventional outcomes. Within the context of TMS motor mapping, hotspots and input–output functions are assessed. The sigmoidal input–output curve estimates the amount of neuronal recruitment as a function of stimulus intensity, represented as either %MSO or simulated motor E-fields (78,79). E-field modeling has been instrumental in quantifying the requisite intensity and pinpointing the representation of muscle groups within the primary motor cortex (79,80). Cortical locations and thresholds for muscle activation can be color-coded to visualize MEPs, statistical measures, and combined with simulated E-field estimates (79–82). The approach provides an opportunity to systematically understand the dose–response relationships of different muscle groups, including their interindividual variability.
To ensure uniform dosing across participants, a study using rTMS to enhance working memory in a group of older adults used E-field models to deliver a predetermined E-field dose to an individual peak fMRI activation hotspot in the left lateral parietal cortex (48). The E-field dose was set at 56 V/m, which represents the participant-averaged E100 value from pilot findings (48). The E-field model also considered hair thickness to further refine the coil-to-cortex distance. Utilizing this E-field model-inform dosing strategy, a site-specific effect of rTMS were observed, resulting in the downregulation of working memory. Another approach to achieving uniform dosing is the “A Personalized E-field X” (APEX) method (83), which integrates MT measurements and E-field modeling to reduce over- and under-dosing in the prefrontal cortex stimulation. The E-field at the motor hotspot that corresponded to 100% rMT stimulation intensity was modeled. Stimulation intensity at the prefrontal cortex was set to achieve the equivalent E-field strength as 100% rMT stimulation over the motor cortex. However, this method has not been used in any clinical study prospectively.
E-field-based coil placement optimization pipelines have been proposed to enhance treatment outcomes in patients with psychiatric disorders. For instance, the TAP was used in a group of depressed adolescents; it was shown that the model-derived coil placement produced a higher E-field in the DLPFC target compared to the 5-cm, F3, and MRI-guided targets (3). Similarly, the TANS approach was used in a sample of healthy controls and depressed patients to maximize induced E-field within a targeted functional network and therefore improving the stimulation specificity (66). TANS achieved significantly more selective stimulation of the frontoparietal network in the patient group, and fMRI-based targeting of the somatomotor network in the healthy controls compared to ADM. Overall, TANS increased the on-target value by approximately 51% compared to using the ADM method. This method produces higher intervariability compared to the ADM method but could be beneficial for subtypes of depression. However, TANS has not yet been integrated into a prospectively treatment study for TMS target selection.
Some of these E-field optimization techniques are being integrated into multiple ongoing clinical trials. For example, the TAP approach is presently being used in the depression treatment study (Concurrent fMRI-guided rTMS and Cognitive Therapy for Treatment of Major Depressive Episodes study, NCT03289923). TAP informs the optimal TMS coil placement to deliver stimulation to an individually targeted region of the DLPFC identified via task fMRI. Additionally, the Adaptive Trial for the Treatment of Depressive Symptoms associated with Concussion using Repetitive Transcranial Magnetic Stimulation Protocols study (NCT05426967) is conducting in-between comparisons between scalp targeting, structural targeting, and individualized connectome targeting and E-field modeling to deliver maximum E-field magnitude to the target region. These studies aim to improve and optimize therapeutic effects by using E-field modeling to account for individual differences and maximize dose delivery and target engagement.
6. Conclusions
There are several pivotal avenues where the integration of E-field modeling can profoundly impact the practice of TMS. First, E-field modeling holds promise for enhancing TMS dosing precision. Subject-specific, anatomically accurate computational models can provide detailed insights into the distribution and magnitude of induced E-fields within the brain. This capability can enhance the precision of TMS dosing, allowing for individualized stimulation strategies that account for individual variability in head anatomy and tissue conductivity. The emergence of rapid E-field solvers presents opportunities for real-time applications within neuronavigation and closed-loop paradigms. By combining E-field modeling with systems such as electroencephalography, TMS coil placement and intensity can be dynamically updated to optimize stimulation based on real-time brain activity patterns. The combination of TMS with neuroimaging methods opens doors to systematically mapping dose–response relationships for both motor and non-motor regions of interest. Finally, a compelling direction involves synergizing E-field simulations with neuronal and plasticity models to gain deeper insights into the mechanisms underlying TMS effects. This integration offers the potential to unravel how TMS modulates neural circuits and plasticity processes, thereby illuminating the intricate workings of TMS-induced neurophysiological changes. Finally, it is essential to acknowledge that despite the promising insights provided by E-field modeling, there may be limitations and challenges associated with its application. To fully harness the potential benefits, experimental verification of strategies informed by E-field modeling is necessary.
Supplementary Material
Acknowledgments:
M.D., P.L.R., and Z.D. and are supported by the National Institute of Mental Health (NIMH) Intramural Research Program (ZIAMH002955). We thank Mr. Ethan Tyler from NIH Medical Arts for assisting with the illustration in Figure 1.
Footnotes
Publisher's Disclaimer: This is a PDF file of an unedited manuscript that has been accepted for publication. As a service to our customers we are providing this early version of the manuscript. The manuscript will undergo copyediting, typesetting, and review of the resulting proof before it is published in its final form. Please note that during the production process errors may be discovered which could affect the content, and all legal disclaimers that apply to the journal pertain.
Financial disclosures: H.R.S. has received honoraria as speaker from Sanofi Genzyme, Denmark and Novartis, Denmark, as consultant from Sanofi Genzyme, Denmark, Lophora, Denmark, and Lundbeck AS, Denmark, and as editor-in-chief (Neuroimage Clinical) and senior editor (NeuroImage) from Elsevier Publishers, Amsterdam, The Netherlands. He has received royalties as book editor from Springer Publishers, Stuttgart, Germany and from Gyldendal Publishers, Copenhagen, Denmark. All other authors report no biomedical financial interests or potential conflicts of interest.
References
- 1.Lefaucheur J-P, André-Obadia N, Antal A, Ayache SS, Baeken C, Benninger DH, et al. (2014): Evidence-based guidelines on the therapeutic use of repetitive transcranial magnetic stimulation (rTMS). Clin Neurophysiol 125: 2150–2206. [DOI] [PubMed] [Google Scholar]
- 2.Gomez LJ, Dannhauer M, Peterchev AV (2021): Fast computational optimization of TMS coil placement for individualized electric field targeting. Neuroimage 228: 117696. [DOI] [PMC free article] [PubMed] [Google Scholar]
- 3.Deng Z-D, Robins PL, Dannhauer M, Haugen LM, Port JD, Croarkin PE (2023): Comparison of coil placement approaches targeting dorsolateral prefrontal cortex in depressed adolescents receiving repetitive transcranial magnetic stimulation: an electric field modeling study. medRxiv 2023–02. [DOI] [PMC free article] [PubMed] [Google Scholar]
- 4.Lee EG, Rastogi P, Hadimani RL, Jiles DC, Camprodon JA (2018): Impact of non-brain anatomy and coil orientation on inter-and intra-subject variability in TMS at midline. Clin Neurophysiol 129: 1873–1883. [DOI] [PMC free article] [PubMed] [Google Scholar]
- 5.Julkunen P, Säisänen L, Danner N, Awiszus F, Könönen M (2012): Within-subject effect of coil-to-cortex distance on cortical electric field threshold and motor evoked potentials in transcranial magnetic stimulation. J Neurosci Methods 206: 158–164. [DOI] [PubMed] [Google Scholar]
- 6.Lu H, Lam LC, Ning Y (2019): Scalp-to-cortex distance of left primary motor cortex and its computational head model: Implications for personalized neuromodulation. CNS Neurosci Ther 25: 1270–1276. [DOI] [PMC free article] [PubMed] [Google Scholar]
- 7.Zhang J, Treyer V, Sun J, Zhang C, Gietl A, Hock C, et al. (2023): Automatic analysis of skull thickness, scalp-to-cortex distance and association with age and sex in cognitively normal elderly. Brain Stimul Basic Transl Clin Res Neuromodulation 16: 653–656. [DOI] [PubMed] [Google Scholar]
- 8.Lu H, Li J, Zhang L, Chan SSM, Lam LCW, Studies OAS of I (2021): Dynamic changes of region-specific cortical features and scalp-to-cortex distance: implications for transcranial current stimulation modeling. J NeuroEngineering Rehabil 18: 1–12. [DOI] [PMC free article] [PubMed] [Google Scholar]
- 9.Stokes MG, Chambers CD, Gould IC, English T, McNaught E, McDonald O, Mattingley JB (2007): Distance-adjusted motor threshold for transcranial magnetic stimulation. Clin Neurophysiol 118: 1617–1625. [DOI] [PubMed] [Google Scholar]
- 10.Stokes MG, Chambers CD, Gould 1C, Henderson TR, Janko NE, Allen NB, Mattingley JB (2005): Simple metric for scaling motor threshold based on scalp-cortex distance: application to studies using transcranial magnetic stimulation. J Neurophysiol 94: 4520–4527. [DOI] [PubMed] [Google Scholar]
- 11.Philip NS, Sorensen DO, McCalley DM, Hanlon CA (2020): Non-invasive brain stimulation for alcohol use disorders: state of the art and future directions. Neurotherapeutics 17: 116–126. [DOI] [PMC free article] [PubMed] [Google Scholar]
- 12.Croarkin PE, Elmaadawi AZ, Aaronson ST, Schrodt GR Jr, Holbert RC, Verdoliva S, et al. (2021): Left prefrontal transcranial magnetic stimulation for treatment-resistant depression in adolescents: a double-blind, randomized, sham-controlled trial. Neuropsychopharmacology 46: 462–469. [DOI] [PMC free article] [PubMed] [Google Scholar]
- 13.Quinn DK, Upston J, Jones TR, Gibson BC, Olmstead TA, Yang J, et al. (2023): Electric field distribution predicts efficacy of accelerated intermittent theta burst stimulation for late-life depression. Front Psychiatry 14. [DOI] [PMC free article] [PubMed] [Google Scholar]
- 14.Zhang BB, Stöhrmann P, Godbersen GM, Unterholzner J, Kasper S, Kranz GS, Lanzenberger R (2022): Normal component of TMS-induced electric field is correlated with depressive symptom relief in treatment-resistant depression. Brain Stimul Basic Transl Clin Res Neuromodulation 15: 1318–1320. [DOI] [PubMed] [Google Scholar]
- 15.Cho JY, Van Hoornweder S, Sege CT, Antonucci MU, McTeague LM, Caulfield KA (2023): Template MRI scans reliably approximate individual and group-level tES and TMS electric fields induced in motor and prefrontal circuits. Front Neural Circuits 17. Retrieved October 24, 2023, from https://www.ncbi.nlm.nih.gov/pmc/articles/PMC10510202/ [DOI] [PMC free article] [PubMed] [Google Scholar]
- 16.Plonsey R, Heppner DB (1967): Considerations of quasi-stationarity in electrophysiological systems. Bull Math Biophys 29: 657–664. [DOI] [PubMed] [Google Scholar]
- 17.Sarvas J (1987): Basic mathematical and electromagnetic concepts of the biomagnetic inverse problem. Phys Med Biol 32: 11. [DOI] [PubMed] [Google Scholar]
- 18.Lee EG, Rastogi P, Hadimani RL, Jiles DC, Camprodon JA (2018): Impact of non-brain anatomy and coil orientation on inter-and intra-subject variability in TMS at midline. Clin Neurophysiol 129: 1873–1883. [DOI] [PMC free article] [PubMed] [Google Scholar]
- 19.Janssen A, Rampersad S, Lucka F, Lanfer B, Lew S, Aydin Ü, et al. (2013): The influence of sulcus width on simulated electric fields induced by transcranial magnetic stimulation. Phys Med Biol 58: 4881. [DOI] [PMC free article] [PubMed] [Google Scholar]
- 20.Rashed EA, Gomez-Tames J, Hirata A (2021): Influence of segmentation accuracy in structural MR head scans on electric field computation for TMS and tES. Phys Med Biol 66: 064002. [DOI] [PubMed] [Google Scholar]
- 21.Krieg SM, others (2017): Navigated Transcranial Magnetic Stimulation in Neurosurgery, vol. 299. Springer. [Google Scholar]
- 22.Deng Z-D, Lisanby SH, Peterchev AV (2013): Electric field depth-focality tradeoff in transcranial magnetic stimulation: simulation comparison of 50 coil designs. Brain Stimulat 6: 1–13. [DOI] [PMC free article] [PubMed] [Google Scholar]
- 23.Thielscher A, Opitz A, Windhoff M (2011): Impact of the gyral geometry on the electric field induced by transcranial magnetic stimulation. Neuroimage 54: 234–243. [DOI] [PubMed] [Google Scholar]
- 24.Weise K, Wartman WA, Knösche TR, Nummenmaa AR, Makarov SN (2022): The effect of meninges on the electric fields in TES and TMS. Numerical modeling with adaptive mesh refinement. Brain Stimulat 15: 654–663. [DOI] [PubMed] [Google Scholar]
- 25.Gomez LJ, Dannhauer M, Koponen LM, Peterchev AV (2020): Conditions for numerically accurate TMS electric field simulation. Brain Stimulat 13: 157–166. [DOI] [PMC free article] [PubMed] [Google Scholar]
- 26.Drakaki M, Mathiesen C, Siebner HR, Madsen K, Thielscher A (2022): Database of 25 validated coil models for electric field simulations for TMS. Brain Stimulat 15: 697–706. [DOI] [PubMed] [Google Scholar]
- 27.Heller L, van Hulsteyn DB (1992): Brain stimulation using electromagnetic sources: theoretical aspects. Biophys J 63: 129–138. [DOI] [PMC free article] [PubMed] [Google Scholar]
- 28.Laakso I, Hirata A (2012): Fast multigrid-based computation of the induced electric field for transcranial magnetic stimulation. Phys Med Biol 57: 7753. [DOI] [PubMed] [Google Scholar]
- 29.Laakso I, Hirata A (2012): Reducing the staircasing error in computational dosimetry of low-frequency electromagnetic fields. Phys Med Biol 57: N25. [DOI] [PubMed] [Google Scholar]
- 30.Song J, Lu C-C, Chew WC (1997): Multilevel fast multipole algorithm for electromagnetic scattering by large complex objects. IEEE Trans Antennas Propag 45: 1488–1493. [Google Scholar]
- 31.Makarov SN, Wartman WA, Daneshzand M, Fujimoto K, Raij T, Nummenmaa A (2020): A software toolkit for TMS electric-field modeling with boundary element fast multipole method: an efficient MATLAB implementation. J Neural Eng 17: 046023. [DOI] [PubMed] [Google Scholar]
- 32.Makarov SN, Noetscher GM, Raij T, Nummenmaa A (2018): A quasi-static boundary element approach with fast multipole acceleration for high-resolution bioelectromagnetic models. IEEE Trans Biomed Eng 65: 2675–2683. [DOI] [PMC free article] [PubMed] [Google Scholar]
- 33.Greengard L, Rokhlin V (1987): A fast algorithm for particle simulations. J Comput Phys 73: 325–348. [Google Scholar]
- 34.Ying L, Biros G, Zorin D (2004): A kernel-independent adaptive fast multipole algorithm in two and three dimensions. J Comput Phys 196: 591–626. [Google Scholar]
- 35.Thielscher A, Antunes A, Saturnino GB (2015): Field modeling for transcranial magnetic stimulation: a useful tool to understand the physiological effects of TMS? 2015 37th Annual International Conference of the IEEE Engineering in Medicine and Biology Society (EMBC) 222–225. [DOI] [PubMed] [Google Scholar]
- 36.Stenroos M, Koponen LM (2019): Real-time computation of the TMS-induced electric field in a realistic head model. Neuroimage 203: 116159. [DOI] [PubMed] [Google Scholar]
- 37.Paffi A, Camera F, Carducci F, Rubino G, Tampieri P, Liberti M, et al. (2015): A computational model for real-time calculation of electric field due to transcranial magnetic stimulation in clinics. Int J Antennas Propag 2015. [Google Scholar]
- 38.Wang D, Hasan NI, Dannhauer M, Yucel AC, Gomez LJ (2023): Fast computational E-field dosimetry for transcranial magnetic stimulation using adaptive cross approximation and auxiliary dipole method (ACA-ADM). NeuroImage 267: 119850. [DOI] [PMC free article] [PubMed] [Google Scholar]
- 39.Daneshzand M, Makarov SN, de Lara LIN, Guerin B, McNab J, Rosen BR, et al. (2021): Rapid computation of TMS-induced E-fields using a dipole-based magnetic stimulation profile approach. Neuroimage 237: 118097. [DOI] [PMC free article] [PubMed] [Google Scholar]
- 40.Yokota T, Maki T, Nagata T, Murakami T, Ugawa Y, Laakso I, et al. (2019): Real-time estimation of electric fields induced by transcranial magnetic stimulation with deep neural networks. Brain Stimulat 12: 1500–1507. [DOI] [PubMed] [Google Scholar]
- 41.Xu G, Rathi Y, Camprodon JA, Cao H, Ning L (2021): Rapid whole-brain electric field mapping in transcranial magnetic stimulation using deep learning. Plos One 16: e0254588. [DOI] [PMC free article] [PubMed] [Google Scholar]
- 42.Li H, Deng Z-D, Oathes D, Fan Y (2022): Computation of transcranial magnetic stimulation electric fields using self-supervised deep learning. NeuroImage 264: 119705. [DOI] [PMC free article] [PubMed] [Google Scholar]
- 43.Parker SG, Johnson CR (1995): SCIRun: a scientific programming environment for computational steering. Proceedings of the 1995 ACM/IEEE Conference on Supercomputing (CDROM) - Supercomputing ’95 52–es. [Google Scholar]
- 44.Neufeld E, Gosselin MC, Sczcerba D, Zefferer M, Kuster N (2012): Sim4Life: A medical image data based multiphysics simulation platform for computational life sciences. Proceedings of the VPH 2012 Congress (VPH 2012). Retrieved October 24, 2023, from https://www.research-collection.ethz.ch/handle/20.500.11850/62467
- 45.Martyanov AS, Neustroyev NI (2014): ANSYS Maxwell Software for electromagnetic field calculations. East Eur Sci J. Retrieved October 24, 2023, from http://journale.aurisverlag.de/index.php/EESJ/article/view/231 [Google Scholar]
- 46.Pryor RW (2009): Multiphysics Modeling Using COMSOL®: A First Principles Approach. Jones & Bartlett Publishers. Retrieved October 24, 2023, from https://books.google.com/books?hl=en&lr=&id=NWeYVaDnmfcC&oi=fnd&pg=PP1&dq=comsol+multiphysics&ots=tBIwo2AoLm&sig=NfVHVJ35Kxs8_TomPlqOxUWkmHg [Google Scholar]
- 47.Pettersen F-J, Høgetveit JO (2011): From 3D tissue data to impedance using Simpleware ScanFE+IP and COMSOL Multiphysics – a tutorial. J Electr Bioimpedance 2: 13–32. [Google Scholar]
- 48.Beynel L, Davis SW, Crowell CA, Dannhauer M, Lim W, Palmer H, et al. (2020): Site-specific effects of online rTMS during a working memory task in healthy older adults. Brain Sci 10: 255. [DOI] [PMC free article] [PubMed] [Google Scholar]
- 49.Dannhauer M, Huang Z, Beynel L, Wood E, Bukhari-Parlakturk N, Peterchev AV (2022): TAP: Targeting and analysis pipeline for optimization and verification of coil placement in transcranial magnetic stimulation. J Neural Eng 19: 026050. [DOI] [PMC free article] [PubMed] [Google Scholar]
- 50.Rusjan PM, Barr MS, Farzan F, Arenovich T, Maller JJ, Fitzgerald PB, Daskalakis ZJ (2010): Optimal Transcranial Magnetic Stimulation Coil Placement for Targeting the Dorsolateral Prefrontal Cortex Using Novel Magnetic Resonance Image-Guided Neuronavigation. Wiley Online Library. [DOI] [PMC free article] [PubMed] [Google Scholar]
- 51.Luber B, Davis SW, Deng Z-D, Murphy D, Martella A, Peterchev AV, Lisanby SH (2022): Using diffusion tensor imaging to effectively target TMS to deep brain structures. NeuroImage 249: 118863. [DOI] [PMC free article] [PubMed] [Google Scholar]
- 52.Chen Y-C, Ton That V, Ugonna C, Liu Y, Nadel L, Chou Y (2022): Diffusion MRI–guided theta burst stimulation enhances memory and functional connectivity along the inferior longitudinal fasciculus in mild cognitive impairment. Proc Natl Acad Sci 119: e2113778119. [DOI] [PMC free article] [PubMed] [Google Scholar]
- 53.Silva LL, Tuncer MS, Vajkoczy P, Picht T, Rosenstock T (2021): Distinct approaches to language pathway tractography: comparison of anatomy-based, repetitive navigated transcranial magnetic stimulation (rTMS)–based, and rTMS-enhanced diffusion tensor imaging–fiber tracking. J Neurosurg 136: 589–600. [DOI] [PubMed] [Google Scholar]
- 54.Tao Q, Yang Y, Yu H, Fan L, Luan S, Zhang L, et al. (2020): Anatomical connectivity-based strategy for targeting transcranial magnetic stimulation as antidepressant therapy. Front Psychiatry 11: 236. [DOI] [PMC free article] [PubMed] [Google Scholar]
- 55.Beynel L, Dannhauer M, Palmer H, Hilbig SA, Crowell CA, Wang JE-H, et al. (2021): Network-based rTMS to modulate working memory: The difficult choice of effective parameters for online interventions. Brain Behav 11: e2361. [DOI] [PMC free article] [PubMed] [Google Scholar]
- 56.Bagattini C, Brignani D, Bonnì S, Quattrini G, Gasparotti R, Pievani M (2021): Functional imaging to guide network-based TMS treatments: toward a tailored medicine approach in Alzheimer’s disease. Front Neurosci 15: 687493. [DOI] [PMC free article] [PubMed] [Google Scholar]
- 57.Fox MD, Buckner RL, White MP, Greicius MD, Pascual-Leone A (2012): Efficacy of transcranial magnetic stimulation targets for depression is related to intrinsic functional connectivity with the subgenual cingulate. Biol Psychiatry 72: 595–603. [DOI] [PMC free article] [PubMed] [Google Scholar]
- 58.Sack AT, Kadosh RC, Schuhmann T, Moerel M, Walsh V, Goebel R (2009): Optimizing functional accuracy of TMS in cognitive studies: a comparison of methods. J Cogn Neurosci 21: 207–221. [DOI] [PubMed] [Google Scholar]
- 59.Menardi A, Ozdemir RA, Momi D, Tadayon E, Boucher P, Vallesi A, et al. (2022): Effect of group-based vs individualized stimulation site selection on reliability of network-targeted TMS. NeuroImage 264: 119714. [DOI] [PubMed] [Google Scholar]
- 60.Zhang M, Wang R, Luo X, Zhang S, Zhong X, Ning Y, Zhang B (2021): Repetitive transcranial magnetic stimulation target location methods for depression. Front Neurosci 15: 695423. [DOI] [PMC free article] [PubMed] [Google Scholar]
- 61.Plewnia C, Reimold M, Najib A, Reischl G, Plontke SK, Gerloff C (2006): Moderate therapeutic efficacy of PET-navigated repetitive transcranial magnetic stimulation against chronic tinnitus: a randomised, controlled pilot study. J Neurol Neurosurg Psychiatry. [DOI] [PMC free article] [PubMed] [Google Scholar]
- 62.Paillère Martinot M-L, Galinowski A, Ringuenet D, Gallarda T, Lefaucheur J-P, Bellivier F, et al. (2010): Influence of prefrontal target region on the efficacy of repetitive transcrania magnetic stimulation in patients with medication-resistant depression: a [18F]-fluorodeoxyglucose PET and MRI study. Int J Neuropsychopharmacol 13: 45–59. [DOI] [PubMed] [Google Scholar]
- 63.Fox MD, Raichle ME (2007): Spontaneous fluctuations in brain activity observed with functional magnetic resonance imaging. Nat Rev Neurosci 8: 700–711. [DOI] [PubMed] [Google Scholar]
- 64.Sohn WS, Yoo K, Lee Y-B, Seo SW, Na DL, Jeong Y (2015): Influence of ROI selection on resting state functional connectivity: an individualized approach for resting state fMRI analysis. Front Neurosci 9: 280. [DOI] [PMC free article] [PubMed] [Google Scholar]
- 65.Marrelec G, Fransson P (2011): Assessing the influence of different ROI selection strategies on functional connectivity analyses of fMRI data acquired during steady-state conditions. PloS One 6: e14788. [DOI] [PMC free article] [PubMed] [Google Scholar]
- 66.Lynch CJ, Elbau IG, Ng TH, Wolk D, Zhu S, Ayaz A, et al. (2022): Automated optimization of TMS coil placement for personalized functional network engagement. Neuron 110: 3263–3277. [DOI] [PMC free article] [PubMed] [Google Scholar]
- 67.Wang J, Zuo X, He Y (2010): Graph-based network analysis of resting-state functional MRI. Front Syst Neurosci 4: 1419. [DOI] [PMC free article] [PubMed] [Google Scholar]
- 68.Medaglia JD (2017): Graph theoretic analysis of resting state functional MR imaging. Neuroimaging Clin 27: 593–607. [DOI] [PMC free article] [PubMed] [Google Scholar]
- 69.Opitz A, Fox MD, Craddock RC, Colcombe S, Milham MP (2016): An integrated framework for targeting functional networks via transcranial magnetic stimulation. Neuroimage 127: 86–96. [DOI] [PMC free article] [PubMed] [Google Scholar]
- 70.Harita S, Momi D, Mazza F, Griffiths JD (2022): Mapping inter-individual functional connectivity variability in TMS targets for major depressive disorder. Front Psychiatry 13: 902089. [DOI] [PMC free article] [PubMed] [Google Scholar]
- 71.Cao Z, Xiao X, Zhao Y, Jiang Y, Xie C, Paillère-Martinot M-L, et al. (2023): Targeting the pathological network: feasibility of network-based optimization of transcranial magnetic stimulation coil placement for treatment of psychiatric disorders. Front Neurosci 16: 1079078. [DOI] [PMC free article] [PubMed] [Google Scholar]
- 72.Shin H, Jeong H, Ryu W, Lee G, Lee J, Kim D, et al. (2023): Robotic transcranial magnetic stimulation in the treatment of depression: a pilot study. Sci Rep 13: 14074. [DOI] [PMC free article] [PubMed] [Google Scholar]
- 73.Lu S, Jiang H, Li C, Hong B, Zhang P, Liu W (2022): Genetic algorithm for TMS coil position optimization in stroke treatment. Front Public Health 9: 794167. [DOI] [PMC free article] [PubMed] [Google Scholar]
- 74.Balderston NL, Roberts C, Beydler EM, Deng Z-D, Radman T, Luber B, et al. (2020): A generalized workflow for conducting electric field–optimized, fMRI-guided, transcranial magnetic stimulation. Nat Protoc 15: 3595–3614. [DOI] [PMC free article] [PubMed] [Google Scholar]
- 75.Balslev D, Braet W, McAllister C, Miall RC (2007): Inter-individual variability in optimal current direction for transcranial magnetic stimulation of the motor cortex. J Neurosci Methods 162: 309–313. [DOI] [PubMed] [Google Scholar]
- 76.Corthout E, Barker A, Cowey A (2001): Transcranial magnetic stimulation: Which part of the current waveform causes the stimulation? Exp Brain Res 141: 128–132. [DOI] [PubMed] [Google Scholar]
- 77.Kammer T, Beck S, Thielscher A, Laubis-Herrmann U, Topka H (2001): Motor thresholds in humans: a transcranial magnetic stimulation study comparing different pulse waveforms, current directions and stimulator types. Clin Neurophysiol 112: 250–258. [DOI] [PubMed] [Google Scholar]
- 78.Li Z, Peterchev AV, Rothwell JC, Goetz SM (2022): Detection of motor-evoked potentials below the noise floor: rethinking the motor stimulation threshold. J Neural Eng 19: 056040. [DOI] [PMC free article] [PubMed] [Google Scholar]
- 79.Weise K, Numssen O, Thielscher A, Hartwigsen G, Knösche TR (2020): A novel approach to localize cortical TMS effects. Neuroimage 209: 116486. [DOI] [PubMed] [Google Scholar]
- 80.Weise K, Numssen O, Kalloch B, Zier AL, Thielscher A, Haueisen J, et al. (2023): Precise motor mapping with transcranial magnetic stimulation. Nat Protoc 18: 293–318. [DOI] [PubMed] [Google Scholar]
- 81.Bungert A, Antunes A, Espenhahn S, Thielscher A (2017): Where does TMS stimulate the motor cortex? Combining electrophysiological measurements and realistic field estimates to reveal the affected cortex position. Cereb Cortex 21\ 5083–5094. [DOI] [PubMed] [Google Scholar]
- 82.Seynaeve L, Haeck T, Gramer M, Maes F, De Vleeschouwer S, Van Paesschen W (2019): Optimized preoperative motor cortex mapping in brain tumors using advanced processing of transcranial magnetic stimulation data. NeuroImage Clin 21: 101657. [DOI] [PMC free article] [PubMed] [Google Scholar]
- 83.Caulfield KA, Li X, George MS (2021): Four electric field modeling methods of dosing prefrontal transcranial magnetic stimulation (TMS): introducing APEX MT dosimetry. Brain Stimul Basic Transl Clin Res Neuromodulation 14: 1032–1034. [DOI] [PMC free article] [PubMed] [Google Scholar]
Associated Data
This section collects any data citations, data availability statements, or supplementary materials included in this article.