

Abstract
Background and Aims.
Body fat distribution, i.e., visceral (VAT), subcutaneous adipose tissue (SAT) and intramuscular fat, is important for disease prevention, but sex and ethnic differences are not well understood. Our aim was to identify anthropometric, demographic, and lifestyle predictors for these outcomes.
Methods and Results.
The cross-sectional ShapeUp!Kids study was conducted among five ethnic groups aged 5–18 years. All participants completed questionnaires, anthropometric measurements, and abdominal MRI scans. VAT and SAT areas at four lumbar levels and muscle density were assessed manually. General linear models were applied to estimate coefficients of determination (R2) and to compare the fit of VAT and SAT prediction models. After exclusions, the study population had 133 male and 170 female participants. Girls had higher BMI-z scores, waist circumference (WC), and SAT than boys but lower VAT/SAT and muscle density. SAT, VAT, and VAT/SAT but not muscle density differed significantly by ethnicity. R2 values were higher for SAT than VAT across groups and improved slightly after adding WC. For SAT, R2 increased from 0.85 to 0.88 (girls) and 0.62 to 0.71 (boys) when WC was added while VAT models improved from 0.62 to 0.65 (girls) and 0.57 to 0.62 (boys). VAT values were significantly lower among Blacks than Whites with little difference for the other groups
Conclusion.
This analysis in a multiethnic population identified BMI-z scores and WC as the major predictors of MRI-derived SAT and VAT and highlights the important ethnic differences that need to be considered in diverse populations.
Keywords: Visceral fat, muscle density, MRI, adolescents, children, obesity, ethnicity
Introduction
Understanding the development of body fat distribution, i.e., visceral and subcutaneous adipose tissue (VAT and SAT) and intramuscular fat, in children and adolescents is important for the prevention of obesity and chronic disease later in life. More than half of children and adolescents with obesity in the U.S. will remain obese later in life, however, fat distribution (not just BMI) will determine adverse health effects [1,2]. In a study of 507 adults and 938 adolescents, VAT, independently of BMI or SAT, was associated with triglyceride-rich lipoproteins, fatty acids, and inflammation in both adults and adolescents [3]. The BMI-adjusted metabolomic profile of VAT in that study was similar to patterns detected in relation to type 2 diabetes and myocardial infarction in adults. NHANES data have shown that at least 10% of children have metabolic syndrome [4] and the relation of VAT with future cardiovascular health in children and adolescents needs more attention [5]. As shown among different populations of children and adolescents, it appears that SAT volume increases first, whereas the amount of VAT only grows starting around age 10 [6,7]. The gold standard methods to assess VAT and SAT are computed tomography due to its 3-dimensional nature and magnetic resonance imaging (MRI), which can accurately measure adipose and lean tissue without the use of ionizing radiation [8,9]. However, both methods cannot be applied to large study populations due to their exposure to ionizing radiation or high cost. Therefore, predictive equations to estimate VAT and SAT from anthropometric measures and demographic variables have been suggested. Marunowski et al. proposed MRI-derived normative reference values by sex and age based on 262 healthy participants aged 6–18 years [10]. Another investigation among 181 White Europeans and 186 White and Black American youth aged 7–18 years developed estimation equations for VAT based on anthropometrics [11]. A model with waist (WC) and hip circumference (HC) more strongly predicted VAT in girls of White and Black ethnicity than WC or BMI. In boys, WC was the strongest predictor of VAT and HC did not significantly improve VAT prediction. While promising, these studies have been limited to a single sex or comparison of two ethnic groups. Ethnic differences in body fat distribution have emerged as a potential driver of health disparities [12]. Therefore, data from multi-ethnic populations are needed before predictive equations can be applied broadly. Obesity is also associated with lower muscle density measured in the thigh [13]. The fat content of muscle tissue is associated with metabolic risk patterns [14,15] and the incidence of heart disease [16]. So far, there are few data to describe muscle density in children and adolescents [13,17]. The hypothesis for the current analysis in the ShapeUp! Kids study is that VAT, SAT, and muscle density as measured by MRI can be predicted from anthropometric measures and lifestyle risk factors after adjusting for age, sex, and ethnicity. The aims were to describe these measures of body fat distribution as assessed by MRI in the total study population and stratified by sex and ethnicity; to predict SAT, VAT, and muscle density from anthropometric measures such as BMI, WC, and HC; and to identify demographic and lifestyle predictors for the MRI measures.
Methods
Study Population.
The Shape Up! Kids study was a cross-sectional investigation that recruited close to 350 children, ages 5 to 17 years at three sites from five ethnic groups: non-Hispanic White, non-Hispanic Black, Hispanic, Asian, and Native Hawaiian/Other Pacific Islander (NHOPI) [18]. To obtain a diverse study population, enrollment was stratified by age, ethnicity, sex, BMI-z score, and location (San Francisco, CA, Baton Rouge, LA, and Honolulu, HI) using convenience sampling. Pregnancy, missing limbs, presence of significant non-removable metal in the body, or a history of body-altering surgery were considered as exclusion criteria. Human Subjects approval was obtained from the Institutional Review Boards at the three locations Pennington Biomedical Research Center (PBRC, IRB study #2017–10, FWA #00006218), University of California, San Francisco (UCSF, IRB #16–20197), and University of Hawaii Institutional Review Board (IRB #24282). Both parents, if appropriate and available, gave informed consent. Children 7–17 years provided written assent and those 5–6 years gave verbal assent.
Data Collection.
Self-reported ethnicity and pubertal stage using a validated Tanner staging tool were provided by parents. Questionnaires included an online version of the Health Behavior in School-Aged Children survey [19] and the Physical Activity Questionnaire (PAQ) for Older Children or Adolescents [20]. Methods to assess anthropometrics have been described in detail previously [18]. Height and weight were measured on a SECA 274 Stadiometer (SECA GmbH, Hamburg, Germany). Percentile scores were computed according to the Centers for Disease Control and Prevention (CDC) growth charts and sex-specific BMI-for-age (BMI-z) values [21], To classify BMI status, the following cutoffs were used: Normal weight <85 percentile, overweight ≥85 percentile, and obesity ≥95 percentile. Following the NHANES protocol, WC (top of the iliac crest) and HC (widest part of gluteus) were measured with flexible tapes in triplicate and averaged. All readers were validated by the lab’s criterion person who needed to measure 10 people under supervision to be validated.
MRI Imaging.
The three study locations applied the identical study protocol for MRI imaging. Abdominal MRI scans were acquired on 3-Tesla scanners (Siemens TIM Trio, Erlangen, Germany, software version VB13 at UH; General Electric HDx, Milwaukee, Wisconsin, software release 15M4 at USC). The same investigator (SDB) analyzed all MRI images making the results highly comparable. Whole adipose tissue was measured at four inter-vertebral sections (L1–L2, L2–L3, L3–L4, and L4–L5) using the 2-point Dixon method [22] with the following parameters: 2.6 mm slices, 0 mm gap; Repetition Time=3.77 ms; Time to Echo = 1.23/2.46 ms; flip angle = 5°, in plane resolution 256×144. This made it possible to measure the entire body with one sequence repeated 4 to 7 times at various locations. MRI images corresponding to the four lumbar sections were selected from the Dixon sequence fat images and thresholds were applied to the images before manually cleaning signal from the spine, spine muscle, or chest wall muscle and binarizing the images, which were analyzed using Fiji software version 1.53T [23]. For each cross-sectional segment, the total adipose area (cm2) inside the dermis was determined. Next, VAT inside the abdominal muscle wall was traced manually and the VAT area (intra- and extra-peritoneal fat) was determined. The first volume included SAT+VAT from the cross-sectional area. The second volume included only VAT while the SAT area was derived as the difference between measures. Means of SAT and VAT values assessed in the four slices (L1-L5) were computed. Breathing artifacts made it impossible to assess SAT and VAT in the abdominal area of the MRI images for several participants who were therefore excluded.
Statistical Analysis.
After removing 42 participants due to missing MRI-based VAT measures (N=40) and/or anthropometric measures (N=4) with an overlap of 2, the analytic dataset had 303 observations. Participants who did not provide information for pubertal stage (N=75) or PAQ scores (N=128) were assigned a separate missing category. Descriptive statistical analyses were applied to compare the distribution of outcome measures of interest by sex and ethnicity. Spearman correlation coefficients between anthropometric and MRI measures were computed. For comparison with reference values [10,24] and because of differences in VAT values [25] and relation to disease risk [26] across the lumbar area have been reported, we examined median SAT and VAT values by lumbar level.
Using general linear models, regressions coefficients, 95% confidence intervals (CI), coefficients of determination (R2), and the root mean square error (RSME), a measure of distance between the predicted and the actual values, were estimated from two distinct models. To meet model assumptions, SAT, VAT, the VAT/SAT ratio, and muscle density were log-transformed. To meet model assumptions, SAT, VAT, the VAT/SAT ratio, and muscle density were log-transformed. First, basic models of SAT and VAT with age, BMI-z, and ethnicity as independent variables were computed separately by sex. To explore how the models could be improved, stepwise linear regression, which is similar to the forward selection method except that effects already in the model do not necessarily stay, was performed with WC, HC, pubertal stage in three categories (1, 2/3, and 4/5), and PAQ as covariates using the default entry and stay levels of 0.15. For SAT, only age, BMI-z, and WC remained in the final model; for VAT, it was ethnicity, BMI-z, and WC. To evaluate model fit, R2 and RMSE values were compared by sex. Based on the regression coefficients, differences by ethnic group were assessed using Whites, the most numerous group, as reference. As R2s for the VAT/SAT ratio and muscle density did not exceed 0.35, no further modeling was pursued. Finally, a predicted VAT value according to a published formula was computed and tested in a general linear model using mean MRI measures [24]. The formula for girls was VAT = [1.594*WC] - [0.681*HC] + [1.74*Age] - 48.95 and for boys: VAT = [1.328*WC] - 72.53.
Results
After exclusions, the analytic data set had 133 male and 170 female participants, with a mean age of 12±3 years (Table 1). Girls and boys had similar ages, ethnic background, and pubertal stage. BMI-z scores, WC, HC, and SAT values were significantly higher in girls, whereas VAT/SAT and muscle density were significantly lower as compared to boys. VAT did not differ by sex. SAT, VAT, and the VAT/SAT ratio but not muscle density differed significantly by ethnic group (Table 2). Whereas SAT was highest in Blacks, VAT values were greatest for Whites, followed by NHOPI, Hispanics, and Blacks and lowest for Asians. The VAT/SAT ratio was highest in Whites and lowest in Blacks.
Table 1.
Characteristics of the ShapeUp! Kids Study Population
| Variable | Category | Girls | Boys | p a |
|---|---|---|---|---|
| All | Number | 170 | 133 | |
| Ethnicity | White | 46 | 48 | 0.87 |
| Black | 45 | 29 | ||
| Hispanic | 18 | 10 | ||
| Asian | 24 | 22 | ||
| NHOPI | 37 | 24 | ||
| Pubertal stage | 1 | 43 | 35 | 0.28 |
| 2/3 | 40 | 36 | ||
| 4/5 | 62 | 44 | ||
| 9 | 25 | 18 | ||
| Age | years | 12.2 ± 3.4 | 12.3 ± 3.2 | 0.86 |
| BMI z-score | Percentile | 0.87 ± 1.09 | 0.60 ± 1.25 | 0.05 |
| Waist circumference | cm | 78.5 ± 16.9 | 74.7 ± 16.6 | 0.05 |
| Hip circumference | cm | 89.4 ± 17.8 | 84.6 ± 16.3 | 0.02 |
| SAT | cm2 | 178.8 ± 133.3 | 137.6 ± 143.6 | 0.01 |
| VAT | cm2 | 39.2 ± 23.5 | 41.4 ± 34.8 | 0.51 |
| VAT/SAT | Ratio | 0.26 ± 0.11 | 0.40 ± 0.19 | <0.0001 |
| Muscle Density | mg/cm3 | 0.91 ± 0.03 | 0.93 ± 0.03 | 0.003 |
p-values of difference by sex by chi-square test or general linear models
Table 2.
Measures of Body Fat Distribution by Ethnicity in the ShapeUp! Kids Studya
| Ethnicity | SAT | VAT | VAT/SAT | Muscle Density | ||||
|---|---|---|---|---|---|---|---|---|
| Mean | Std | Mean | Std | Mean | Std | Mean | Std | |
| White | 4.77 | 0.86 | 3.64 | 0.67 | −1.12 | 0.46 | −0.08 | 0.04 |
| Black | 4.98 | 0.83 | 3.42 | 0.62 | −1.56 | 0.58 | −0.09 | 0.04 |
| Hispanic | 4.72 | 0.91 | 3.42 | 0.66 | −1.30 | 0.63 | −0.08 | 0.04 |
| Asian | 4.46 | 0.70 | 3.32 | 0.55 | −1.15 | 0.45 | −0.08 | 0.03 |
| NHOPI | 4.67 | 0.73 | 3.52 | 0.56 | −1.15 | 0.37 | −0.09 | 0.03 |
| p b | 0.02 | 0.03 | <0.0001 | 0.28 | ||||
Means and standard deviations (std) are for log-transformed values of all four measure of body composition.
p-value of difference across ethnic groups obtained by general linear models using log-transformed values
Looking at unadjusted correlations (Table 3), SAT and VAT showed the strongest correlation with WC (rs= 0.87 and 0.78) while the BMI-z score had the strongest association with VAT/SAT and muscle density (rs = −0.49 and rs = −0.55). Age was only significantly associated with SAT and VAT but not VAT/SAT and muscle density. SAT and VAT both increased with pubertal stage, whereas VAT/SAT was inversely related. The PAQ score showed a moderate inverse association with SAT and VAT but none with VAT/SAT. Muscle density was only associated with anthropometric and not with MRI measures.
Table 3.
Correlations of Anthropometric Measures to MRI in Girls and Body of the ShapeUp! Kids Study
| Variable | Statistica | SAT | VAT | VAT/SAT | Muscle Density |
|---|---|---|---|---|---|
| Age, years | rs | 0.30 | 0.29 | −0.09 | 0.07 |
| BMI-z score | rs | 0.79 | 0.66 | −0.49 | −0.55 |
| Waist circumference, cm | rs | 0.87 | 0.78 | −0.45 | −0.45 |
| Hip Circumference, cm | rs | 0.80 | 0.68 | −0.46 | −0.35 |
| SAT, cm2 | rs | 1 | |||
| VAT, cm2 | rs | 0.78 | 1 | ||
| VAT/SAT | rs | −0.65 | −0.07 | 1 | |
| Muscle density | rs | −0.58 | −0.51 | 0.33 | 1 |
| Puberty stageb | rs | 0.37 | 0.26 | 0.26 | 0.009 |
| PAQ scoreb | rs | −0.17 | −0.17 | 0.07 | 0.04 |
Spearmen correlation coefficients plus p-value
Missing information for Tanner stage (N=43) and PAQ score (N=97)
The comparison of MRI measures with available reference data for age and sex (Figure 1) showed higher SAT in girls than boys and a slight increase in values by age until 10–11 years. In the SUK, SAT values were slightly higher and the VAT values were somewhat lower than in the reference data. The sex difference for VAT was smaller with slightly higher values for boys than girls. Figure 2 illustrates the differences in size of VAT and SAT areas according to the location. While SAT measures more than doubled from L1-L2 to L4-L5, the VAT areas decreased by approximately 12%.
Figure 1.
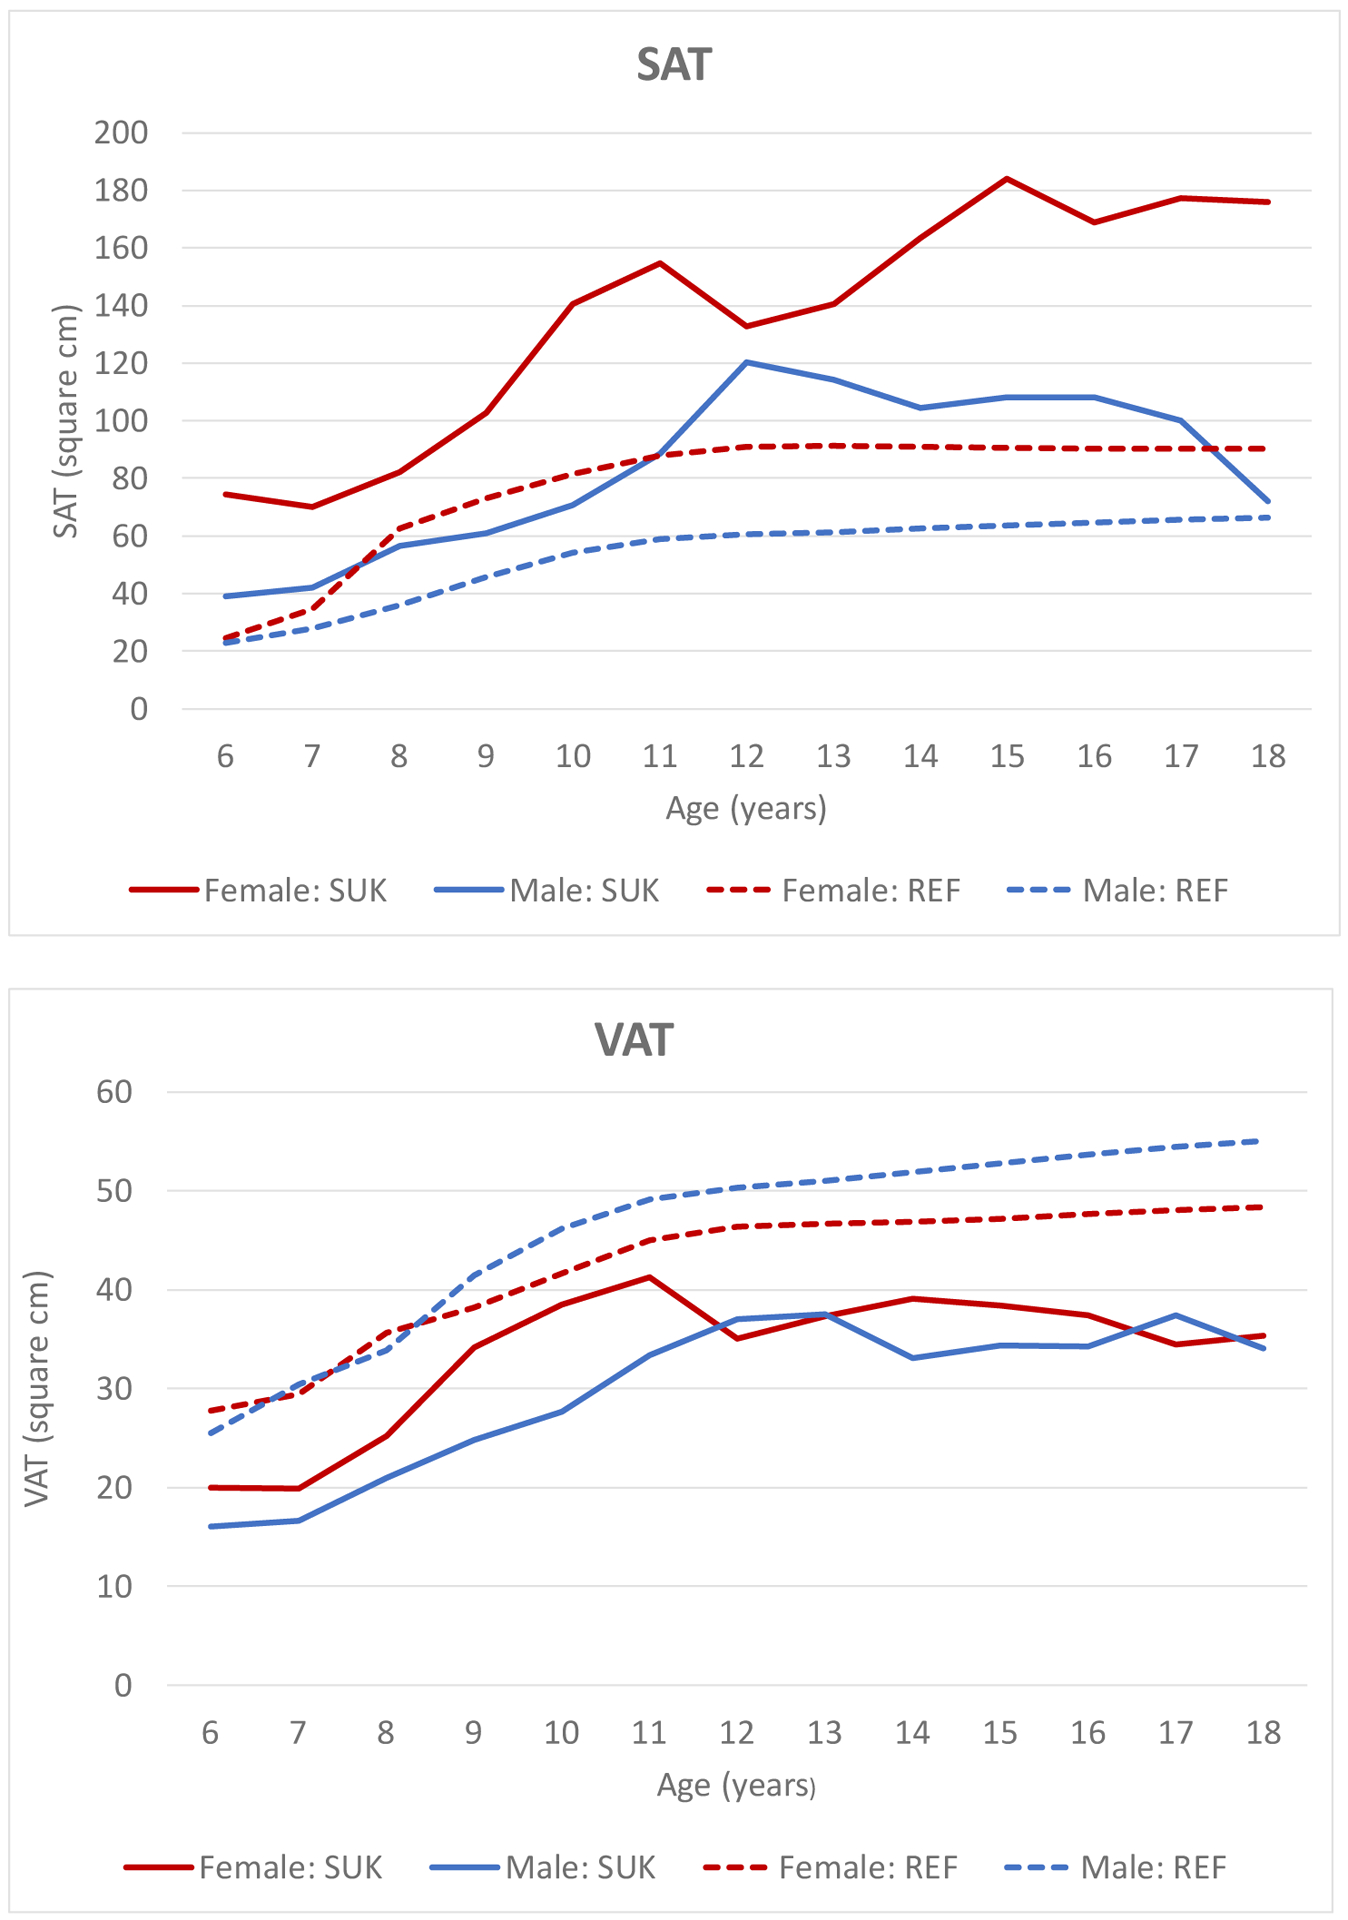
Comparison of Median SAT and VAT Values at L2/L3 by Age for Published Reference Data by Marunowski et al. 2021 [10] and ShapeUpKids (SUK)
Figure 2.
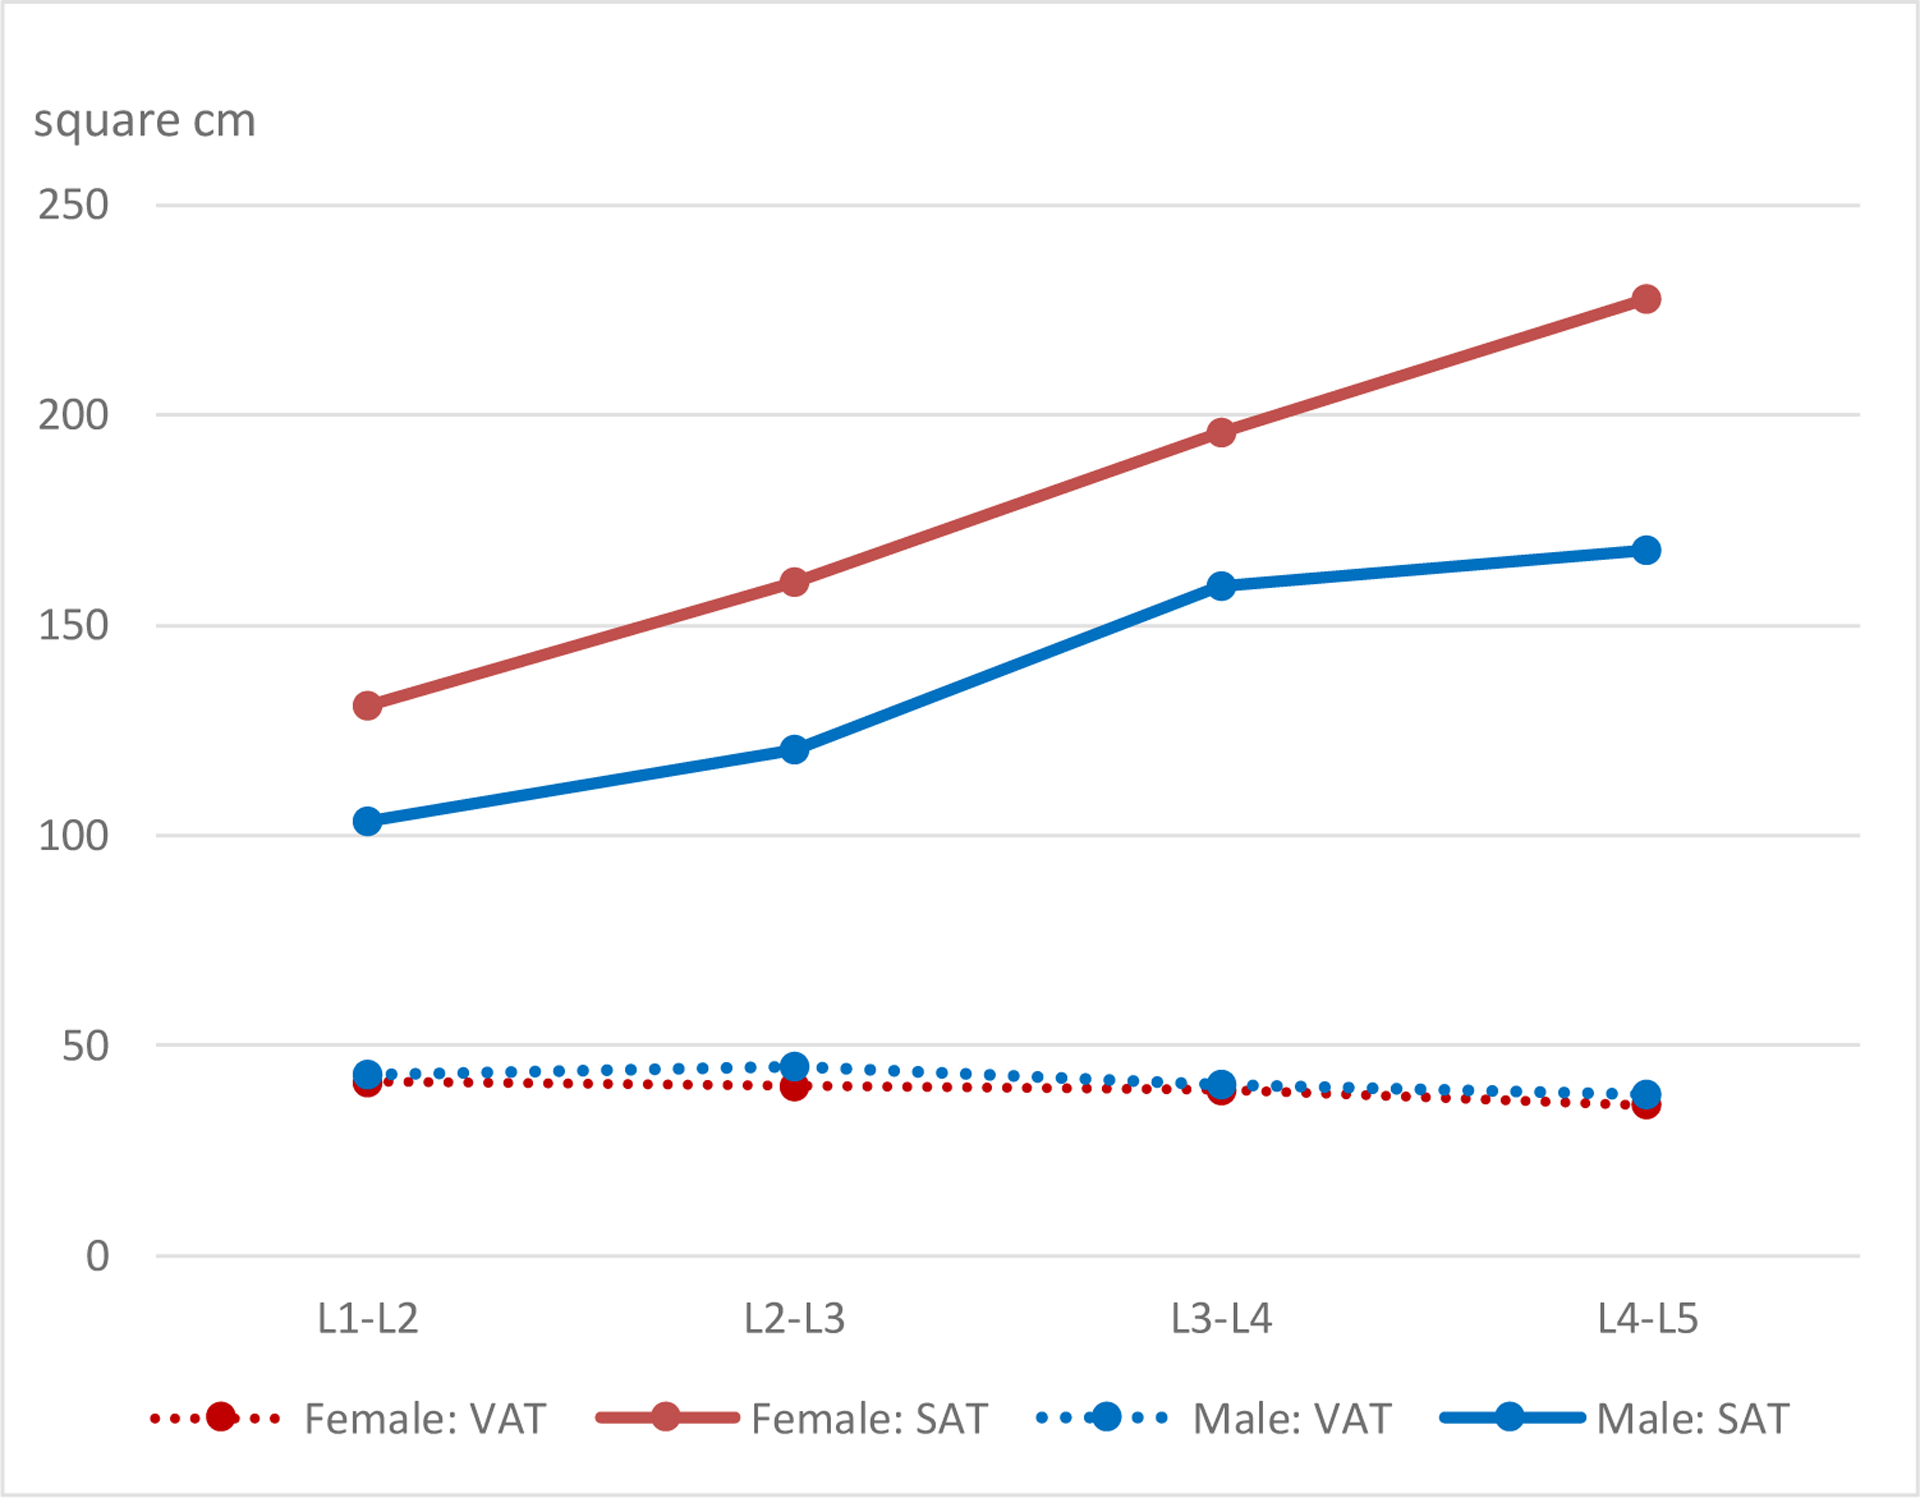
Mean SAT and VAT Values by Location of Measurement at Four inter-vertebral Sections (L1–L2, L2–L3, L3–L4, and L4–L5)
Estimated R2 values were higher for SAT than VAT in girls and boys (Table 4). For SAT, the respective R2 values in the basic model for girls and boys were 0.85 and 0.62, which improved to 0.88 and 0.71 when WC was added to BMI-z and ethnicity. Model fit was weaker for VAT than SAT; the basic model improved from 0.62 to 0.65 among girls and from 0.57 to 0.62 in boys after adding WC. In terms of ethnicity, the regression coefficients indicate that VAT values were significantly lower among Blacks than Whites with little difference for the other groups but this difference decreased in the new models. RSME values were slightly lower for the new SAT models as compared to the basic models indicating better fit, but the improvement was smaller or non-existent for the VAT models. When we applied the formula for VAT by Samouda (Table 5), the R2s were similar to the models shown in Table 4: 0.61 and 0.59 for girls and boys, respectively. Adding ethnicity to the models increased the R2s to 0.65 and 0.64 with the best fit for White and NHOPI girls.
Table 4.
Prediction of SAT and VAT in the ShapeUp!Kids Study
| Sex | Model | Group | Basicb | Newc | ||||||
|---|---|---|---|---|---|---|---|---|---|---|
| Estimatea | 95% CI | R2 | RMSE | Estimatea | 95% CI | R2 | RMSE | |||
| Girls | SATd | All | 0.85 | 0.30 | 0.89 | 0.26 | ||||
| White | Ref | Ref | ||||||||
| Black | −0.13 | −0.25, 0.00 | −0.09 | −0.20, 0.02 | ||||||
| Hispanic | 0.04 | −0.12, 0.21 | 0.03 | −0.11, 0.17 | ||||||
| Asian | −0.05 | −0.21, 0.10 | −0.03 | −0.16, 0.10 | ||||||
| NHOPI | −0.12 | −0.25, 0.01 | −0.11 | −0.22, 0.004 | ||||||
| VATd | All | 0.62 | 0.38 | 0.66 | 0.36 | |||||
| White | Ref | Ref | ||||||||
| Black | −0.37 | −0.53, −0.21 | −0.34 | −0.49, −0.19 | ||||||
| Hispanic | −0.004 | −0.21, 0.20 | −0.01 | −0.21, 0.19 | ||||||
| Asian | −0.06 | −0.26, 0.13 | −0.05 | −0.23, 0.14 | ||||||
| NHOPI | −0.05 | −0.22, 0.11 | −0.04 | −0.20, 0.12 | ||||||
| Boys | SATd | All | 0.62 | 0.54 | 0.73 | 0.46 | ||||
| White | Ref | Ref | ||||||||
| Black | −0.06 | −0.31, 0.20 | 0.12 | −0.10, 0.35 | ||||||
| Hispanic | 0.13 | −0.25, 0.51 | 0.17 | −0.15, 0.49 | ||||||
| Asian | −0.20 | −0.48, 0.07 | −0.04 | −0.28, 0.20 | ||||||
| NHOPI | −0.28 | −0.55, −0.02 | −0.17 | −0.40, 0.06 | ||||||
| VATd | All | 0.57 | 0.45 | 0.65 | 0.40 | |||||
| White | Ref | Ref | ||||||||
| Black | −0.41 | −0.62, −0.20 | −0.29 | −0.48, −0.09 | ||||||
| Hispanic | −0.18 | −0.49, 0.13 | −0.15 | −0.43, 0.13 | ||||||
| Asian | −0.31 | −0.54, 0.08 | −0.19 | −0.40, 0.02 | ||||||
| NHOPI | −0.29 | −0.51, −0.06 | −0.21 | −0.41, −0.004 | ||||||
Regression coefficients, 95% confidence intervals, RSME, and coefficient of determination (R2) obtained by linear regression
Age, BMI-z, and ethnicity (except in ethnic-specific models) as independent variables
Age, BMI-z, waist circumference, and ethnicity (except in ethnic-specific models) as independent variable
Natural logarithm of SAT and VAT to meet model assumptions
Table 5.
MRI VAT Prediction Formula by Samoudaa
| Model | Girlsb | Boysc | |||||
|---|---|---|---|---|---|---|---|
| Estimated | 95% CI | R2 | Estimated | 95% CI | R2 | ||
| Samouda’s formula | 0.80 | 0.70, 0.89 | 0.61 | 1.01 | 0.87, 1.16 | 0.59 | |
| Samouda plus ethnicity | 0.80 | 0.71, 0.90 | 0.65 | 0.98 | 0.84, 1.12 | 0.64 | |
| Samouda by ethnicity | White | 1.01 | 0.82, 1.20 | 0.73 | 1.22 | 0.98, 1.45 | 0.70 |
| Black | 0.56 | 0.40, 0.72 | 0.54 | 0.57 | 0.33, 0.81 | 0.47 | |
| Hispanic | 0.94 | 0.51, 1.37 | 0.58 | 0.98 | 0.31, 1.66 | 0.58 | |
| Asian | 0.80 | 0.50, 1.10 | 0.59 | 0.83 | 0.36, 1.31 | 0.41 | |
| NHOPI | 0.95 | 0.77, 1.12 | 0.78 | 0.78 | 0.53, 1.02 | 0.66 | |
Samouda et al. J Pediatr 2023 [11]
Girls: VAT = (1.594*Waist circumference) - (0.681*Hip circumference) + (1.74*Age) - 48.95
Boys: VAT = [1.328*Waist circumference] - 72.53
Regression coefficients, 95% confidence intervals, and coefficient of determination (R2) obtained by linear regression
Discussion
In this population of children and adolescents, SAT, VAT, and the VAT/SAT ratio but not muscle density differed significantly by ethnic group. With MRI-based measures as standard, anthropometric measures predicted SAT strongly (R2 >0.80), VAT modestly well (R2 >0.40), and VAT/SAT and muscle density poorly (R2 <0.40). SAT and VAT areas showed the strongest correlation with WC, whereas the BMI-z score was the strongest predictor for VAT/SAT and muscle density. In agreement with previous reports, girls had higher SAT than boys and lower VAT/SAT. The VAT/SAT ratio was highest in Whites followed by Asians, NHOPI, Hispanics, and lowest in Blacks. However, the differences by sex and ethnicity were less pronounced than in adults, in particular Asians [27]. None of the available predictors beyond age, sex, ethnicity, BMI-z, and WC improved model fit when predicting MRI measures, which was better for girls than boys and varied considerably by ethnicity. When we tested a published model [24], it improved after adding ethnicity and fit best for Whites and NHOPI and less so for Blacks emphasizing the importance of considering ethnicity in future prediction studies.
In comparison to the literature, the trend of body fat growth by age is similar to a study population of 262 healthy youths aged 6 to 18 years, which used semi-automatic tissue segmentation of MRI images at the second lumbar vertebrae [10]. A sharper increase in VAT was seen by age 11 and a flattening of the curve thereafter. Another study among adolescents reported that anthropometric measures beyond the BMI-z score did not predict VAT any better [28]. Also consistent with our findings [29,30], a faster growth of VAT was detected in children of White than Black ancestry. Higher percent SAT in girls than boys was reported by an investigation of 197 healthy adolescents aged 10–15 years nested within a longitudinal population-based cohort, whereas percent VAT was comparable, independently of puberty [31]. Consistent with our findings, the measurement site for SAT and VAT impacts the size of the area; SAT was greatest around L4/L5 while VAT was greater in areas above L4/L5 among youth of White and Black ancestry [32]. Our findings also agree with a large study of 1,002 adolescents (482 males, age 12–18 years), which reported that SAT but not VAT can be well predicted from clinical measures for both sexes and throughout puberty [33]. WC was also identified as a good predictor of VAT in obese adolescents [34]. As shown for other populations [35], muscle density was inversely associated with BMI status and total body fat among this young study population. The importance of high muscle fat for predicting long-term risk was shown by a longitudinal analysis that reported an association between intramuscular fat with heart failure among elderly adults [16] and biomarkers of cardiometabolic risk factors [15].
The differential storage of body fat across ethnic groups has been an emerging issue that may be responsible for health disparities [12]. As described in young and adult populations, the proportion of VAT tends to be higher in Asian populations and lower among individuals with Black ancestry who have a higher amount of SAT [27,36]. As shown in a longitudinal study [30], deposition and accumulation of excess VAT was higher over a 2-year time period among White than Black adolescents. However, different from the current results, WC and HC predicted VAT in girls while only WC predicted VAT in boys in a study of US and European youth [24].
The novelty and major strength of the current investigation is the ethnic diversity of the study population that allowed specific analysis of five different groups. The high-quality MRI imaging using a standardized protocol and measurement by one expert assured the comparability of findings. Despite these strengths, several limitations have to be considered. A larger sample size was planned but could not be achieved due to the pandemic. Of the 345 recruited participants, breathing artifacts made it impossible to assess SAT and VAT in the abdominal area of the MRI images for a number of participants. As to the interpretation of findings, it is challenging to compare findings across studies due to the different imaging techniques and measures (volume vs. area, number of slices) as well as the exact location of VAT assessment. As observed in the current study, there is large variation in body fat and type across the lumbar vertebrae that may not be accurately captured. We did not find associations with lifestyle factors using the PAQ; studies using more rigorous diet and activity assessments are needed in multiethnic populations. Clearly, the current findings cannot be generalized to study populations with ethnic backgrounds other than the five included in this study.
In conclusion, the analysis of SAT and VAT assessed by MRI among five ethnic groups confirmed previous findings that VAT is much more difficult to predict from anthropometric measures than SAT and highlights the sex and ethnic differences in accumulating excess body fat during adolescence. Besides BMI-z scores, WC was the only important predictor that improved model prediction in this population. Muscle density was strongly correlated to BMI, but no additional predictors could be identified. Although no association with lifestyle were detected, the results show the novel finding of significant differences by ethnic group, in particular the weaker ability to predict VAT among Black and Asians than in the other three groups, which is not well understood. Possible reasons include the comparatively low VAT values in these groups or unknown genetic differences that lead to a variation in body fat distribution, which are not captured appropriately by standard MRI imaging.
Supplementary Material
Highlights.
Visceral (VAT) and subcutaneous adipose tissue (SAT) are risk factors for chronic disease
MRI-derived SAT better predicted from anthropometrics than VAT and among girls than boys
Best model fit for Whites, Hispanics, and Pacific Islanders; lower values for Asians and Blacks
BMI-z scores and waist circumference are major predictors of MRI-derived SAT and VAT
Funding.
The ShapeUp! Study was funded by the US National Institute of Diabetes and Digestive and Kidney Diseases (NIH R01 DK111698).
List of Abbreviations
- BMI
Body Mass Index
- HC
Hip Circumference
- MRI
Magnetic Resonance Imaging
- NHOPI
Native Hawaiian/Other Pacific Islander
- PAQ
Physical Activity Questionnaire
- RSME
Root Mean Square Error
- SAT
Subcutaneous Adipose Tissue
- SUK
ShapeUp! Kids
- VAT
Visceral Adipose Tissue
- WC
Waist Circumference
Footnotes
Publisher's Disclaimer: This is a PDF file of an unedited manuscript that has been accepted for publication. As a service to our customers we are providing this early version of the manuscript. The manuscript will undergo copyediting, typesetting, and review of the resulting proof before it is published in its final form. Please note that during the production process errors may be discovered which could affect the content, and all legal disclaimers that apply to the journal pertain.
Competing Interests None of the authors have a conflict of interest to declare
References
- 1.Simmonds M, Llewellyn A, Owen CG, et al. Predicting adult obesity from childhood obesity: a systematic review and meta-analysis. Obes Rev. 2016. Feb;17(2):95–107. [DOI] [PubMed] [Google Scholar]
- 2.Ward ZJ, Long MW, Resch SC, et al. Simulation of Growth Trajectories of Childhood Obesity into Adulthood. N Engl J Med. 2017 Nov 30;377(22):2145–2153. [DOI] [PMC free article] [PubMed] [Google Scholar]
- 3.Raheem J, Sliz E, Shin J, et al. Visceral adiposity is associated with metabolic profiles predictive of type 2 diabetes and myocardial infarction. Commun Med (Lond). 2022;2:81. [DOI] [PMC free article] [PubMed] [Google Scholar]
- 4.Miller JM, Kaylor MB, Johannsson M, et al. Prevalence of metabolic syndrome and individual criterion in US adolescents: 2001–2010 National Health and Nutrition Examination Survey. Metab Syndr Relat Disord. 2014. Dec;12(10):527–32. [DOI] [PubMed] [Google Scholar]
- 5.Marketou ME, Buechler NS, Fragkiadakis K, et al. Visceral fat and cardiometabolic future in children and adolescents: a critical update. Pediatr Res. 2023. Nov;94(5):1639–1647. [DOI] [PubMed] [Google Scholar]
- 6.Staiano AE, Broyles ST, Gupta AK, et al. Ethnic and sex differences in visceral, subcutaneous, and total body fat in children and adolescents. Obesity (Silver Spring). 2013. Jun;21(6):1251–5. [DOI] [PMC free article] [PubMed] [Google Scholar]
- 7.Maskarinec G, Shvetsov YB, Wong MC, et al. Subcutaneous and visceral fat assessment by DXA and MRI in older adults and children. Obesity (Silver Spring). 2022. Apr;30(4):920–930. [DOI] [PMC free article] [PubMed] [Google Scholar]
- 8.Borga M, West J, Bell JD, et al. Advanced body composition assessment: from body mass index to body composition profiling. J Investig Med. 2018. Jun;66(5):1–9. [DOI] [PMC free article] [PubMed] [Google Scholar]
- 9.Hemke R, Buckless C, Torriani M. Quantitative Imaging of Body Composition. Semin Musculoskelet Radiol. 2020. Aug;24(4):375–385. [DOI] [PubMed] [Google Scholar]
- 10.Marunowski K, Swieton D, Bzyl W, et al. MRI-Derived Subcutaneous and Visceral Adipose Tissue Reference Values for Children Aged 6 to Under 18 Years. Front Nutr. 2021;8:757274. [DOI] [PMC free article] [PubMed] [Google Scholar]
- 11.Samouda H, Lee S, Arslanian S, et al. Anthropometric Equations to Predict Visceral Adipose Tissue in European and American Youth. J Pediatr. 2023. Feb;253:33–39 e3. [DOI] [PubMed] [Google Scholar]
- 12.Tchernof A, Despres JP. Pathophysiology of human visceral obesity: an update. Physiol Rev. 2013. 1/2013;93(1):359–404. [DOI] [PubMed] [Google Scholar]
- 13.Blew RM, Lee VR, Bea JW, et al. Validation of Peripheral Quantitative Computed Tomography-Derived Thigh Adipose Tissue Subcompartments in Young Girls Using a 3 T MRI Scanner. J Clin Densitom. 2018. Oct - Dec;21(4):583–594. [DOI] [PMC free article] [PubMed] [Google Scholar]
- 14.Miljkovic I, Vella CA, Allison M. Computed Tomography-Derived Myosteatosis and Metabolic Disorders. Diabetes Metab J. 2021. Jul;45(4):482–491. [DOI] [PMC free article] [PubMed] [Google Scholar]
- 15.Hassler EM, Deutschmann H, Almer G, et al. Distribution of subcutaneous and intermuscular fatty tissue of the mid-thigh measured by MRI-A putative indicator of serum adiponectin level and individual factors of cardio-metabolic risk. PLoS One. 2021;16(11):e0259952. [DOI] [PMC free article] [PubMed] [Google Scholar]
- 16.Huynh K, Ayers C, Butler J, et al. Association Between Thigh Muscle Fat Infiltration and Incident Heart Failure: The Health ABC Study. JACC Heart Fail. 2022. Jul;10(7):485–493. [DOI] [PubMed] [Google Scholar]
- 17.Farr JN, Funk JL, Chen Z, et al. Skeletal muscle fat content is inversely associated with bone strength in young girls. J Bone Miner Res. 2011. Sep;26(9):2217–25. [DOI] [PMC free article] [PubMed] [Google Scholar]
- 18.Wong MC, Ng BK, Kennedy SF, et al. Children and Adolescents’ Anthropometrics Body Composition from 3-D Optical Surface Scans. Obesity (Silver Spring). 2019. Nov;27(11):1738–1749. [DOI] [PMC free article] [PubMed] [Google Scholar]
- 19.Marques A, Bordado J, Tesler R, et al. A composite measure of healthy lifestyle: A study from 38 countries and regions from Europe and North America, from the Health Behavior in School-Aged Children survey. Am J Hum Biol. 2020. Nov;32(6):e23419. [DOI] [PubMed] [Google Scholar]
- 20.Aggio D, Fairclough S, Knowles Z, et al. Validity and reliability of a modified english version of the physical activity questionnaire for adolescents. Arch Public Health. 2016;74:3. [DOI] [PMC free article] [PubMed] [Google Scholar]
- 21.National Center for Health Statistics. Clinical Growth Charts Atlanta, GA: Centers for Disease Control and Prevention; 2017. [updated 6/22/2010;6/22/2020]. Available from: https://www.cdc.gov/growthcharts/clinical_charts.htm
- 22.Maskarinec G, Garber AK, Wong MC, et al. Predictors of liver fat among children and adolescents from five different ethnic groups. Obes Sci Pract. 2021. Feb;7(1):53–62. [DOI] [PMC free article] [PubMed] [Google Scholar]
- 23.Schindelin J, Arganda-Carreras I, Frise E, et al. Fiji: an open-source platform for biological-image analysis. Nat Methods. 2012 Jun 28;9(7):676–82. [DOI] [PMC free article] [PubMed] [Google Scholar]
- 24.Samouda H, Lee S, Arslanian S, et al. Anthropometric equations to predict visceral adipose tissue in European and American youth. J Pediatr. 2022 Sep 14. [DOI] [PubMed] [Google Scholar]
- 25.Ryo M, Kishida K, Nakamura T, et al. Clinical significance of visceral adiposity assessed by computed tomography: A Japanese perspective. World J Radiol. 2014 Jul 28;6(7):409–16. [DOI] [PMC free article] [PubMed] [Google Scholar]
- 26.Villegas-Valle RC, Lim U, Maskarinec G, et al. Metabolic syndrome screening using visceral adipose tissue (VAT) from opportunistic MRI locations in a multi-ethnic population. Obes Res Clin Pract. 2021. May-Jun;15(3):227–234. [DOI] [PubMed] [Google Scholar]
- 27.Lim U, Monroe KR, Buchthal S, et al. Propensity for Intra-abdominal and Hepatic Adiposity Varies Among Ethnic Groups. Gastroenterology. 2019. 3/2019;156(4):966–975. [DOI] [PMC free article] [PubMed] [Google Scholar]
- 28.Koren D, Marcus CL, Kim C, et al. Anthropometric predictors of visceral adiposity in normal-weight and obese adolescents. Pediatr Diabetes. 2013. Dec;14(8):575–84. [DOI] [PMC free article] [PubMed] [Google Scholar]
- 29.Huang TT, Johnson MS, Figueroa-Colon R, et al. Growth of visceral fat, subcutaneous abdominal fat, and total body fat in children. Obes Res. 2001. May;9(5):283–9. [DOI] [PubMed] [Google Scholar]
- 30.Staiano AE, Katzmarzyk PT. Visceral, subcutaneous, and total fat mass accumulation in a prospective cohort of adolescents. Am J Clin Nutr. 2022 Sep 2;116(3):780–785. [DOI] [PMC free article] [PubMed] [Google Scholar]
- 31.Tinggaard J, Hagen CP, Christensen AN, et al. Anthropometry, DXA, and leptin reflect subcutaneous but not visceral abdominal adipose tissue on MRI in 197 healthy adolescents. Pediatr Res. 2017. Oct;82(4):620–628. [DOI] [PubMed] [Google Scholar]
- 32.Lee S, Kuk JL, Kim Y, et al. Measurement site of visceral adipose tissue and prediction of metabolic syndrome in youth. Pediatr Diabetes. 2011. May;12(3 Pt 2):250–7. [DOI] [PMC free article] [PubMed] [Google Scholar]
- 33.Goodwin K, Syme C, Abrahamowicz M, et al. Routine clinical measures of adiposity as predictors of visceral fat in adolescence: a population-based magnetic resonance imaging study. PLoS One. 2013;8(11):e79896. [DOI] [PMC free article] [PubMed] [Google Scholar]
- 34.Eloi JC, Epifanio M, de Goncalves MM, et al. Quantification of Abdominal Fat in Obese and Healthy Adolescents Using 3 Tesla Magnetic Resonance Imaging and Free Software for Image Analysis. PLoS One. 2017;12(1):e0167625. [DOI] [PMC free article] [PubMed] [Google Scholar]
- 35.Farr JN, Van Loan MD, Lohman TG, et al. Lower physical activity is associated with skeletal muscle fat content in girls. Med Sci Sports Exerc. 2012. Jul;44(7):1375–81. [DOI] [PMC free article] [PubMed] [Google Scholar]
- 36.Staiano AE, Katzmarzyk PT. Ethnic and sex differences in body fat and visceral and subcutaneous adiposity in children and adolescents. Int J Obes (Lond). 2012. Oct;36(10):1261–9. [DOI] [PMC free article] [PubMed] [Google Scholar]
Associated Data
This section collects any data citations, data availability statements, or supplementary materials included in this article.