

Abstract
Lung adenocarcinoma (LUAD), commonly driven by KRAS mutations, is responsible for 7% of all cancer mortality. The first allele-specific KRAS inhibitors were recently approved in LUAD, but clinical benefit is limited by intrinsic and acquired resistance. LUAD predominantly arises from alveolar type 2 (AT2) cells, which function as facultative alveolar stem cells by self-renewing and replacing alveolar type 1 (AT1) cells. Using genetically engineered mouse models, patient-derived xenografts, and patient samples we found inhibition of KRAS promotes transition to a quiescent AT1-like cancer cell state in LUAD tumors. Similarly, suppressing Kras induced AT1 differentiation of wild-type AT2 cells upon lung injury. The AT1-like LUAD cells exhibited high growth and differentiation potential upon treatment cessation, whereas ablation of the AT1-like cells robustly improved treatment response to KRAS inhibitors. Our results uncover an unexpected role for KRAS in promoting intra-tumoral heterogeneity and suggest targeting alveolar differentiation may augment KRAS-targeted therapies in LUAD.
Keywords: Lung cancer, KRAS, Targeted therapy, Treatment resistance, Cell state transition, AT1 cell, Alveolar differentiation, Lineage-tracing, Lineage-ablation, Gene reporter system
Introduction
KRAS is the most commonly mutated proto-oncogene across all human cancers. KRAS is a prominent oncogenic driver in three of the most lethal cancers – non-small cell lung cancer (NSCLC), colorectal cancer, and pancreas cancer (1,2). Thus, KRAS has long represented one of the most attractive therapeutic targets in oncology (1). KRAS mutations are particularly prevalent in the lung adenocarcinoma (LUAD) subtype of NSCLC, which is driven by mutant KRAS in ~30% of cases (3). 41% of KRAS mutations in LUAD involve a conversion of glycine in position 12 to cysteine [KRAS(G12C)] (3). Recent exciting developments have led to the FDA approval of the first direct inhibitors of KRAS(G12C) in LUAD patients (3). Despite the promise of KRAS(G12C) inhibitors, early results from human clinical studies indicate that only 30–50% of patients respond (4). Furthermore, the duration of response in these patients is limited by acquired resistance involving activation of parallel signaling pathways that bypass KRAS, lineage transformation, or drug-desensitizing mutations in KRAS itself (5,6). A next generation of mutant KRAS allele-specific inhibitors is emerging, including KRAS(G12D) inhibitors (1,7). However, early results suggest that patient-derived xenograft (PDX) models established from LUAD patients may be less responsive to these inhibitors than pancreas cancer models (7). These preclinical and clinical data suggest that LUAD may harbor lineage-specific features that limit the efficacy of KRAS inhibitors.
LUAD predominantly arises from alveolar type 2 (AT2) epithelial cells, which function as facultative alveolar stem cells by self-renewing and replacing alveolar type 1 (AT1) cells. Following injury, AT2 cells proliferate and expand in response to receptor tyrosine kinase (RTK) ligands emanating from the lung stroma (8). Upon cessation of these mitogenic signals, a subset of AT2 cells differentiates into AT1 cells, completing alveolar re-epithelialization (8). Oncoproteins mimic these mitogenic signals but, unlike physiological mitogens, they are perpetually active in LUAD cells. This relentless oncogene activity conspires with acquired genetic and epigenetic changes to drive the emergence of tumors composed of diverse phenotypically distinct cancer cell states (9). Among many aspects of malignant progression, the clinical relevance of this intra-tumoral heterogeneity manifests in the distinct capacities of cancer cell states for treatment resistance. Specific cell states driving drug resistance have been described in e.g. colon cancer (10), basal skin tumors (11,12), and glioblastomas (13). In most cases, the resistant states are characterized by features of normal tissue stem cells or progenitors (10,11,13,14). A recent report described an alveolar progenitor-like cell state that was enriched in LUAD residual disease following EGFR- or ALK-targeted therapy (15). The effect of targeting oncogenic KRAS on cancer cell states in LUAD has not been investigated.
Given that efficacy of KRAS inhibitors in patients is limited by intrinsic and acquired resistance poses several important questions: What is the cellular source of cancer cells that acquire resistance to KRAS inhibitors? Are there LUAD cell states that are intrinsically independent of KRAS signaling and, if such cell states exist, can targeting them eradicate resistance to KRAS inhibition? To address these questions, we employed genetically engineered mouse models (GEMMs) of LUAD, based on the activation of oncogenic Kras(G12D) and deletion of p53 (“KP” model) in AT2 cells. These models recapitulate key molecular and histopathological features of LUAD tumors in humans (16).
Results
Targeting Kras promotes an AT1-like differentiation program in LUAD cells
To investigate the impact of targeting KRAS in autochthonous LUAD tumors, we generated two germline KP models that enable doxycycline (Dox)-inducible tumor-specific short hairpin RNA (shRNA)-mediated silencing of Kras; we also generated a control shRNA model targeting Renilla luciferase (Fig. 1A) (17,18). In these mice, an shRNA is coupled to a GFP cDNA, placed downstream of a tetracycline-responsive (TET) promoter, and targeted via recombinase-mediated cassette exchange to the ubiquitously expressed Col1a1 locus (Supplementary Fig. 1A–C) (19,20). In this KP; RIK; TET-GFPshRNA system, adenoviral delivery of Cre recombinase under the control of an AT2 cell-specific surfactant protein C promoter [AdSPC-Cre (21)] leads to the expression of oncogenic KrasG12D and deletion of the tumor suppressor p53, resulting in LUAD development. In addition, the delivery of Cre recombinase activates the expression of reverse tetracycline transactivator-3 (rtTA3) and the mKate2 fluorescent protein (rtTA3-IRES-mKate2, or RIK cassette) in the KP mutant cells. Upon systemic administration of Dox to the mice, rtTA3 will bind to tetracycline responsive elements (TRE), resulting in the expression of a GFP-linked shRNA targeting Kras (shKras247 or shKras462) or Renilla (control) specifically in the LUAD cells (Fig. 1B).
Figure 1. Targeting Kras promotes an AT1-like differentiation program in LUAD cells.

(A) Genetically engineered KP; RIK; TET-GFPshRNA mouse model enabling doxycycline (Dox)-inducible shRNA expression in KP LUAD cells. (B) Experimental design for targeting Kras using the KP; RIK; TET-GFPshRNA system. Inset: Flow cytometry plot showing induction of GFPshRNA upon Dox administration in the KP tumors in vivo. Cell gating: CD45−/CD31−/CD11b−/F480−/TER119−/DAPI− (live). (C) GFP expression in mKate+/CD45−/CD31−/CD11b−/F480−/TER119−/DAPI− (live) cells in shRenilla and shKras groups at different time points. (D) Proportion of GFP+/mKate+ cells in the total mKate+ LUAD cell pool in shRenilla and shKras groups at indicated time points; n = 3 replicates per model for each time point. (E) Relative KRAS(G12D) protein expression in isolated primary GFP+/mKate+ KP; RIK; TET-GFPshRNA LUAD cells after 20 days on Dox; n = 3 mice/group. (F) Fraction of proliferating (Ki67+) GFP+/mKate+ LUAD cells after 5 days on Dox; n ≥ 13 mice/group. (G) Unsupervised clustering of GFP+/mKate+ single LUAD cell transcriptomes, colored and annotated based on Marjanovic et al. (9). Normal healthy AT2 and AT1 single-cell transcriptomes (gray) isolated from wild-type mice are co-embedded. (H) Projection of wild-type mouse AT1 cell gene expression signature (47) onto the UMAP space shown in (G). (I) Location of KP; RIK; TET-GFPshRNA LUAD cell transcriptomes in the UMAP space following expression of shRenilla control or shKras247/shKras462 at the indicated time points; n = 3–4 mice/group (750 randomly sampled cells per condition). (J) Fold change (log2) in the proportion of the distinct cancer cell subsets shown in (G) following expression of shKras at the indicated time points. Open circle: p < 0.05; closed circle: p < 0.01 (t test vs. shRenilla with individual tumors as biological replicates). (K) Signature score of four independent AT1 cell signatures in the AT1-like LUAD cell state (orange) in each model. The average score of the single-cell transcriptomes in each group is shown. Note increasing expression of AT1 cell genes over time. Open circle: p < 0.05; closed circle: p < 0.01 (t test vs. shRenilla with individual tumors as biological replicates). (L) Left: projection of Hopx expression level onto the UMAP in (G). Right: representative images of HOPX immunofluorescence (red) in the LUAD cells expressing the indicated shRNAs (green). Arrowheads indicate HOPX+/GFP+ cells. Scale bar: 100 μm. (M) Quantification of the fraction of HOPX+/GFP+ cells within the total GFP+ cell pool; n ≥ 36 tumors/experimental group. Two-way ANOVA was used in (D), (E), (F), and (M) to test for statistical significance: **** p < 0.0001; ** p < 0.01; * p < 0.05. Error bars indicate SEM.
To test these models, we induced LUAD in the KP; RIK; TET-GFPshRNA mice using AdSPC-Cre. We isolated mKate+ cancer cells from all three models at 16 weeks post-tumor initiation (PTI), a time point when the tumors had progressed to fully formed adenocarcinoma (21), and generated adherent cell lines (Supplementary Fig. 1D). Induction of the shRNAs targeting Kras depleted KRAS protein expression, suppressed ERK phosphorylation, and inhibited growth of these cell lines, whereas induction of the shRenilla control had no effect (Supplementary Fig. 1E, F). To evaluate the shRNAs in vivo, KP; RIK; TET-GFPshRNA mice were placed on Dox for 3, 5, 10, and 20 days starting at 16 weeks PTI (Fig. 1B). The proportion of GFP+/mKate2+ LUAD cells was consistent in all shRNA models at 3 and 5 days following Dox exposure. However, after 10 or 20 days of shRNA expression, the fraction of GFP+/mKate2+ cells was significantly lower in the shKras247 and shKras462 mice than in the shRenilla controls (Fig. 1C, D), indicating selection against Kras knockdown. This selection likely occurs via silencing of the TET-GFPshRNA allele, which has been widely reported (17). We observed efficient depletion of the mutant KRAS(G12D) protein in GFP+/mKate+ LUAD cells expressing shKras247 and shKras462 when compared to shRenilla control in vivo (Fig. 1E; Supplementary Fig. 1G). Induction of either Kras shRNA suppressed the proliferation of the KP cancer cells in vivo and in vitro when compared to shRenilla control (Fig. 1F; Supplementary Fig. 1H). Finally, Kras knockdown promoted apoptosis of the LUAD cells in vivo, which was most prominent at 3 days of Dox exposure (Supplementary Fig. 1I). Taken together, these results establish our TET-inducible shRNA systems as a powerful genetic model of KRAS inhibition.
To investigate the impact of targeting KRAS on LUAD cell state heterogeneity, we examined the GFP+/mKate2+ cells that retained shRNA expression at 3, 5, 10, or 20 days of Dox exposure by single-cell mRNA sequencing (scRNA-seq) (Fig. 1B). The single-cell expression profiles spanned six clusters with distinct expression patterns by unsupervised clustering (Fig. 1G–I; Supplementary Data Table 1). These clusters corresponded to cell states that we had previously identified in fully formed KP LUAD tumors (Fig. 1G) (9). Interestingly, the trajectories of the LUAD cells expressing shKras247 or shKras462 began to separate from the shRenilla control at 3 days, culminating in a dramatic phenotypic shift at 20 days following shRNA expression (Fig. 1I). Surprisingly, this shift was defined by the enrichment of the LUAD cells predominantly in a defined region in phenotypic space exhibiting AT1-like identity (Fig. 1H–J). Conversely, the expression of shRenilla control over the 20-day treatment period had no effect on the topology of the phenotypic space occupied by cancer cells (Fig. 1I).
The LUAD cells in the AT1-like cluster distinctly expressed genes associated with AT1 differentiation (Fig. 1H). This signature showed some similarity to a previously published targeted therapy resistance signature observed in EGFR mutant LUAD cells (Supplementary Fig. 2A) (22). Notably, the shRenilla control tumors also harbored a subset of AT1-like LUAD cells, but the fraction of cells in this state was smaller (Fig. 1I, J) and the correlation of these cells with published AT1 gene expression signatures was less significant than in the shKras tumors (Fig. 1K). This indicates that – even in the AT1-like state – targeting Kras pushes LUAD cells further along the AT1 differentiation trajectory when compared to control tumors. Among the most prominent AT1 marker genes induced by Kras silencing was Hopx (Fig. 1L). We observed robust expression of HOPX protein in cancer cells in shKras tumors, but not in shRenilla tumors (Fig. 1L–M; Supplementary Fig. 2B, C). Notably, despite the expression of AT1 markers, the LUAD cells did not exhibit morphological features of AT1 cells, such as thinning and spreading on basement membranes (8), in response to KRAS inhibition. Furthermore, the AT1-like LUAD cells continued to express some AT2 markers, including Sftpc and Nkx2–1 (Supplementary Data Table 1). These results suggest that AT1 differentiation induced by KRAS suppression in LUAD cells is incomplete.
AT1-like LUAD cells are quiescent and exhibit low MAPK activity
We hypothesized that the AT1-like cancer cells persisting after KRAS suppression may be less dependent on KRAS activity. To investigate this, we evaluated phosphorylation of the KRAS effector ERK as a surrogate marker for KRAS signaling activity in unperturbed KP LUAD tumors and found highly variable pERK signaling activity in the cancer cells (Fig. 2A). Interestingly, HOPX+ AT1-like LUAD cells showed very low levels of pERK when compared to HOPX− LUAD cells (Fig. 2B, C). Furthermore, we found the AT1-like LUAD cells exhibited low Kras expression and significantly diminished KRAS downstream transcriptional output compared to the other LUAD cell states (Supplementary Fig. 2D, E). In line with lower KRAS signaling activity, we observed the HOPX+ LUAD cells were rarely positive for the proliferation marker Ki67 (Fig. 2D, E), suggesting that they are quiescent. These results suggest that the AT1-like differentiation state may be less dependent on KRAS than the other LUAD cell states, which may explain resistance of this state to KRAS inhibition.
Figure 2. KRAS suppresses AT1 differentiation in LUAD and in the regenerating lung.
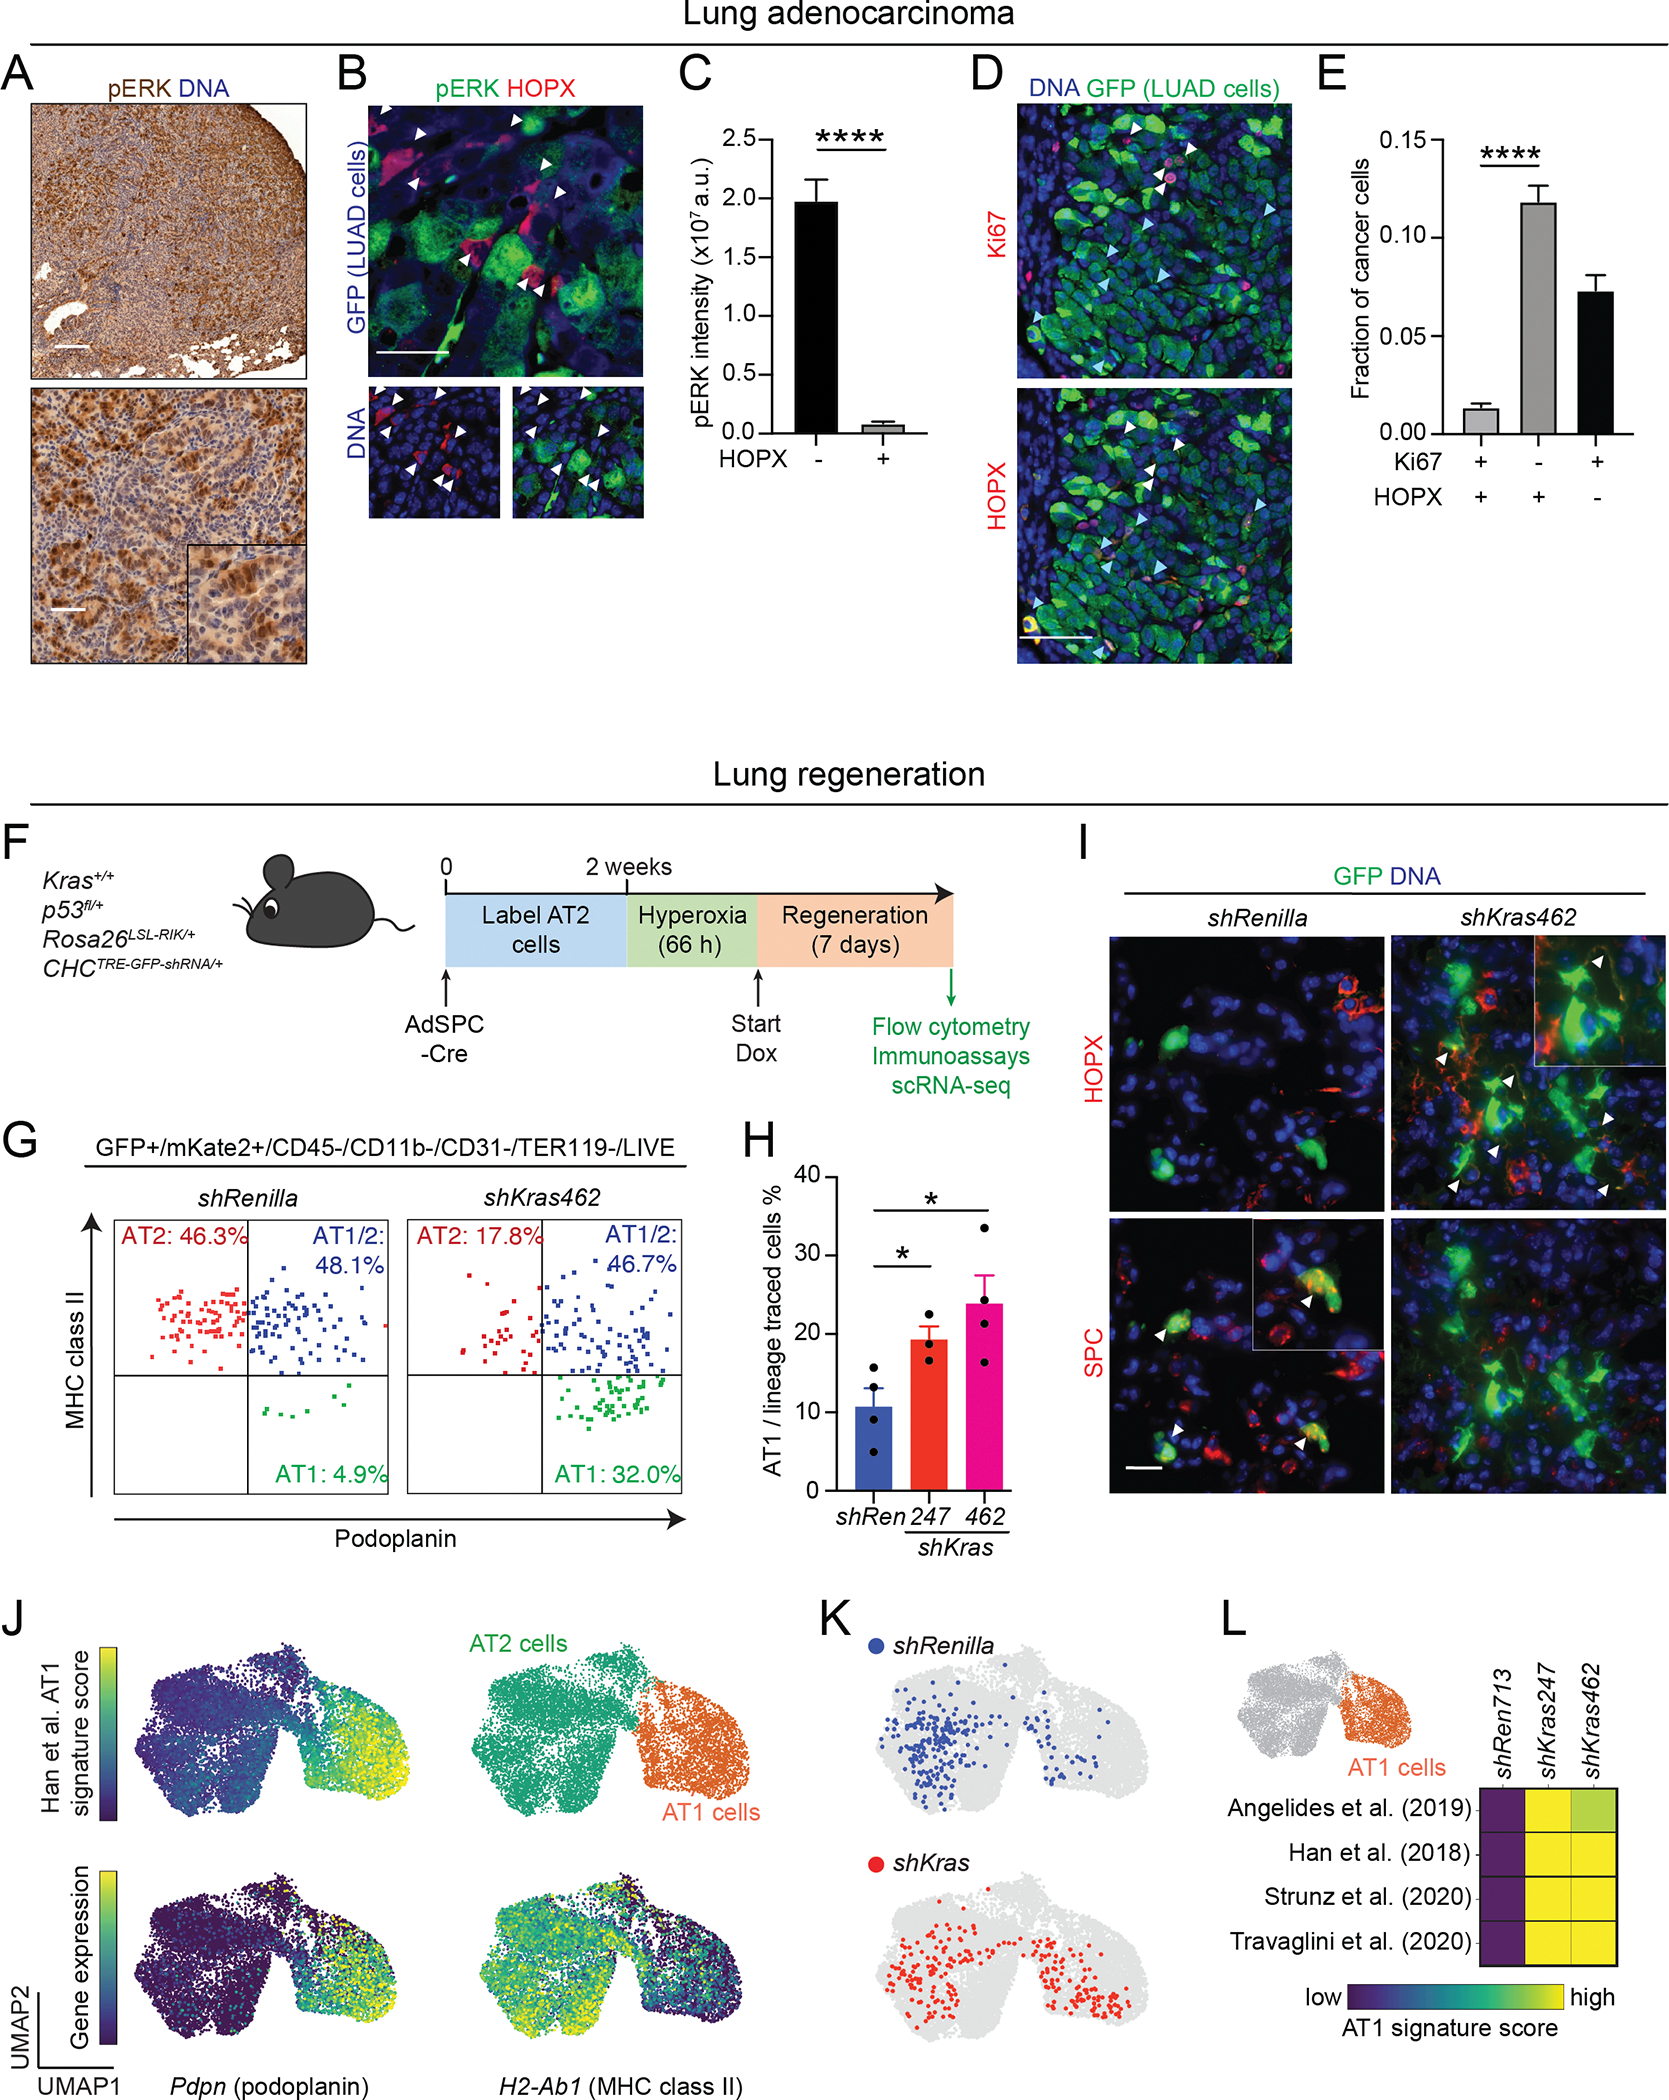
(A) Immunohistochemical staining for pERK (brown) in an autochthonous KP LUAD tumor at 16 weeks post-initiation. Scale bars: 200 μm (top) and 100 μm (bottom). (B) Representative images showing pERK (green) and HOPX (red) immunofluorescence in a KP; RIK; TET-GFPshRenilla LUAD tumor at 16 weeks post-tumor initiation + 5 days on Dox. GFP (blue in top image) marks LUAD cells expressing the shRenilla control shRNA. Note absence of pERK immunoreactivity in the HOPX+/GFP+ cells (arrowheads). Scale bar: 50 μm. (C) Quantification of pERK staining intensity in HOPX+/GFP+ vs. HOPX−/GFP+ LUAD cells in KP; RIK; TET-GFPshRenilla tumors at 16 weeks post-tumor initiation + 5 days on Dox; n = 168 tumors. An unpaired t test was used to test significance. (D) Representative images showing Ki67+ (red in top image) and HOPX+ (red in bottom image) in GFP+ LUAD cells in KP; RIK; TET-GFPshRenilla LUAD tumors at 16 weeks post-tumor initiation + 5 days on Dox. Note mutual exclusivity of HOPX (turquoise arrowheads) and Ki67 (white arrowheads) staining. Scale bar: 50 μm. (E) Quantification of the fraction of Ki67+/HOPX+/GFP+, Ki67−HOPX−/GFP+, and Ki67+/HOPX+/GFP+ LUAD cells in KP; RIK; TET-GFPshRenilla LUAD tumors at 16 weeks post-tumor initiation + 5 days on Dox; n = 59 tumors. (F) Outline of experiment combining AT2 cell lineage-tracing and perturbation of wild-type Kras using the RIK; TET-GFPshRNA system. (G) Representative flow cytometry plots depicting expression of the AT2 marker MHC class II (y-axis) and AT1 marker podoplanin (x-axis) in RIK; TET-GFPshRenilla vs. RIK; TET-GFPshKras462 mice following lineage-tracing, hyperoxia injury, and 7-day exposure to Dox. (H) Quantification of proportion of AT1 cells within total pool of lineage-traced AT2 cells; n = 3–4 mice/group. (I) Immunofluorescence for HOPX (red, top row) and SPC (red, bottom row). White arrowheads indicate HOPX+ AT1 cells in the top row, SPC+ AT2 cells in the bottom row. Scale bar: 20 μm. (J) Single-cell transcriptomes of lineage-traced (GFP+/mKate2+) RIK; TET-GFPshRenilla vs. RIK; TET-GFPshKras462 cells following hyperoxia injury, and 7-day exposure to Dox, co-embedded with primary AT2 and AT1 cell transcriptomes isolated from wild-type uninjured lungs. Heatmaps indicate AT1 gene expression score or H2-ab1 (MHC class II) or Pdpn (podoplanin) gene expression; unsupervised clustering separates AT2 (green) and AT1 (orange) cells. (K) Lineage-traced cells isolated from RIK; TET-GFPshRenilla (blue) or RIK; TET-GFPshKras462 (red) mice are projected into UMAP space (250 random samples cells per condition). (L) Heatmap showing four previously published healthy AT1 cell signatures in the AT1 space (orange) in the indicated RIK; TET-GFPshRNA models. The average score over all single-cell transcriptomes per group; n = 2–4 models/group is shown. Two-way ANOVA was used in (E), and (H) to test for statistical significance: **** p < 0.0001; * p < 0.05. Error bars indicate SEM.
KRAS suppresses AT1 differentiation during lung regeneration
In homeostasis and regeneration of the healthy lung, AT1 cells arise from AT2 cells (8). Similarly, we found targeting KRAS promotes AT1 differentiation and quiescence of LUAD cells. This tantalizing analogy prompted us to examine the role of KRAS in AT2/AT1 differentiation during lung regeneration leveraging our RIK; TET-GFPshRNA system in Kras wild-type mice. We poised the TET-inducible shRNA system in AT2 cells of these mice using AdSPC-Cre and induced hyperoxia injury, followed by induction of the shRNAs targeting Kras or Renilla control (Fig. 2F). Silencing Kras led to a significant increase in the proportion of traced cells expressing the AT1 markers podoplanin and HOPX compared to control shRNA (Fig. 2G–I). Furthermore, targeting Kras promoted the acquisition of AT1 transcriptomic features (Fig. 2J–L; Supplementary Data Table 2), indicating that suppressing KRAS robustly promotes AT2 differentiation towards the AT1 lineage.
Enrichment of AT1-like LUAD cells in residual disease following KRAS inhibition
We next sought to investigate the impact of pharmacologic inhibition of oncogenic KRAS on LUAD cell states. To do this, we treated mice bearing autochthonous KP; Rosa26tdTomato/+ (KPT) tumors with the KRAS(G12D) allele-specific inhibitor MRTX1133 starting at 16 weeks PTI for 5 or 20 days (Fig. 3A). We observed a significant reduction in tumor burden and cancer cell proliferation as well as increased apoptosis in the MRTX1133 treated mice compared to vehicle controls (Fig. 3B–E). Similar to the shRNA model, MRTX1133 promoted the enrichment of LUAD cells expressing the AT1 marker HOPX (Fig. 3F) and induced AT1 gene expression programs (Fig. 3G–J). The extent of AT1 lineage gene expression was most profound at 20 days following KRAS inhibition with MRTX1133 (Fig. 3I, J). Notably, in contrast to the shKras models, MRTX1133 also enriched for a cell cluster mapping within an AT2-like cancer cell state (Fig. 3G–I). Furthermore, transcriptomic changes induced by KRAS inhibition showed similarity to receptor tyrosine kinase (RTK) inhibitor resistance signatures observed previously in LUAD cells (Supplementary Fig. 3A) (15,22). Conversely, cisplatin chemotherapy did not induce AT1 differentiation in the autochthonous KP LUAD tumors (Supplementary Fig. 3B–D; Supplementary Table 3, 4), suggesting that alveolar differentiation is a resistance mechanism to therapies targeting the RTK-KRAS axis.
Figure 3. Pharmacologic allele-specific inhibition of KRAS promotes an AT1-like differentiation program in LUAD cells.

(A) Outline of experimental design to investigate KRAS(G12D) inhibition in autochthonous KPT LUAD tumors using the KRAS(G12D) inhibitor MRTX1133. (B) Quantification of tumor burden (tdTomato+ area/total lung cross-sectional area) at 16 weeks post-tumor initiation + 20 days on MRTX1133 or vehicle control; n ≥ 6. (C) Representative images of tdTomato immunofluorescence in KPT lung tumors after 20 days of MRTX1133 or vehicle administration. Scale bar: 1 mm. (D) Quantification of apoptotic [cleaved caspase 3 (CC3)+/tdTomato+] cancer cells at 16 weeks post-tumor initiation + 5 days on MRTX1133 or vehicle control (n ≥ 17). (E) Left: Representative images of Ki67 and tdTomato immunofluorescence magnified from the boxed region in (C). Scale bar: 50 μm. Right: Quantification of proliferating (Ki67+/tdTomato+) cancer cells in LUAD tumors at 16 weeks post-tumor initiation + 20 days on MRTX1133 or vehicle control (n ≥ 37). (F) Left: Representative images of HOPX and tdTomato immunofluorescence in the boxed region in (C). Scale bar: 50 μm. Right: Quantification of AT1-like (HOPX+/tdTomato+) cancer cells in LUAD tumors at 16 weeks post-tumor initiation + 20 days on MRTX1133 or vehicle control (n ≥ 37). (G) Unsupervised clustering of tdTomato+/CD45−/CD31−/CD11b−/F480−/TER119−/DAPI− single LUAD cell transcriptomes, colored and annotated based on Marjanovic et al. (9). (H) Location of the LUAD cell transcriptomes in the UMAP space following exposure to vehicle control (blue) or MRTX1133 (red) at the indicated time points (n = 3–4 mice/group). (I) Fold change in the proportion of the distinct cancer cell subsets shown in (C) following MRTX1133 therapy or vehicle control at the indicated time points. Open circle: p < 0.05; closed circle: p < 0.01 (t test vs. vehicle with individual tumors as biological replicates). (J) Signature score of four independent healthy AT1 cell signatures in the AT1-like LUAD cell state (orange) following MRTX1133 therapy or vehicle control. The average score over all single-cell transcriptomes per group is shown. Note increasing expression of AT1 cell genes over time. Open circle: p < 0.05; closed circle: p < 0.01 (t test vs. vehicle with individual tumors as biological replicates). (K) Outline of experimental design to investigate KRAS(G12C) inhibition in autochthonous KRAS(G12C)PT LUAD tumors. (L) Left: Representative images of tdTomato immunofluorescence in KRAS(G12C)PT lung tumors at 16 weeks post-tumor initiation + 20 days on sotorasib or vehicle. Scale bar: 1 mm. Right: Quantification of tumor burden (tdTomato+ area/total lung cross-sectional area) following 20 days of sotorasib therapy or vehicle control; n = 3. (M) Left: Representative images of HOPX and tdTomato immunofluorescence in the boxed region in (L). Scale bar: 50 μm. Right: Quantification of AT1-like (HOPX+/tdTomato+) cancer cells in LUAD tumors at 16 weeks post-tumor initiation + 20 days on sotorasib or vehicle control (n ≥ 18 tumors/group). Unpaired t test was used in (B), (D), (E), (F), (L) and (M) to test for statistical significance: **** p < 0.0001; *** p < 0.001; ** p < 0.01;* p < 0.05. Error bars indicate SEM.
To extend our analysis beyond the KRAS(G12D) allele, we generated autochthonous KrasLSL-G12C/+;Trp53flox/flox; Rosa26tdTomato/+ [K(G12C)PT] tumors and administered the clinically approved KRAS(G12C) allele-specific inhibitor sotorasib starting at 20 weeks PTI for 20 days (Fig. 3K). We observed a significant reduction in tumor burden (Fig. 3L). Similar to the KRAS(G12D) models, sotorasib promoted the enrichment of LUAD cells expressing the AT1 marker HOPX (Fig. 3M). Taken together, our results using orthogonal genetic and pharmacologic approaches indicate that alveolar differentiation is a prominent feature of LUAD cells that escape KRAS inhibition.
AT1-like LUAD cells arise via trans-differentiation in response to KRAS inhibitors
We next sought to investigate the kinetics of the AT1-like LUAD cell state during KRAS inhibition. To do this, we introduced a “MACD” reporter construct into the Hopx locus of KP LUAD cells. MACD is a cDNA cassette comprising mScarlet red fluorescent protein, a super-bright bioluminescence reporter [AkaLuc (23)], tamoxifen-activatable Cre recombinase (CreER), and diphtheria toxin (DT) receptor (DTR) (Fig. 4A; Supplementary Fig. 4A, B). Into these cells, we also introduced a lentiviral construct encoding constitutive Gaussia princeps luciferase (G-Luc) and far-red monomeric iRFP670 (miRFP) fluorescent protein as well as a Cre-inducible tagBFP2 (BFP) fluorescent protein cassette (Fig. 4A). G-Luc is naturally secreted, enabling its detection using a specific substrate from a small volume of plasma (24). Administration of MRTX1133 rapidly suppressed growth and G-Luc in the serum of mice bearing subcutaneous transplants, which resumed following cessation of MRTX1133 therapy (Fig. 4B, C; Supplementary Fig. 4C). We examined the kinetics of AT1-like state emergence in this experiment by AkaLuc bioluminescence imaging (Fig. 4D). Normalizing AkaLuc to G-Luc revealed a robust relative increase in Hopx gene expression in response to MRTX1133 (Fig. 4E), consistent with enrichment of AT1-like LUAD cells in residual disease. Interestingly, cessation of MRTX1133 administration led to a precipitous drop in relative Hopx expression (Fig. 4E), suggesting loss of AT1 identity.
Figure 4. Enrichment of an AT1-like cancer cell state in response to KRAS inhibitors in LUAD.

(A) Genetically engineered Hopx-MACD reporter system enabling lineage tracing and ablation of AT1-like KP LUAD cells. Frt-Stop-Frt-mScarlet-Akaluc-CreERT2-DTR reporter construct knocked in frame into the stop codon of Hopx exon 3. T2A and P2A: short polypeptide cleavage sites. PGK-Gluc-miRFP-EFS-lox-BFP-lox lentiviral lineage tracing vector was integrated into the Hopx-MACD reporter cells, enabling lineage-tracing of Hopx+ cells with a single pulse of tamoxifen (TAM). (B) Outline of experimental design to investigate Hopx expression during and following withdrawal of KRAS(G12D) inhibition in subcutaneous KRAS(G12D);P;Hopx-MACD LUAD tumors using bioluminescence imaging (BLI) at the indicated time points. (C) Tumor burden measured by Gaussia princeps (G-Luc) luminescence in response to MRTX1133 therapy (n ≥ 7 mice/group). (D) Hopx::AkaLuc bioluminescence detection in mice bearing KP; Hopx-MACD reporter allografts subjected to vehicle (top) or MRTX1133 (bottom) before (day 0), ON (10 days on), and OFF (7 days off) treatment. (E) Quantification of Hopx::AkaLuc bioluminescence normalized to tumor burden (G-Luc bioluminescence) (n ≥ 14 tumors/group). (F) Left: Representative images of KP; Hopx-MACD reporter cells in 2D culture at 4 h and 10 h following exposure to MRTX1133. Note induction of Hopx expression as indicated by mScarlet fluorescence (white arrowheads). Scale bar: 200 μm. Right: Quantification of number of cells switching to the AT1-like state (mScarlet+) per high-power field (HPF) (n = 6/group). (G) Experimental design for lineage-tracing the AT-like state before KRAS(G12D) inhibition in subcutaneous KP; Hopx-MACD reporter allografts. (H) Representative images of BFP and mScarlet immunofluorescence in the KP; Hopx-MACD reporter allografts before and on MRTX1133 or vehicle exposure. Scale bars: top 50 μm, bottom 25 μm. Note efficient labeling of mScarlet+ cells (BFP+/mScarlet+, white arrowheads) at 3 days following TAM administration and an increase of non-traced cells (BFP−/mScarlet+; yellow arrowheads) during MRTX1133 treatment. (I) Quantification of non-traced Hopx+ (BFP−/mScarlet+) cancer cells in Hopx+ (mScarlet+) tumors in (H) (n ≥ 3 tumors/group). (J) Schematic summary of findings: KRAS inhibition induces AT1 differentiation in non-AT1 LUAD cell states. Unpaired t test was used in (F) and (I) to test for statistical significance: *** p < 0.001; * p < 0.05. Error bars indicate SEM.
We next utilized our reporter system to interrogate whether the increase in AT1-like LUAD cells following KRAS inhibition is due to enrichment of pre-existing AT1-like cells or trans-differentiation of other LUAD cell states. We observed an induction of mScarlet fluorescence in cultured KP; Hopx-MACD reporter cells subjected to MRTX1133 (Supplementary Fig. 4D). Time-lapse imaging of individual cells revealed a significant increase in cells that switched from non-AT1-like (Hopx::mScarlet−) to AT1-like (Hopx::mScarlet+) in response to MRTX1133 when compared to control (Fig. 4F). This indicates that KRAS inhibition induces Hopx in Hopx− LUAD cells. We next addressed the source of the AT1-like LUAD cells in vivo by lineage-tracing the AT1-like cells in established subcutaneous KP; Hopx-MACD allografts before administration of MRTX1133 (Fig. 4G). We observed faithful labeling of the AT1-like cells at 3 days following administration of a single pulse of tamoxifen (Fig. 4H, left; Supplementary Fig. 4E). Interestingly, the fraction of non-traced cells that express Hopx increased in response to MRTX1133 therapy, but not in response to vehicle (Fig. 4H, I; Supplementary Fig. 4F). Taken together, we conclude that KRAS inhibition induces AT1 trans-differentiation in LUAD cells (Fig. 4J).
LUAD cells drive relapse but lose AT1-like identity following withdrawal of KRAS inhibition
Our findings raised the possibility that the AT1-like cells within the residual disease may serve as a source of relapse upon the emergence of acquired resistance. To model this scenario, we tested the growth potential of podoplanin+ AT1-like cells isolated from autochthonous KPT LUAD tumors at 20 days of MRTX1133 exposure in vitro in a tumor sphere assay (Fig. 5A, B; Supplementary Fig. 5A). MRTX1133 was withdrawn in these assays following cell sorting to mimic loss of drug activity on the mutant oncoprotein. We found that the podoplanin+ cells exhibited superior growth potential when compared to podoplanin− cells isolated from the MRTX1133-treated tumors (Fig. 5B, C). No difference was observed when comparing podoplanin+ vs. podoplanin− LUAD cells isolated from vehicle control tumors (Fig. 5B, C).
Figure 5. AT1-like LUAD cells drive resistance to and relapse following KRAS inhibition.

(A) Histogram showing podoplanin expression in tdTomato+/CD45−/CD31−/CD11b−/F480−/TER119−/DAPI− (live) LUAD cells isolated from autochthonous tumors at 16 weeks post-tumor initiation plus 20 days on MRTX1133 (red) or vehicle control (blue). MFI: median fluorescence intensity. Dashed line separates podoplanin− (–) and podoplanin+ (+) cells. (B) Representative images of 3D tumor spheres established from podoplanin+ [+ in (A)] and podoplanin− [- in (A)] LUAD cells isolated from autochthonous tumors at 16 weeks post-tumor initiation plus 20 days on MRTX1133 or vehicle control. Spheres were cultured for 10 days in the absence of drug. Scale bar: 500 μm. (C) Quantification of the number of tumor spheres in the experiment outlined in (G-H); n = 8, 12, 3, and 5 mice from left to right. (D) Left: Histogram showing podoplanin expression in tdTomato+/CD45−/CD31−/CD11b−/F480−/TER119−/DAPI− (live) LUAD cells isolated from autochthonous tumors at 16 weeks post-tumor initiation plus 20 days on vehicle (blue) or MRTX1133 (red), or 20 days on MRTX1133 plus 10 days of MRTX1133 washout (purple). Right: Quantification of the percentage of podoplanin+ cells in the aforementioned conditions (n ≥ 6). One-way ANOVA was used to examine statistical significance. (E) Outline of experimental design to lineage-trace Hopx+ AT1-like LUAD cells on and after MRTX1133 therapy vs. vehicle control in subcutaneous KP; Hopx-MACD reporter allografts. (F) Representative images of BFP and mScarlet immunofluorescence in KP; Hopx-MACD reporter allografts at 13 days on MRTX1133 therapy (left) and 7 days after relapse (right). Note efficient labeling of Hopx::mScarlet+ cells (BFP+/mScarlet+; white arrowheads) after TAM administration and increase in lineage-traced cells that are not in the AT1-like state (BFP+/mScarlet−; turquoise arrowheads) after withdrawal of MRTX1133. Scale bars at top: 50 μm; scale bar at bottom: 25 μm. (G) Quantification of lineage-traced cells not in AT1-like state (BFP+/mScarlet−) (n ≥ 3 tumors/group). An unpaired t test was used to examine significance. (H) Unsupervised clustering of miRFP+/CD45−/CD31−/CD11b−/F480−/TER119−/DAPI− single LUAD cell transcriptomes, colored and annotated based on unsupervised Leiden clustering. (I) Projection of mouse AT1 cell gene expression signature (47) onto the UMAP space. (J) LUAD cell transcriptomes in the UMAP space following exposure to vehicle control (blue) or AT1 lineage-traced cells after 13 days of MRTX1133 exposure followed by 7 days of drug washout (red). Purple arrow indicates transdifferentiation of the AT1-like cells from the AT1-like state (orange dashed line) into other LUAD cell states. (K) Fraction of vehicle vs. AT1-lineage-traced cells transiently exposed to MRTX1133 in the Leiden clusters (H) (n = 3 mice/group). (L) Schematic summary of key findings: Loss of AT1-like identity during KRAS reactivation and tumor relapse. (M) Outline of experimental design to test ablation of Hopx+ AT1-like LUAD cells in the context of MRTX1133 therapy or vehicle control in a subcutaneous KP; Hopx-MACD reporter allografts. (N) Quantification of the percentage of mScarlet+ cells within the miRFP+/CD45−/CD31−/CD11b−/F480−/TER119−/DAPI− (live) total LUAD cell pool at 20 days following MRTX1133 therapy or vehicle with or without DT (n ≥ 6). (O) Volume of subcutaneous KP; Hopx-MACD reporter allografts subjected to the indicated therapies; n ≥ 4/group. Asterisks indicate statistical significance (unpaired t test p-value) between MRTX1133 vs. MRTX1133 + DT groups. Two-way ANOVA was used in (C) and (N) to test for statistical significance: **** p < 0.0001; *** p < 0.001; ** p < 0.01; * p < 0.05. Error bars indicate SEM.
We had observed that cessation of MRTX1133 therapy leads to rapid regrowth of subcutaneous LUAD allografts, which coincided with downregulation of Hopx (Fig. 4C–E; Supplementary Fig. 4C). Similarly, we found that the proportion of the AT1-like cells returned back to baseline in autochthonous KP LUAD tumors at 10 days following cessation of MRTX1133 administration after 20 days of therapy (Fig. 5D). These results suggested that the AT1-like LUAD cells de-differentiate following KRAS reactivation. To test this, we returned to our lineage-tracing system (Fig. 4A, Supplementary Fig. 4A, B). This time, we induced lineage-tracing of the AT1-like cells at residual disease (at 10 days of MRTX1133 therapy) (Fig. 5E). Again, our system traced the AT1-like LUAD cells at high fidelity (Fig. 5F, left; Fig. 5G). Interestingly, the majority of the traced cells lost AT1 identity upon withdrawal of MRTX1133 (Fig. 5F, right; Fig. 5G; Supplementary Fig. 5B). To provide a more granular view of the fate of the AT1-like cells following reactivation of KRAS, we performed scRNA-seq on the AT1 lineage-traced LUAD cells 7 days following withdrawal of MRTX1133 (Fig. 5H, I). Vehicle-treated LUAD cell transcriptomes were used as a reference (Fig. 5J, left). Although the traced cells showed an enrichment for the AT1-like state, a significant fraction of the traced cells were detected throughout the phenotypic space defined by vehicle-treated control cells (Fig. 5J, K). Thus, the AT1-like cells harbor the capacity to differentiate into multiple other LUAD cell states. In sum, these findings indicate the AT1-like LUAD cells within the residual disease harbor potential to reignite tumor growth upon treatment cessation or following emergence of acquired resistance. Furthermore, the reactivation of KRAS and relapse outgrowth are characterized by plastic transitions of the AT1-like cells into other cancer cell states within the tumors (Fig. 5L).
Targeting AT1-like LUAD cell state augments response to KRAS inhibitors
Our results suggest that the AT1-like LUAD cells contribute to treatment resistance to KRAS inhibitors, casting the AT1-like cell state as an attractive therapeutic target for cytoablative therapies. To test this, we utilized the KP; Hopx-MACD reporter to ablate the AT1-like cells in established tumors by providing the mice with diphtheria toxin (DT) (Fig. 5M). MRTX1133 promoted the expression of the reporter construct, indicating enrichment of AT1-like cancer cells, whereas administration of DT efficiently eradicated the reporter-positive cells in both MRTX1133 and vehicle-treated tumors (Fig. 5N). Notably, co-administration of DT with MRTX1133 robustly delayed tumor relapse when compared to MRTX1133 alone, whereas ablation of the AT1-like cells alone had no effect on tumor growth in the absence of MRTX1133 (Fig. 5O; Supplementary Fig. 5C). These results indicate that targeting the AT1-like LUAD cells augments response to KRAS inhibitors.
AT1-like cell state is enriched in residual disease induced by KRAS inhibitors in human LUAD
To evaluate whether our findings in the mouse model translate to human LUAD, we evaluated four PDX models harboring KRAS(G12C) mutations (Fig. 6A; Supplementary Fig. 6) (25). We targeted KRAS(G12C) in these tumors using sotorasib or adagrasib, clinically approved small molecule inhibitors that specifically target the KRAS(G12C) oncoprotein (26). All four PDX models showed growth inhibition in response to the KRAS(G12C) inhibitors (Fig. 6B; Supplementary Fig. 7A). We observed similar AT1 differentiation and marker expression in the PDXs following KRAS(G12C) inhibition as in the mouse models (Fig. 6C–E; Supplementary Fig. 7B, C; Supplementary Table 3, 4). Finally, we obtained clinical samples of KRAS(G12C) mutant human LUAD patient tissues longitudinally harvested from accessible metastatic sites either pre-treatment or on sotorasib or adagrasib therapy (Supplementary Fig. 6). Strikingly, patients on sotorasib or adagrasib showed a dramatic induction of AT1 differentiation in LUAD tissues as evidenced by HOPX immunoreactivity, whereas pre-treatment samples showed negligible HOPX expression (Fig. 6F, G). Interestingly, this phenotype was independent of pERK status in the tumors (Supplementary Fig. 7D, E). In conclusion, both human and mouse LUAD tumors respond to KRAS inhibition by undergoing a phenotypic shift towards an AT1-like state, indicating conservation of the cellular programs governing resistance to KRAS inhibition across species and individual patients (Fig. 6H).
Figure 6. KRAS inhibitors enrich for AT1-like cancer cells in human LUAD.

(A) Experiment to investigate KRAS(G12C) inhibition in a human LUAD PDX model using sotorasib. (B) Tumor volume fold change in response to sotorasib therapy (n ≥ 3 mice/group). Statistical significance was examined using an unpaired t test. (C) HOPX immunofluorescence in PDX models subjected to 10 days of sotorasib therapy. White arrowheads indicate HOPX+ cells. Scale bar: 20 μm. (D) Quantification of the fraction of HOPX+ cells in the PDX model (n = 6 tumors/experimental condition). An unpaired t test was used to test for statistical significance. (E) Signature scores of wild-type AT1 cell and AT1-like LUAD cell signatures in the PDXs following adagrasib therapy or vehicle control. “Mouse AT1-like LUAD” and “Mouse MRTX1133” signatures were defined in this study (Supplementary Table 3 and Supplementary Table 4, respectively). Closed circle: p < 0.05 (three individual PDXs were used as biological replicates, see Supplementary Fig. 6). (F) HOPX (red) and pan-cytokeratin (pan-CK, green) immunofluorescence in longitudinal tumor tissue biopsies obtained from human patients before and on sotorasib or adagrasib therapy. Scale bar at left: 50 μm; scale bar at right: 25 μm. (G) Fraction of HOPX+/ pan-CK+ area in tumor regions in matched pre-treatment and on-sotorasib (blue line) or on-adagrasib (orange line) biopsies. A paired t test was used to test for statistical significance. (H) Schematic summary of key findings. See text. * p < 0.05. Error bars indicate SEM.
Discussion
We discovered an AT1-like cancer cell state resistant to KRAS inhibition in LUAD. This finding is surprising because treatment-resistant cancer cell states have in many cancer types been suggested to harbor de-differentiated or stem-like features (10,11,13,14). Our previous work uncovered the enrichment of a de-differentiated high-plasticity cell state following chemotherapy in LUAD, implicating this cell state as a key driver of chemoresistance (9). Emerging data in human patients undergoing EGFR- or ALK-targeted therapy showed residual disease is enriched for a similar AT1/AT2-like transcriptional signature (15), suggesting that the mechanisms whereby KRAS suppresses alveolar differentiation may be at least partially shared with other oncogenic drivers. Our results indicate residual disease induced by KRAS inhibitors is primarily composed of an AT1-like state that differentiates further towards the AT1 lineage with prolonged KRAS inhibition. Importantly, we observed similar accentuated AT1 differentiation upon silencing Kras during alveolar injury repair. In contrast, the primitive/de-differentiated LUAD cell states are highly sensitive to KRAS inhibition, suggesting that KRAS signaling is an important driver of these states. Identification of the signals and programs downstream of KRAS that control cancer cell fate is an important area of further inquiry and may elucidate molecular targets for overcoming drug resistance driven by alveolar differentiation.
Our study uncovered a previously unknown function for KRAS in alveolar regeneration. Upon alveolar injury, mitogenic RTK ligands such as EGF and FGF7 are induced in the microenvironment of AT2 cells, promoting their proliferation (8). Our results cast KRAS as a central RAS species transducing these RTK signals. In parallel to the RTK ligands, the AT2 cells respond to proinflammatory cytokines such as interleukin-1β upon injury, which increases their plasticity and blocks AT1 differentiation (27). We found that suppressing Kras promotes AT1 differentiation of regenerative AT2 cells, suggesting that KRAS signaling is a barrier to AT1 differentiation during the regenerative response. These results imply that acquisition of plasticity during regeneration requires KRAS activity in addition to proinflammatory programs. Accordingly, wild-type KRAS may provide a therapeutic entry point in diseases that are characterized by chronic inflammation and incomplete alveolar repair, such as idiopathic pulmonary fibrosis or chronic obstructive pulmonary disease (8,27). Thus, our findings unexpectedly motivate repurposing of the emerging inhibitors of wild-type KRAS (1) for regenerative medicine beyond their intended use in oncology.
We observed that, in addition to the AT1-like state, the residual disease following KRAS(G12D) inhibition also contains AT2-like cancer cells. Notably, this cell state was not enriched following shRNA-mediated targeting of Kras, raising the possibility the allele-specific inhibitors that, unlike the shRNAs, largely spare wild-type KRAS may have distinct effects from genetic perturbation. Full genetic deletion of oncogenic KRAS was recently reported to lead to complete LUAD regression (28). The difference in our system as opposed to complete genetic ablation of oncogenic KRAS can be explained by a need for low level of KRAS activity in the AT1-like cells or for a short period of adaptation to KRAS inhibition that does not manifest in complete genetic knockouts.
Notably, we found that isolated AT1-like cancer cells possess significantly higher growth potential than the remaining pool of LUAD cells in residual disease, which is primarily composed of AT2-like cancer cells. Furthermore, lineage-tracing revealed that the AT1-like LUAD cells in residual disease are plastic, harboring the capacity to trans-differentiate into other LUAD cell states. These findings suggest that the AT1-like state may serve as a safe harbor for LUAD cells under therapeutic pressure until they evolve acquired resistance. One intriguing future direction would be to investigate whether the plasticity of the AT1-like state endows it with the capacity for the neuroendocrine and/or squamous transformations that have been observed in response to EGFR and ALK-targeted therapies in LUAD (29). Another consideration is the susceptibility of the AT1-like state to immunological killing. KRAS has been shown to drive immunosuppression in lung cancer (30), whereas cytotoxic T lymphocytes contribute significantly to efficacy of KRAS-targeted therapies in pancreas cancer models (31). Additional studies are needed to investigate the combination of AT1 state ablation and KRAS inhibitors in immunocompetent models, either alone or in combination with immunotherapies.
Our data suggest that loss of KRAS signaling in LUAD cells repurposes a physiologic function – AT1 differentiation – in injury repair for drug resistance. Our reporter imaging and lineage-tracing results suggest that a significant proportion of the AT1-like cells observed in the residual disease arise from LUAD cells that are not in the AT1-like state, although the pre-existing AT1-like cells likely contribute as well. Such differentiation mimicry may have broader significance across other cancer types and oncoprotein-targeted therapies. Indeed, mutational activation of the mitogen-activated protein kinase (MAPK) pathway has been shown to drive de-differentiation in papillary thyroid cancer, which leads to downregulation of the iodine uptake machinery and resistance to radioiodine therapy (32,33). MEK inhibitors have limited efficacy as single agents in this disease, but they restore iodine import and re-sensitize the cancer cells to radioiodine in tumors harboring BRAF or NRAS mutations (32,33). Our study provides a conceptual framework for combining an oncoprotein-targeted therapy with a cytoablative therapy targeting a defined cancer cell state. Our work encourages the development of therapeutic strategies specifically targeting the AT1-like LUAD cells, such as CAR-T cells, antibody-drug conjugates, or engagers linking target cells with cytotoxic immune cells.
Our findings uncover an unexpected alveolar differentiation program underpinning resistance to KRAS inhibition in lung adenocarcinoma. We link this program to a previously unknown physiologic function for KRAS in lung regeneration. Our results implicate the AT1-like state as a biomarker of resistance to KRAS inhibitors and encourage development of therapeutic strategies to co-target KRAS and the AT1-like cancer cells in lung adenocarcinoma.
Methods
Mice
All animal studies were approved by the MSKCC Institutional Animal Care and Use Committee (protocol # 17-11-008). All genetically engineered mice were maintained on a mixed C57/BL6 and Sv129 background. Previously published Kraslox-stop-lox(LSL)-G12D/+ (34), Trp53flox/flox (35), Rosa26LSL-rtTA3-IRES-mKate2/+ (36), Rosa26LSL-tdTomato/+ (37), and KrasLSL-G12C/+ (38) mouse strains were used in this study. In addition, three distinct mouse embryonic stem cell (mESC) lines harboring TET-GFPshRNA cassettes containing shKras247, shKras462, or shRenilla elements in the Col1a1 locus were generated by recombinase-mediated cassette exchange, as previously reported (17,18,20). Sequences of the shRNAs are listed below:
shRenilla: CAGGAATTATAATGCTTATCT
shKras247: ACTTGACGATACAGCTAATTC
shKras462: CTTGAAGATATTCACCATTA
Chimeric F0 mice were obtained by injecting donor ESCs into host embryos in the 8-cell stage and crossed into the Kraslox-stop-lox(LSL)-G12D/+; Trp53flox/flox; Rosa26LSL-rtTA3-IRES-mKate2/+ background to generate Kraslox-stop-lox(LSL)-G12D/+; Trp53flox/flox; Rosa26LSL-rtTA3-IRES-mKate2/LSL-rtTA3-IRES-mKate2; Col1a1TRE-GFPshRNA/TRE-GFPshRNA (KP; RIK; TET-GFPshRNA) mice for experiments. RIK; TET-GFPshRNA mice without the KP alleles were used for the lung injury experiments. Mice were genotyped at ~2 weeks of age. Primers are listed in Supplementary Table 5. Immunocompromised NOD-SCID-gamma (NSG) mice were used as recipients for KP cell line allografts and LUAD PDXs. Mice were euthanized by CO2 asphyxiation followed by intracardiac perfusion with PBS to clear tissues of blood.
Autochthonous lung adenocarcinoma models
Lung tumors were initiated in 8–12-week-old KP; RIK; TET-GFPshRNA and KPT mice by intratracheal administration of 2.5 × 10⁸ plaque-forming units (pfu) of AdSPC-Cre (#Berns-1168, University of Iowa) as previously described (39). Expression of GFP-linked shRNAs was induced at 16 weeks post-tumor initiation, a time point when a significant majority of the cancer cells had progressed from adenoma to adenocarcinoma (9), by placing the KP; RIK; TET-GFPshRNA mice on doxycycline hyclate chow (doxycycline 625 mg/kg, Envigo). To boost the expression of the shRNA constructs the mice were also provided with 25 mg/kg doxycycline hydrochloride (#D3447, Sigma-Aldrich) resuspended in PBS via intraperitoneal injection once a day for the first two days of doxycycline treatment.
Patient-derived xenograft (PDX) models
PDXs were established under MSKCC IRB #06–107 and IRB #12–245. Focused exome profiling (MSK-IMPACT) was performed on clinical samples as a part of routine care at MSKCC (40). Mutational analysis of all PDXs is provided in Supplementary Fig. 6. PDXs were dissociated into single cells with digestion buffer containing collagenase IV (#17104019, ThermoFisher Scientific, 0.1 U/ml), dispase (#354235, Corning, 0.6 U/ml), and DNase I (#69182–3; Sigma Aldrich, 10 U/ml) for 2 hours at 37 °C. Following enzymatic dissociation, samples were washed with 2% heat-inactivated FBS in S-MEM (#11380037, Thermo Fisher Scientific), filtered through a 100 μm cell strainer (#431752, Corning), and centrifuged at 1500 rpm for 5 min at 4 °C. The supernatant was removed, and the pellet was resuspended in lysis buffer (#555899, BD Biosciences) to remove red blood cells. Cells were passed through a 40 μm strainer (#431750, Corning) and centrifuged at 1500 rpm for 5 min at room temperature. Cells were resuspended in 90% of heat-inactivated FBS with 10% DMSO and frozen in liquid nitrogen. Before transplantation, PDXs were thawed and resuspended in S-MEM and mixed with Matrigel at a 1:1 ratio. 100,000 cells were implanted subcutaneously into both flanks of NSG mice.
Administration of KRAS inhibitors
KPT mice bearing autochthonous LUAD tumors or NSG mice bearing subcutaneous KP cell line allografts were intraperitoneally administered freshly prepared MRTX1133 in captisol (#HY-17031, MedChem Express) at 30 mg/kg BID, as previously described (7), starting at 16 weeks following initiation of autochthonous lung tumors or two weeks post-transplantation of cell lines. In addition, the NSG mice bearing KP;Hopx-MACD cell line allografts were administered 50 μg/kg diphtheria toxin (#D0564, Sigma) resuspended in sterile PBS every other day by intraperitoneal injection at three weeks post-transplantation. NSG mice bearing subcutaneous PDXs and K(G12C)PT autochthonous mice were administered sotorasib (#HY-114277, MedChem Express, 30 mg/kg QD) or adagrasib (100 mg/kg QD) by oral gavage for 3, 10 or 20 days, as previously described (26,41). Vehicle controls were used for all drug treatments.
Hyperoxia lung injury
Alveolar injury was induced in RIK; TET-GFPshRNA mice by 66 hours of exposure to >85% O2 in a hyperoxia chamber (BioSpherix). The fractional-inspired oxygen concentration in the chamber was monitored by an in-line oxygen analyzer and maintained with a constant flow of gas (~3 L/min). Following hyperoxia exposure, mice were placed on doxycycline chow for 7 days, followed by euthanasia and lung tissue harvest for histological analysis or FACS and isolation of lung epithelial cells for scRNA-seq.
Isolation of primary LUAD and lung epithelial cells
To dissociate tumors into single-cell suspensions, primary tumors were finely chopped with scissors and incubated with digestion buffer containing collagenase IV (#17104019, ThermoFisher Scientific, 0.1 U/ml), dispase (#354235, Corning, 0.6 U/ml), and DNase I (#69182–3; Sigma Aldrich, 10 U/ml). For dissociating normal lung epithelial cells, digestion buffer was administrated intratracheally into the lung as described before (27). Following enzymatic dissociation, samples were washed with 2% heat-inactivated FBS in S-MEM (#11380037, Thermo Fisher Scientific), filtered through a 100 μm cell strainer (#431752, Corning), and centrifuged at 1500 rpm for 5 min at 4 °C. The supernatant was removed, and the pellet was resuspended in lysis buffer (#555899, BD Biosciences) to remove red blood cells. Cells were passed through a 40 μm strainer (#431750, Corning) and centrifuged at 1500 rpm for 5 min at room temperature. Cells were resuspended in 2% of heat-inactivated FBS in PBS. Cell suspensions were blocked for 5 min at 4 °C with rat anti-mouse CD16/CD32 (#553142, Mouse BD Fc Block, BD Biosciences) in FACS buffer, and incubated for 30 min with a mix of four APC-conjugated antibodies binding CD45 (#103112, Biolegend), CD31 (#102410, Biolegend), CD11b (#101212, Biolegend), F4/80 (#123116, BioLegend), CD19 (#115512, Biolegend), and TER-119 (#116212, Biolegend). 300 nM DAPI was added as a live-cell marker. Individual cancer cell suspensions were incubated for 30 min with hashtag oligonucleotide-conjugated antibodies (see Supplementary Table 6) in addition to FACS antibodies. Cell sorting was performed on a FACSAria sorter (BD Biosciences). Sorted cells were collected directly into S-MEM with 2% of heat-inactivated FBS for scRNA-seq.
Generation of Hopx reporter and lineage tracing cell line
Homology arms ~1500 bp in length 5’ and 3’ flanking the end of Hopx exon 3 were amplified from C57/BL6 genomic DNA using high-fidelity PCR (KME-101, Toyobo). A homology-directed repair template donor vector where frt-PGK-Hygro-pA-frt-T2A-mScarlet-Akaluc-T2A-CreER-P2A-DTR is flanked by the homology arms was cloned into the pUC19 plasmid backbone (#638949, Takara). Donor vector and RNP complex were transfected into mESC line harboring Krasfrt-stop-frt(LSL)-G12D/+, Trp53frt/frt by electroporation (4D Nucleofector, Lonza). Clones were validated by genotyping and sequencing using primers specifically detecting DTR, mScarlet, and spanning the homology arm. Primers are listed in Supplementary Table 5. Chimeric F0 mice were obtained by injecting the donor ESCs into host embryos at the 8-cell stage. Mice were genotyped at ~2 weeks of age (Supplementary Fig. 4A,B) using primers listed in Supplementary Table 5. AT2 cells were isolated from F0 Krasfrt-stop-frt(LSL)-G12D/+; Trp53frt/frt; HopxMACD/+ – wild-type hybrids, as described above. After sorting, the cells were transduced by lentivirus PGK-Flpo to remove the frt-TAG-bGlobinpA-(PGK-Hygro-pA)i-frt “STOP” cassette followed by expansion in tumor sphere culture (see below). Excision of the STOP cassette was confirmed by genotyping using PCR spanning mScarlet and the left homology arm as well as by flow cytometry analysis detecting mScarlet fluorescence in a subset of the cells (Supplementary Fig. 4A,B). The lentiviral lineage tracing vector (PGK-Gluc-miRFP-EFS-lox-BFP-lox) (Fig. 4A) was integrated into the Hopx-MACD reporter tumor organoids by spin infection at 300 g for 30 min at 37°C. Transduced cells were expanded and FACS-sorted into single-cell clones based on miRFP fluorescence, followed by expansion in 3D culture.
Cell culture and cell viability assays
Cells were cultured in a humidified incubator at 37°C under 5% CO2. Primary 2D mouse cell lines were generated from autochthonous KP and KP; RIK; TET-GFPshRNA LUAD tumors by dissociating primary lung tumors, as described above, and cultured in RPMI (Gibco) supplemented with 1% GlutaMax (#35050061, Thermo Fisher Scientific), 1% Pen/Strep (#15070063, Thermo Fisher Scientific), and 10% Heat-Inactivated FBS (#SH30910.03, Hyclone). Cells were passaged using 0.25% Trypsin-EDTA (#25200114, Invitrogen). All mouse and human cell lines were tested for mycoplasma frequently using a PCR assay. Cell viability in culture was measured by MTT (3-(4,5-dimethylthiazol-2-yl)-2,5-diphenyltetrazolium bromide) assay. Cells were exposed to Dox for 72 h and incubated with 0.25 mg/ml MTT for 4 hours at 37°C. Absorbance at OD 590 nm was measured to evaluate cell viability. An Incucyte imager (Sartorius) was used to image cell plates in both phase and RFP channels for time-lapse imaging. Cells were scanned every two hours for 3 days starting at 2 h from the start of MRTX1133 exposure.
Tumor sphere culture
FACS-purified podoplanin+ or podoplanin− LUAD cells isolated from KPT mice were resuspended in tumor sphere culture medium [Advanced DMEM/F12 (Gibco), 2% FBS (#SH30910.03, Hyclone), 1% GlutaMax (#35050061, Thermo Fisher Scientific), 1% Pen/Strep (#15070063, Thermo Fisher Scientific)] and mixed with 50 μl Matrigel (#CB-40230C, Fisher Scientific). The cell-Matrigel mix was placed in 24-well plates (#353047, Thermo Fisher Scientific). Tumor sphere culture media was replaced every 3 days during culture. Tumor spheres were imaged with an EVOS M5000 microscope (ThermoFisher) and counted manually by a person blinded to the experimental conditions.
Tissue histology and immunofluorescence imaging
Tumors were harvested at the experimental endpoints, fixed in 10% neutral buffered formalin (Richard-Allan Scientific), embedded in paraffin, and cut into 5 μm sections. Slides were heated at 60°C for 30 minutes, deparaffinized, rehydrated with an alcohol series, and incubated in Tris-EDTA antigen retrieval buffer (#E1161, Sigma-Aldrich) for 20 minutes in a pressure cooker at 95°C. Alternatively, formalin-fixed samples were incubated in 30% sucrose for 8–12 hours and frozen in OCT (#4585, Fisher HealthCare). Cryoblocks were sectioned at 5 μm thickness. Sections were placed on SuperFrost microscope slides (#12-550-15, Fischer Scientific) and used for staining. Sections were washed in PBS, permeabilized in 0.3% PBS-Triton X-100 for 40 minutes and blocked in PBS/0.1% Triton X-100 containing 2% BSA and 5% donkey serum (#D9663, Sigma-Aldrich). Primary antibodies were incubated overnight at 4°C in the blocking buffer. The following primary antibodies were used: RFP (#6g6, ChromTech, 1:500), GFP (#ab5450, Abcam, 1:500), FLAG (#ab205606, Abcam, 1:800), HOPX (#sc-398703, Santa Cruz Biotechnology, 1:200), RAGE (#sc-365154, Santa Cruz Biotechnology, 1:100), SPC (#AB3786, EMD Millipore, 1:2000), pERK (#4370, Cell Signaling Technologies, 1:500), and Ki67 (#14-5698-82, Thermo Scientific, 1:100), and pan-cytokeratin (#M3515292, Agilent Technologies, 1:1000). After washes in PBS tissues were incubated with fluorophore-conjugated secondary antibodies (#A-11055, #A-10042, and #A-31571, ThermoFisher, 1:500) for 1 hour at room temperature. After staining slides were counterstained with DAPI (#D9542, Sigma Aldrich, 5 μg/ml) for 10 minutes and coverslipped with Mowiol mounting reagent. Hematoxylin and eosin (H&E) staining was performed using a standard protocol. Images were acquired using 20x or 40x objectives on a Zeiss Axio Imager Z2 and ZEN 2.3 software or Mirax Midi-Scanner (Carl Zeiss AG). Image analysis was performed using Fiji software.
Immunohistochemistry
Phospho-p44/42 MAPK (Erk1/2) (pERK, #4370, Cell Signaling Technologies, 1:1000) immunohistochemistry was performed on 5 μm FFPE sections. Briefly, sections were de-paraffinized and heat-induced antigen retrieval was performed by EDTA antigen retrieval buffer (#E1161, Sigma Aldrich). Sections were blocked by BLOXALL solution (#SP-6000–100, Vector laboratories) at room temperature for 30 minutes and incubated with primary antibody at 4 °C overnight. IgG controls (#02–6102, #02–6202, and #10400C, Thermo Fisher Scientific) from the corresponding species of primary antibody were used as negative controls. Signal development was performed by ImmPRESS Polymer Detection Kits (#MP-7401–50, Vector Laboratories) and ImmPACT DAB Substrate Kit, Peroxidase (HRP) (#SK-4105, Vector Laboratories) according to the manufacturer’s protocol. The sections were counterstained with hematoxylin (#72404, Thermo Fischer Scientific) and mounted with coverslips. Mounted slides were digitally scanned using a Mirax Midi-Scanner (Carl Zeiss AG).
Capillary Western immunoassay (Wes)
Low-input protein size separation and immunodetection were performed using a capillary-based automated Western blot system (Wes, # 031–108, ProteinSimple). Briefly, sorted cells were lysed in RIPA buffer (#9806, Cell Signaling Technology) and 1 μg of protein per sample was loaded into each lane in the Wes instrument. Primary antibodies against HOPX (#sc-398703, Santa Cruz Biotechnology, 1:50), KRAS(G12D) (#14429S, Cell Signaling Technology, 1:500), and GAPDH (#2118L, Cell Signaling Technology, 1:500) were detected using the appropriate HRP-conjugated secondary antibodies according to the manufacturer’s instructions.
Western blotting
Cultured cells were rinsed with pre-cooled PBS and lysed in RIPA Buffer (#BP-115DG, Boston BioProducts) at 4 °C for 15 minutes, followed by centrifugation at 17,000 g for 15 minutes. The supernatants were collected, quantified, and denatured for Western blotting. After blocking in 5% BSA in PBS for 60 minutes, membranes were incubated with the primary antibody for 16 hours at 4°C, followed by incubation with a secondary antibody for 60 minutes at room temperature. Primary antibodies against KRAS(G12D) (#14429S, Cell Signaling Technology, 1:1000), Phospho-p44/42 MAPK (Erk1/2) (#4370, Cell Signaling Technology, 1:1000), ERK (#9102S, Cell Signaling Technology, 1:1000), and GAPDH (#2118L, Cell Signaling Technology, 1:500) were used in the study. Secondary antibody Goat Anti-Rabbit IgG-HRP Conjugate (#1706515, Biorad, 1:2000) was used in the study. Signal development was performed by Immobilon Western HRP Substrate (Millipore). The membranes were imaged using the iBright CL1500 (Invitrogen).
AkaLuc bioluminescence imaging in vivo
NSG mice bearing subcutaneous transplants of Hopx-MACD reporter cells were intraperitoneally injected with 100 μl of 30 mM AkaLumine-HCl substrate resuspended in PBS (#808350, Millipore Sigma, TokeOni) and imaged on an IVIS Lumina II (Perkin Elmer) (23).
Plasma sampling and Gaussia princeps luciferase measurements
Whole venous blood was harvested by puncturing the submandibular vein, followed by collection of 100 μl of blood into capillary blood collector vials (#02-675-185, Fisher Scientific) (42). Plasma was separated by centrifugation at >8000 g for 10 minutes at 4°C and diluted 1:10 in PBS. 200 μM Gaussia luciferase substrate coelenterazine-h (#301, NanoLight) was added, and luminescence was immediately measured on a BioTek Cytation 1 (Agilent).
Lineage-tracing of Hopx+ cells
Subcutaneous KP LUAD cell line allografts harboring the Hopx-MACD reporter allele and Flex-tagBFP2 lineage-tracing vector (Fig. 4A) were established in NSG mice and monitored, as above. Tumor-bearing mice were administered one dose of tamoxifen (200 mg/kg by oral gavage) 3-weeks post-transplantation. Subcutaneous tumors were harvested 3 or 10 days after tamoxifen administration. The baseline measurement at 3 days was chosen to account for conversion of tamoxifen to its active metabolite 4-hydroxytamoxifen (4-OHT), recombination of the Flex-tagBFP2 in lineage-traced cells, and elimination of residual 4-OHT. Tamoxifen was dissolved in corn oil at 20 mg/mL in 55 °C for 1 hour, as before (39).
Analysis of LUAD patients undergoing sotorasib and adagrasib therapy
This study was approved by the Institutional Review Board/Privacy Board at MSK and was in accordance with the Belmont report for retrospective review of records/analysis of patient samples and waiver of consent. Tissues from patients undergoing sotorasib (patients #1–3) or adagrasib (patients #4, #5) therapy were obtained under MSKCC Institutional Review Board approval (IRB #22–329, IRB #19–408). Date and anatomic site of tissue harvest are listed in Supplementary Table 7.
Bulk RNA sequencing and droplet-based single-cell RNA-sequencing (scRNA-seq)
Bulk RNA-seq was performed on cancer cells FACS-isolated from PDXs and autochthonous KP LUAD tumors. RNA was extracted and libraries were prepared for SMARTerSeq (n = 3 mice/group), followed by sequencing. ScRNA-seq was performed on sorted cell suspensions using the 3′ v3 10X Genomics Chromium platform according to manufacturer’s instructions. Briefly, sorted cells were washed once with PBS containing 1% bovine serum albumin (BSA) and resuspended in PBS containing 1% BSA to a final concentration of 700–1,300 cells per μl. The viability of cells in all experiments was above 80%, as confirmed by 0.2% (w/v) Trypan Blue staining (Countess II, Invitrogen). Cells were captured in droplets. Following reverse transcription and cell barcoding in droplets, emulsions were broken, and cDNA purified using Dynabeads MyOne SILANE followed by PCR amplification as per manufacturer’s instructions. Between 20,000 to 25,000 cells were targeted for each droplet formulation lane. Samples were multiplexed together in the lanes following the TotalSeq B cell hashing protocol (43). Final libraries were sequenced on Illumina NovaSeq S4 platform (R1 – 28 cycles, i7 – 8 cycles, R2 – 90 cycles).
Computational analyses
Analysis of scRNA-seq data
FASTQ files of scRNA-seq data generated on the 10X Chromium platform were processed using the standard CellRanger pipeline (version 5.0.0). Reads were aligned to a custom GRCm38 / mm10 reference including the tdTomato, GFP, and mKate transgenes used in this study. Cell-gene count matrices were analyzed using a combination of published packages and custom scripts centered around the scanpy / AnnData ecosystem (44). Single-cell RNA-sequencing datasets from GFPshRNA KP LUAD tumors, MRTX1133-treated KP LUAD tumors, and lung regeneration experiments were analyzed separately using the same workflows.
Single-cell RNA-sequencing data from treated and control replicates were dehashed and compiled into a combined count matrix. Cells with less than 500 UMIs, more than 20% mitochondrial UMIs, and low complexity based on the number of detected genes vs. number of UMIs were removed. Doublets were filtered using scrublet (45). UMI counts were normalized using the size factor approach described by Lun et al. (46).
Highly variable features were selected using a variance stabilizing transformation and dimensionality reduction was performed on normalized, log2-transformed count data using principal component analysis. The dimensionality-reduced count matrices were used as input for UMAP-embedding and unsupervised clustering with the Leiden algorithm; bbknn was used to control for batch effects.
To ensure that treatment does not bias cell state assignment, unsupervised clustering was performed only on control cells (shRenilla or vehicle-treated) and used as input to train a logistic regression (logit) classifier which was used to assign each cell to a cell state. This approach ensured that the cell states defined in the study are representative of states previously identified in unperturbed mouse KP lung tumors (9).
Normalized expression data was first MaxAbs scaled to give each gene equal weight. Gene signature scores were then calculated using the score_genes function in scanpy. Normal adult AT1 cell signatures were compiled from Angelidis et al. (47), Han et al. (47), Strunz et al. (48), and Travaglini et al. (49). KRAS activity signature genes were obtained from HALLMARK_KRAS_SIGNALING_UP.v2022.1.Mm (50).
Bulk RNA sequencing analysis
FASTQ files were processed using the standard DESeq2 pipeline (version 1.24.0). Reads were aligned to the GRCm38 reference mouse genome. Count matrices were generated using DESeq2. Data were filtered to only include genes with 10 or more counts in 2 or more samples. The significance of differential expression between vehicle and treatment groups was quantified by one-way ANOVA.
Supplementary Material
Significance.
Treatment resistance limits response to KRAS inhibitors in LUAD patients. We find LUAD residual disease following KRAS targeting is composed of AT1-like cancer cells with the capacity to reignite tumorigenesis. Targeting the AT1-like cells augments responses to KRAS inhibition, elucidating a therapeutic strategy to overcome resistance to KRAS-targeted therapy.
Acknowledgments
We thank J. Fagin, N. Rosen, and members of the Tammela laboratory for helpful discussions; Y.-C. Han for critical comments on the manuscript; E. de Stanchina and the Antitumor Assessment Core Facility for support with drug administration and tumor transplant experiments; members of the Molecular Diagnostics Service in the Department of Pathology for generating clinical MSK-IMPACT data; R. Gardner, K. Daniels, and A. Longhini for FACS support; K. Manova and M. Tipping for histology support; N. Mohibullah for next-generation sequencing; H. Alcorn and O. Grbovic-Huezo for laboratory management; M. Blum, J. Chan, S. Ding, M. Gregory, G. Hartmann, A. Hudson, H. Styers, C. Sussman, and K. Wu for help with experiments; and S. Weil for help with artwork in Figure 6H.
Financial Support
This work was supported by the American Cancer Society Research Scholar Grant, R01-CA270116, and a Josie Robertson Scholarship (to T.T.); the HHMI and R01-CA233944 (to S.W.L.); and by the NIH/NCI Cancer Center Support Grant P30-CA08748 (to MSKCC). X. Z. received support from a training award from New York Stem Cell Science NYSTEM (#C32559GG) at the Center for Stem Cell Biology at MSKCC; S.J. from the Hope Funds for Cancer Research; and S.T. from NIH/NCI (F30-CA254120) and a Medical Scientist Training Program grant from the National Institute of General Medical Sciences of the National Institutes of Health under award number T32GM007739 to the Weill Cornell/Rockefeller/Sloan Kettering Tri-Institutional MD-PhD Program. We acknowledge the use of the Antitumor Assessment, Integrated Genomics Operation, Flow Cytometry, and Molecular Cytology Core Facilities at the Sloan Kettering Institute, funded by CCSG P30-CA08748.
Authors’ Disclosures
T. Tammela: Advisory role and equity interests in Lime Therapeutics; receives research support to his laboratory from Ono Pharmaceuticals Co., Ltd (unrelated to this work); spouse has equity interests in Black Diamond Therapeutics. S. Joost: Employee of GC Therapeutics. C. M. Rudin: Consultant regarding oncology drug development with AbbVie, Amgen, AstraZeneca, D2G, Daiichi Sankyo, Epizyme, Genentech/Roche, Ipsen, Jazz, Kowa, Lilly, Merck, and Syros; serves on the Scientific Advisory Boards of Auron, Bridge Medicines, Earli, and Harpoon Therapeutics. S. W. Lowe: Founder and member of the scientific advisory board of Blueprint Medicines, Mirimus, ORIC Pharmaceuticals, and Faeth Therapeutics; advisory role and equity interests in Constellation Pharmaceuticals and PMV Pharmaceuticals. R. Yaeger: has served as an advisor for Amgen, Array BioPharma/Pfizer, Mirati Therapeutics, and Zai Lab; has received research support to her institution from Array BioPharma/Pfizer, Boehringer Ingelheim, Daiichi Sankyo, and Mirati Therapeutics. J. Hallin and J. G. Christensen: Employees of Mirati Therapeutics. L. E. Dow: Advisory role and equity interests in Mirimus Inc. E. Manchado: Employee of Novartis with ownership interest (including stocks and patents).
Data Availability
The data generated in this study are available within the article and its supplementary data files. scRNA-seq and bulk RNA-seq raw and processed data reported in this article have been deposited at the NCBI Gene-Expression Omnibus with accession number GSE246482 and are publicly available. All other raw data are available upon request from the corresponding author.
References
- 1.Moore AR, Rosenberg SC, McCormick F, Malek S. RAS-targeted therapies: is the undruggable drugged? Nat Rev Drug Discov 2020;19(8):533–52 doi 10.1038/s41573-020-0068-6. [DOI] [PMC free article] [PubMed] [Google Scholar]
- 2.Zehir A, Benayed R, Shah RH, Syed A, Middha S, Kim HR, et al. Mutational landscape of metastatic cancer revealed from prospective clinical sequencing of 10,000 patients. Nat Med 2017;23(6):703–13 doi 10.1038/nm.4333. [DOI] [PMC free article] [PubMed] [Google Scholar]
- 3.Kim D, Xue JY, Lito P. Targeting KRAS(G12C): From Inhibitory Mechanism to Modulation of Antitumor Effects in Patients. Cell 2020;183(4):850–9 doi 10.1016/j.cell.2020.09.044. [DOI] [PMC free article] [PubMed] [Google Scholar]
- 4.Skoulidis F, Li BT, Dy GK, Price TJ, Falchook GS, Wolf J, et al. Sotorasib for Lung Cancers with KRAS p.G12C Mutation. N Engl J Med 2021;384(25):2371–81 doi 10.1056/NEJMoa2103695. [DOI] [PMC free article] [PubMed] [Google Scholar]
- 5.Zhao Y, Murciano-Goroff YR, Xue JY, Ang A, Lucas J, Mai TT, et al. Diverse alterations associated with resistance to KRAS(G12C) inhibition. Nature 2021;599(7886):679–83 doi 10.1038/s41586-021-04065-2. [DOI] [PMC free article] [PubMed] [Google Scholar]
- 6.Awad MM, Liu S, Rybkin II, Arbour KC, Dilly J, Zhu VW, et al. Acquired Resistance to KRAS(G12C) Inhibition in Cancer. N Engl J Med 2021;384(25):2382–93 doi 10.1056/NEJMoa2105281. [DOI] [PMC free article] [PubMed] [Google Scholar]
- 7.Hallin J, Bowcut V, Calinisan A, Briere DM, Hargis L, Engstrom LD, et al. Anti-tumor efficacy of a potent and selective non-covalent KRAS(G12D) inhibitor. Nat Med 2022;28(10):2171–82 doi 10.1038/s41591-022-02007-7. [DOI] [PubMed] [Google Scholar]
- 8.Basil MC, Katzen J, Engler AE, Guo M, Herriges MJ, Kathiriya JJ, et al. The Cellular and Physiological Basis for Lung Repair and Regeneration: Past, Present, and Future. Cell Stem Cell 2020;26(4):482–502 doi 10.1016/j.stem.2020.03.009. [DOI] [PMC free article] [PubMed] [Google Scholar]
- 9.Marjanovic ND, Hofree M, Chan JE, Canner D, Wu K, Trakala M, et al. Emergence of a High-Plasticity Cell State during Lung Cancer Evolution. Cancer Cell 2020;38(2):229–46 e13 doi 10.1016/j.ccell.2020.06.012. [DOI] [PMC free article] [PubMed] [Google Scholar]
- 10.Alvarez-Varela A, Novellasdemunt L, Barriga FM, Hernando-Momblona X, Canellas-Socias A, Cano-Crespo S, et al. Mex3a marks drug-tolerant persister colorectal cancer cells that mediate relapse after chemotherapy. Nat Cancer 2022;3(9):1052–70 doi 10.1038/s43018-022-00402-0. [DOI] [PubMed] [Google Scholar]
- 11.Sanchez-Danes A, Larsimont JC, Liagre M, Munoz-Couselo E, Lapouge G, Brisebarre A, et al. A slow-cycling LGR5 tumour population mediates basal cell carcinoma relapse after therapy. Nature 2018;562(7727):434–8 doi 10.1038/s41586-018-0603-3. [DOI] [PMC free article] [PubMed] [Google Scholar]
- 12.Biehs B, Dijkgraaf GJP, Piskol R, Alicke B, Boumahdi S, Peale F, et al. A cell identity switch allows residual BCC to survive Hedgehog pathway inhibition. Nature 2018;562(7727):429–33 doi 10.1038/s41586-018-0596-y. [DOI] [PubMed] [Google Scholar]
- 13.Chen J, Li Y, Yu TS, McKay RM, Burns DK, Kernie SG, et al. A restricted cell population propagates glioblastoma growth after chemotherapy. Nature 2012;488(7412):522–6 doi 10.1038/nature11287. [DOI] [PMC free article] [PubMed] [Google Scholar]
- 14.Batlle E, Clevers H. Cancer stem cells revisited. Nat Med 2017;23(10):1124–34 doi 10.1038/nm.4409. [DOI] [PubMed] [Google Scholar]
- 15.Maynard A, McCoach CE, Rotow JK, Harris L, Haderk F, Kerr DL, et al. Therapy-Induced Evolution of Human Lung Cancer Revealed by Single-Cell RNA Sequencing. Cell 2020;182(5):1232–51 e22 doi 10.1016/j.cell.2020.07.017. [DOI] [PMC free article] [PubMed] [Google Scholar]
- 16.Jackson EL, Olive KP, Tuveson DA, Bronson R, Crowley D, Brown M, et al. The differential effects of mutant p53 alleles on advanced murine lung cancer. Cancer Res 2005;65(22):10280–8 doi 65/22/10280 [pii] [DOI] [PubMed] [Google Scholar]
- 17.Saborowski M, Saborowski A, Morris JPt, Bosbach B, Dow LE, Pelletier J, et al. A modular and flexible ESC-based mouse model of pancreatic cancer. Genes Dev 2014;28(1):85–97 doi 10.1101/gad.232082.113. [DOI] [PMC free article] [PubMed] [Google Scholar]
- 18.Shao DD, Xue W, Krall EB, Bhutkar A, Piccioni F, Wang X, et al. KRAS and YAP1 converge to regulate EMT and tumor survival. Cell 2014;158(1):171–84 doi 10.1016/j.cell.2014.06.004. [DOI] [PMC free article] [PubMed] [Google Scholar]
- 19.Premsrirut PK, Dow LE, Kim SY, Camiolo M, Malone CD, Miething C, et al. A rapid and scalable system for studying gene function in mice using conditional RNA interference. Cell 2011;145(1):145–58 doi 10.1016/j.cell.2011.03.012. [DOI] [PMC free article] [PubMed] [Google Scholar]
- 20.Beard C, Hochedlinger K, Plath K, Wutz A, Jaenisch R. Efficient method to generate single-copy transgenic mice by site-specific integration in embryonic stem cells. Genesis 2006;44(1):23–8. [DOI] [PubMed] [Google Scholar]
- 21.Sutherland KD, Song JY, Kwon MC, Proost N, Zevenhoven J, Berns A. Multiple cells-of-origin of mutant K-Ras-induced mouse lung adenocarcinoma. Proc Natl Acad Sci U S A 2014;111(13):4952–7 doi 10.1073/pnas.1319963111. [DOI] [PMC free article] [PubMed] [Google Scholar]
- 22.Kurppa KJ, Liu Y, To C, Zhang T, Fan M, Vajdi A, et al. Treatment-Induced Tumor Dormancy through YAP-Mediated Transcriptional Reprogramming of the Apoptotic Pathway. Cancer Cell 2020;37(1):104–22 e12 doi 10.1016/j.ccell.2019.12.006. [DOI] [PMC free article] [PubMed] [Google Scholar]
- 23.Iwano S, Sugiyama M, Hama H, Watakabe A, Hasegawa N, Kuchimaru T, et al. Single-cell bioluminescence imaging of deep tissue in freely moving animals. Science 2018;359(6378):935–9 doi 10.1126/science.aaq1067. [DOI] [PubMed] [Google Scholar]
- 24.Charles JP, Fuchs J, Hefter M, Vischedyk JB, Kleint M, Vogiatzi F, et al. Monitoring the dynamics of clonal tumour evolution in vivo using secreted luciferases. Nat Commun 2014;5:3981 doi 10.1038/ncomms4981. [DOI] [PMC free article] [PubMed] [Google Scholar]
- 25.Cerami E, Gao J, Dogrusoz U, Gross BE, Sumer SO, Aksoy BA, et al. The cBio cancer genomics portal: an open platform for exploring multidimensional cancer genomics data. Cancer Discov 2012;2(5):401–4 doi 10.1158/2159-8290.CD-12-0095. [DOI] [PMC free article] [PubMed] [Google Scholar]
- 26.Canon J, Rex K, Saiki AY, Mohr C, Cooke K, Bagal D, et al. The clinical KRAS(G12C) inhibitor AMG 510 drives anti-tumour immunity. Nature 2019;575(7781):217–23 doi 10.1038/s41586-019-1694-1. [DOI] [PubMed] [Google Scholar]
- 27.Choi J, Park JE, Tsagkogeorga G, Yanagita M, Koo BK, Han N, et al. Inflammatory Signals Induce AT2 Cell-Derived Damage-Associated Transient Progenitors that Mediate Alveolar Regeneration. Cell Stem Cell 2020;27(3):366–82 e7 doi 10.1016/j.stem.2020.06.020. [DOI] [PMC free article] [PubMed] [Google Scholar]
- 28.Salmon M, Alvarez-Diaz R, Fustero-Torre C, Brehey O, Lechuga CG, Sanclemente M, et al. Kras oncogene ablation prevents resistance in advanced lung adenocarcinomas. J Clin Invest 2023;133(7) doi 10.1172/JCI164413. [DOI] [PMC free article] [PubMed] [Google Scholar]
- 29.Quintanal-Villalonga A, Chan JM, Yu HA, Pe’er D, Sawyers CL, Sen T, et al. Lineage plasticity in cancer: a shared pathway of therapeutic resistance. Nat Rev Clin Oncol 2020;17(6):360–71 doi 10.1038/s41571-020-0340-z. [DOI] [PMC free article] [PubMed] [Google Scholar]
- 30.Coelho MA, de Carne Trecesson S, Rana S, Zecchin D, Moore C, Molina-Arcas M, et al. Oncogenic RAS Signaling Promotes Tumor Immunoresistance by Stabilizing PD-L1 mRNA. Immunity 2017;47(6):1083–99 e6 doi 10.1016/j.immuni.2017.11.016. [DOI] [PMC free article] [PubMed] [Google Scholar]
- 31.Kemp SB, Cheng N, Markosyan N, Sor R, Kim IK, Hallin J, et al. Efficacy of a Small-Molecule Inhibitor of KrasG12D in Immunocompetent Models of Pancreatic Cancer. Cancer Discov 2023;13(2):298–311 doi 10.1158/2159-8290.CD-22-1066. [DOI] [PMC free article] [PubMed] [Google Scholar]
- 32.Nagarajah J, Le M, Knauf JA, Ferrandino G, Montero-Conde C, Pillarsetty N, et al. Sustained ERK inhibition maximizes responses of BrafV600E thyroid cancers to radioiodine. J Clin Invest 2016;126(11):4119–24 doi 10.1172/JCI89067. [DOI] [PMC free article] [PubMed] [Google Scholar]
- 33.Ho AL, Grewal RK, Leboeuf R, Sherman EJ, Pfister DG, Deandreis D, et al. Selumetinib-enhanced radioiodine uptake in advanced thyroid cancer. N Engl J Med 2013;368(7):623–32 doi 10.1056/NEJMoa1209288. [DOI] [PMC free article] [PubMed] [Google Scholar]
- 34.Jackson EL, Willis N, Mercer K, Bronson RT, Crowley D, Montoya R, et al. Analysis of lung tumor initiation and progression using conditional expression of oncogenic K-ras. Genes & development 2001;15(24):3243–8 doi 10.1101/gad.943001. [DOI] [PMC free article] [PubMed] [Google Scholar]
- 35.Jonkers J, Meuwissen R, van der Gulden H, Peterse H, van der Valk M, Berns A. Synergistic tumor suppressor activity of BRCA2 and p53 in a conditional mouse model for breast cancer. Nat Genet 2001;29(4):418–25 doi 10.1038/ng747 [DOI] [PubMed] [Google Scholar]
- 36.Dow LE, Nasr Z, Saborowski M, Ebbesen SH, Manchado E, Tasdemir N, et al. Conditional reverse tet-transactivator mouse strains for the efficient induction of TRE-regulated transgenes in mice. PLoS One 2014;9(4):e95236 doi 10.1371/journal.pone.0095236. [DOI] [PMC free article] [PubMed] [Google Scholar]
- 37.Madisen L, Zwingman TA, Sunkin SM, Oh SW, Zariwala HA, Gu H, et al. A robust and high-throughput Cre reporting and characterization system for the whole mouse brain. Nat Neurosci 2010;13(1):133–40 doi 10.1038/nn.2467. [DOI] [PMC free article] [PubMed] [Google Scholar]
- 38.Zafra MP, Parsons MJ, Kim J, Alonso-Curbelo D, Goswami S, Schatoff EM, et al. An In Vivo Kras Allelic Series Reveals Distinct Phenotypes of Common Oncogenic Variants. Cancer Discov 2020;10(11):1654–71 doi 10.1158/2159-8290.CD-20-0442. [DOI] [PMC free article] [PubMed] [Google Scholar]
- 39.Tammela T, Sanchez-Rivera FJ, Cetinbas NM, Wu K, Joshi NS, Helenius K, et al. A Wnt-producing niche drives proliferative potential and progression in lung adenocarcinoma. Nature 2017;545(7654):355–9 doi 10.1038/nature22334. [DOI] [PMC free article] [PubMed] [Google Scholar]
- 40.Samstein RM, Lee CH, Shoushtari AN, Hellmann MD, Shen R, Janjigian YY, et al. Tumor mutational load predicts survival after immunotherapy across multiple cancer types. Nat Genet 2019;51(2):202–6 doi 10.1038/s41588-018-0312-8. [DOI] [PMC free article] [PubMed] [Google Scholar]
- 41.Hallin J, Engstrom LD, Hargis L, Calinisan A, Aranda R, Briere DM, et al. The KRAS(G12C) Inhibitor MRTX849 Provides Insight toward Therapeutic Susceptibility of KRAS-Mutant Cancers in Mouse Models and Patients. Cancer Discov 2020;10(1):54–71 doi 10.1158/2159-8290.CD-19-1167. [DOI] [PMC free article] [PubMed] [Google Scholar]
- 42.Golde WT, Gollobin P, Rodriguez LL. A rapid, simple, and humane method for submandibular bleeding of mice using a lancet. Lab Anim (NY) 2005;34(9):39–43 doi 10.1038/laban1005-39. [DOI] [PubMed] [Google Scholar]
- 43.Stoeckius M, Zheng S, Houck-Loomis B, Hao S, Yeung BZ, Mauck WM 3rd, et al. Cell Hashing with barcoded antibodies enables multiplexing and doublet detection for single cell genomics. Genome Biol 2018;19(1):224 doi 10.1186/s13059-018-1603-1. [DOI] [PMC free article] [PubMed] [Google Scholar]
- 44.Wolf FA, Angerer P, Theis FJ. SCANPY: large-scale single-cell gene expression data analysis. Genome Biol 2018;19(1):15 doi 10.1186/s13059-017-1382-0. [DOI] [PMC free article] [PubMed] [Google Scholar]
- 45.Wolock SL, Lopez R, Klein AM. Scrublet: Computational Identification of Cell Doublets in Single-Cell Transcriptomic Data. Cell Syst 2019;8(4):281–91 e9 doi 10.1016/j.cels.2018.11.005. [DOI] [PMC free article] [PubMed] [Google Scholar]
- 46.Lun AT, Bach K, Marioni JC. Pooling across cells to normalize single-cell RNA sequencing data with many zero counts. Genome Biol 2016;17:75 doi 10.1186/s13059-016-0947-7. [DOI] [PMC free article] [PubMed] [Google Scholar]
- 47.Han X, Wang R, Zhou Y, Fei L, Sun H, Lai S, et al. Mapping the Mouse Cell Atlas by Microwell-Seq. Cell 2018;172(5):1091–107 e17 doi 10.1016/j.cell.2018.02.001. [DOI] [PubMed] [Google Scholar]
- 48.Strunz M, Simon LM, Ansari M, Kathiriya JJ, Angelidis I, Mayr CH, et al. Alveolar regeneration through a Krt8+ transitional stem cell state that persists in human lung fibrosis. Nat Commun 2020;11(1):3559 doi 10.1038/s41467-020-17358-3. [DOI] [PMC free article] [PubMed] [Google Scholar]
- 49.Travaglini KJ, Nabhan AN, Penland L, Sinha R, Gillich A, Sit RV, et al. A molecular cell atlas of the human lung from single-cell RNA sequencing. Nature 2020;587(7835):619–25 doi 10.1038/s41586-020-2922-4. [DOI] [PMC free article] [PubMed] [Google Scholar]
- 50.Liberzon A, Birger C, Thorvaldsdottir H, Ghandi M, Mesirov JP, Tamayo P. The Molecular Signatures Database (MSigDB) hallmark gene set collection. Cell Syst 2015;1(6):417–25 doi 10.1016/j.cels.2015.12.004. [DOI] [PMC free article] [PubMed] [Google Scholar]
Associated Data
This section collects any data citations, data availability statements, or supplementary materials included in this article.
Supplementary Materials
Data Availability Statement
The data generated in this study are available within the article and its supplementary data files. scRNA-seq and bulk RNA-seq raw and processed data reported in this article have been deposited at the NCBI Gene-Expression Omnibus with accession number GSE246482 and are publicly available. All other raw data are available upon request from the corresponding author.