

Abstract
Importance:
Although pediatric growth curves provide clinical utility, using these metrics for within-person change over time can be misleading. As research is focused on understanding cardiometabolic consequences of weight gain, it is important to utilize precise metrics to analyze these longitudinal research questions.
Observations:
Despite several foundational recommendations to limit the use of reference pediatric growth curves (e.g., body mass index z-scores) for within-person longitudinal research, it has evolved into the “gold standard” for utilizing growth curves for pediatric weight gain analyses. Therefore, the objective of this paper is to discuss the A) methodology used to create reference growth curves; B) appropriate use of reference pediatric BMI growth curves within the context of cross-sectional and longitudinal analyses in research; and C) how to select metrics based on desired evaluations.
Conclusions:
Careful consideration using standardized references scores is essential when assessing obesity-related questions and co-morbid risk over time in pediatric populations.
Keywords: Growth Charts, Body Mass Index Z-score, Excess of the 95th Percentile, Obesity, Pediatrics
Introduction:
Body mass index (BMI; kg/m2) is used to estimate fat mass when gold standard methods are not available.(1,2) Calculated from BMI, weight status cutoffs (e.g., healthy weight, overweight, obese) provide easy clinical screening for cardiometabolic risk and disease.(3) Unlike adults, specific BMI growth curves have been created for children to account for age- and sex-specific differences in growth,(4,5) where the BMI metric is often expressed as a z-score. Z-scores allow for insight into how a child is growing in reference to a population at a particular time, but there are statistical limitations for using within-person differences in z-scores (e.g., zdiff) to assess weight gain accelerations which can extrapolate to miscalculations of cardiometabolic risk overtime. Across fields, using zdiff for longitudinal research has been highly cautioned against.(6–10) Yet, in pediatric weight gain research, this has been widely ignored. For example, a PubMed search for BMI z-score change amongst infants, children, and adolescents (e.g., search term: “BMI z-score” AND change NOT cross-sectional [Title/Abstract]) from 2000 until present was associated with more than 1,000 published articles. Therefore, the purpose of this paper is to A) acknowledge the merit of pediatric BMI z-scores for clinical practice and cross-sectional research; and B) discuss the limitations of zdiff for longitudinal research focused on understanding pediatric cardiometabolic risk. Careful selection of weight gain metrics is critical so that researchers and clinicians may translate research findings more appropriately.
Reference score creations and challenges with use for longitudinal assessment:
Reference, or z-scores are useful for classifying metrics of a population into categories to determine clinical pathology, outstanding or suboptimal performance. For example, they are useful for classifying limits for various domains including scholastic achievement, intelligence, neurocognitive testing, and pediatric assessments of growth(6). Reference scores are created using a transformation process called standardization, which transforms a raw score (e.g., BMI) into a relative score (e.g., BMI z-score), and ranks individual scores according to others in a reference population (0–100, e.g., BMI percentile). Then, the reference population mean (m) is subtracted from each individual raw score (x) and divided by the reference population standard deviation (SD; z-score = (x–m)/SD). For a normal distribution, a z-score represents the number of standard deviations a given value is from the population mean (m = 0) in the reference population (e.g., z-score = 1 is equivalent to +1SD above the population mean). Thus, a BMI z-score is a measure of how much a child’s raw BMI score deviates from the mean BMI for their age and sex compared to a standard reference population of other children of that age and sex.
BMI z-scores provide useful cross-sectional weight status classification cut-offs (e.g., healthy weight, obese). However, this metric is not appropriate to assess within-person change over time because of their inherent dependency on a static underlying reference population.(6,10) To better understand this concept, we provide a simple example of test scores of a class at Time 1 and Time 2, which occur before and after students learn about content relevant to the test. At Time 1, Student A obtained a raw score of 83 out of 100, where the class average was 80 (SD=20). Because the teacher was interested in understanding how well the students performed and the test’s difficulty (i.e., the distribution of the scores in reference to the class average), they standardized the scores (Student A’s score fell into the 56th percentile, z-score = 0.15). During the next assessment (i.e., Time 2), the class average dropped to 60 (SD=13) but Student A received an 87 (98th percentile, z-score = 2.08). Next, the teacher was interested in understanding if students improved on performance from their first to second test (i.e., within-person change, pre vs- post-test assessment). If the teacher utilized the zdiff to assess within-person change, this could provide a skewed perspective. For example, for Student A, their zdiff would be 1.90, which suggests that they had a 42% improvement in comparison to the change amongst the entire class. Meanwhile, in reference to themself, Student A only had a modest 4-point improvement between the tests, suggesting that for this student, the instructional unit at hand did not substantially improve their score by 42%. Thus, if the goal was to track Student A’s performance over time, it would be more appropriate to use their actual raw scores.
The example highlights how zdiff can lead to misleading longitudinal results, but in the case of BMI z-score, this is even more problematic as the standardized variable is time-locked to a specific stagnant population. For example, BMI z-scores for 9-year-olds were sampled from a different population than the 12-year-olds distribution. Therefore, examining z-score changes would provide information with respect to underlying reference populations at 9- and 12-years, and not within a single child. Thus, this creates an extreme bias for longitudinal research focused on examining within child weight gain. Below is a visualization of this dilemma with using data from youth enrolled in The Adolescent Brain Cognitive Development (ABCD) Study (www.ABCDStudy.org; Figure 1 reprinted from Adise et al., 2021 and 2022).(11,12) Here, we were interested in examining the relationship between brain development and extreme weight gain amongst youth with a stable weight compared to those with non-weight stability (i.e., extreme weight gain) from 9/10-to-11/12-years-old. Initially, using clinical practice guidelines, weight stability was defined as zdiff <0.2 and non-stability as zdiff > 0.2.(13) This criterion grossly overestimated non-weight stability as 52% of youth classified with non-stable weight, which 79.3% had a healthy weight at baseline (Figure 1A). Notably, 74.3% of these youth were still classified as having a healthy weight two years later. Thus, we compared how well this criterion mapped onto physical weight gain, and not surprisingly, this metric performed poorly again (Figure 1B). There was no specificity to identify youth who had weight gain beyond +1SD above the mean (dashed black line). As one solution, weight stability was expanded to only include those of a healthy weight, while weight non-stability included gaining >38 pounds in 2 years (+1SD above the mean; Figure 1C). Importantly, this grouping was not confounded by height suggesting those identified has having extreme weight gain did not also have a growth spurt (Figure 1D). This classification definition seemed to better capture extreme weight gain, which was associated with underlying differences in brain structure prior to weight gain and measurable changes in brain structure after weight gain. Although imperfect, this example highlights how individual weight change may be more relevant to biological outcomes when compared to changes in reference growth charts.
Figure 1.
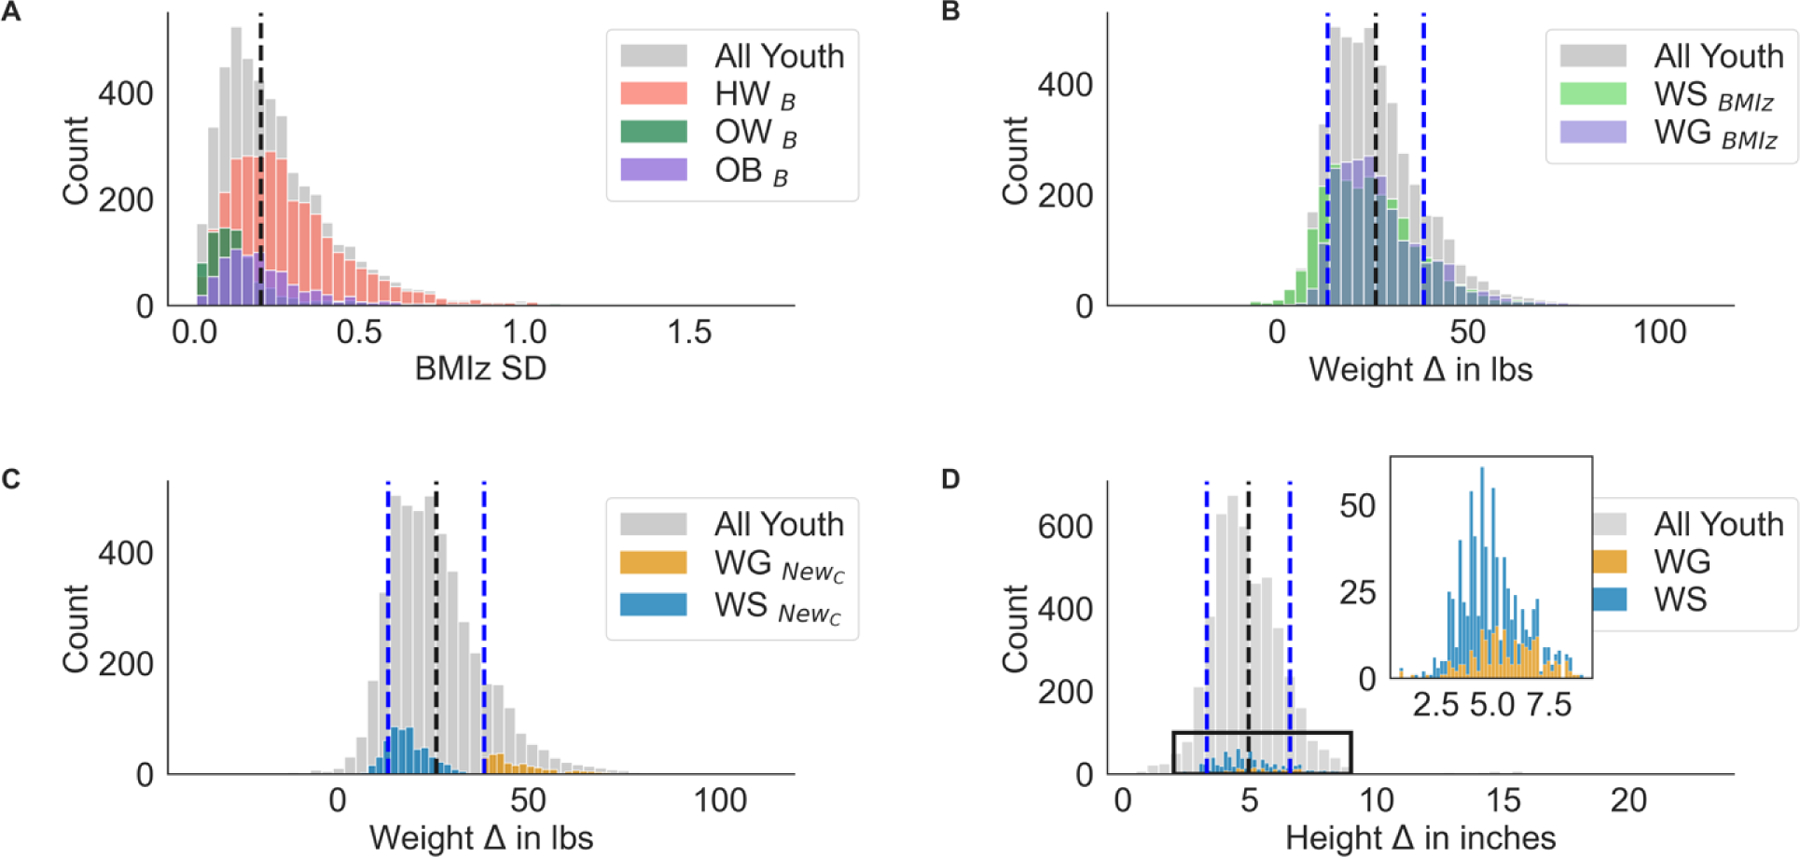
A) Changes in BMI z-score standard deviation (SD) across two time points (ages 9/10-years-old to 11/12-years-old, within-person). The dashed lined indicates the clinical cutoff for weight stability using BMI z-score standard deviation changes, where <0.2 indicates weight stability. This figure depicts that most children were not classified as weight stable. B) Change in physical weight between the two time points for each group using the clinical criterion of weight stability (e.g., weight stable [WS], weight gain [WG]). Dashed black line corresponds to the average weight gain across the sample, where the blue dashed lines depict the −1 and +1 SD above the mean. C) distributions of weight gain by the new classification that included a weight gain criterion (>38 pounds of weight gain across two years, plus the clinical BMI z-score cutoff; NewC). D) Demonstration that weight stable and weight gain groups did not differ in height velocity.
Alternative approaches for longitudinal analyses
Although there are better metrics to assess adiposity over time (e.g., DXA, MRI, waist circumference, bioelectrical impedance), BMI remains a quick and cost-effective tool for many researchers and physicians alike. Therefore, it is unrealistic to completely forgo the use of BMI z-scores, and the most accurate metric for assessing weight change in children is debated.(7,13–16) Some guidance exists for pediatric clinical trial weight reduction outcomes (e.g., mean change in BMI, proportion of patients who lose greater than or equal to 5% of baseline), but there is no common consensus. There are valid concerns regarding the use of raw BMI for pediatric longitudinal analyses but statistical models can account for age- and sex- growth patterns, like modeling continuous norming.(14,15) In adults, growing evidence suggests that a 5% change in actual weight may be a good surrogate marker to capture longitudinal changes in adiposity and cardiometabolic risk(16,17). However, there is limited research conducted in children to support this. Perhaps an alternative approach would be to examine weight change while adjusting for sex, height, and age, rather than using BMI z-scores. Alternatively, bioelectrical impedance is an alternative time and cost-effective tool to measure change in adiposity in youth, however, there is no consensus on how the output metrics obtained from these tests predict risk overtime and thus their practical clinical relevance is often questioned. Currently, it is challenging to recommend one longitudinal pediatric weight-based metric over another, leaving the researcher to decide the best measure for the study and outcome of interest. However, we contend that BMI z-scores are best for cross-sectional classification purposes, and it should be highly cautioned against to use zdiff for longitudinal outcomes.
Additional Limitations of Growth Curves
It is also important to highlight the inherent racial biases specifically in the CDC z-scores, which were originally created using data pooled from the National Health and Nutritional Examination Survey (NHANES) from 1963–1980,(18) a largely white and educated sample. In 2022, the CDC updated the reference tables with data collected in the last decade.(19) However, data from 1963–1980 were still utilized for estimation, perpetuating racial and socioeconomic biases (20) - as children from diverse backgrounds are at risk for inappropriately weight classification.(21–23) One solution may be to redefine the CDC growth charts with more recent data. Yet, this recommendation should be proceeded with caution as obesity rates have drastically increased,(24,25) and if z-scores are utilized to define acceptable weight parameters (e.g., healthy vs. overweight), youth currently classified as having obesity may then be erroneously categorized as having a healthy weight. Although other reference charts (e.g., WHO’s international score (4)) may circumvent some of these sociodemographic issues, the misuse of the z-score statical tool in longitudinal scientific questions is still notable. Moreover, there are wide variations in body weight distribution by race and ethnicity,(26) which means these cutoff points may not accurately capture metabolic risk accordingly. As such, there is a dire need for science to redefine weigh-related cut-points for assessing excess adiposity with respect to encompassing individualistic characteristics (e.g., height, weight, age, sex, race/ethnicity) rather than relying on outdated and biased population estimates that provide little insight into a child’s metabolic health.
Call to scientific community
There is an urgent need for further investigation into precise, easy, and cost-effective metrics that can accurately assess weight related metabolic risk. Pediatric clinicians spend on average, 15 minutes with a patient, necessitating quick, precise estimates of weight gain velocities that are useful in evaluating and managing care. Research settings are often afforded the time to conduct nuanced and precise analyses and thus, can inform efficient metrics for estimating weight change that are clinically useful and metabolically meaningful. Perhaps with deliberate and intentional use of algorithms with less bias, research will be better translated to the clinical settings resulting in more accurate measurements of within-person weight gain velocities that are more indicated of cardiovascular risk than inaccurate zdiff estimates. We would like to also emphasize the importance of collaboration between statisticians and subject-matter experts for successful data analysis. Such engagement and collaboration would lead to more robust conclusions, and ultimately contribute to better decision-making in the clinical setting. Taken together, we ask the scientific and clinical communities to: A) acknowledge the limitations in using zdiff (and percentile differences) for longitudinal analyses, B) update interpretation of anthropometric metrics in clinical practice, C) identify software that can be more systematically incorporated into electronic health records to provide clinicians will real-time, accurate assessment of anthropometric measures in youth, and D) understand that the current BMI z-scores are subject to bias, especially amongst historically excluded groups with the greatest increase in prevalence of pediatric obesity.
Question:
Why should body mass index (BMI) z-scores not be used as a longitudinal measure to assess individual change in weight over time?
Findings:
The current opinion article outlines the statistical pitfalls of utilizing BMI z-scores for assessing longitudinal within-person change in weight as a surrogate for adiposity, which may have consequences for cardiometabolic risk assessment. Here, we discuss how these growth curves were created, and how utilizing change scores of standardized reference charts can lead to misleading results. The purpose of this paper is to foster discussion around the creation of precise metrics for pediatric weight gain assessment for cardiometabolic risk.
Acknowledgments:
The authors would like to thank Dr. Michael I. Goran for his support throughout various stages of this manuscript preparation.
Funding Source:
Data used in the preparation of this article were obtained from the Adolescent Brain Cognitive DevelopmentSM Study® (https://abcdstudy.org/), held in the NIMH Data Archive (NDA). The ABCD Study® is supported by the National Institutes of Health and National Institute on Drug Abuse and additional federal partners under award numbers U01DA041022, U01DA041028, U01DA041048, U01DA041089, U01DA041106, U01DA041117, U01DA041120, U01DA041134, U01DA041148, U01DA041156, U01DA041174, U24DA041123, and U24DA041147. A full list of supporters is available at https://abcdstudy.org/federal-partners/. A listing of participating sites and a complete listing of the study investigators can be found at https://abcdstudy.org/principal-investigators/. The ABCD Study® consortium investigators designed and implemented the study and/or provided data but did not necessarily participate in analysis or writing of this report. This manuscript reflects the views of the authors and may not reflect the opinions or views of the NIH or other ABCD Study® consortium investigators. The ABCD Study® data repository grows and changes over time. The ABCD Study® data used in this report came from https://doi.org/10.15154/1503209. SA and AV were supported by the National Institutes of Diabetes and Digestive and Kidney Diseases (NIDDK) award numbers K01 DK13584701 and K23DK134801. AV was also supported by the Sacchi Foundation, American Diabetes Association award number 11-22-ICTSN-32. EH was supported by the National Heart, Lung and Blood Institute award number T32 HL149646. TA was supported by the National Institute on Minority Health and Health Disparities award number P50MD017344 and from the National Institute of Environmental Health Sciences award number R01ES035035.
Footnotes
Conflict of Interest: The authors have no financial relationships or conflict of interest to disclose.
REFERENCES:
- 1.Gradmark AMI, Rydh A, Renstrsöm F, De Lucia-Rolfe E, Sleigh A, Nordström P, et al. Computed tomography-based validation of abdominal adiposity measurements from ultrasonography, dual-energy X-ray absorptiometry and anthropometry. British Journal of Nutrition 2010;104(4):582–8. [DOI] [PubMed] [Google Scholar]
- 2.Martin-Calvo N, Moreno-Galarraga L, Martinez-Gonzalez MA. Association between body mass index, waist-to-height ratio and adiposity in children: A systematic review and meta-analysis. Nutrients 2016;8(8). [DOI] [PMC free article] [PubMed] [Google Scholar]
- 3.Berker D, Koparal S, Işik S, Paşaoǧlu L, Aydin Y, Erol K, et al. Compatibility of different methods for the measurement of visceral fat in different body mass index strata. Diagnostic and Interventional Radiology 2010;16(2):99–105. [DOI] [PubMed] [Google Scholar]
- 4.WHO Child Growth Standards. Dev Med Child Neurol 2009;51(12):1002–1002. [Google Scholar]
- 5.Methods and Development. Vol. 11, National Center for Health Statistics. Vital Health Stat 2002. 1–178 p. [Google Scholar]
- 6.Moeller J. A word on standardization in longitudinal studies: don’t. Front Psychol 2015;6(September):1–4. [DOI] [PMC free article] [PubMed] [Google Scholar]
- 7.Cole TJ, Faith MS, Pietrobelli A, Heo M. What is the best measure of adiposity change in growing children: BMI, BMI %, BMI z-score or BMI centile? Eur J Clin Nutr 2005;59(3):419–25. [DOI] [PubMed] [Google Scholar]
- 8.Berkey CS, Colditz GA. Adiposity in Adolescents: Change in Actual BMI Works Better Than Change in BMI z Score for Longitudinal Studies. Ann Epidemiol [Internet] 2007. Jan;17(1):44–50. Available from: https://linkinghub.elsevier.com/retrieve/pii/S1047279706002316 [DOI] [PubMed] [Google Scholar]
- 9.Hendrickson MA, Pitt MB. Three Areas Where Our Growth Chart Conversations Fall Short–Room to Grow. JAMA Pediatr [Internet] 2021. Nov 1; Available from: 10.1001/jamapediatrics.2021.4330 [DOI] [PubMed] [Google Scholar]
- 10.Maloney ES, Larrivee LS. Limitations of Age-Equivalent Scores in Reporting the Results of Norm-Referenced Tests. Contemporary Issues in Communication Science and Disorders [Internet] 2007. Oct;34(Fall):86–93. Available from: 10.1044/cicsd_34_F_86 [DOI] [Google Scholar]
- 11.Adise S, Allgaier N, Laurent J, Hahn S, Chaarani B, Owens M, et al. Multimodal brain predictors of current weight and weight gain in children enrolled in the ABCD study®. Dev Cogn Neurosci [Internet] 2021. Jun;49(December 2020):100948. Available from: 10.1016/j.dcn.2021.100948 [DOI] [PMC free article] [PubMed] [Google Scholar]
- 12.Adise S, Marshall AT, Hahn S, Zhao S, Kan E, Rhee KE, et al. Longitudinal assessment of brain structure and behaviour in youth with rapid weight gain: Potential contributing causes and consequences. Pediatr Obes [Internet] 2022. Oct 17;(August):1–13. Available from: 10.15154/1503209. [DOI] [PMC free article] [PubMed] [Google Scholar]
- 13.Geserick M, Vogel M, Gausche R, Lipek T, Spielau U, Keller E, et al. Acceleration of BMI in Early Childhood and Risk of Sustained Obesity. New England Journal of Medicine 2018;379(14):1303–12. [DOI] [PubMed] [Google Scholar]
- 14.Hosey CM, Halpin K, Shakhnovich V, Bi C, Sweeney B, Yan Y, et al. Pediatric growth patterns in youth-onset type 2 diabetes mellitus: Implications for physiologically-based pharmacokinetic models. Clin Transl Sci [Internet] 2022. Apr 16;15(4):912–22. Available from: 10.1111/cts.13207 [DOI] [PMC free article] [PubMed] [Google Scholar]
- 15.Voncken L, Albers CJ, Timmerman ME. Bias-Variance Trade-Off in Continuous Test Norming. Assessment 2021;28(8):1932–48. [DOI] [PMC free article] [PubMed] [Google Scholar]
- 16.Ryan DH, Yockey SR. Weight Loss and Improvement in Comorbidity: Differences at 5%, 10%, 15%, and Over. Vol. 6, Current obesity reports 2017. p. 187–94. [DOI] [PMC free article] [PubMed] [Google Scholar]
- 17.Hampl SE, Hassink SG, Skinner AC, Armstrong SC, Barlow SE, Bolling CF, et al. Clinical Practice Guideline for the Evaluation and Treatment of Children and Adolescents With Obesity. Pediatrics [Internet] 2023. Feb 1;151(2). Available from: https://publications.aap.org/pediatrics/article/151/2/e2022060640/190443/Clinical-Practice-Guideline-for-the-Evaluation-and [DOI] [PubMed] [Google Scholar]
- 18.Kuczmarski RJ, Ogden CL, Guo SS, Grummer-Strawn LM, Flegal KM, Mei Z, et al. 2000 CDC Growth Charts for the United States: methods and development. [Internet]. Vital and health statistics. Series 11, Data from the national health survey 2002. 1–190 p. Available from: http://www.ncbi.nlm.nih.gov/pubmed/12043359 [PubMed] [Google Scholar]
- 19.Hales CM, Freedman DS, Akinbami L, Wei R, Ogden CL. Evaluation of alternative body mass index (BMI) metrics to monitor weight status in children and adolescents with extremely high BMI using CDC BMI-for-age growth charts. 2022; [PubMed] [Google Scholar]
- 20.Ryder JR, Kelly AS, Freedman DS. Metrics matter: Toward consensus reporting of BMI and weight-related outcomes in pediatric obesity clinical trials. Obesity [Internet] 2022. Mar 18;30(3):571–2. Available from: 10.1002/oby.23346 [DOI] [PMC free article] [PubMed] [Google Scholar]
- 21.Jih J, Mukherjea A, Vittinghoff E, Nguyen TT, Tsoh JY, Fukuoka Y, et al. Using appropriate body mass index cut points for overweight and obesity among Asian Americans. Prev Med (Baltim) [Internet] 2014. Aug;65(1):1–6. Available from: https://linkinghub.elsevier.com/retrieve/pii/S0091743514001418 [DOI] [PMC free article] [PubMed] [Google Scholar]
- 22.Kam LY, Huang DQ, Teng MLP, Takahashi H, Tanaka K, Yasuda S, et al. Clinical Profiles of Asians with NAFLD: A Systematic Review and Meta-Analysis. Digestive Diseases 2022;40(6):734–44. [DOI] [PMC free article] [PubMed] [Google Scholar]
- 23.Koirala B, Turkson-Ocran RA, Baptiste D, Koirala B, Francis L, Davidson P, et al. Heterogeneity of cardiovascular disease risk factors among Asian immigrants: Insights from the 2010 to 2018 national health interview survey. J Am Heart Assoc 2021;10(13). [DOI] [PMC free article] [PubMed] [Google Scholar]
- 24.Fryar CD, Carroll MD, Ogden CL. Prevalence of Overweight, Obesity, and Severe Obesity Among Adults Aged 20 and Over: United States, 1960-1962 Through 2015-2016. NCHS Health E-Stats 2018;1(1):1–6. [Google Scholar]
- 25.Ogden CL, Fryar CD, Hales CM, Carroll MD, Aoki Y, Freedman DS. Differences in obesity prevalence by demographics and urbanization in US Children and Adolescents, 2013-2016. JAMA - Journal of the American Medical Association 2018;319(23):2410–8. [DOI] [PMC free article] [PubMed] [Google Scholar]
- 26.Liu B, Du Y, Wu Y, Snetselaar LG, Wallace RB, Bao W. Trends in obesity and adiposity measures by race or ethnicity among adults in the United States 2011-18: Population based study. The BMJ 2021;372:1–10. [DOI] [PMC free article] [PubMed] [Google Scholar]