

SUMMARY
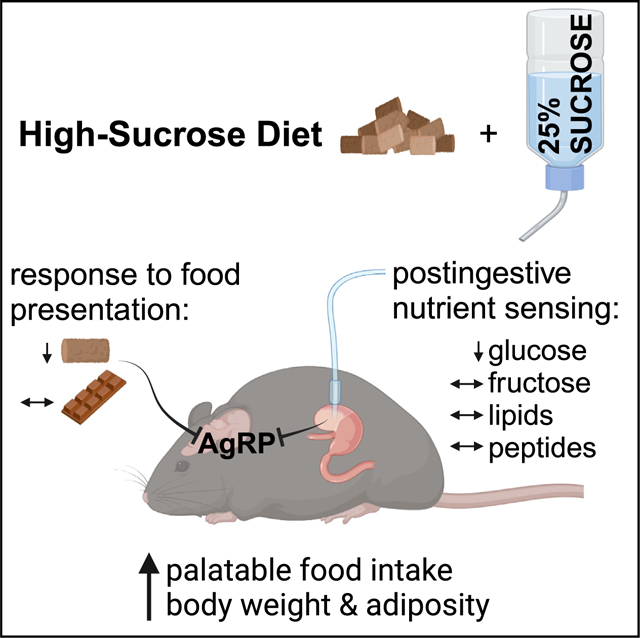
Rapid gut-brain communication is critical to maintain energy balance and is disrupted in diet-induced obesity. In particular, the role of carbohydrate overconsumption in the regulation of interoceptive circuits in vivo requires further investigation. Here, we report that an obesogenic high-sucrose diet (HSD) selectively blunts silencing of hunger-promoting agouti-related protein (AgRP) neurons following intragastric delivery of glucose, whereas we previously showed that overconsumption of a high-fat diet (HFD) selectively attenuates lipid-induced neural silencing. By contrast, both HSD and HFD reversibly dampen rapid AgRP neuron inhibition following chow presentation and promote intake of more palatable foods. Our findings reveal that excess sugar and fat pathologically modulate feeding circuit activity in both macronutrient-dependent and -independent ways and thus may additively exacerbate obesity.
In brief
The effects of sugar overfeeding on the gut-brain axis in vivo require further investigation. Here, Lorch et al. report a liquid sucrose diet in mice that selectively desensitizes hypothalamic hunger neurons to ingested glucose and promotes consumption of palatable food over more nutritious options.
Graphical Abstract
INTRODUCTION
Hunger-promoting, hypothalamic AgRP neurons, located in the arcuate nucleus, monitor energy state and drive appropriate behavioral and physiologic responses to maintain body weight and metabolic health.1–8 Prior work demonstrates that high-fat diet (HFD)-induced obesity dysregulates AgRP neural responses to nutritional stimuli in a manner that exacerbates palatable food consumption and weight gain.9–12 However, despite the increasingly clear role of high-sugar foods in driving obesity and metabolic disease, the effects of sugar overconsumption on gut-brain dynamics are not well understood.
AgRP neurons integrate exterosensory and interoceptive cues to maintain energy homeostasis. AgRP neurons are active in hungry animals, and their stimulation drives feeding and hunger even in conditions where food intake is normally low.3,4,13–18 By contrast, silencing or ablating these neurons suppresses feeding.1,4,19,20 In vivo monitoring of AgRP neuron activity has revealed that their activity is regulated by nutritional stimuli across multiple timescales. These neurons are rapidly inhibited when hungry mice are presented with cues that predict imminent food availability.5,16,21 This inhibition precedes consumption, its magnitude correlates with subsequent food intake, and AgRP neuron activity rapidly increases over minutes if animals do not immediately eat.5,7,21 Nutrient sensing in the gastrointestinal (GI) tract is also sufficient to inhibit AgRP neurons proportionally to the caloric content consumed. This post-ingestive inhibition is mediated by GI distention and by hormones released from nutrient-sensing enteroendocrine cells that line the intestine.7–9,22 Combined, these signals tune AgRP neuron activity to facilitate appropriate feeding behavior and metabolism.
The effects of diet-induced obesity (DIO) on the in vivo activity of feeding circuits have only recently been explored. Several studies have established that an HFD dysregulates hypothalamic neural responses to nutritional stimuli.9,10,23 In particular, HFD-induced obesity attenuates AgRP neural dynamics in a manner that may counteract weight loss and promote weight regain. Obesity dampens anticipatory chow-mediated AgRP neuron inhibition and reduces intake of chow relative to palatable foods, even prior to substantial weight gain.10 HFD also attenuates AgRP neuron inhibition in response to nutrient ingestion, an alteration that is selective for dietary fat and lipid-stimulated hormone release.9 This impairment in nutrient-mediated AgRP neuron inhibition may promote excessive consumption in obese mice,9,10,24 as this inhibition is thought to alleviate the negative affective experience of hunger.21,25
A critical gap in our understanding of how obesogenic diets alter feeding circuit dynamics is whether the changes observed are due to a positive energy balance, availability of palatable food, or dietary macronutrient composition. Recent studies evaluating the effects of DIO on in vivo neural dynamics have exclusively employed HFD, making the effects of calorie excess vs. macronutrients consumed impossible to disentangle.9,10,23 However, the fat selectivity of the impaired AgRP neuron response to ingested nutrients,9 together with the recent finding that fats and sugars are sensed by distinct gut-brain pathways,7,26 supports the idea that diet macronutrient composition may mediate gut-brain axis dysregulation in obesity. By contrast, recent work has shown that sugar overconsumption, like HFD feeding, increases the intrinsic activity of AgRP neurons and decreases their sensitivity to the adipokine leptin ex vivo.11,12,27 This finding suggests that obesogenic diets of varying macronutrient compositions may also have common effects on feeding circuit activity. Given that obesogenic diets are typically high in both fats and sugars, it is imperative to delineate the contribution of each to pathologic changes in nutrient-mediated gut-brain signaling and feeding circuit dynamics.
To address how excessive sugar intake modulates in vivo feeding circuit activity, we developed an obesogenic high-sucrose diet (HSD), monitored its effects on nutrient-mediated AgRP neuron dynamics and feeding behavior, and determined which changes were reversed upon return to a balanced chow diet. We show that HSD alters AgRP neuron dynamics in manners both similar to and distinct from HFD.9,10 Like mice on an HFD, HSD-fed mice exhibit reduced chow intake and an associated reduction in AgRP neuron responses to external sensory cues of chow availability while maintaining appetite and neural responses to more palatable foods. In contrast to mice on an HFD, HSD-fed mice have intact AgRP neural responses to intragastrically (IG) infused lipids but exhibit reduced responses to glucose. Strikingly, fructose-mediated AgRP neuron inhibition is preserved in HSD-fed mice. This is consistent with our finding that glucose and fructose inhibit AgRP neurons via distinct mechanisms. Combined, our findings reveal a dissociation between the contributions of calorie excess and macronutrient composition to the neural and behavioral dysregulation that underlie the persistent consequences of obesogenic diets.
RESULTS
Liquid sucrose availability alters diet macronutrient composition and increases caloric intake, body weight, and adiposity
To understand the impacts of sugar overconsumption on gut-brain dynamics, we developed a DIO model wherein mice were given ad libitum access to a palatable 25% sucrose solution in addition to their regular chow and water. Daily carbohydrate intake was dramatically increased in HSD-fed mice, and total daily caloric intake was modestly augmented compared to controls on a normal chow diet (NCD) (Figures 1A–1C). HSD-fed mice gained a significant amount of weight and body fat after 4 weeks on this diet and lost a fraction of this weight upon return to a standard chow diet for 4 weeks (Figures 1D–1G). The amount of weight gain observed is less than what has been recently reported in similar approaches using HFD,9,10 an observation that is consistent with other models of sugar- and fat-induced obesity.27–29 HSD-induced weight gain was more robust in male compared to female mice (Figure S1). In addition, weight gain was positively correlated with starting weight in the HSD group (Figure S2N).
Figure 1. Liquid sucrose availability alters diet macronutrient composition and increases caloric intake and body weight.

(A–C) Macronutrient composition of intake (A), total daily caloric intake (B), and daily calories from chow (C) in control (NCD) and HSD-fed C57BL6/J mice averaged over 3 weeks. n = 25–38 mice per group (B: unpaired t test, p < 0.0001; C: unpaired t test, p < 0.0001).
(D) Body fat percentage in NCD and HSD mice after 4 weeks of chow or HSD, respectively. n = 22 mice per group (unpaired t test, p < 0.0001).
(E) Timeline of diets administered throughout the remainder of this study.
(F and G) Body weights (BWs) of NCD (F) and HSD (G) mice at baseline, after 4 weeks of chow or HSD, and after an additional 4 weeks of chow. n = 18–23 mice per group (F: one-way ANOVA, p = 0.3766; G: one-way ANOVA, p < 0.0001). Baseline BW was not significantly different between control and HSD mice (unpaired t test, p = 0.985).
(B–D, F, and G) Dots or lines represent individual mice. Error bars indicate mean ± SEM. t tests and post hoc comparisons: *p < 0.05, **p < 0.01, and n****p < 0.0001.
See also Figures S1–S3.
HSD significantly alters hormonal and metabolic parameters
To characterize the physiological consequences of an HSD, we conducted a series of plasma hormone studies and glucose tolerance assays in both NCD and HSD mice at baseline, after 4 weeks of chow or HSD, and after 4 more weeks of chow consumption (Figure 1E). Liquid sucrose overconsumption modestly increased fasting plasma insulin (Figures S2A and S2B), though the change in insulin levels from baseline to 4 weeks did not correlate with weight gain (Figure S2O). Our HSD also significantly raised plasma leptin levels compared to control mice (Figures S2C–S2E). The change in leptin levels from baseline to 4 weeks strongly correlated with weight gain over this time course (Figure S2P).
Although fasting blood glucose levels did not significantly change after 4 weeks of NCD or HSD (Figures S2F and S2G), HSD did impair glucose tolerance. HSD mice demonstrated larger glucose excursions following intraperitoneal glucose administration after 4 weeks relative to control mice. These changes were rescued upon return to a chow diet (Figures S2H and S2I). Tolerance to IG glucose was also significantly impaired in HSD mice (Figures S2J and S2K). Specifically, they exhibited an early rise in blood glucose levels 5 min following glucose delivery not seen in control mice, which was ameliorated upon return to NCD (Figures S2L and S2M). This early post-ingestive hyperglycemia has been observed previously on an HSD and may be due to an altered incretin effect in HSD-fed mice.30
The livers of mice after 4 weeks of HSD were steatotic relative to those of control mice (Figures S3A–S3C). This ectopic fat accumulation was consistent with the elevated fat mass in HSD mice (Figure 1D). However, liver weights (Figure S3D), cholesterol levels (Figure S3I), and plasma liver function indicators including alanine aminotransferase, albumin, alkaline phosphatase, and total bilirubin were not significantly different after 4 weeks of NCD vs. HSD (Figures S3E–S3H). Taken together, these results reveal that while 4 weeks of HSD leads to only modest weight gain, sucrose overconsumption causes both glucose intolerance and hepatic steatosis, canonical signs of the metabolic syndrome.
HSD reversibly suppresses fasting-induced chow intake and AgRP neuron responses to chow presentation
To investigate the impact of HSD on feeding behavior, we presented 6-hour-fasted control and HSD mice with either chow, chocolate, or liquid sucrose (25%). Similar to mice fed an HFD,9,10 HSD mice consumed significantly less regular chow relative to baseline fast re-feeding, an effect that was reversed after returning to a regular chow diet for 4 weeks (Figures 2A and 2B). This restoration of feeding behavior occurred even though the HSD-fed mice had not completely returned to their baseline body weight (Figure 1G). Chow fast re-feeding in control mice was consistent across this time course (Figure 2A). By contrast, when HSD mice were fasted and re-fed with sucrose, their intake was modestly increased from baseline (Figures S4A and S4B). Fast re-feeding with chocolate, a palatable food with a sugar content intermediate between chow and sucrose solution, decreased slightly after 4 weeks of HSD but remained robust relative to chow intake (Figures 2C and 2D). Altogether, we observed a graded re-feeding response in HSD-fed (but not control) mice that correlates with the sucrose content and palatability of the food presented (Figures S4C and S4D). These results indicate a selectively preserved appetite for palatable, sugary food and liquids in HSD-fed mice.
Figure 2. HSD selectively suppresses intake of and AgRP neural responses to chow vs. chocolate.

(A–D) 2 h chow (A and B) or chocolate (C and D) intake following a 6 h fast in NCD (A and C) and HSD (B and D) animals at baseline, after 4 weeks of chow or HSD, and after an additional 4 weeks of chow. n = 16–18 mice per group (A: one-way ANOVA, p = 0.062; B: one-way ANOVA, p < 0.0001; C: one-way ANOVA, p = 0.123; D: one-way ANOVA, p = 0.0158).
(E and F) Calcium signal in AgRP neurons from fasted NCD (E) and HSD (F) mice presented with chow at baseline, after 4 weeks of chow or HSD (4 weeks), and after an additional 4 weeks of chow (8 weeks) as indicated. n = 7–11 mice per group.
(G and H) Average ΔF/F in NCD (G) and HSD (H) mice from (E) and (F) at 2–3 min following chow presentation (G: one-way ANOVA, p = 0.5559; H: one-way ANOVA, p = 0.0001).
(I–K) Heatmaps portraying ΔF/F of AgRP neurons in individual HSD mice from (F) and (H) at baseline (I), after 4 weeks of HSD (J), and after 4 more weeks of regular chow (K).
(L and M) Calcium signal in AgRP neurons from fasted NCD (L) and HSD (M) mice presented with chocolate at baseline, after 4 weeks of chow or HSD (4 weeks), and after an additional 4 weeks of chow (8 weeks) as indicated. n = 4–8 mice per group.
(N and O) Average ΔF/F in NCD (N) and HSD (O) mice from (L) and (M) at 2–3 min following chocolate presentation (N: one-way ANOVA, p = 0.5332; O: one-way ANOVA, p = 0.2206).
(P–R) Heatmaps portraying ΔF/F of AgRP neurons in individual HSD mice from (M) and (O) at baseline (P), after 4 weeks of HSD (Q), and after 4 more weeks of regular chow (R).
(E, F, L, and M) Isosbestic traces for all recordings are shown in gray. (I–K and P–R) Each heatmap line represents an individual animal. (A–D, G, H, N, and O) Lines represent individual mice. Error bars indicate mean ± SEM. Post hoc comparisons: *p < 0.05, **p < 0.01, and ****p < 0.0001.
See also Figures S4 and S5.
Given the well-established correlation between the magnitude of anticipatory AgRP neuron inhibition and subsequent consumption,5,7,9,10,21 we hypothesized that HSD mice would have blunted pre-consummatory AgRP neuron responses to presentation of chow but not chocolate. To test this idea, we used fiber photometry to record Ca2+ activity in AgRP neurons during fast re-feeding in control and HSD mice (Figure S5). Indeed, HSD mice exhibited dramatically attenuated AgRP neural inhibition upon chow presentation after 4 weeks of sucrose overconsumption, which is partially restored following return to an NCD (Figures 2F, and 2H–2K). By contrast, mice fed an NCD throughout this time course maintained consistent AgRP neuron responses to chow presentation (Figures 2E and 2G). Moreover, all animals maintained a consistent neural response to chocolate presentation over time (Figures 2L–2R). In summary, during positive energy balance on HSD, mice selectively forgo nutritious, balanced foods (i.e., chow) in favor of palatable, sugar-containing nutrient sources. These robust behavioral adaptations are mirrored in the dynamics of AgRP neurons in a similar manner to what is seen in HFD-fed mice.9,10
HSD attenuates AgRP neuron-driven feeding
Because AgRP neural activity is both necessary and sufficient to promote food intake,1,3,4,15,16,19,20 and because HFD blunts AgRP neuron-driven feeding,9,10 we examined whether the ability of AgRP neurons to drive feeding was altered in HSD mice. To do this, we implanted optical fibers above the arcuate nucleus in mice that express channelrhodopsin (ChR2) in AgRP neurons (AgRP::ChR2 mice). Our protocol consisted of 30 min of habituation followed by 30 min of food availability (chow or chocolate) during the presence or absence of light stimulation at baseline and after 4 weeks of HSD or NCD (Figure 3A).
Figure 3. HSD suppresses AgRP-neuron-driven chow intake.

(A) Optogenetic experiment schematic. On separate days, AgRP::ChR2 mice equipped for optogenetic AgRP neuron stimulation were assessed under two protocols. Each session involved a 30 min habituation period without food and without optical stimulation followed by 30 min of food availability without (no stim) or with (stim) optical stimulation. Each mouse was tested using both regular chow and chocolate in both the sated and overnight fasted states. These experiments were performed at baseline and repeated after 4 weeks of ad libitum NCD or HSD.
(B and C) Caloric intake of ad libitum-fed mice given chow (B) or chocolate (C) at baseline and after NCD under no stim and stim protocols (B: two-way ANOVA, main effect of no stim vs. stim p < 0.0001, main effect of time on diet p = 0.8659, and interaction p = 0.6446; C: two-way ANOVA, main effect of no stim vs. stim p < 0.0001, main effect of time on diet p = 0.2858, and interaction p = 0.2001). n = 9 mice.
(D and E) Caloric intake of fasted mice given chow (D) or chocolate (E) at baseline and after NCD under no stim and stim protocols (D: two-way ANOVA, main effect of no stim vs. stim p < 0.0001, main effect of time on diet p = 0.1054, and interaction p = 0.8268; E: two-way ANOVA, main effect of no stim vs. stim p = 0.0004, main effect of time on diet p = 0.4422, and interaction p = 0.5429). n = 9 mice
(F and G) Caloric intake of ad libitum-fed mice given chow (F) or chocolate (G) at baseline and after HSD under no stim and stim protocols (F: two-way ANOVA, main effect of no stim vs. stim p < 0.0001, main effect of time on diet p < 0.0001, and interaction p = 0.0003; G: two-way ANOVA, main effect of no stim vs. stim p < 0.0001, main effect of time on diet p = 0.0569, and interaction p = 0.3282). n = 13 mice
(H and I) Caloric intake of fasted mice given chow (H) or chocolate (I) at baseline and after HSD under no stim and stim protocols (H: two-way ANOVA, main effect of no stim vs. stim p < 0.0001, main effect of time on diet p = 0.0071, and interaction p = 0.7558; I: two-way ANOVA, main effect of no stim vs. stim p < 0.0001, main effect of time on diet p = 0.1164, and interaction p = 0.2473). n = 11–13 mice.
(B–I) Lines represent individual mice. Error bars indicate mean ± SEM. Post hoc comparisons: *p < 0.05, ***p < 0.001, and ****p < 0.0001.
See also Figure S6.
As expected, optogenetic activation of AgRP neurons at baseline strongly increased consumption of both chow and chocolate in sated animals (Figures 3B, 3C, 3F, and 3G) and modestly increased intake of both chow and chocolate following an overnight fast (Figures 3D, 3E, 3H, and 3I). After 4 weeks of HSD, the effect of light stimulation on ad libitum-fed animals presented with chow was significantly attenuated (Figures 3F and 3H). By contrast, light-stimulation-induced feeding in mice presented with chocolate was preserved (Figures 3G and 3I). Mice fed a chow diet over this time course maintained stable feeding responses to AgRP neuron stimulation across conditions (Figures 3B–3E), and control mice lacking ChR2 expression displayed equivalent feeding behavior irrespective of light stimulation (Figure S6). Thus, while supraphysiologic AgRP neuron stimulation increases chow intake in HSD mice, the effect is less than what is seen in lean mice. This suggests that reduced chow intake in fasted HSD-fed mice is not solely due to sub-maximal AgRP neuron activity in these animals and that downstream or parallel circuit nodes are also affected.10,31 Further, taken together with our fiber photometry results, this finding reveals that, like an HFD, HSD alters both AgRP neuron dynamics and behavioral responses to AgRP neuron activation.9,10
HSD selectively and persistently suppresses AgRP neuron responses to glucose
In addition to food presentation, gastric infusion of individual macronutrients is sufficient to durably inhibit AgRP neurons.7,8 Given that the AgRP neurons of HFD-induced obese animals become selectively desensitized to dietary fat,9 we tested the hypothesis that HSD would selectively alter AgRP neuron responses to infused sugars.
To accomplish this, we recorded AgRP neural responses to a panel of nutrients in HSD and NCD mice. Mice were equipped for fiber photometry recording from AgRP neurons and IG nutrient administration by gastric catheterization. HSD and NCD mice were first subjected to baseline recordings wherein isocaloric (1 kcal) and isovolemic (1 mL) solutions of glucose, fructose, sucrose, intralipid, and peptides were infused over a 12 min period. Water was also administered as a negative control. IG infusion of all nutrients, but not water, reliably inhibited AgRP neurons, consistent with previous reports (Figures 4 and 5).7–9
Figure 4. HSD selectively and persistently suppresses AgRP neuron responses to glucose.

(A and B) Calcium signal in AgRP neurons from fasted NCD (A) and HSD (B) mice during intragastric glucose delivery at baseline, after 4 weeks of chow or HSD (4 weeks), and after an additional 4 weeks of chow (8 weeks) as indicated. n = 4–8 mice per group.
(C and D) Average ΔF/F in NCD (C) and HSD (D) mice from (A) and (B) for 1 min surrounding the end of the infusion (C: one-way ANOVA, p = 0.1646; D: one-way ANOVA, p = 0.0087).
(E–G) Heatmaps portraying AgRP neuron fluorescence changes in each HSD mouse from (B) and (D) at baseline (E), after 4 weeks of HSD (F), and after 4 more weeks of regular chow (G).
(H and I) Calcium signal in AgRP neurons from fasted NCD (H) and HSD (I) mice during intragastric fructose delivery at baseline, after 4 weeks of chow or HSD (4 weeks), and after an additional 4 weeks of chow (8 weeks) as indicated. n = 4–11 mice per group.
(J and K) Average ΔF/F in NCD (J) and HSD (K) mice from (H) and (I) for 1 min surrounding the end of the infusion (J: one-way ANOVA, p = 0.7812; K: one-way ANOVA, p = 0.9426).
(L–N) Heatmaps portraying AgRP neuron fluorescence changes in each HSD mouse from (I) and (K) at baseline (L), after 4 weeks of HSD (M), and after 4 more weeks of regular chow (N).
(O and P) Calcium signal in AgRP neurons from fasted NCD (O) and HSD (P) mice during intragastric sucrose delivery at baseline, after 4 weeks of chow or HSD (4 weeks), and after an additional 4 weeks of chow (8 weeks) as indicated. n = 5–10 mice per group.
(Q and R) Average ΔF/F in NCD (Q) and HSD (R) mice from (O) and (P) for 1 min surrounding the end of the infusion (Q: one-way ANOVA, p = 0.5739; R: one-way ANOVA, p = 0.1432).
(S–U) Heatmaps portraying AgRP neuron fluorescence changes in each HSD mouse from (P) and (R) at baseline (S), after 4 weeks of HSD (T), and after 4 more weeks of regular chow (U).
(A, B, H, I, O, and P) Isosbestic traces for all recordings are shown in gray. (E–G, L–N, and S–U) Each heatmap line represents an individual animal. Post hoc comparisons: *p < 0.05. (C, D, J, K, Q, and R) Lines represent individual mice. Error bars indicate mean ± SEM.
See also Figure S5.
Figure 5. HSD does not alter AgRP neuron responses to lipids or peptides.

(A and B) Calcium signal in AgRP neurons from fasted NCD (A) and HSD (B) mice during intragastric intralipid delivery at baseline, after 4 weeks of chow or HSD (4 weeks), and after an additional 4 weeks of chow (8 weeks) as indicated. n = 4–8 mice per group.
(C and D) Average ΔF/F in NCD (C) and HSD (D) mice from (A) and (B) for 1 min surrounding the end of the infusion (C: one-way ANOVA, p = 0.7015; D: one-way ANOVA, p = 0.1705).
(E–G) Heatmaps portraying AgRP neuron fluorescence changes in each HSD mouse from (B) and (D) at baseline (E), after 4 weeks of HSD (F), and after 4 more weeks of regular chow (G).
(H and I) Calcium signal in AgRP neurons from fasted NCD (H) and HSD (I) mice during intragastric peptide delivery at baseline, after 4 weeks of chow or HSD (4 weeks), and after an additional 4 weeks of chow (8 weeks) as indicated. n = 5 mice per group.
(J and K) Average ΔF/F in NCD (J) and HSD (K) mice from (H) and (I) for 1 min surrounding the end of the infusion (J: one-way ANOVA, p = 0.2826; K: one-way ANOVA, p = 0.7199).
(L–N) Heatmaps portraying AgRP neuron fluorescence changes in each HSD mouse from (I) and (K) at baseline (L), after 4 weeks of HSD (M), and after 4 more weeks of regular chow (N).
(O and P) Calcium signal in AgRP neurons from fasted NCD (O) and HSD (P) mice during intragastric water delivery at baseline, after 4 weeks of chow or HSD (4 weeks), and after an additional 4 weeks of chow (8 weeks) as indicated. n = 4–5 mice per group.
(Q and R) Average ΔF/F in NCD (Q) and HSD (R) mice from (O) and (P) for 1 min surrounding the end of the infusion (Q: one-way ANOVA, p = 0.3332; R: one-way ANOVA, p = 0.5615).
(A, B, H, I, O, and P) Isosbestic traces for all recordings are shown in gray. (E–G and L–N) Each heatmap line represents an individual animal. (C, D, J, K, Q, and R) Lines represent individual mice. Error bars indicate mean ± SEM.
See also Figure S5.
Notably, however, we found that fructose leads to significantly less robust AgRP neuron inhibition compared to glucose infusion in lean mice and that the response to sucrose is intermediate between the responses to each monosaccharide (Figures 6A–6C). Thus, we hypothesized that sucrose-mediated AgRP neuron inhibition requires disaccharide breakdown by sucrase. Indeed, pre-treatment with the sucrase inhibitor acarbose abrogates the AgRP neural response to sucrose (Figures 6D–6G).
Figure 6. Sucrose-mediated AgRP neuron inhibition requires sucrose breakdown into fructose and glucose, which AgRP neurons sense through distinct mechanisms.

(A) Calcium signal in AgRP neurons from fasted lean mice during intragastric delivery of water (black), fructose (blue), sucrose (purple), or glucose (green). n = 9–15 mice per group.
(B) Average ΔF/F in mice from (A) for 1 min surrounding the end of infusion (one-way ANOVA, p < 0.0001).
(C) Average ΔF/F in lean mice for 1 min surrounding the end of the sucrose infusion (purple) vs. arithmetically averaged fructose and glucose infusion signals (black). n = 10 mice (paired t test, p = 0.8133).
(D) Calcium signal in AgRP neurons from fasted mice during intragastric delivery of the sucrase inhibitor acarbose (1 mg) or vehicle immediately followed by intragastric delivery of sucrose or water as indicated. n = 4–14 mice per group.
(E) Average ΔF/F in mice from (D) for 1 min surrounding the end of infusion (one-way ANOVA, p < 0.0001).
(F and G) Heatmaps portraying AgRP neuron fluorescence changes in each mouse from (D) and (E) where either vehicle (F) or acarbose (G) was administered prior to sucrose infusion.
(H) Calcium signal in AgRP neurons from fasted mice during intragastric delivery of the SGLT1 inhibitor LX4211 (50 mg/kg) or vehicle immediately followed by intragastric delivery of glucose or water as indicated. n = 6 mice per group.
(I) Average ΔF/F in mice from (H) for 1 min surrounding the end of infusion (one-way ANOVA, p = 0.0003).
(J and K) Heatmaps portraying AgRP neuron fluorescence changes in each mouse from (H) and (I) where either vehicle (J) or LX4211 (K) was administered prior to glucose infusion.
(L) Calcium signal in AgRP neurons from fasted mice during intragastric LX4211 (50 mg/kg) or vehicle immediately followed by intragastric delivery of fructose or water as indicated. n = 6–8 mice per group.
(M) Average ΔF/F in mice from (L) for 1 min surrounding the end of infusion (one-way ANOVA, p < 0.0001).
(N and O) Heatmaps portraying AgRP neuron fluorescence changes in each mouse from (L) and (M) where either vehicle (N) or LX4211 (O) was administered prior to fructose infusion.
(A, D, H, and L) Isosbestic traces for all recordings are shown in gray. (F, G, J, K, N, and O) Each heatmap line represents an individual animal. Post hoc comparisons: *p < 0.05, ***p < 0.001, and ****p < 0.0001. (B, C, E, I, and M) Dots or lines represent individual mice. Error bars indicate mean ± SEM.
See also Figure S5.
We repeated the same nutrient infusions after mice had consumed HSD or NCD for 4 weeks and a final time after all animals were returned to NCD for 4 weeks. Remarkably, the AgRP neural response to IG glucose in HSD-fed animals was selectively suppressed compared to baseline (Figures 4A–4G). Unlike the anticipatory response to chow presentation, the attenuated response to glucose persisted after return to a chow diet and partial weight loss (Figures 4B and 4D–4G). Responses to fructose, sucrose, lipid, and peptide remained intact in HSD-fed mice, and NCD animals maintained consistent responses to all IG nutrients throughout this time course (Figures 4 and 5A–5N). When considered in combination with previously published results from HFD mice,9 our findings reveal marked differences in the response of interoceptive circuits to the overconsumption of fat-vs. sugar-rich obesogenic diets.
Our observation that HSD-fed mice overconsume both glucose and fructose but only have a reduced AgRP neural response to glucose infusion led us to hypothesize that separate mechanisms mediate glucose- and fructose-induced AgRP neuron inhibition. As previously published, we found that glucose-mediated AgRP neuron inhibition requires intestinal uptake via the sodium-glucose co-transporter SGLT1 (Figures 6H–6K).26 By contrast, fructose sensing by AgRP neurons occurs independently of SGLT1 (Figures 6L–6O). Identifying additional distinct molecular mediators conveying fructose or glucose consumption to AgRP neurons, and how these processes are disrupted during sugar-induced obesity, is a critical subject of future study.
Behavioral and AgRP neural responses to gut hormones are intact in HSD-fed animals
We previously showed that the satiation hormone cholecystokinin (CCK) rapidly inhibits AgRP neurons and is necessary for fat-mediated AgRP neuron inhibition.7 Moreover, AgRP neural responses to both dietary lipids and CCK are blunted in HFD-fed mice.9 However, the molecular mediators of glucose- and fructose-induced AgRP neuron inhibition remain incompletely understood. To determine how HSD impacts behavioral and AgRP neural responses to gut hormones, we monitored chow fast re-feeding and AgRP neuron inhibition induced by CCK or peptide YY (PYY) at baseline, after 4 weeks of NCD or HSD, and after 4 more weeks of regular chow consumption.7–9 HSD had no impact on CCK- or PYY-induced feeding suppression or AgRP neuron inhibition (Figures 7 and S7). As noted above, HSD-fed mice exhibited attenuated fast-induced chow intake (Figure 2B), but pre-treatment with CCK or PYY further reduced food intake comparably to what is observed in NCD mice (Figure S7).
Figure 7. HSD does not alter AgRP neuron re- sponses to CCK or PYY.

(A and B) Calcium signal in AgRP neurons from fasted NCD (A) and HSD (B) mice following intraperitoneal CCK (10 mg/kg) delivery at baseline, after 4 weeks of chow or HSD (4 weeks), and after an additional 4 weeks of chow (8 weeks) as indicated. n = 5–9 mice per group.
(C and D) Area under the curve in NCD (C) and HSD
(D) mice from (A) and (B) over a 15 min period following the injection (C: one-way ANOVA, p = 0.9564; D: one-way ANOVA, p = 0.6489).
(E–G) Heatmaps portraying AgRP neuron fluorescence changes in each HSD mouse from (B) and (D) at baseline (E), after 4 weeks of HSD (F), and after 4 more weeks of regular chow (G).
(H and I) Calcium signal in AgRP neurons from fasted NCD (H) and HSD (I) mice following intraperitoneal PYY (100 mg/kg) delivery at baseline, after 4 weeks of chow or HSD (4 weeks), and after an additional 4 weeks of chow (8 weeks) as indicated. n = 5–10 mice per group.
(J and K) Area under the curve in NCD (J) and HSD (K) mice from (H) and (I) over a 15 min period following the injection (J: one-way ANOVA, p = 0.5428; K: one-way ANOVA, p = 0.9368).
(L–N) Heatmaps portraying AgRP neuron fluorescence changes in each HSD mouse from (I) and (K) at baseline (L), after 4 weeks of HSD (M), and after 4 more weeks of regular chow (N).
(O and P) Calcium signal in AgRP neurons from fasted NCD (O) and HSD (P) mice following intraperitoneal saline delivery at baseline, after 4 weeks of chow or HSD (4 weeks), and after an additional 4 weeks of chow (8 weeks) as indicated. n = 4–6 mice per group.
(Q and R) Area under the curve in NCD (Q) and HSD (R) mice from (O) and (P) over a 15 min period following the injection (Q: one-way ANOVA, p = 0.4666; R: one-way ANOVA, p = 0.4929).
(A, B, H, I, O, and P) Isosbestic traces for all recordings are shown in gray. (E–G and L–N) Each heatmap line represents an individual animal. (C, D, J, K, Q, and R) Lines represent individual mice. Error bars indicate mean ± SEM.
See also Figures S5 and S7 and Table S2.
To further interrogate whether CCK or PYY contribute to selectively reduced glucose sensing by AgRP neurons in HSD-fed mice, we performed targeted real-time quantitative reverse-transcriptase PCR across different intestine regions from fasted HSD and NCD mice. We found no differences in Cck or Pyy expression between these groups (Figure S7). Thus, the molecular underpinnings of sugar-induced AgRP neuron inhibition and HSD-induced impairment in glucose-mediated AgRP neuron inhibition remain to be determined.
DISCUSSION
Recent studies have begun to unravel how the in vivo dynamics of hypothalamic circuits are altered during obesity, producing knowledge that may facilitate novel therapeutic approaches for metabolic diseases. Yet, it is unclear how diet composition impacts the neurophysiological consequences of DIO. Here, we developed a rodent model of sucrose-induced obesity and lever-aged calcium imaging, optogenetics, and behavioral analysis to elucidate how dietary macronutrient composition contributes to obesity-induced feeding circuit modulation. Within the context of recently published studies, our results suggest that palatable obesogenic diets produce macronutrient-dependent and -independent changes in AgRP neuron activity. While altered responses to interoceptive signals depend upon the macronutrient composition of the obesogenic diet, both high-fat and high-sugar diets similarly attenuate the response of AgRP neurons to external sensory cues of chow availability and subsequent chow intake. Combined, these changes represent a neural correlate of an altered set point wherein obesity dysregulates homeostatic feeding circuits in a manner that defends a new, higher body weight.32,33
Sucrose overconsumption selectively attenuates glucose-mediated AgRP neuron inhibition
We have previously shown that high-fat DIO selectively attenuates lipid-mediated AgRP neuron inhibition without altering the response of these neurons to ingested glucose or peptides,9 leading us to interrogate how dietary macronutrient composition modulates obesity-induced changes in gut-brain axis dynamics. Here, we made the parallel observation that an HSD, despite inducing only modest weight gain, selectively and robustly attenuated glucose-induced AgRP neuron inhibition without changing responses to other macronutrients. As reported previously in HFD-fed mice, this effect persisted even after partial weight loss upon return to a chow diet (Figures 4 and 5). This persistent deficit in glucose-mediated AgRP neuron inhibition may compromise the ability of ingested sugar to alleviate the negative valence associated with high AgRP neuron activity.21,25 Further work will be required to understand how this blunted neural inhibition modulates preference for and intake of specific macronutrients.
Intriguingly, sucrose overconsumption did not diminish AgRP neuron responses to fructose, the other monosaccharide component of sucrose (Figures 4I and 4K–4N). Moreover, the effect of sucrose on AgRP neuron activity reflects the added effects of glucose and fructose, as blocking sucrase activity abrogates sucrose-mediated AgRP neuron inhibition (Figures 6D–6G). The distinct effects of an HSD on glucose- vs. fructose-mediated AgRP neuron inhibition is likely due to the two monosaccharides modulating AgRP neuron activity via independent mechanisms (Figures 6H–6O). However, our observation that, for the duration of our neural recordings, fructose-mediated AgRP neuron inhibition is significantly weaker than that induced by glucose despite identical caloric content also raises the possibility that fructose induces AgRP neuron inhibition over a longer timescale (Figures 6A and 6B). Dissecting the detailed mechanisms underlying glucose- and fructose-mediated AgRP neuron inhibition in lean and obese mice will require additional studies. Specifically, it is unclear whether glucose sensing in the GI tract, hepatic portal vein, or blood causes impaired glucose-mediated AgRP neuron inhibition in mice on an HSD.26,34 Future studies will also be necessary to disentangle how overconsumption of specific monosaccharides contributes to altered nutrient-mediated gut-brain signaling in obesity and to determine how longer-term hormonal modulators of AgRP neuron activity, feeding, and glucose homeostasis contribute to gut-brain axis dysfunction in obesity.35,36
Overall, our findings suggest that diet macronutrient composition plays a more prominent role than caloric intake and body weight in the regulation of gut-brain nutrient-sensing pathways. The persistent desensitization of the gut-brain axis to lipid and glucose following HFD or HSD (Figures 6B and 6D–6G),9 respectively, even after weight loss, could contribute to recidivism in obesity and adds to the body of evidence that dietary history is a critical determinant of future health.32,33,37,38 Moreover, since typical obesogenic diets are high in both fats and sugars, this work, combined with prior HFD findings, has laid a foundation for future studies investigating the potentially additive effects of excessive fat and sugar intake on hypothalamic neural dynamics.39–41
Obesity causes macronutrient-independent attenuation of chow intake and AgRP neuron responses to chow presentation
HFD-induced obesity congruently blunts AgRP neural responses to chow presentation and chow consumption following a fast.9,10,42 These changes are rapidly reversed during weight loss.9 Attenuated neural responses to chow and reduced fasting-induced chow intake during obesity represent an appropriate adaptation to energy surplus. However, the rapid recovery when animals enter a negative energy balance may promote weight regain. Here, we showed that HSD-induced obesity similarly blunts anticipatory AgRP neuron inhibition in response to chow presentation and subsequent chow intake (Figures 2A, 2B, and 2E–2K), despite modest weight gain compared to HFD-fed mice (Figure 1F).9,10,27–29 Meanwhile, neural responses to a palatable, sugar-containing food (milk chocolate) remain constant in HSD-fed mice (Figures 2L–2R), and fasting-induced chocolate intake is relatively preserved compared to chow consumption (Figures 2D, 2M, 2O–2R, 3G, and 3I). Thus, selective reduction of chow intake occurs in both HFD- and HSD-fed mice.10 Together, these findings suggest that diet palatability and overconsumption, not macronutrient composition or profound weight gain, drive obesogenic diet-induced changes in AgRP neural responses to exterosensory food-related stimuli and food choice. Future work dissecting the effects of overconsumption on AgRP neuron inputs that drive their rapid inhibition and control food intake over multiple timescales will illuminate how obesity modulates the anticipatory response of feeding circuits to food cues.43–46
Obesity attenuates AgRP neuron stimulation-induced feeding
Previous studies have shown that HFD-induced obesity attenuates AgRP neuron stimulation-induced chow intake.9,10 Here, we report a similar effect in HSD mice. Supraphysiologic stimulation of AgRP neurons increased food intake both before and after 4 weeks of HSD (Figures 3F–3I; no stim [stimulation] vs. stim), suggesting that reduced fasting-induced hyperphagia in HSD-fed animals may be partially due to a failure of food deprivation to maximally activate AgRP neurons in the obese state. This is consistent with earlier findings showing reduced fasting- and ghrelin-induced activation of AgRP neurons in DIO animals.9,42,47,48 However, AgRP neuron stimulation-induced chow intake in HSD mice was modestly blunted compared to baseline, which implies reduced sensitivity of downstream circuits to AgRP neuron stimulation (Figures 3F and 3H; baseline stim vs. HSD stim). Taken together, these findings indicate that AgRP neuron stimulation-induced chow intake in sated mice is disrupted by HSD and that overconsumption of more palatable foods in obese mice may not be primarily driven by increased AgRP neuron activity.9,10,24 Indeed, mounting evidence suggests that parallel circuits including mesolimbic dopamine neurons, GABAergic lateral hypothalamic neurons, and non-AgRP-expressing arcuate neurons drive feeding independent of energy need.10,31,49
This set of experiments has revealed that DIO impairs nutrient-mediated gut-brain communication in a macronutrient-dependent manner and modulates anticipatory AgRP neuron dynamics in a macronutrient-independent manner. The attenuated pre-consummatory AgRP neuronal response to chow presentation and associated reduction in fasting-induced chow intake is a compensatory adaptation to a sustained positive energy balance on an obesogenic diet. However, this feeding suppression is rapidly reversed before mice return to their baseline weight. This rapid restoration of anticipatory AgRP neuron dynamics and food intake, coupled with persistently blunted macronutrient-mediated AgRP neuron inhibition, promotes excessive food intake during weight loss, which is likely a key driver of weight regain. Moving forward, characterizing the molecular- and circuit-level mechanisms of obesity-induced changes in AgRP neuron dynamics will be critical to identify additional nutritional, hormonal, and neural approaches to permanently treat obesity.
Limitations of the study
This study has several limitations. First, our HSD is not protein- or vitamin-matched to standard rodent chow. Thus, reduced intake of protein or vitamins, rather than increased sugar intake, may cause some of the behavioral and physiological differences observed between HSD and NCD mice. For example, it is possible that HSD-fed mice lose lean muscle mass. This may both contribute to changes in food intake and neural dynamics and may account for the fact that HSD-fed mice exhibit modest weight gain, while their body fat increases more robustly. Future work could employ custom diets high in simple sugars but protein- and micronutrient matched to regular chow to eliminate the possibility that observed changes are due to deficiencies in these other nutrients. However, evidence supports that excessive sugar intake in humans is linked to deficiency in other macro- and micronutrients,50–52 making our HSD a physiologically relevant DIO model. Second, while fiber photometry is a powerful method to monitor neural activity, it has caveats. It only captures changes in neural activity over time and thus offers no insight into how HSD modulates tonic firing of AgRP neurons in intact animals. Nevertheless, recent studies have examined this and found striking similarities to changes seen on an HFD.11,12,27 In addition, fiber photometry cannot capture heterogeneity in neural responses, and thus it is unclear whether lipid- and glucose-responsive AgRP neurons are the same or distinct populations. Future work using complementary approaches will address these gaps. Finally, in contrast to prior work examining an HFD where CCK was identified as a molecular mediator of lipid-induced AgRP neuron inhibition and its blunting in obese mice, this work has not identified the molecular mediator(s) of monosaccharide-induced AgRP neuron inhibition. This is the subject of ongoing investigation.
STAR★METHODS
Lead contact
Further information and requests for resources and reagents should be directed to and will be fulfilled by the lead contact, Lisa Beutler (lisa.beutler@northwestern.edu).
Materials availability
Sequences of primers generated in this study are listed in Table S2. This study did not generate any other new unique reagents.
Data and code availability
The data reported in the paper will be shared by the lead contact upon request.
All original code has been deposited at Github and is publicly available as of the date of publication. The link is listed in the key resources table.
Any additional information required to reanalyze the data reported in this paper is available from the lead contact upon request.
KEY RESOURCES TABLE
| REAGENT or RESOURCE | SOURCE | IDENTIFIER |
|---|---|---|
| Antibodies | ||
|
| ||
| Rabbit polyclonal anti-GFP | Invitrogen | REF: A11122; RRID: AB_221569 |
| Donkey polyclonal anti-rabbit | Jackson ImmunoResearch | Code: 711-545-152; RRID: AB_2313584 |
|
| ||
| Bacterial and virus strains | ||
|
| ||
| pAAV.CAG.Flex.GCaMP6s.WPRE.SV40 | (Chen et al.)53 | Addgene; Cat#: 100842-AAV9 |
|
| ||
| Chemicals, peptides, and recombinant proteins | ||
|
| ||
| Acarbose, 95% | Acros Organics | Cat#: AC459080010 |
| Cholecystokinin Octapeptide (sulfated) | Bachem | PN#: 4033010 |
| Collagen Peptides (Unflavored) | Sports Research | N/A |
| D-(−)-Fructose | Tokyo Chemical Industry | PN#: F0060 |
| D-(+)-Glucose | Sigma-Aldrich | Cat#: G8270 |
| Hershey’s Kisses Milk Chocolate Candy | The Hershey Company | N/A |
| Intralipid 20% | Fresnius Kabi | NDC: 0338-0519-09 |
| Peptide YY (3-36) | Tocris Bioscience | Cat#: 1618 |
| Sotagliflozin (LX4211) | Selleck Chemical | Cat#: S8103 |
| Sucrose, 99% | Thermo Fisher Scientific | Cat#: A15583.0C |
| Teklad LM-485 Mouse/Rat Sterilizable Diet | Envigo | Product code 7012 |
| Normal Donkey Serum | Jackson ImmunoResearch | Code: 017-000-121 |
| Triton X-100 | EMD Millipore | Cat#: TX1568-1 |
|
| ||
| Critical commercial assays | ||
|
| ||
| iScript cDNA Synthesis Kit | Bio-Rad | Cat#: 1708891 |
| iTaq Universal SYBR Green Supermix | Bio-Rad | Cat#: 1725120 |
| Mouse Leptin ELISA Kit | Crystal Chem Immunoassays | Cat#: 90030 |
| Mouse Insulin ELISA Kit | Crystal Chem Immunoassays | Cat#: 90080 |
| RNeasy Mini Kit | Qiagen | Cat#: 74104 |
| VetScan Mammalian Liver Profile | Abaxis | Cat#: 500-0040-12 |
|
| ||
| Experimental models: Organisms/strains | ||
|
| ||
| C57BL6/J | The Jackson Laboratory | Strain #: 000664 |
| Agrp tm1(cre)Lowl /J | The Jackson Laboratory | Strain #: 012899 |
| B6; 129S-Gt(ROSA) 26Sortm32(CAG-COP4’H124R/EYFP)Hze/j | The Jackson Laboratory | Strain #: 012569 |
|
| ||
| Oligonucleotides | ||
|
| ||
| Primers for qPCR, see Table S2 | This paper | N/A |
|
| ||
| Software and algorithms | ||
|
| ||
| Fiber photometry analysis scripts | This paper | https://doi.org/10.5281/zenodo.10403577 |
|
| ||
| Other | ||
|
| ||
| Fiber photometry implant | Doric Lenses | MFC_400/430-0.48_6.3mm_MF2.5_FLT |
| Bronze mating sleeve | Doric Lenses | SLEEVE_BR_2.5 |
| Syringe Pump | Harvard Apparatus | Cat#: 70-2000 |
| Polyurethane tubing for nutrient infusions | Instech Laboratories | VAHBPU-T25 |
| Adaptors for nutrient infusions | Instech Laboratories | PNP3MC/25; LS25 |
| Intragastric catheter | Instech Laboratories | C30PU-MGA1909 |
| Felt button | Instech Laboratories | VABM1B/22 |
| Magnetic cap | Instech Laboratories | VABM1C |
| Photometry processors | Tucker-Davis Technologies | RZ5P; RZ10X |
| LEDs | Thorlabs | M405FP1; M470F3 |
| LED Driver | Thorlabs | DC4100 |
| Photometry patch cords | Doric Lenses | MFP_400/430/1100-0.57_2m_FCM-MF2.5_LAF |
| Optogenetics patch cords | Prizmatix | 500um POF N.A. 0.63 L = 75cm |
| LED source + programmable TTL pulse generator for optogenetics | Prizmatix | PN#: D-OG-LED-B/B |
| Optogenetics implant | Doric Lenses | MFC_200/245_0.37_6.1mm_ZF1.25_FLT |
| Zirconia mating sleeve | Doric Lenses | F210-3001 |
EXPERIMENTAL MODEL AND SUBJECT DETAILS
Experimental protocols were approved by the Northwestern University IACUC in accordance with the National Institutes of Health guidelines for the Care and Use of Laboratory Animals (Protocol Numbers: IS00015106, IS00023902, IS00011930, and IS00016880). Mice were housed in a 12/12-h reverse light/dark cycle and given ad libitum food and water access. Animals were fed ad libitum chow (Envigo, 7012, Teklad LM-495 Mouse/Rat Sterilizable Diet) with or without liquid sucrose (25% sucrose (A15583.0C, Thermo Fisher Scientific) in water (w/v)) for HSD and NCD conditions, respectively. Mice were fasted for either 6 or 16 h before experiments, as indicated in the text and figures. During this time, they lacked access to chow or sucrose, though they had ad libitum water access. Agrptm1(cre)Lowl(AgRP-Cre, #012899, Jackson Labs) animals backcrossed onto a C57BL6/J background were used for fiber photometry.54 For experiments involving optogenetic stimulation of AgRP neurons, AgRP-Cre mice were crossed with 129S-Gt(ROSA)26Sortm32(CAG-COP4*H124R/EYFP)Hze(ROSA26-loxStoplox-ChR2-eYFP, #012569, Jackson Labs),55 yielding double-transgenic mice (AgRP::ChR2). C57BL/6J mice (wildtype #000664, Jackson Labs) were used to measure HSD consumption, as well as the impact of HSD on feeding behavior, glucose homeostasis, hormone levels, and liver anatomy and function. No statistical methods were used to determine sample sizes. Experiments involved male and female mice 2 to 6 months of age unless otherwise indicated. Where sex is not specified in the figure panel, male and female data are combined. Most animals used in feeding or fiber photometry experiments were individually housed to monitor daily caloric intake on HSD or control diets. However, AgRP::ChR2 mice used in optogenetic experiments were group-housed. All experiments were performed during the dark cycle in a dark environment.
METHOD DETAILS
Liquid sucrose overconsumption model
Daily macronutrient consumption, total caloric consumption, and body weight were measured in individually housed mice given premeasured amounts of a normal chow diet (NCD/controls) or normal chow plus 25% sucrose (HSD). Mice and chow were weighed daily, and volume of 25% sucrose was monitored each morning at the beginning of dark cycle for at least 3 weeks. 25% sucrose was replenished at least every other day.
All baseline fiber photometry recordings, fast re-feeding experiments, assays to determine glucose homeostasis, and hormone measurements were performed on animals fed a standard chow diet. Following these baseline experiments, a subset of mice were placed on HSD. For photometry experiments, animals were assigned to HSD or control groups to match baseline GCaMP signal between groups as closely as possible. Photometry, re-feeding experiments, glucose homeostasis, and hormone assays were performed in HSD and control animals after 3–5 weeks on their respective diets as indicated in text and figures, after which HSD animals were returned to a standard chow diet for 3–5 weeks and these experiments were repeated once more to assess reversibility of observed changes. HSD and control animals underwent the same series of fiber photometry experiments to account for changes in calcium-based fluorescence over time. Optogenetics experiments were performed at baseline and after 3–5 weeks on HSD or NCD as indicated.
Stereotaxic surgery
A recombinant AAV encoding Cre-dependent GCaMP6s (100842-AAV9, AAV9.CAG.Flex.GCaMP6s, Addgene) was employed for fiber photometry studies. The virus was unilaterally injected into the arcuate nucleus of AgRP-Cre mice anesthetized with isoflurane. In addition, a photometry cannula (MFC_400/430–0.48_6.3mm_MF2.5_FLT, Doric Lenses) was implanted unilaterally in the ARC at coordinates x = −0.3 mm, y = −1.55 mm, and z = −5.95 mm from bregma (Figure S5). A bronze mating sleeve (SLEEVE_BR_2.5, Doric Lenses) was also adhered to the implant. Mice were given 2–4 weeks for viral expression and surgery recovery before intragastric catheter implantation and/or fiber photometry recordings commenced.
For optogenetic experiments, we unilaterally inserted fiber optic implants (MFC_200/245_0.37_6.1mm_ZF1.25_FLT, Doric Lenses) above the arcuate nucleus of AgRP::ChR2 mice, or Cre-negative littermate control mice, anesthetized with isoflurane at coordinates x= −.30, y = −1.55, and z = −5.85 from bregma. Mice were given 1 week to recover prior to experimentation.
Post-operatively, mice were treated with buprenorphine and meloxicam and kept on a heating pad for observation until they were awake and mobile.
Intragastric catheter implantation
AgRP-Cre mice with correctly placed photometry implants or C57BL6/J mice used for intragastric glucose tolerance testing were anesthetized via ketamine/xylazine. An intrascapular 1-cm skin incision was made, and the skin was dissected from the underlying subcutaneous tissues. Then a 1.5-cm abdominal skin incision was made caudally from the xyphoid process. The skin was dissected from the underlying peritoneal tissue before an incision was made into the linea alba. A hemostat was used to pierce a small hole through the musculature in the upper back, through which the intragastric catheter was pulled into the abdominal cavity (C30PU-MGA1909, Instech Laboratories). Then the stomach was externalized and punctured, and a purse string suture was used to secure the catheter in the stomach (7–0 USP (Metric 0.5) Nylon, #S-N1718SP13, AD Surgical, Inc.). Absence of leakage was confirmed via saline injection into the catheter. The peritoneum and abdominal skin were closed in two layers (6–0 USP (Metric 0.7) Polypropylene, #S-P618R13, AD Surgical, Inc.). The portion of the catheter extending from between the scapula was secured to a felt button (VABM1B/22, Instech Laboratories) and closed with a magnetic cap (VABM1C, Instech Laboratories). The felt button was sutured to the underlying muscle at the intrascapular site, and the intrascapular skin incision sutured closed (6–0 USP (Metric 0.7) Polypropylene, #S-P618R13, AD Surgical, Inc.). Post-operatively, the mice were treated with enrofloxacin, meloxicam, and buprenorphine and kept on a heating pad for observation until they were awake and mobile. Animals were given a 2-week recovery period before experimentation.7,56
Fiber photometry
Two different photometry processors were used for data collection in this study. One setup features LEDs and LED driver separate from the processor (RZ5P, TDT (processor); DC4100 (LED driver); M405FP1 and M470F3 (LEDs), Thorlabs), while the second setup has these components integrated into the processor (RZ10X, TDT). The neural activity of each mouse was recorded using the same system and patch cord for every session allowing for reliable within-mouse comparisons of calcium signal over time.
Continuous blue LED (465–470 nm) and UV LED (405 nm) served as excitation light sources. These LEDs were modulated at distinct rates and delivered to a filtered minicube (Doric Lenses) before connecting through patch cords (MFP_400/430/1100–0.57_2m_FCM-MF2.5_LAF, Doric Lenses) to mouse implants (MFC_400/430–0.48_6.3mm_MF2.5_FLT, Doric Lenses). GCaMP6s calcium signals and isosbestic signals were collected through the same fibers back to dichroic ports of a minicube and transmitted to photoreceivers (Newport Visible Femtowatt Photoreceiver for the RZ5P system; integrated Lux photosensors in the RZ10X system). Digital signals sampled at 1.0173 kHz were then demodulated, lock-in amplified, and collected through the processor (RZ5P or RZ10X, TDT). Data was collected using the software Synapse (TDT), exported, and analyzed using custom Python code.
Neural responses to sucrose following acarbose, and glucose or fructose following LX4211 were measured in singly-housed lean mice. All other fiber photometry experiments were performed in singly-housed AgRP-Cre mice at baseline, after 3–5 weeks of control chow diet or HSD, and after another 3–5 weeks of chow diet. During the experiment, mice were placed in operant chambers (ENV-307W-CT, Med Associates) inside a light- and sound-attenuating cubicle (ENV-022MD, Med Associates) with no food or water access unless otherwise indicated. Mice exhibiting a baseline response to chow presentation of less than ΔF/F = −20% at baseline were deemed technical failures and excluded from further experiments or analysis. One to two trials of the same experiment for each mouse were averaged and treated as a single replicate.
Prior to each recording, the mice’s fiber optic implants were cleaned with 70% ethanol and connector cleaning sticks (MCCS-25, Sticklers) to minimize the potential for debris to interfere with the light path and create a confound. When debris was stuck on the sleeve, a syringe needle was used to remove it.
Intragastric infusions for fiber photometry
For fiber photometry experiments, a syringe pump (70–2000, Harvard Apparatus) was used to administer nutrients through the intragastric catheters.7,9 A total infusion volume of 1 mL was delivered at a constant rate over 12 min. Animals were fasted overnight (16 h) prior to all fiber photometry experiments involving intragastric infusion. The morning of the experiment, the mouse’s intragastric catheter was attached to the syringe pump using polyurethane tubing (VAHBPU-T25, Instech Laboratories) and adaptors (PNP3MC/25, Instech Laboratories; LS25, Instech Laboratories). Mice were given 20 min to habituate to the behavioral chambers during photometry recording before initiation of nutrient infusion. Photometry recording continued for another 20 min after infusion onset. For peristimulus plots, time zero represents the start of infusion. Each nutrient was diluted into deionized water and freshly prepared for each experiment. Intralipid (NDC 0338–0519-09, Fresenius Kabi) was diluted by 50%, while unflavored premium collagen peptides (Sports Research), glucose (G8270, Sigma-Aldrich), fructose (F0060, Tokyo Chemical Industry), and sucrose (Thermo Fisher Scientific) were made into a 25% (w/v) solution. All nutrient infusions were calorie- and volume-matched (1 kcal in 1 mL).
LX4211 (S8103, Selleck Chemical) was used to inhibit SGLT1. LX4211 was prepared freshly for each experiment and dissolved at a concentration of 5 mg/mL into a solution of 5% DMSO and 5% Kolliphor in normal saline. During fiber photometry recordings, a 50 mg/kg dose of LX4211 was injected intragastrically as a bolus using a sterile 1 mL Luer Lock syringe (14–955-464, Thermo Fisher Scientific) and an adaptor (VABM1B/22, Instech Laboratories). Immediately following LX4211 injection, the mouse’s intragastric catheter was attached to the syringe pump using polyurethane tubing and adaptors, and an infusion of 12.5% fructose, 12.5% glucose, or water was initiated.
Acarbose (AC459080010, Acros Organics) was used to inhibit sucrase. Acarbose was prepared freshly for each experiment and dissolved at a concentration of 5 mg/mL in PBS. During fiber photometry recordings, a 1 mg (200 mL) dose of acarbose was injected intragastrically as a bolus using a sterile 1 mL Luer Lock syringe and an adaptor. Immediately following acarbose injection, the mouse’s intragastric catheter was attached to the syringe pump using polyurethane tubing and adaptors, and an infusion of 12.5% sucrose or water was initiated.
Hormone injections for fiber photometry
Animals were habituated to the recording chambers for 20 min during fiber photometry recording before intraperitoneal administration of hormones. Photometry recording continued for another 20 min following hormone injection. One to two trials of the same experiment for each mouse were averaged and treated as a single replicate. For peristimulus plots, time zero was defined as the moment the behavioral chamber was opened. The following hormones and doses were used: CCK Octapeptide 10 μg/kg (sulfated) (4033010, Bachem) and PYY 100 μg/kg (126339–09-1, Tocris Bioscience).7
Hormone injections for feeding experiments
C57BL6/J mice were habituated to feeding chambers, handling, and intraperitoneal injections for 2 weeks before hormone-induced fast re-feeding experiments were performed at baseline, after 3–5 weeks of control chow diet or HSD, and after another 3–5 weeks of chow diet. To monitor hormone-induced feeding suppression, mice were fasted for 6 h and allowed to acclimate in individual feeding chambers for the final hour before intraperitoneal saline or hormone (CCK or PYY) injection and immediately subsequent chow presentation. The following hormones and doses were used: CCK Octapeptide 20 μg/kg (sulfated) (4033010, Bachem) and PYY 100 μg/ kg (126339–09-1, Tocris Bioscience). Food intake was monitored at 30 min after food presentation for experiments involving CCK and at 120 min after food presentation for experiments involving PYY. One to three trials of the same experiment for each mouse were averaged, and treated as a single replicate.
Food presentation
Control mice were exposed to chocolate and liquid sucrose once prior to fast re-feeding or photometry experiments where chocolate or sucrose were presented to minimize neophobia as a confound.
For fiber photometry experiments, mice were fasted overnight (16 h), acclimated to the behavioral chamber for at least 20 min, and then presented with chow or chocolate during fiber photometry recording. For peristimulus plots, time zero was defined as the moment the behavioral chamber was opened.
Optogenetic feeding behavior
Optogenetic experiments were performed in the same AgRP::ChR2 mice and littermate control mice that do not express ChR2 (ROSA26-loxStoplox-ChR2-eYFP) at baseline and after 3–5 weeks of HSD or NCD. Mice used in these experiments were group-housed and ranged from 2 to 12 months old. Mice were given a week to recover after implant surgery. During this time, they were habituated to handling and optogenetic patch cord tethering several times.
An LED source and programmable TTL pulse generator (D-OG-LED-B/B, Prizmatix) were used to generate a train of blue light (460 nm, 2 s ON/3 s OFF, 10 ms pulse width, 20 Hz, 10–20 mW).9,57 Fiber optic patch cables (500um POF N.A. 0.63 L = 75cm, Prizmatix) were connected to mouse implants (MFC_200/245–0.37_6.1mm_ZF1.25_FLT, Doric Lenses) via a zirconia mating sleeve (F210–3001, Doric Lenses).
All experiments involved 30 min of habituation without LED stimulation or food availability followed by 30 min of access to either chocolate or chow with or without light stimulation. Each light stimulation protocol was performed in both fed and fasted (overnight, 16 h) states in the same mice on different days, and with access to either chocolate or chow on separate days. For both chocolate and chow, a single, pre-weighed piece of food was placed in the behavior chamber at the end of habituation and weighed once again after the 30 min of food access.
Glucose tolerance testing
At baseline, after 3–5 weeks of control chow diet or HSD, and after another 3–5 weeks of chow diet, C57BL6/J mice were fasted for 6 h before glucose (G8270, Sigma-Aldrich) administration. Glucose was prepared freshly for each experiment as a solution in deionized water and dosed at 1.5 mg/g body weight for both intraperitoneal and intragastric glucose tolerance tests. For intraperitoneal glucose tolerance tests, glucose was delivered through an injection of 15% glucose (w/v). For intragastric glucose tolerance tests, glucose was administered intragastrically as a bolus of 20% glucose (w/v) using a sterile 1 mL Luer Lock syringe and an adaptor. Blood glucose concentrations were measured from tail blood using an automatic glucose monitor (FreeStyle Lite). Fasting baseline blood glucose was measured, and blood glucose concentrations were also recorded at 5, 15, 30, 60, and 120 min following glucose administration.
Plasma hormone studies
At baseline, after 3–5 weeks of control chow diet or HSD, and after another 3–5 weeks of chow diet, tail blood was collected from 6-h-fasted C57BL6/J mice in EDTA-coated tubes for plasma separation. Plasma leptin (90030, Crystal Chem) and insulin (90080, Crystal Chem) ELISAs were performed per the manufacturer’s instructions.
Plasma liver panel
After 4 weeks of control chow diet or HSD, ad libitum-fed C57BL6/J mice were euthanized before blood collection via cardiac puncture into EDTA-coated tubes for plasma separation. Using these plasma samples, a mammalian liver profile (500–0040-12, Abaxis) was conducted by the Northwestern University Microsurgery and Preclinical Research Core for the quantitative analysis of albumin (ALB), alanine aminotransferase (ALT), alkaline phosphatase (ALP), cholesterol (CHOL), and total bilirubin (TBIL).
Liver histology
After 4 weeks of control chow diet or HSD, ad libitum-fed C57BL6/J mice were euthanized, livers removed, and an approximately 100mg piece from the left lobe was fixed overnight in 4% paraformaldehyde (P6148, Sigma-Aldrich). The next day, the liver was placed in 70% ethanol and stored at room temperature until being processed for histology. The tissue was paraffin embedded, sectioned, hematoxylin- and eosin-stained, and then imaged for analysis. The extent of hepatic steatosis was quantified using the NAFLD scoring method.58
Immunohistochemistry
To confirm virus-induced GCaMP expression, mice were transcardially perfused with PBS and 4% paraformaldehyde. Brains were postfixed overnight in 4% paraformaldehyde and then placed in 30% sucrose for two or three days for cryoprotection. Tissues were frozen in OCT embedding compound (4585, Fisher HealthCare) at —30°C until sectioned. Free-floating sections (50 μm) were made using a cryostat. The sections were washed, blocked (10% normal donkey serum (017–000-121, Jackson ImmunoResearch) and 0.3% Triton X-100 (TX1568–1, EMD Millipore) in PBS) for 1 h at room temperature, and then incubated with a primary antibody (rabbit anti-GFP, Invitrogen, A11122, 1:500) overnight at 4°C. Samples were then washed and incubated with a secondary antibody (donkey anti-rabbit Alexa Fluor 488; Jackson ImmunoResearch, 711–545-152, 1:500) for 2 h at room temperature before being mounted and imaged on a Leica Thunder Imaging System.
RNA isolation
C57BL/6J mice were placed on NCD or HSD for four weeks before all animals were fasted overnight and duodenum, jejunum, ileum, and colon tissues were harvested. Tissues were placed in RNAlater (AM7021, Invitrogen) and stored overnight at 4°C. Tissues were then frozen at —80°C until RNA was isolated. To purify RNA samples, tissues were homogenized in 1 mL TriZol (15596026, Ambion) using the Mo Bio Powerlyzer and RNA was then isolated using the RNeasy Mini Kit (74104, Qiagen) according to the manufacturer’s instructions.
qRT-PCR
Reverse transcription of the RNA was accomplished using the iScript cDNA Synthesis Kit (1708891, Bio-Rad) according to the manufacturer’s instructions. The cDNA was diluted and quantitative PCR was performed using the iTaq Universal SYBR Green Supermix (1725120, Bio-Rad) and a CFX Opus 384 Real-Time PCR system. Expression of Cck, Gcg, Gip, and Pyy was determined using the relative standard curve method and normalized to the housekeeping gene Rplp0.59 Primer sequences are compiled in Table S2.
QUANTIFICATION AND STATISTICAL ANALYSIS
Photometry analysis
Custom Python scripts (https://github.com/nikhayes/fibphoflow; https://doi.org/10.5281/zenodo.10403577) were used to analyze photometry data, and statistical analyses and data visualizations were generated with Prism and Python. Photometry recordings included AgRP neuron GCaMP activity traces (emissions from 470nm stimulation) and corresponding isosbestic traces (emissions from 405nm stimulation), which were smoothed using Scipy’s 1D-uniform filter and downsampled to 1 Hz. Normalization of responses to nutritional stimuli relative to baseline activity was performed on each of these signals via the formula: ΔF/F = (Ft – F0)/F0, where Ft represents fluorescence at time (t), and F0 represents the average fluorescence during the 5-min baseline period preceding time zero (stimulus start time). To determine statistical differences, the average ΔF/F was computed within the time frame indicated in the legend for Figures 2, 4, 5, and 6, and the area under the curve was computed over a 15-min period for Figure 7.
Behavior data analysis
To determine chow, chocolate, and liquid sucrose consumption for fast re-feeding, hormone-induced feeding, and optogenetics experiments, food items were weighed manually at the indicated time points.
Statistical analysis
For photometry traces depicted in Figures 2, 4, 5, 6, and 7, ΔF/F (%) refers the mean ΔFt/F0*100. Bar graphs quantifying AgRP neural responses to chow, chocolate, and intragastric nutrients in Figures 2, 4, 5, and 6 represent the average ΔF/F (%) over a 1-min period following food presentation (Figure 2) or at the end of nutrient infusion (Figures 2, 4, 5, and 6). Bar graphs quantifying AgRP neural responses to intraperitoneally administered peptide hormones represent the area under the curve over a 15-min period following hormone administration (Figure 7). The time frame represented for each study is specified in the figure legends.7,9
The effects of HSD or NCD and eventual return to a balanced diet on absolute body weight were analyzed via one-way, repeated-measures ANOVA (Figures 1 and S1). Total daily caloric intake, daily caloric intake from chow, and body fat mass percentage in HSD vs. NCD mice were assessed via unpaired t tests (Figures 1 and S1). The effects of HSD or NCD and subsequent return to chow diet on fasting serum insulin, fasting serum leptin, and fasting blood glucose were analyzed using one-way, repeated-measures ANOVA (Figure S2). The effects of HSD versus NCD on the change in fasting serum leptin levels (ng/mL) from baseline to 4 weeks were analyzed using an unpaired t test (Figure S2). The effects of NCD or HSD on IG or IP glucose tolerance were assessed via two-way, repeated-measures ANOVA (Figure S2). A Pearson’s correlation test was used to determine the relationship between change in body weight (g) from baseline to 4 weeks and (1) baseline body weight, (2) change in fasting serum leptin, and (3) change in fasting serum insulin (Figure S2). Liver function and steatosis data were analyzed via unpaired t tests (Figure S3). The effects of HSD or NCD and subsequent return to chow diet on fast re-feeding of chow, chocolate, and liquid sucrose were analyzed using one-way, repeated-measures ANOVA (Figures 2 and S4). The extent of feeding suppression in response to different types of food after NCD or HSD mice was compared using one-way ANOVA (Figure S4). The effects of HSD or NCD and subsequent return to chow diet on AgRP neuron calcium dynamics in response to chow, chocolate, intragastrically administered nutrients, and intraperitoneally administered hormones were analyzed using one-way, repeated-measures ANOVA (Figures 2, 4, 5, 6, and 7). Baseline AgRP neural responses to water, glucose, sucrose, and fructose amongst all mice were compared via a one-way ANOVA (Figure 6). The baseline averaged AgRP neural response to glucose and fructose was compared to that of sucrose amongst all mice via a paired t test (Figure 6). The effects of AgRP neuron optogenetic stimulation on feeding before and after HSD or NCD were compared using two-way, repeated-measures ANOVA (Figures 3 and S6). The effects of HSD or NCD and subsequent return to chow diet on hormone-induced fast re-feeding of chow were analyzed using one-way, repeated-measures ANOVA (Figure S7). Intestinal gene expression in HSD vs. NCD mice was assessed via unpaired t tests, where the significance level was adjusted using the Bonferroni correction (Figure S7).
Sample sizes are specified in figure legends. Prism was used for all statistical analysis. The Holm-Šídák multiple comparisons test was used in conjunction with ANOVA where appropriate. Significance was defined as p < 0.05 for all data with the exception of the qRT-PCR results (Figure S7), where significance was defined as p < 0.05/8 = 0.00625 (Bonferroni correction). Significance is specified on figures and in figure legends. Full statistical results are presented in Table S1. When multiple technical replicates of a given experiment were conducted, these trials were averaged and handled as one biological replicate for data analysis and visualization.
Supplementary Material
Highlights.
High-sucrose diet selectively desensitizes AgRP neurons to intragastric glucose
High-sucrose diet dampens AgRP neural and behavioral responses to regular chow
AgRP neuron-driven chow consumption is diminished after sucrose overfeeding
Neural and behavioral responses to chocolate are preserved on a high-sucrose diet
ACKNOWLEDGMENTS
We recognize the Northwestern University Mouse Histology and Phenotyping Laboratory, which is supported by NCI P30-CA060553 awarded to the Robert H. Lurie Comprehensive Cancer Center, for processing mouse liver specimens for histology. We acknowledge Ms. Jiao-Jing Wang from the Northwestern University Microsurgery and Preclinical Research Core for performing a liver function panel using mouse plasma specimens. BioRender was used to prepare the graphical abstract. We thank Dr. Joseph Bass for providing feedback on the manuscript. L.R.B. acknowledges support from the American Diabetes Association Pathway to Stop Diabetes Award (12-22-ACE-31). This work was also supported by NIH grants P30-DK020595, K08-DK118188, and R01-DK128477 (L.R.B.) and T32-HL134633 (C.M.L.).
Footnotes
SUPPLEMENTAL INFORMATION
Supplemental information can be found online at https://doi.org/10.1016/j.celrep.2024.113675.
DECLARATION OF INTERESTS
The authors declare no competing interests.
REFERENCES
- 1.Luquet S, Perez FA, Hnasko TS, and Palmiter RD (2005). NPY/ AgRP neurons are essential for feeding in adult mice but can be ablated in neonates. Science 310, 683–685. [DOI] [PubMed] [Google Scholar]
- 2.Könner AC, Janoschek R, Plum L, Jordan SD, Rother E, Ma X, Xu C, Enriori P, Hampel B, Barsh GS, et al. (2007). Insulin action in AgRP-expressing neurons is required for suppression of hepatic glucose production. Cell Metabol. 5, 438–449. [DOI] [PubMed] [Google Scholar]
- 3.Aponte Y, Atasoy D, and Sternson SM (2011). AGRP neurons are sufficient to orchestrate feeding behavior rapidly and without training. Nat. Neurosci 14, 351–355. [DOI] [PMC free article] [PubMed] [Google Scholar]
- 4.Krashes MJ, Koda S, Ye C, Rogan SC, Adams AC, Cusher DS, Maratos-Flier E, Roth BL, and Lowell BB (2011). Rapid, reversible activation of AgRP neurons drives feeding behavior in mice. J. Clin. Invest 121, 1424–1428. [DOI] [PMC free article] [PubMed] [Google Scholar]
- 5.Chen Y, Lin YC, Kuo TW, and Knight ZA (2015). Sensory detection of food rapidly modulates arcuate feeding circuits. Cell 160, 829–841. [DOI] [PMC free article] [PubMed] [Google Scholar]
- 6.Steculorum SM, Ruud J, Karakasilioti I, Backes H, Engströ m Ruud L, Timper K, Hess ME, Tsaousidou E, Mauer J, Vogt MC, et al. (2016). AgRP Neurons Control Systemic Insulin Sensitivity via Myostatin Expression in Brown Adipose Tissue. Cell 165, 125–138. [DOI] [PMC free article] [PubMed] [Google Scholar]
- 7.Beutler LR, Chen Y, Ahn JS, Lin YC, Essner RA, and Knight ZA (2017). Dynamics of Gut-Brain Communication Underlying Hunger. Neuron 96, 461–475.e5. [DOI] [PMC free article] [PubMed] [Google Scholar]
- 8.Su Z, Alhadeff AL, and Betley JN (2017). Nutritive, Post-ingestive Signals Are the Primary Regulators of AgRP Neuron Activity. Cell Rep. 21, 2724–2736. [DOI] [PMC free article] [PubMed] [Google Scholar]
- 9.Beutler LR, Corpuz TV, Ahn JS, Kosar S, Song W, Chen Y, and Knight ZA (2020). Obesity causes selective and long-lasting desensitization of AgRP neurons to dietary fat. Elife 9, e55909. [DOI] [PMC free article] [PubMed] [Google Scholar]
- 10.Mazzone CM, Liang-Guallpa J, Li C, Wolcott NS, Boone MH, Southern M, Kobzar NP, Salgado I.d.A., Reddy DM, Sun F, et al. (2020). High-fat food biases hypothalamic and mesolimbic expression of consummatory drives. Nat. Neurosci 23, 1253–1266. [DOI] [PMC free article] [PubMed] [Google Scholar]
- 11.Baver SB, Hope K, Guyot S, Bjørbaek C, Kaczorowski C, and O’Connell KMS (2014). Leptin modulates the intrinsic excitability of AgRP/NPY neurons in the arcuate nucleus of the hypothalamus. J. Neurosci 34, 5486–5496. [DOI] [PMC free article] [PubMed] [Google Scholar]
- 12.Wei W, Pham K, Gammons JW, Sutherland D, Liu Y, Smith A, Kaczorowski CC, and O’Connell KMS (2015). Diet composition, not calorie intake, rapidly alters intrinsic excitability of hypothalamic AgRP/NPY neurons in mice. Sci. Rep 5, 16810. [DOI] [PMC free article] [PubMed] [Google Scholar]
- 13.Hahn TM, Breininger JF, Baskin DG, and Schwartz MW (1998). Co-expression of Agrp and NPY in fasting-activated hypothalamic neurons. Nat. Neurosci 1, 271–272. [DOI] [PubMed] [Google Scholar]
- 14.van den Top M, Lee K, Whyment AD, Blanks AM, and Spanswick D. (2004). Orexigen-sensitive NPY/AgRP pacemaker neurons in the hypothalamic arcuate nucleus. Nat. Neurosci 7, 493–494. [DOI] [PubMed] [Google Scholar]
- 15.Takahashi KA, and Cone RD (2005). Fasting induces a large, leptin-dependent increase in the intrinsic action potential frequency of orexigenic arcuate nucleus neuropeptide Y/Agouti-related protein neurons. Endocrinology 146, 1043–1047. [DOI] [PubMed] [Google Scholar]
- 16.Mandelblat-Cerf Y, Ramesh RN, Burgess CR, Patella P, Yang Z, Lowell BB, and Andermann ML (2015). Arcuate hypothalamic AgRP and putative POMC neurons show opposite changes in spiking across multiple timescales. Elife 4, e07122. [DOI] [PMC free article] [PubMed] [Google Scholar]
- 17.Livneh Y, Ramesh RN, Burgess CR, Levandowski KM, Madara JC, Fenselau H, Goldey GJ, Diaz VE, Jikomes N, Resch JM, et al. (2017). Homeostatic circuits selectively gate food cue responses in insular cortex. Nature 546, 611–616. [DOI] [PMC free article] [PubMed] [Google Scholar]
- 18.Essner RA, Smith AG, Jamnik AA, Ryba AR, Trutner ZD, and Carter ME (2017). AgRP Neurons Can Increase Food Intake during Conditions of Appetite Suppression and Inhibit Anorexigenic Parabrachial Neurons. J. Neurosci 37, 8678–8687. [DOI] [PMC free article] [PubMed] [Google Scholar]
- 19.Gropp E, Shanabrough M, Borok E, Xu AW, Janoschek R, Buch T, Plum L, Balthasar N, Hampel B, Waisman A, et al. (2005). Agouti-related peptide-expressing neurons are mandatory for feeding. Nat. Neurosci 8, 1289–1291. [DOI] [PubMed] [Google Scholar]
- 20.Cai J, Chen J, Ortiz-Guzman J, Huang J, Arenkiel BR, Wang Y, Zhang Y, Shi Y, Tong Q, and Zhan C. (2023). AgRP neurons are not indispensable for body weight maintenance in adult mice. Cell Rep. 42, 112789. [DOI] [PMC free article] [PubMed] [Google Scholar]
- 21.Betley JN, Xu S, Cao ZFH, Gong R, Magnus CJ, Yu Y, and Sternson SM (2015). Neurons for hunger and thirst transmit a negative-valence teaching signal. Nature 521, 180–185. [DOI] [PMC free article] [PubMed] [Google Scholar]
- 22.Bai L, Mesgarzadeh S, Ramesh KS, Huey EL, Liu Y, Gray LA, Aitken TJ, Chen Y, Beutler LR, Ahn JS, et al. (2019). Genetic Identification of Vagal Sensory Neurons That Control Feeding. Cell 179, 1129–1143.e23. [DOI] [PMC free article] [PubMed] [Google Scholar]
- 23.Rossi MA, Basiri ML, McHenry JA, Kosyk O, Otis JM, van den Munkhof HE, Bryois J, Hübel C, Breen G, Guo W, et al. (2019). Obesity remodels activity and transcriptional state of a lateral hypothalamic brake on feeding. Science 364, 1271–1274. [DOI] [PMC free article] [PubMed] [Google Scholar]
- 24.Lang P, Hasselwander S, Li H, and Xia N. (2019). Effects of different diets used in diet-induced obesity models on insulin resistance and vascular dysfunction in C57BL/6 mice. Sci. Rep 9, 19556. [DOI] [PMC free article] [PubMed] [Google Scholar]
- 25.Sternson SM, and Eiselt AK (2017). Three Pillars for the Neural Control of Appetite. Annu. Rev. Physiol 79, 401–423. [DOI] [PubMed] [Google Scholar]
- 26.Goldstein N, McKnight AD, Carty JRE, Arnold M, Betley JN, and Alhadeff AL (2021). Hypothalamic detection of macronutrients via multiple gut-brain pathways. Cell Metabol. 33, 676–687.e5. [DOI] [PMC free article] [PubMed] [Google Scholar]
- 27.Korgan AC, Oliveira-Abreu K, Wei W, Martin SLA, Bridges ZJD, Leal-Cardoso JH, Kaczorowski CC, and O’Connell KMS (2023). High sucrose consumption decouples intrinsic and synaptic excitability of AgRP neurons without altering body weight. Int. J. Obes 47, 224–235. [DOI] [PMC free article] [PubMed] [Google Scholar]
- 28.Mitchell CS, Goodman EK, Tedesco CR, Nguyen K, Zhang L, Herzog H, and Begg DP (2022). The Effect of Dietary Fat and Sucrose on Cognitive Functioning in Mice Lacking Insulin Signaling in Neuropeptide Y Neurons. Front. Physiol 13, 841935. [DOI] [PMC free article] [PubMed] [Google Scholar]
- 29.Chen GC, Huang CY, Chang MY, Chen CH, Chen SW, Huang CJ, and Chao PM (2011). Two unhealthy dietary habits featuring a high fat content and a sucrose-containing beverage intake, alone or in combination, on inducing metabolic syndrome in Wistar rats and C57BL/6J mice. Metabolism 60, 155–164. [DOI] [PubMed] [Google Scholar]
- 30.Sakamoto E, Seino Y, Fukami A, Mizutani N, Tsunekawa S, Ishikawa K, Ogata H, Uenishi E, Kamiya H, Hamada Y, et al. (2012). Ingestion of a moderate high-sucrose diet results in glucose intolerance with reduced liver glucokinase activity and impaired glucagon-like peptide-1 secretion. J. Diabetes Investig 3, 432–440. [DOI] [PMC free article] [PubMed] [Google Scholar]
- 31.Ahn BH, Kim M, and Kim SY (2022). Brain circuits for promoting homeostatic and non-homeostatic appetites. Exp. Mol. Med 54, 349–357. [DOI] [PMC free article] [PubMed] [Google Scholar]
- 32.Leibel RL, Rosenbaum M, and Hirsch J. (1995). Changes in energy expenditure resulting from altered body weight. N. Engl. J. Med 332, 621–628. [DOI] [PubMed] [Google Scholar]
- 33.Fothergill E, Guo J, Howard L, Kerns JC, Knuth ND, Brychta R, Chen KY, Skarulis MC, Walter M, Walter PJ, and Hall KD (2016). Persistent metabolic adaptation 6 years after “The Biggest Loser” competition. Obesity 24, 1612–1619. [DOI] [PMC free article] [PubMed] [Google Scholar]
- 34.Bacharach SZ, Tordoff MG, and Alhadeff AL (2023). Glucose Sensing in the Hepatic Portal Vein and Its Role in Food Intake and Reward. Cell. Mol. Gastroenterol. Hepatol. 16, 189–199. [DOI] [PMC free article] [PubMed] [Google Scholar]
- 35.Myers MG Jr., Leibel RL, Seeley RJ, and Schwartz MW (2010). Obesity and leptin resistance: distinguishing cause from effect. Trends Endocrinol. Metabol 21, 643–651. [DOI] [PMC free article] [PubMed] [Google Scholar]
- 36.Hwang E, Scarlett JM, Baquero AF, Bennett CM, Dong Y, Chau D, Brown JM, Mercer AJ, Meek TH, Grove KL, et al. (2022). Sustained inhibition of NPY/AgRP neuronal activity by FGF1. JCI Insight 7, e160891. [DOI] [PMC free article] [PubMed] [Google Scholar]
- 37.Briggs DI, Lockie SH, Wu Q, Lemus MB, Stark R, and Andrews ZB (2013). Calorie-restricted weight loss reverses high-fat diet-induced ghrelin resistance, which contributes to rebound weight gain in a ghrelin-dependent manner. Endocrinology 154, 709–717. [DOI] [PubMed] [Google Scholar]
- 38.Schmitz J, Evers N, Awazawa M, Nicholls HT, Brönneke HS, Dietrich A, Mauer J, Blüher M, and Brüning JC (2016). Obesogenic memory can confer long-term increases in adipose tissue but not liver inflammation and insulin resistance after weight loss. Mol. Metabol 5, 328–339. [DOI] [PMC free article] [PubMed] [Google Scholar]
- 39.McDougle M, de Araujo A, Vergara M, Yang M, Singh A, Braga I, Urs N, Warren B, and de Lartigue G. (2022). Labeled lines for fat and sugar reward combine to promote overeating. Preprint at bioRxiv. 10.1101/2022.08.09.503218. [DOI]
- 40.Se T, Ag D, Albus K, Kuzmanovic B, Rigoux L, Iglesias S, Hanßen R, Schlamann M, Oa C, Brüning JC, et al. (2023). Habitual daily intake of a sweet and fatty snack modulates reward processing in humans. Cell Metabol. 35, 571–584.e576. [DOI] [PubMed] [Google Scholar]
- 41.DiFeliceantonio AG, Coppin G, Rigoux L, Edwin Thanarajah S, Dagher A, Tittgemeyer M, and Small DM (2018). Supra-Additive Effects of Combining Fat and Carbohydrate on Food Reward. Cell Metabol. 28, 33–44.e3. [DOI] [PubMed] [Google Scholar]
- 42.Briggs DI, Lemus MB, Kua E, and Andrews ZB (2011). Diet-induced obesity attenuates fasting-induced hyperphagia. J. Neuroendocrinol 23, 620–626. [DOI] [PubMed] [Google Scholar]
- 43.Garfield AS, Shah BP, Burgess CR, Li MM, Li C, Steger JS, Madara JC, Campbell JN, Kroeger D, Scammell TE, et al. (2016). Dynamic GABAergic afferent modulation of AgRP neurons. Nat. Neurosci 19, 1628–1635. [DOI] [PMC free article] [PubMed] [Google Scholar]
- 44.Smith MA, Choudhury AI, Glegola JA, Viskaitis P, Irvine EE, de Campos Silva PCC, Khadayate S, Zeilhofer HU, and Withers DJ (2020). Extrahypothalamic GABAergic nociceptin-expressing neurons regulate AgRP neuron activity to control feeding behavior. J. Clin. Invest 130, 126–142. [DOI] [PMC free article] [PubMed] [Google Scholar]
- 45.Berrios J, Li C, Madara JC, Garfield AS, Steger JS, Krashes MJ, and Lowell BB (2021). Food cue regulation of AGRP hunger neurons guides learning. Nature 595, 695–700. [DOI] [PMC free article] [PubMed] [Google Scholar]
- 46.Grzelka K, Wilhelms H, Dodt S, Dreisow ML, Madara JC, Walker SJ, Wu C, Wang D, Lowell BB, and Fenselau H. (2023). A synaptic amplifier of hunger for regaining body weight in the hypothalamus. Cell Metabol. 35, 770–785.e5. [DOI] [PMC free article] [PubMed] [Google Scholar]
- 47.Briggs DI, Enriori PJ, Lemus MB, Cowley MA, and Andrews ZB (2010). Diet-induced obesity causes ghrelin resistance in arcuate NPY/ AgRP neurons. Endocrinology 151, 4745–4755. [DOI] [PubMed] [Google Scholar]
- 48.Zigman JM, Bouret SG, and Andrews ZB (2016). Obesity Impairs the Action of the Neuroendocrine Ghrelin System. Trends Endocrinol. Metabol 27, 54–63. [DOI] [PMC free article] [PubMed] [Google Scholar]
- 49.Qi Y, Lee NJ, Ip CK, Enriquez R, Tasan R, Zhang L, and Herzog H. (2023). Agrp-negative arcuate NPY neurons drive feeding under positive energy balance via altering leptin responsiveness in POMC neurons. Cell Metabol. 35, 979–995.e7. [DOI] [PubMed] [Google Scholar]
- 50.González-Padilla E, A Dias J, Ramne S, Olsson K, Nälsén C, and Sonestedt E. (2020). Association between added sugar intake and micronutrient dilution: a cross-sectional study in two adult Swedish populations. Nutr. Metab 17, 15. [DOI] [PMC free article] [PubMed] [Google Scholar]
- 51.Grech A, Sui Z, Rangan A, Simpson SJ, Coogan SCP, and Raubenheimer D. (2022). Macronutrient (im)balance drives energy intake in an obesogenic food environment: An ecological analysis. Obesity 30, 2156–2166. [DOI] [PMC free article] [PubMed] [Google Scholar]
- 52.DiNicolantonio JJ, and Berger A. (2016). Added sugars drive nutrient and energy deficit in obesity: a new paradigm. Open Heart 3, e000469. [DOI] [PMC free article] [PubMed] [Google Scholar]
- 53.Chen TW, Wardill TJ, Sun Y, Pulver SR, Renninger SL, Baohan A, Schreiter ER, Kerr RA, Orger MB, Jayaraman V, et al. (2013). Ultrasensitive fluorescent proteins for imaging neuronal activity. Nature 499, 295–300. [DOI] [PMC free article] [PubMed] [Google Scholar]
- 54.Tong Q, Ye CP, Jones JE, Elmquist JK, and Lowell BB (2008). Synaptic release of GABA by AgRP neurons is required for normal regulation of energy balance. Nat. Neurosci 11, 998–1000. [DOI] [PMC free article] [PubMed] [Google Scholar]
- 55.Madisen L, Mao T, Koch H, Zhuo J.m., Berenyi A, Fujisawa S, Hsu YWA, Garcia AJ, Gu X, Zanella S, et al. (2012). A toolbox of Cre-dependent optogenetic transgenic mice for light-induced activation and silencing. Nat. Neurosci 15, 793–802. [DOI] [PMC free article] [PubMed] [Google Scholar]
- 56.Ueno A, Lazaro R, Wang PY, Higashiyama R, Machida K, and Tsukamoto H. (2012). Mouse intragastric infusion (iG) model. Nat. Protoc 7, 771–781. [DOI] [PMC free article] [PubMed] [Google Scholar]
- 57.Chen Y, Lin YC, Zimmerman CA, Essner RA, and Knight ZA (2016). Hunger neurons drive feeding through a sustained, positive reinforcement signal. Elife 5, e18640. [DOI] [PMC free article] [PubMed] [Google Scholar]
- 58.Liang W, Menke AL, Driessen A, Koek GH, Lindeman JH, Stoop R, Havekes LM, Kleemann R, and van den Hoek AM (2014). Establishment of a general NAFLD scoring system for rodent models and comparison to human liver pathology. PLoS One 9, e115922. [DOI] [PMC free article] [PubMed] [Google Scholar]
- 59.Ramachandran K, Senagolage MD, Sommars MA, Futtner CR, Omura Y, Allred AL, and Barish GD (2019). Dynamic enhancers control skeletal muscle identity and reprogramming. PLoS Biol. 17, e3000467. [DOI] [PMC free article] [PubMed] [Google Scholar]
Associated Data
This section collects any data citations, data availability statements, or supplementary materials included in this article.
Supplementary Materials
Data Availability Statement
The data reported in the paper will be shared by the lead contact upon request.
All original code has been deposited at Github and is publicly available as of the date of publication. The link is listed in the key resources table.
Any additional information required to reanalyze the data reported in this paper is available from the lead contact upon request.
KEY RESOURCES TABLE
| REAGENT or RESOURCE | SOURCE | IDENTIFIER |
|---|---|---|
| Antibodies | ||
|
| ||
| Rabbit polyclonal anti-GFP | Invitrogen | REF: A11122; RRID: AB_221569 |
| Donkey polyclonal anti-rabbit | Jackson ImmunoResearch | Code: 711-545-152; RRID: AB_2313584 |
|
| ||
| Bacterial and virus strains | ||
|
| ||
| pAAV.CAG.Flex.GCaMP6s.WPRE.SV40 | (Chen et al.)53 | Addgene; Cat#: 100842-AAV9 |
|
| ||
| Chemicals, peptides, and recombinant proteins | ||
|
| ||
| Acarbose, 95% | Acros Organics | Cat#: AC459080010 |
| Cholecystokinin Octapeptide (sulfated) | Bachem | PN#: 4033010 |
| Collagen Peptides (Unflavored) | Sports Research | N/A |
| D-(−)-Fructose | Tokyo Chemical Industry | PN#: F0060 |
| D-(+)-Glucose | Sigma-Aldrich | Cat#: G8270 |
| Hershey’s Kisses Milk Chocolate Candy | The Hershey Company | N/A |
| Intralipid 20% | Fresnius Kabi | NDC: 0338-0519-09 |
| Peptide YY (3-36) | Tocris Bioscience | Cat#: 1618 |
| Sotagliflozin (LX4211) | Selleck Chemical | Cat#: S8103 |
| Sucrose, 99% | Thermo Fisher Scientific | Cat#: A15583.0C |
| Teklad LM-485 Mouse/Rat Sterilizable Diet | Envigo | Product code 7012 |
| Normal Donkey Serum | Jackson ImmunoResearch | Code: 017-000-121 |
| Triton X-100 | EMD Millipore | Cat#: TX1568-1 |
|
| ||
| Critical commercial assays | ||
|
| ||
| iScript cDNA Synthesis Kit | Bio-Rad | Cat#: 1708891 |
| iTaq Universal SYBR Green Supermix | Bio-Rad | Cat#: 1725120 |
| Mouse Leptin ELISA Kit | Crystal Chem Immunoassays | Cat#: 90030 |
| Mouse Insulin ELISA Kit | Crystal Chem Immunoassays | Cat#: 90080 |
| RNeasy Mini Kit | Qiagen | Cat#: 74104 |
| VetScan Mammalian Liver Profile | Abaxis | Cat#: 500-0040-12 |
|
| ||
| Experimental models: Organisms/strains | ||
|
| ||
| C57BL6/J | The Jackson Laboratory | Strain #: 000664 |
| Agrp tm1(cre)Lowl /J | The Jackson Laboratory | Strain #: 012899 |
| B6; 129S-Gt(ROSA) 26Sortm32(CAG-COP4’H124R/EYFP)Hze/j | The Jackson Laboratory | Strain #: 012569 |
|
| ||
| Oligonucleotides | ||
|
| ||
| Primers for qPCR, see Table S2 | This paper | N/A |
|
| ||
| Software and algorithms | ||
|
| ||
| Fiber photometry analysis scripts | This paper | https://doi.org/10.5281/zenodo.10403577 |
|
| ||
| Other | ||
|
| ||
| Fiber photometry implant | Doric Lenses | MFC_400/430-0.48_6.3mm_MF2.5_FLT |
| Bronze mating sleeve | Doric Lenses | SLEEVE_BR_2.5 |
| Syringe Pump | Harvard Apparatus | Cat#: 70-2000 |
| Polyurethane tubing for nutrient infusions | Instech Laboratories | VAHBPU-T25 |
| Adaptors for nutrient infusions | Instech Laboratories | PNP3MC/25; LS25 |
| Intragastric catheter | Instech Laboratories | C30PU-MGA1909 |
| Felt button | Instech Laboratories | VABM1B/22 |
| Magnetic cap | Instech Laboratories | VABM1C |
| Photometry processors | Tucker-Davis Technologies | RZ5P; RZ10X |
| LEDs | Thorlabs | M405FP1; M470F3 |
| LED Driver | Thorlabs | DC4100 |
| Photometry patch cords | Doric Lenses | MFP_400/430/1100-0.57_2m_FCM-MF2.5_LAF |
| Optogenetics patch cords | Prizmatix | 500um POF N.A. 0.63 L = 75cm |
| LED source + programmable TTL pulse generator for optogenetics | Prizmatix | PN#: D-OG-LED-B/B |
| Optogenetics implant | Doric Lenses | MFC_200/245_0.37_6.1mm_ZF1.25_FLT |
| Zirconia mating sleeve | Doric Lenses | F210-3001 |