

Abstract
Chronic kidney disease (CKD) and acute kidney injury (AKI) are heterogeneous syndromes defined clinically by serial measures of kidney function. Each condition possesses strong histopathologic associations including glomerular obsolescence or acute tubular necrosis, respectively. Despite such characterization, there remains wide variation in patient outcomes and treatment responses. Precision medicine efforts, as exemplified by the Kidney Precision Medicine Project (KPMP), have begun to establish evolving, spatially-anchored, cellular and molecular atlases of the cell types, states and niches of the kidney in health and disease. The KPMP atlas provides molecular context for CKD and AKI disease drivers, and will help define subtypes of disease that are not readily apparent from canonical functional or histopathologic characterization, but instead appreciable through advanced clinical phenotyping, pathomic, transcriptomic, proteomic, epigenomic, and metabolomic interrogation of kidney biopsy samples. This perspective outlines the structure of the KPMP, its approach to the integration of these diverse datasets, and its major outputs relevant to future patient care.
Introduction
Kidney diseases are diverse, common, and result in considerable morbidity and premature mortality1, 2. The integration of distinctive clinical, genetic and molecular characteristics (precision medicine read-outs) could have a profound impact on the delivery of clinical care3–6, and potentially improve population health outcomes.
New technologies have enabled efficient extraction, integration and interpretation of large datasets7. These advances provide the tools to resolve disease complexity, define underlying pathways, and establish subtypes based on molecular, clinical and pathology maps. Molecular reclassification may prove relevant for acute kidney injury (AKI) and chronic kidney disease (CKD), wherein limited progress has been made in defining pathophysiology and in recognizing distinct trajectories and targetable pathways of disease subtypes8.
In this perspective, we discuss how a precision medicine approach could usher in new insights into kidney disease initiation and progression, thereby redefining conditions based on deep clinical and molecular phenotyping. These advances could shift conventional classification of AKI and CKD toward a map of patients along a disease continuum. Importantly, such precise molecular mapping harbors an unprecedented potential for delivering tailored therapies that target the correct disease in the appropriate patient within the context of their social environment5, 6.
Precision medicine approach for patients with kidney disease
Several ongoing efforts to implement precision medicine in kidney disease (e.g. Neptune9, CureGN10, Trident11) have overlapping strategies, but the largest is the NIDDK-funded Kidney Precision Medicine Project (KPMP)5. To achieve the vision of providing the right intervention for the right patient at the right time, the KPMP was formed as a multi-year collaboration of leading research institutions in the US to study kidney diseases5. At the center of this endeavor are patient participants6 with AKI and CKD, who undergo kidney biopsies in an ethical and altruistic manner. These biopsies are sometimes performed purely for research, at timepoints in the disease process without a clinical indication. However, these, often early, timepoints are crucial to understanding the cellular and molecular events governing pathogenesis and clinical course.
Through partnering with patients and other stakeholders, the KPMP seeks to resolve the complexity of the kidney at cellular and molecular levels7 and improve treatments for AKI and CKD. To achieve this goal, KPMP (Figure 1) provides high quality multi-modal open access data with benchmark quality metrics by: 1) Creating a Kidney Tissue Atlas which catalogues every cell of the kidney in health and disease; 2) Defining disease subgroups based on deep clinical, molecular and histopathological phenotyping; 3) Becoming a resource for patients with kidney disease, clinicians and researchers; 4) Building synergies with other, similar, efforts. In the following sections, the strategies used by KPMP for deep clinical phenotyping, advanced histopathologic assessment, cutting-edge tissue interrogation and integration of this multi-modal data are discussed.
Figure 1: Overview of the goals of precision medicine efforts.
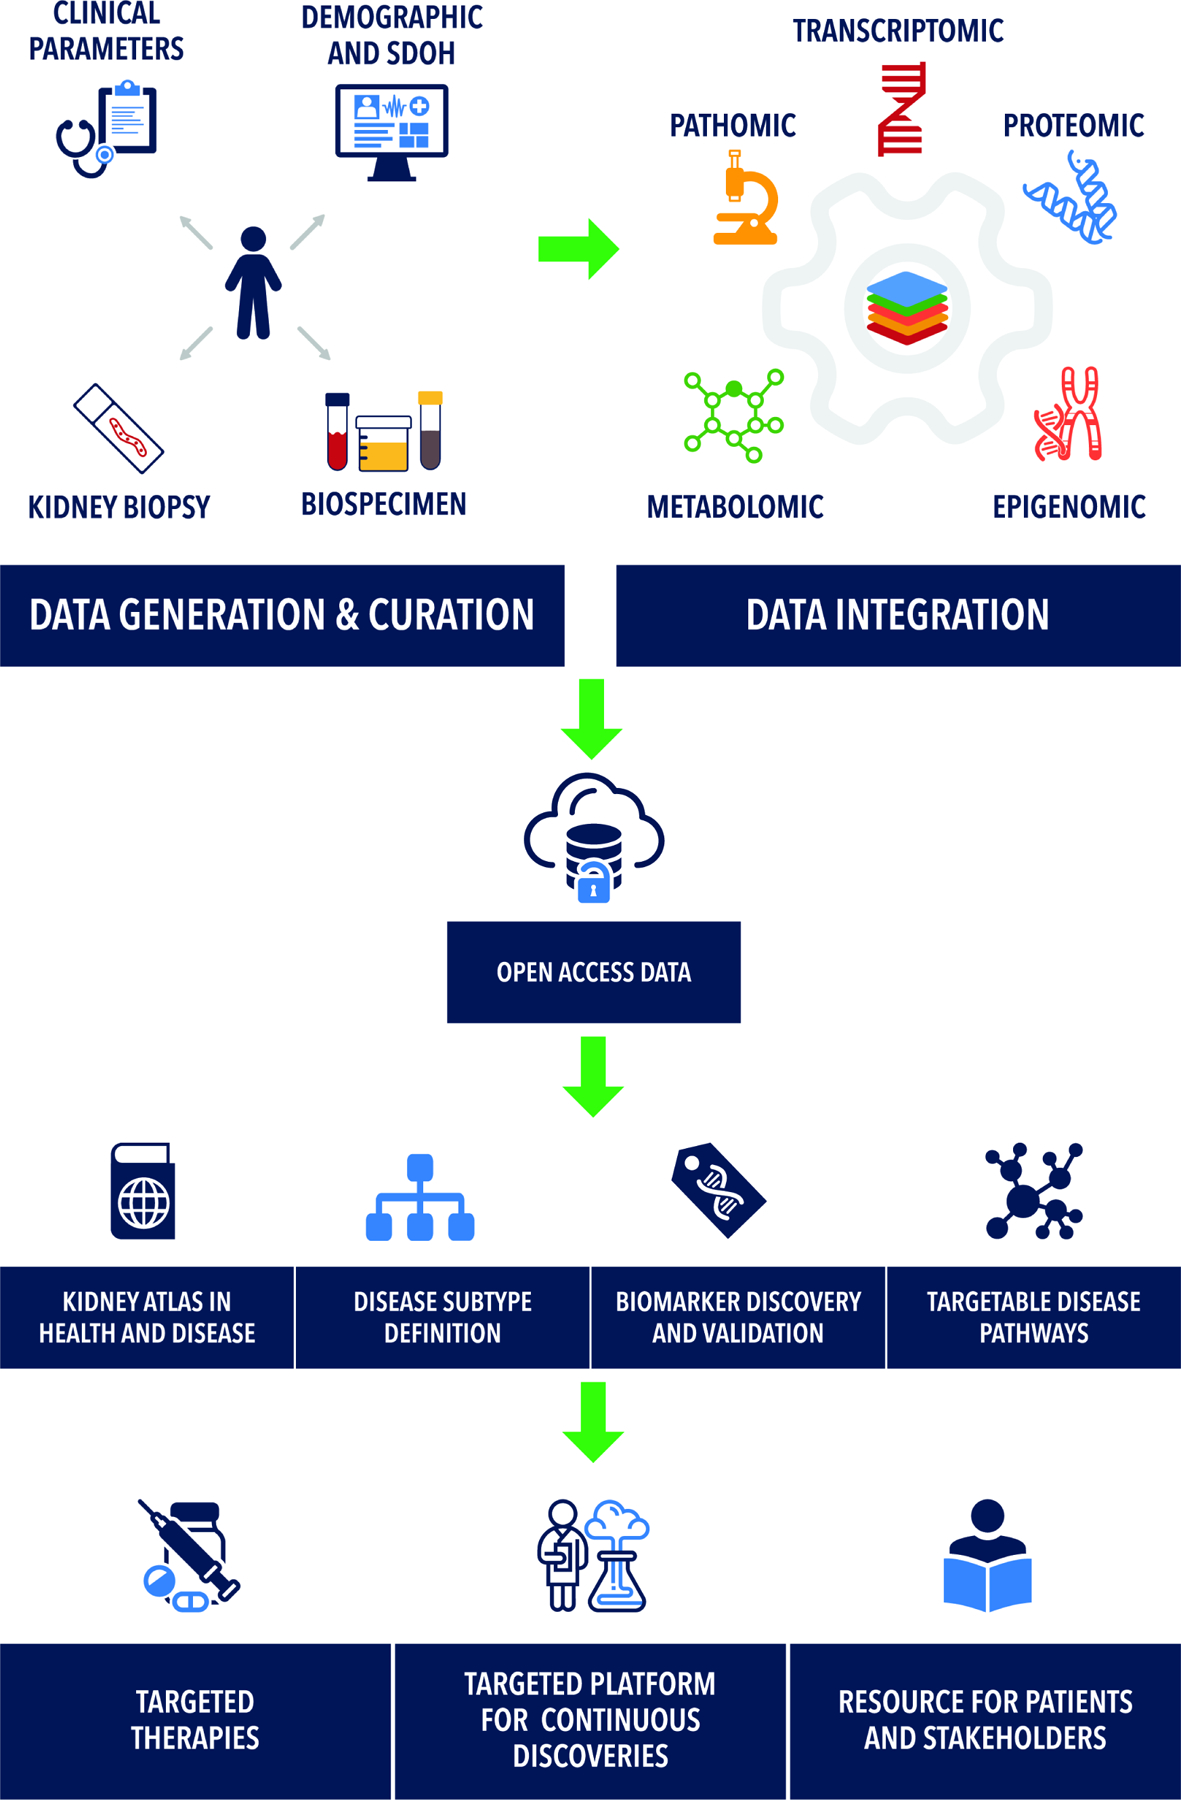
Precision medicine efforts such as the Kidney Precision Medicine Project (KPMP) seek to unite detailed demographic, social determinants of health (SDOH), clinical phenotyping, with next generation unbiased pathologic phenotyping (pathomics), and deep molecular datasets. Such integration has multiple benefits including refining the definition of disease subtypes based on new molecular information, developing biomarkers, and target selection for drug development.
KPMP Study Design
The KPMP study design has been described previously5, 7. Key elements are reviewed here. The consortium structure includes a central hub, recruitment sites, tissue interrogation sites, and a Kidney Tissue Atlas Coordinating Center. Each site maintains their own patient partners who form a community engagement working group. This group advises the KPMP on issues ranging from consent to return of results to recruitment.
The KPMP is a multicenter prospective cohort study recruiting patients with AKI or CKD. Participants with CKD must have an eGFR ≥30 mL/min/1.73m2 to avoid highly fibrotic tissues. Participants with AKI must have minimal evidence of underlying CKD and an elevated serum creatinine that is sustained or accompanied by evidence of parenchymal injury (e.g. muddy brown casts or elevated urinary biomarkers). The consortium hopes to attain a sample size of up to 1000–1200 participants. As of June 2023, 233 participants had been enrolled: 48 with a primary diagnosis of AKI; 36 altruistic healthy reference donors; and 149 with a diagnosis of CKD. Participants will be followed for up to 10 years. Repeat biopsies are under consideration by the study steering committee, which consists of one representative from each funded stakeholder group in KPMP, plus a patient and NIDDK representative. Clinical, histopathologic, and molecular data are open to the scientific community through kpmp.org. For privacy reasons, most clinical data remain under controlled access until a sufficient sample size is met to allow data aggregation, but can be requested by investigators at kpmp.org.
Enhanced clinical phenotyping
In addition to the baseline clinical parameters and biopsies collected during enrollment, the KPMP also obtains longitudinal clinical follow-up and stores various biospecimens (plasma, urine, stool) for biomarker studies and other assays (like genomic sequencing) envisaged by ancillary studies. Furthermore, a subset of participants are evaluated through functional and physiological testing such as changes in measured glomerular filtration rate with protein load12, functional magnetic resonance imaging13, and advanced retinal phenotyping14. Efforts are underway to capture comprehensive clinical data from electronic medical records via digital tools. A rich set of clinical data including participant demographics, detailed medical history, comorbidities, family history, medications, and creatinine trajectories are available at https://www.kpmp.org/available-data. Concomitant work is ongoing for collecting parameters associated with social determinants of health15–17.
The KPMP continues to expand its digital infrastructure (www.kpmp.org) to synthesize and disseminate integrated data in formats relevant to various stakeholders. For example, participants receive return of results for interpretable information like the histopathologic biopsy result. Participants will also undergo whole genome sequencing (WGS) and current ethical and social determinants are being discussed to best convey such information to patients. The return of results language was optimized by our community engagement working group.
Digital pathology: visual and subvisual signature of disease
The KPMP generates precision histology and pathology reports for each biopsy sample, embracing pathomics interrogation to extract quantitative features across digitized whole slide images18, 19. Artificial intelligence and machine learning are used to automate segmentation and classify functional tissue units, cells, nuclei, and signs of disease20, 21. Pathomic features include sub-visual histopathologic changes, ones too subtle or computationally intensive to extract and quantitate by standard microscopy. These features are linked to molecular pathways and pathophysiology in order to generate novel imaging-based biomarkers of disease processes. These deep learning approaches are complemented by in-depth descriptor scoring of tubules, vessels, and glomeruli by a panel of expert nephropathologists. The molecular features can then be linked to clinically relevant pathomic features, either by linking morphological features in histology to molecular signatures from the same or adjacent sections19, 22 or by the creation of neighborhoods in the latent space as described below. Eventually, whole slide images will be used to interpret molecular classifications of disease sub-types, prognostication, and treatment selection.
Multi-Omics assays provide a 360-degree view of cellular and molecular phenotyping
Major precision medicine efforts have sought to establish atlases of cells in health and disease. These include cataloguing healthy reference tissues by the Human BioMolecular Atlas Program (HuBMAP)23 and the Chan-Zuckerberg Initiative (Human Cell Atlas)24. Disease-specific consortia focused on diabetic kidney disease include Transformative Research In DiabEtic NephropaThy (TRIDENT)11, the European cDNA bank25, and the PIMA Indian studies26. The Nephrotic Syndrome Study Network (NEPTUNE)27, Cure Glomerulonephropathy Network (CureGN)10, and Accelerating Medicines Partnership (AMP)28 each focus on a subset of glomerulonephritidies. The KPMP more broadly encompasses kidney diseases within the AKI and CKD umbrella.
KPMP seeks to achieve a complete cellular and molecular signature of the kidney by complementing the detailed clinical and pathomic phenotypes, discussed above, with transcriptomic, epigenomic, proteomic, and metabolomic phenotypes. Definitions of key technologies and their acronyms are provided in Box 1.
Box 1: Description of Key Technologies.
Unsupervised analysis
Unsupervised analyses cluster data using machine learning algorithms to identify patterns in raw data without gold standard labels.
Supervised analysis
In supervised analyses, available data with pre-defined labels based on existing knowledge inform the selection of parameters for clustering.
snRNA-seq
Single nucleus RNA sequencing uses isolated nuclei from a kidney biopsy specimen to determine gene expression.
scRNA-seq
Single cell RNA sequencing uses isolated cells to determine gene expression.
Spatial Transcriptomics
Spatial transcriptomics refers broadly to a set of diverse assays that measure gene expression which can be spatially localized to the tissue. Visium spatial transcriptomics provides gene expression mapped to a “spot” or bead which corresponds to a location in the tissue without single cell resolution. Xenium, CosMx, or MerFISH refer to in situ hybridization technologies which provide single cell resolution, but detect fewer genes.
ATAC-seq
The assay for transposase-accessible chromatin with sequencing determines the amount of open chromatin in a sample. A particular region of DNA with open chromatin may allow a transcription factor protein to bind and transcribe a greater amount of mRNA, increasing “expression” of the gene.
CUT&RUN
Cleavage Under Targets and Release Using Nuclease measures histone modifications across the genome in an antibody dependent manner. These histone modifications may increase the activity of transcription or silence it.
WGBS
Whole genome bisulfite sequencing measures methylation of cytosines within the DNA across the genome. Canonically, DNA methylation reduces expression of a gene.
CODEX
Co-Detection by Indexing is a highly multiplexed modality for fluorescence imaging of human kidney tissue with > 40 probes using validated antibodies.
MIBI
Multiplexed ion beam imaging is an imaging technology that relies on ion mass spectrometry of antibodies labeled with heavy metal isotopes. This technology can also image up to 40 targets.
IMC
Imaging mass cytometry is another highly multiplexed imaging modality that also relies of mass spectrometry of antibodies labeled with heavy metals using a laser (instead of an ion beam with MIBI).
3D tissue cytometry
3-dimensional large scale multi-fluorescence imaging with confocal optical sectioning of entire thick tissue sections of human kidney. Labeling up to 8 probes with 3D reconstruction and cell counts and neighborhood analysis in 3 dimensions.
Single cell and single nucleus RNA sequencing
These technologies generate gene expression data at the level of the individual cell and form the backbone of the KPMP atlas. In the first released version of the single cell and single nucleus RNA sequencing (sc/snRNAseq) atlas (https://atlas.kpmp.org/explorer), over 100 cell populations and subpopulations were molecularly characterized in health and various injury states29. Interrogating a biopsy with sensitive molecular markers facilitated understanding cellular processes and activated pathways before later stage pathologic manifestations (e.g. fibrosis, capillary loss, atrophy) manifest29. When combined with whole genome sequencing, we will be able to ascertain cell specific quantitative trait loci of expression, splicing, and open chromatin.
The advantage of sc/snRNAseq are their cell specific signature, however, spatial information is limited. Spatial technologies complement sc/snRNAseq by localizing cell types and states within tissue but lack the specificity and expression depth of sc/snRNAseq. Initially, a set of antibody-based regional microdissection technologies were used to spatially ground sc/snRNAseq signatures. KPMP now includes more specific spatial transcriptomic and proteomic technologies.
Epigenetics
The transcriptomic outputs of sc/snRNAseq are also complemented by epigenomic technologies. Epigenomics relates to changes in expression of RNA and proteins within a cell, unrelated to DNA sequence alterations. Examples of this type of regulation include modifications to DNA methylation, changes in histone binding proteins, or microRNA expression (which can affect the amount of circulating messenger RNA, and thereby reduce protein translation). In the KPMP, a multiome assay simultaneously measures snRNAseq for transcript expression and Assay for Transposase-Accessible Chromatin using sequencing (ATAC-seq) for open chromatin30. Whole genome bisulfite sequencing (WGBS) for measuring DNA methylation and Cleavage Under Targets and Release Using Nuclease (CUT&RUN) to determine histone modifications were initially explored and may be resumed once single cell resolution methods have been optimized31.
Spatial transcriptomics
A major focus for the KPMP is spatial mapping of cell types and understanding cell-cell interactions within tissue niches. Tissue niches are specific anatomic locations that regulate how cells participate in tissue generation, maintenance and repair. Visium spatial transcriptomics maps transcript level expression to kidney biopsies, but lacks single cell resolution32. Various multiplexed in situ hybridization technologies are being optimized to fill the gap. For example, CosMx and Multiplexed Error Robust Fluorescence In Situ Hybridization (MERFISH) provides spatial transcriptomics at a single cell level for a comprehensive set of transcripts.
Spatial protein technologies
Grounding these spatial transcriptomic technologies with spatially-anchored proteomics is vital to increasing the confidence of established niches because mRNA and protein expression may not be well correlated. Large scale 3-dimensional multi-fluorescence confocal imaging and tissue cytometry is an 8-channel imaging method which characterizes cell niches in thick sections. The 3-dimensional nature facilitates incorporation of structural information into imaging phenotypes. This technology is enhanced by more highly multiplexed 2-dimensional proteomic technologies including CO Detection by indexing (CODEX)33, Multiplexed Ion Beam Imaging (MIBI), and Imaging mass cytometry34. Each of these technologies have different underlying methodologies, but yield approximately a 40-channel breadth of immunofluorescent protein markers to spatially anchor cell type and state niches within a biopsy sample.
Metabolomics
The KPMP atlas is further enhanced by the inclusion of spatial metabolomic technologies. Spatial metabolomics provides the regional distribution of metabolites which can be correlated with protein data. This is supplemented by N-Glycomics that measures N-and O-linked glycans of glycoproteins and lipidomics for measuring lipid content within a cell35. The broad set of technologies within the KPMP allows for a holistic view of localized cell physiology and function in health and disease, and builds-in orthogonal validation as an atlas feature in order to enhance the confidence in classifying novel cell types and states33.
Multimodal Integration across technologies
Linkages across omics data types occur at multiple levels (Figure 2). The link between sc/snRNAseq and the imaging technologies was a foundational first step (Figure 2A). Specifically, the cell class, type, and states signatures defined by sc/snRNAseq are mapped onto spatial transcriptomics, anchoring the single cell classes in situ within histologic-stained tissue sections. The mapping is accomplished using statistical and machine learning based deconvolution tactics36 and links cell signatures to histology in the analytical space37. n contrast, consecutive sections from a single biopsy core can be processed with different technologies and spatially co-registered. For example, snRNAseq, spatial transcriptomics, CODEX and 3D imaging are performed from serial sections of a biopsy core. Direct spatial registration between consecutive sections, which could be automated38, 39, is then used to link transcriptomics data from spatial transcriptomics to protein data from imaging and histopathology (Figure 2B). The process can validate the expression of markers at the protein level and uncover discordances between RNA and protein expression such as feedback loops inhibiting transcription at high protein levels40–42.
Figure 2: Schemata of integration between various data elements contributed by participants in precision medicine studies.
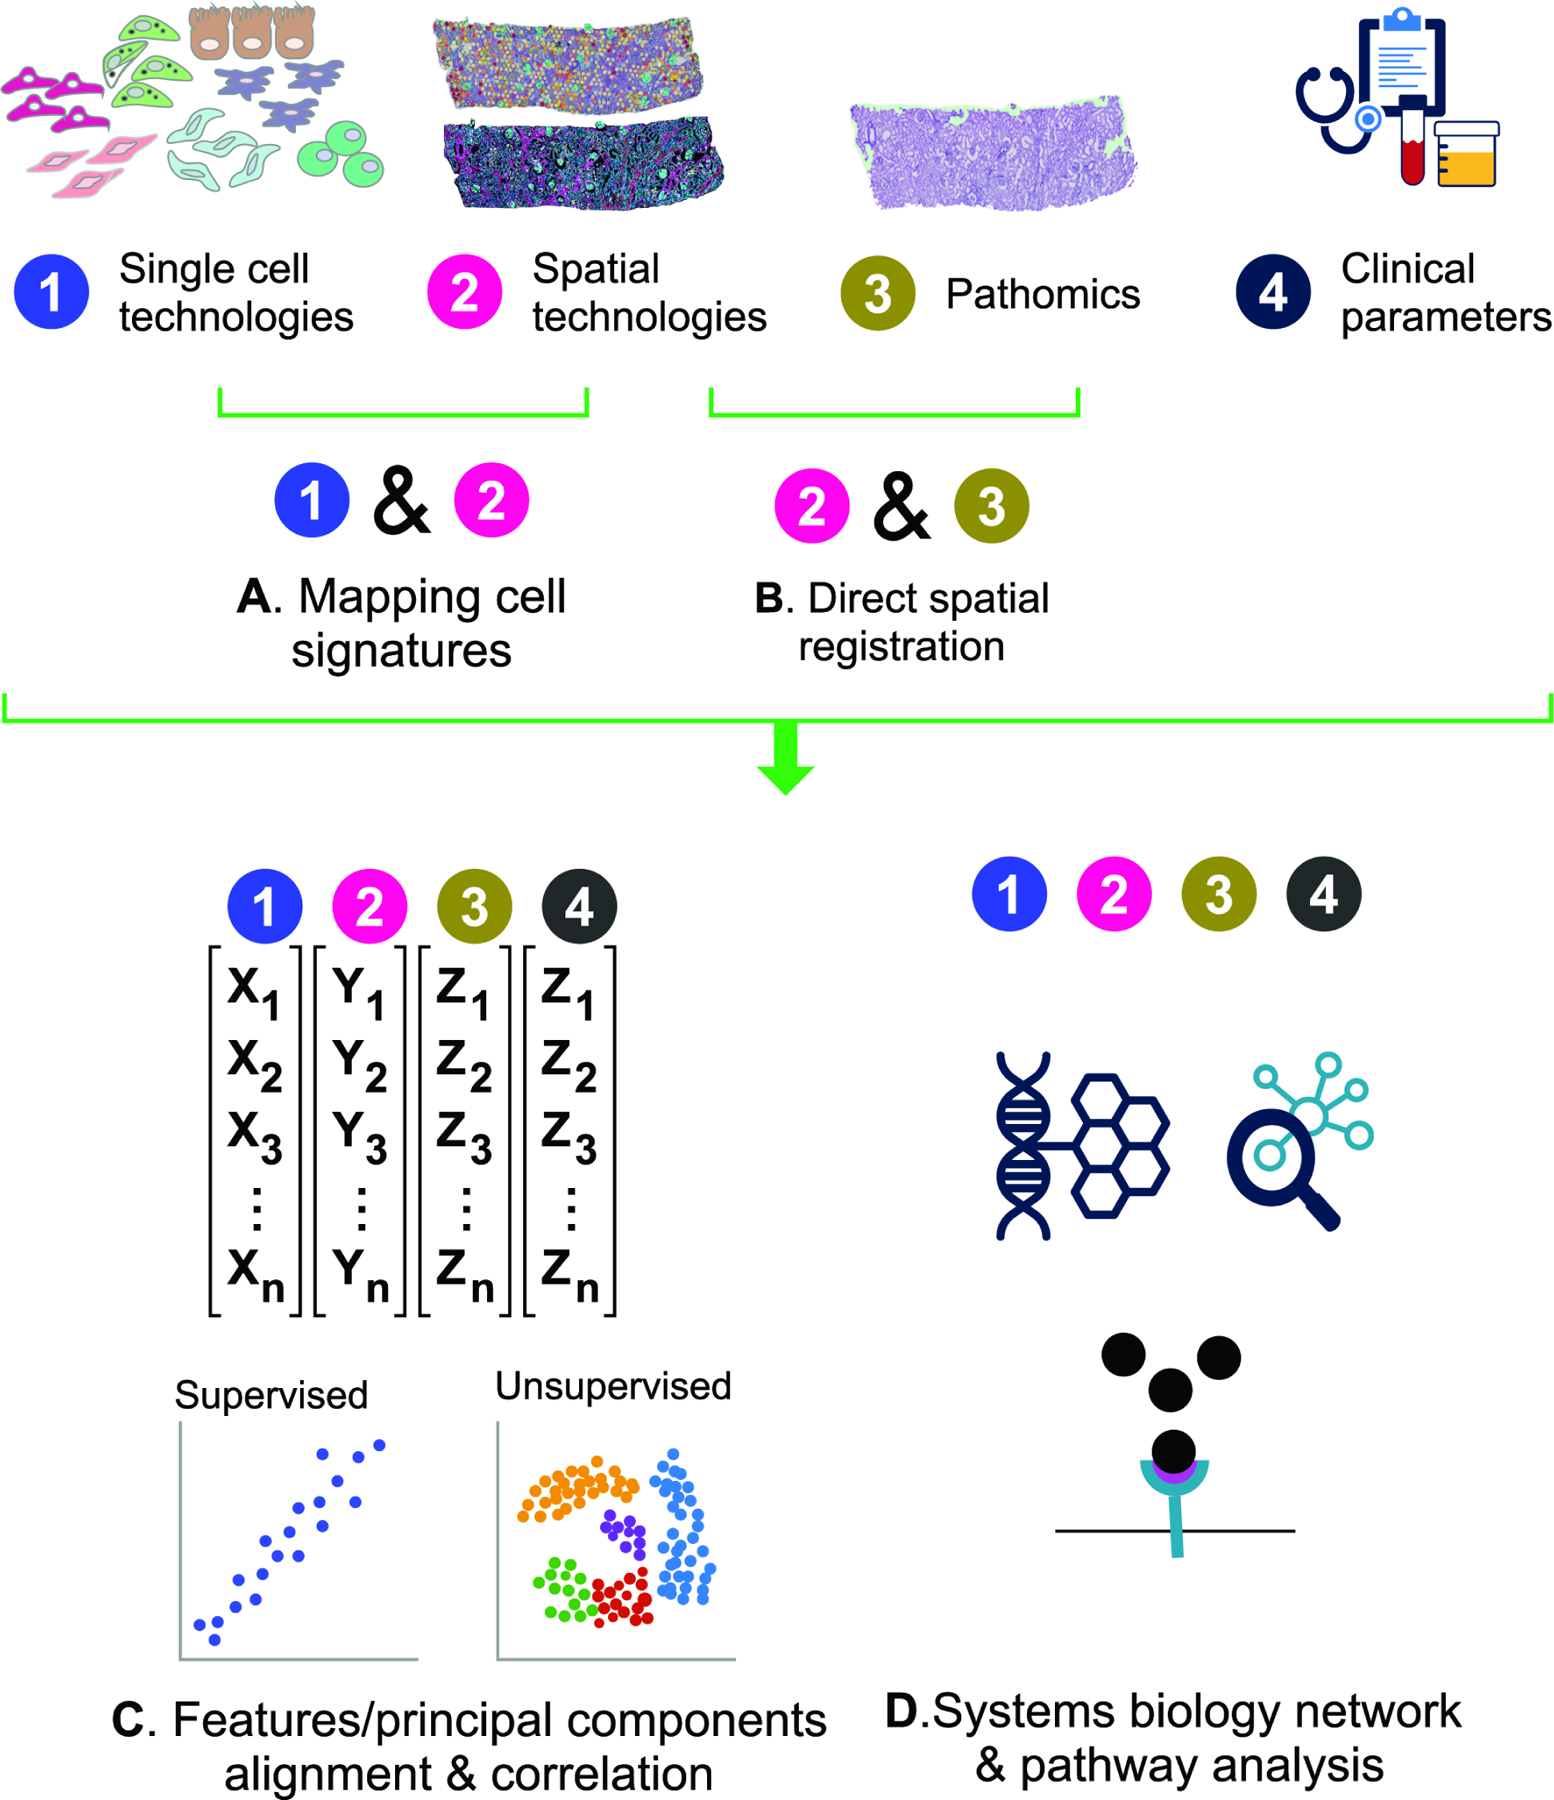
A) Dissociative single cell technologies determine specific cell type information which can be mapped back to tissue through spatial transcriptomic, proteomic, and metabolomic technologies which are further correlated with histologic assessment of the tissue and clinical phenotypes including advanced blood and urine biomarker assessment. B) A second approach to integration is the direct co-registration of measured transcript, protein, and histologic phenotypes in localized regions and cell niches defined within the tissue. C) Quantitative analysis of cell type and state mapping data may be performed in the analytical space without or with various degrees of supervision based on acquired knowledge. This analysis approach seeks to find common readouts between technologies with common outputs like cell class types or cell neighborhoods associated with specific molecular, clinical, or histopathologic features. D) Another analytical option is to adopt a systems biology approach wherein common pathways and disease processes are assessed across technologies.
Setting standards of quality
Rigorous quality control in data generation is essential to the molecular interrogations of the KPMP. Kidney biopsy samples in KPMP are obtained over years, so measures to prevent batch effect and assay drift are built into quality assurance and control (QA/QC) protocols. Most technologies include a single source tissue control (typically surgical nephrectomy tissue) with each batch of biopsy samples to enable data normalization, identify assay drift, or variations in the assay over time.
Additionally, each KPMP technology undergoes peer review by a Tissue Interrogation Site Activation Committee (TISAC) prior to implementation7. The peer review process evaluates the value of each technology, the utility of its data outputs, and the success and failure rates of interrogation on pilot nephrectomy samples. Investigators must establish relevant pre-analytic QA/QC metrics to assess tissue quality and instrument readiness before expensive molecular interrogation is carried out on precious, unique tissue. These pre-analytic metrics provide “Go/No-Go” criteria to decide whether a given biopsy sample may be used for a certain technology. For example, samples with lower RNA integrity may be more amenable to spatial proteomic interrogation rather than spatial transcriptomics. Assay and post-analytic QA/QC metrics are also tracked over time using Levey-Jennings plots to flag outliers within the publicly available atlas biorepository (www.kpmp.org). QA/QC processes and associated metadata are continuously monitored by a dedicated committee.
Integrating clinical, structural (histopathology) and Omics data
The KPMP facilitates integration of multi-scalar clinical, histological, molecular and imaging data to link molecular events to the clinical course of disease. The scale of such integration ranges from a single participant43, 44 to cohort analyses, which define pathways and molecular events critical for disease pathophysiology and prognosis29, 45. Integration can be accomplished in the analytical, or “latent” space (Figure 2C). Common readouts can be aligned by regression, clustering, or other machine learning classifiers. This type of analysis can generate new classifications or associations, connecting features from different technologies. For example, new cell states could be generated based on the simultaneous presence of: 1) a particular gene expression or proteomic profile, 2) spatial association with other cell types or structures in cell neighborhoods, and 3) unique distribution of these in disease. Clinical, histopathologic, social, environmental, physiological and biomarker variables can be aligned with the features extracted from the Omics data. Such integration could be agnostic, using all the features to generate an unsupervised model to define disease sub-phenotypes (Figure 2C, Box 1). Other models of multiscalar-integration could be more directed or supervised, starting from a specified clinical, pathology or molecular phenotype and linking other parameters to understand the underlying pathogenesis.
Systems biology approaches can also be used to integrate data from different technologies (Figure 2D). Here, the linkages are based on pathways, ontologies or biological networks that are derived from each technology via bioinformatic models33. With this type of analysis, technologies need not overlap for specific markers, but are instead linked through groups of markers or genes within a signaling pathway or biological process.
The KPMP knowledge hub provides a unique environment to test and generate hypotheses. Questions the KPMP is uniquely poised to study include the pathophysiological link between AKI and CKD, the determinants of AKI recovery and disease progression44, subtypes of diabetic kidney disease and phenotype of disease “resistors”.
Key role of partnering with patients
Having patients as equal research partners in KPMP has proven to be energizing and inspiring to the study. The KPMP community engagement committee members contribute to all aspects of the KPMP, including working groups focused on molecular and pathology integration. Patient involvement constantly re-focuses investigators to seek clinically translatable advances in an efficient manner. Patient partners have contributed to outreach efforts, shared decision making and accountability, framed policies on recruitment and retention, structured informed consent, reporting and dissemination of results to patients and families with kidney disease17, 46. Additionally, the KPMP community engagement group pushed the KPMP to provide insurance coverage for potential adverse events related to biopsy procedures when carried out purely for research. Further, patient partners are co-authors on manuscripts including the clinical pathologic molecular correlation series43, 44, 47, which each highlight a single case, drawing parallels between clinical presentations, histopathologic interpretation, and molecular findings.
The first data sharing tool developed by KPMP patient partners, was a participant portal for patients to explore their own kidney biopsy images, transforming the mysterious into the tangible. The ultimate goal is for providers to explain high-evidence molecular data to patients, show how they compare to other individuals within the kidney atlas, and use the information to select the best therapy. However, much discovery, validation, and education is required before this goal can be fully realized.
Challenges and future outlook
Patient recruitment and retention, performing multi-modal interrogation of kidney biopsies, deep clinical phenotyping and collecting various biospecimen at a large scale are all challenging. Additional charges for the KPMP include:
Aligning various stakeholders across the US in this coordinated effort with real-time feedback on biopsy safety, data quality and analytic rigor.
Managing and storing specimens and data of unprecedented size curated for dissemination.
Developing a framework for data integration that aligns experts from various domains, highly specialized technologies and data outputs. Some data types require development of novel analysis plans to coincide with recent technological innovations.
Correction for multiple testing is a significant concern because the KPMP dataset is deep, but with limited sample size. Integration and orthogonal validation mitigate the multiple testing concern to an extent.
Sampling bias is a limitation. A kidney biopsy represents a snapshot in time at a single location within the kidney. Kidney diseases often have a complicated trajectory with many environmental contributors and a single kidney biopsy may fail to appropriately place them along a disease timeline or account for intra-participant heterogeneity.
Building and evolving the infrastructure of KPMP to support open data access and exploration from across the globe.
Keeping pace with rapidly evolving technologies that often result in increasing costs and limited throughput.
Data security and safety in the face of increasing cyber threats.
Keeping the community engaged when efforts are designed to yield long term results, not immediately apparent.
Developing clinical trial structures to test and implement targeted therapies that involve all stakeholders (patients, academia, industry, regulators and payers).
Maintaining adequate recruitment to ensure a sufficient sample size to test future hypotheses.
Conclusions
The KPMP seeks to bring novel insights to understand AKI and CKD, uncover strategies to define disease sub-types, use underlying biology to align patients with treatments, and provide targets for therapy and biomarker development. In order to achieve these goals, the KPMP studies the kidney at the level of its cellular components to glean specific molecular signatures. To compensate for this seemingly reductionist approach, cell neighborhoods and functional tissue units are reconstructed in situ to evaluate the interaction of cells and structures and their link to histological and clinical parameters. However, the whole is often greater than the sum of the parts48 and the value of integrating these datasets will be tested in the coming years. Despite these challenges, the knowledge and tools provided by the KPMP have already yielded important insights that could further the care of patients with kidney disease29, 45, 49.
Supplementary Material
Item S1. KPMP Contributors List.
Support:
JH was supported by U24 DK114886. MK was supported by U01 DK133090. TME and MTE were supported by U01 DK114923. The funders did not hold a role in study design, data collection, analysis, reporting, or the decision to submit for publication.
Footnotes
Publisher's Disclaimer: This is a PDF file of an unedited manuscript that has been accepted for publication. As a service to our customers we are providing this early version of the manuscript. The manuscript will undergo copyediting, typesetting, and review of the resulting proof before it is published in its final form. Please note that during the production process errors may be discovered which could affect the content, and all legal disclaimers that apply to the journal pertain.
Article Information
Kidney Precision Medicine Project contributors: A complete list of the Kidney Precision Medicine Project contributors is provided in Item S1.
Additional Information: Authors TME-A, MTE, MK, and JH are members of the Kidney Precision Medicine Project.
Financial Disclosure: MK reports grants from the National Institute of Diabetes and Digestive and Kidney Diseases in support of this manuscript. Grants and contracts outside the submitted work through the University of Michigan with National Institutes of Health, JDRF, Chan Zuckerberg Initiative, AstraZeneca, NovoNordisk, Eli Lilly, Gilead, Goldfinch Bio, Janssen, Boehringer-Ingelheim, Moderna, European Union Innovative Medicine Initiative, Certa, Chinook, amfAR, Angion, RenalytixAI, Travere, Regeneron and IONIS. MK reports consulting fees through the University of Michigan from Astellas, Poxel, Janssen and UCB. In addition, MK has a patent PCT/EP2014/073413 “Biomarkers and methods for progression prediction for chronic kidney disease” licensed. The other authors declare that they have no relevant financial interests.
References
- 1.Bikbov B, Purcell CA, Levey AS, et al. Global, regional, and national burden of chronic kidney disease, 1990–2017: a systematic analysis for the Global Burden of Disease Study 2017. The Lancet 2020;395(10225):709–733. doi: 10.1016/S0140-6736(20)30045-3 [DOI] [PMC free article] [PubMed] [Google Scholar]
- 2.United States Renal Data System. 2022 USRDS Annual Data Report: Epidemiology of kidney disease in the United States 2022. https://adr.usrds.org/2022 [DOI] [PMC free article] [PubMed]
- 3.Zeggini E, Gloyn AL, Barton AC, Wain LV. Translational genomics and precision medicine: Moving from the lab to the clinic. Science Sep 27 2019;365(6460):1409–1413. doi: 10.1126/science.aax4588 [DOI] [PubMed] [Google Scholar]
- 4.Chung WK, Erion K, Florez JC, et al. Precision Medicine in Diabetes: A Consensus Report From the American Diabetes Association (ADA) and the European Association for the Study of Diabetes (EASD). Diabetes Care Jul 2020;43(7):1617–1635. doi: 10.2337/dci20-0022 [DOI] [PMC free article] [PubMed] [Google Scholar]
- 5.de Boer IH, Alpers CE, Azeloglu EU, et al. Rationale and design of the Kidney Precision Medicine Project. Kidney Int Mar 2021;99(3):498–510. doi: 10.1016/j.kint.2020.08.039 [DOI] [PMC free article] [PubMed] [Google Scholar]
- 6.Brown KD, Campbell C, Roberts GV. Precision medicine in kidney disease: the patient’s view. Nat Rev Nephrol Nov 2020;16(11):625–627. doi: 10.1038/s41581-020-0319-0 [DOI] [PMC free article] [PubMed] [Google Scholar]
- 7.El-Achkar TM, Eadon MT, Menon R, et al. A multimodal and integrated approach to interrogate human kidney biopsies with rigor and reproducibility: guidelines from the Kidney Precision Medicine Project. Physiological genomics Jan 1 2021;53(1):1–11. doi: 10.1152/physiolgenomics.00104.2020 [DOI] [PMC free article] [PubMed] [Google Scholar]
- 8.Gluck C, Ko YA, Susztak K. Precision Medicine Approaches to Diabetic Kidney Disease: Tissue as an Issue. Curr Diab Rep May 2017;17(5):30. doi: 10.1007/s11892-017-0854-7 [DOI] [PMC free article] [PubMed] [Google Scholar]
- 9.Hodgin JB, Mariani LH, Zee J, et al. Quantification of Glomerular Structural Lesions: Associations With Clinical Outcomes and Transcriptomic Profiles in Nephrotic Syndrome. Am J Kidney Dis Jun 2022;79(6):807–819 e1. doi: 10.1053/j.ajkd.2021.10.004 [DOI] [PMC free article] [PubMed] [Google Scholar]
- 10.Mariani LH, Bomback AS, Canetta PA, et al. CureGN Study Rationale, Design, and Methods: Establishing a Large Prospective Observational Study of Glomerular Disease. Am J Kidney Dis Feb 2019;73(2):218–229. doi: 10.1053/j.ajkd.2018.07.020 [DOI] [PMC free article] [PubMed] [Google Scholar]
- 11.Townsend RR, Guarnieri P, Argyropoulos C, et al. Rationale and design of the Transformative Research in Diabetic Nephropathy (TRIDENT) Study. Kidney Int Jan 2020;97(1):10–13. doi: 10.1016/j.kint.2019.09.020 [DOI] [PubMed] [Google Scholar]
- 12.Palsson R, Waikar SS. Renal Functional Reserve Revisited. Advances in chronic kidney disease May 2018;25(3):e1–e8. doi: 10.1053/j.ackd.2018.03.001 [DOI] [PubMed] [Google Scholar]
- 13.Srivastava A, Cai X, Lee J, et al. Kidney Functional Magnetic Resonance Imaging and Change in eGFR in Individuals with CKD. Clin J Am Soc Nephrol Jun 8 2020;15(6):776–783. doi: 10.2215/CJN.13201019 [DOI] [PMC free article] [PubMed] [Google Scholar]
- 14.Limonte CP, Kretzler M, Pennathur S, Pop-Busui R, de Boer IH. Present and future directions in diabetic kidney disease. J Diabetes Complications Dec 2022;36(12):108357. doi: 10.1016/j.jdiacomp.2022.108357 [DOI] [PMC free article] [PubMed] [Google Scholar]
- 15.Weinstein AM, Kimmel PL. Social Determinants of Health in People with Kidney Disease: An Introduction. Clin J Am Soc Nephrol May 8 2021;16(5):803–805. doi: 10.2215/CJN.12600720 [DOI] [PMC free article] [PubMed] [Google Scholar]
- 16.Norris KC, Beech BM. Social Determinants of Kidney Health: Focus on Poverty. Clin J Am Soc Nephrol May 8 2021;16(5):809–811. doi: 10.2215/CJN.12710820 [DOI] [PMC free article] [PubMed] [Google Scholar]
- 17.Tuttle KR, Bebiak J, Brown K, et al. Patient perspectives and involvement in precision medicine research. Kidney Int Mar 2021;99(3):511–514. doi: 10.1016/j.kint.2020.10.036 [DOI] [PubMed] [Google Scholar]
- 18.Barisoni L, Lafata KJ, Hewitt SM, Madabhushi A, Balis UGJ. Digital pathology and computational image analysis in nephropathology. Nat Rev Nephrol Nov 2020;16(11):669–685. doi: 10.1038/s41581-020-0321-6 [DOI] [PMC free article] [PubMed] [Google Scholar]
- 19.Lutnick B, Manthey D, Becker JU, et al. A user-friendly tool for cloud-based whole slide image segmentation with examples from renal histopathology. Commun Med (Lond) 2022;2:105. doi: 10.1038/s43856-022-00138-z [DOI] [PMC free article] [PubMed] [Google Scholar]
- 20.Hermsen M, de Bel T, den Boer M, et al. Deep Learning-Based Histopathologic Assessment of Kidney Tissue. J Am Soc Nephrol Oct 2019;30(10):1968–1979. doi: 10.1681/ASN.2019020144 [DOI] [PMC free article] [PubMed] [Google Scholar]
- 21.Ginley B, Lutnick B, Jen KY, et al. Computational Segmentation and Classification of Diabetic Glomerulosclerosis. J Am Soc Nephrol Oct 2019;30(10):1953–1967. doi: 10.1681/ASN.2018121259 [DOI] [PMC free article] [PubMed] [Google Scholar]
- 22.Ginley B, Jen KY, Han SS, et al. Automated Computational Detection of Interstitial Fibrosis, Tubular Atrophy, and Glomerulosclerosis. J Am Soc Nephrol Apr 2021;32(4):837–850. doi: 10.1681/ASN.2020050652 [DOI] [PMC free article] [PubMed] [Google Scholar]
- 23.Hu BC. The human body at cellular resolution: the NIH Human Biomolecular Atlas Program. Nature Oct 2019;574(7777):187–192. doi: 10.1038/s41586-019-1629-x [DOI] [PMC free article] [PubMed] [Google Scholar]
- 24.Regev A, Teichmann SA, Lander ES, et al. The Human Cell Atlas. Elife Dec 5 2017;6doi: 10.7554/eLife.27041 [DOI] [PMC free article] [PubMed] [Google Scholar]
- 25.Cohen CD, Kretzler M. [Gene expression analyses of kidney biopsies: the European renal cDNA bank--Kroner-Fresenius biopsy bank]. Pathologe Mar 2009;30(2):101–4. Genexpressionsanalysen an Nierenbiopsien: Die Europaische Renale cDNA Bank--Kroner-Fresenius Biopsiebank. doi: 10.1007/s00292-008-1111-2 [DOI] [PubMed] [Google Scholar]
- 26.Nelson RG, Knowler WC, Kretzler M, et al. Pima Indian Contributions to Our Understanding of Diabetic Kidney Disease. Diabetes Aug 2021;70(8):1603–1616. doi: 10.2337/dbi20-0043 [DOI] [PMC free article] [PubMed] [Google Scholar]
- 27.Gadegbeku CA, Gipson DS, Holzman LB, et al. Design of the Nephrotic Syndrome Study Network (NEPTUNE) to evaluate primary glomerular nephropathy by a multidisciplinary approach. Kidney Int Apr 2013;83(4):749–56. doi: 10.1038/ki.2012.428 [DOI] [PMC free article] [PubMed] [Google Scholar]
- 28.Hoover P, Der E, Berthier CC, et al. Accelerating Medicines Partnership: Organizational Structure and Preliminary Data From the Phase 1 Studies of Lupus Nephritis. Arthritis Care Res (Hoboken) Feb 2020;72(2):233–242. doi: 10.1002/acr.24066 [DOI] [PMC free article] [PubMed] [Google Scholar]
- 29.Lake BB, Menon R, Winfree S, et al. An atlas of healthy and injured cell states and niches in the human kidney. Nature Jul 2023;619(7970):585–594. doi: 10.1038/s41586-023-05769-3 [DOI] [PMC free article] [PubMed] [Google Scholar]
- 30.Doke T, Huang S, Qiu C, et al. Transcriptome-wide association analysis identifies DACH1 as a kidney disease risk gene that contributes to fibrosis. J Clin Invest May 17 2021;131(10)doi: 10.1172/JCI141801 [DOI] [PMC free article] [PubMed] [Google Scholar]
- 31.Gisch DL, Brennan M, Lake BB, et al. The chromatin landscape of healthy and injured cell types in the human kidney. bioRxiv Jun 8 2023;doi: 10.1101/2023.06.07.543965 [DOI] [PMC free article] [PubMed] [Google Scholar]
- 32.Melo Ferreira R, Sabo AR, Winfree S, et al. Integration of spatial and single cell transcriptomics localizes epithelial-immune cross-talk in kidney injury. JCI Insight May 18 2021;doi: 10.1172/jci.insight.147703 [DOI] [PMC free article] [PubMed] [Google Scholar]
- 33.Hansen J, Sealfon R, Menon R, et al. A reference tissue atlas for the human kidney. Sci Adv Jun 10 2022;8(23):eabn4965. doi: 10.1126/sciadv.abn4965 [DOI] [PMC free article] [PubMed] [Google Scholar]
- 34.Singh N, Avigan ZM, Kliegel JA, et al. Development of a 2-dimensional atlas of the human kidney with imaging mass cytometry. JCI Insight Jun 20 2019;4(12)doi: 10.1172/jci.insight.129477 [DOI] [PMC free article] [PubMed] [Google Scholar]
- 35.Velickovic D, Becejac T, Mamedov S, et al. Rapid Automated Annotation and Analysis of N-Glycan Mass Spectrometry Imaging Data Sets Using NGlycDB in METASPACE. Anal Chem Oct 12 2021;93(40):13421–13425. doi: 10.1021/acs.analchem.1c02347 [DOI] [PubMed] [Google Scholar]
- 36.Melo Ferreira R, Freije BJ, Eadon MT. Deconvolution Tactics and Normalization in Renal Spatial Transcriptomics. Front Physiol 2021;12:812947. doi: 10.3389/fphys.2021.812947 [DOI] [PMC free article] [PubMed] [Google Scholar]
- 37.Eadon MT, Dagher PC, El-Achkar TM. Cellular and molecular interrogation of kidney biopsy specimens. Curr Opin Nephrol Hypertens Mar 1 2022;31(2):160–167. doi: 10.1097/MNH.0000000000000770 [DOI] [PMC free article] [PubMed] [Google Scholar]
- 38.Bergenstrahle J, Larsson L, Lundeberg J. Seamless integration of image and molecular analysis for spatial transcriptomics workflows. BMC Genomics Jul 14 2020;21(1):482. doi: 10.1186/s12864-020-06832-3 [DOI] [PMC free article] [PubMed] [Google Scholar]
- 39.Fernandez R, Moisy C. Fijiyama: a registration tool for 3D multimodal time-lapse imaging. Bioinformatics Jun 16 2021;37(10):1482–1484. doi: 10.1093/bioinformatics/btaa846 [DOI] [PubMed] [Google Scholar]
- 40.Ferkowicz MJ, Winfree S, Sabo AR, et al. Large-scale, three-dimensional tissue cytometry of the human kidney: a complete and accessible pipeline. Laboratory investigation; a journal of technical methods and pathology Jan 6 2021;doi: 10.1038/s41374-020-00518-w [DOI] [PMC free article] [PubMed] [Google Scholar]
- 41.Makki MS, Winfree S, Lingeman JE, et al. A Precision Medicine Approach Uncovers a Unique Signature of Neutrophils in Patients With Brushite Kidney Stones. Kidney Int Rep May 2020;5(5):663–677. doi: 10.1016/j.ekir.2020.02.1025 [DOI] [PMC free article] [PubMed] [Google Scholar]
- 42.Winfree S, Ferkowicz MJ, Dagher PC, et al. Large-scale 3-dimensional quantitative imaging of tissues: state-of-the-art and translational implications. Transl Res Nov 2017;189:1–12. doi: 10.1016/j.trsl.2017.07.006 [DOI] [PMC free article] [PubMed] [Google Scholar]
- 43.Patel J, Torrealba JR, Poggio ED, et al. Molecular Signatures of Diabetic Kidney Disease Hiding in a Patient with Hypertension-Related Kidney Disease: A Clinical Pathologic Molecular Correlation. Clin J Am Soc Nephrol Apr 2022;17(4):594–601. doi: 10.2215/CJN.10350721 [DOI] [PMC free article] [PubMed] [Google Scholar]
- 44.Menon R, Bomback AS, Lake BB, et al. Integrated single-cell sequencing and histopathological analyses reveal diverse injury and repair responses in a participant with acute kidney injury: a clinical-molecular-pathologic correlation. Kidney Int Jun 2022;101(6):1116–1125. doi: 10.1016/j.kint.2022.03.011 [DOI] [PMC free article] [PubMed] [Google Scholar]
- 45.Canela VH, Bowen WS, Ferreira RM, et al. A spatially anchored transcriptomic atlas of the human kidney papilla identifies significant immune injury in patients with stone disease. Nature communications Jul 19 2023;14(1):4140. doi: 10.1038/s41467-023-38975-8 [DOI] [PMC free article] [PubMed] [Google Scholar]
- 46.Tuttle KR, Knight R, Appelbaum PS, et al. Integrating Patient Priorities with Science by Community Engagement in the Kidney Precision Medicine Project. Clin J Am Soc Nephrol Apr 7 2021;16(4):660–668. doi: 10.2215/CJN.10270620 [DOI] [PMC free article] [PubMed] [Google Scholar]
- 47.Parikh S, Madhavan S, Shapiro J, et al. Characterization of Glomerular and Tubulointerstitial Proteomes in a Case of NSAID-Attributed Acute Kidney Injury. Clin J Am Soc Nephrol Nov 7 2022;doi: 10.2215/CJN.09260822 [DOI] [PMC free article] [PubMed] [Google Scholar]
- 48.Aristotle. Topics Book VI 188–208.
- 49.Holscher DL, Bouteldja N, Joodaki M, et al. Next-Generation Morphometry for pathomics-data mining in histopathology. Nat Commun Jan 28 2023;14(1):470. doi: 10.1038/s41467-023-36173-0 [DOI] [PMC free article] [PubMed] [Google Scholar]
Associated Data
This section collects any data citations, data availability statements, or supplementary materials included in this article.
Supplementary Materials
Item S1. KPMP Contributors List.