

SUMMARY
Apolipoprotein E (APOE) is a strong genetic risk factor for late-onset Alzheimer’s disease. APOE4 increases and APOE2 decreases risk relative to APOE3. In the P301S mouse model of tauopathy, ApoE4 increases tau pathology and neurodegeneration when compared to ApoE3 or the absence of ApoE. However, the role of ApoE isoforms and lipid metabolism in contributing to tau-mediated degeneration is unknown. We demonstrate that in P301S tau mice, ApoE4 strongly promotes glial lipid accumulation and perturbations in cholesterol metabolism and lysosomal function. Increasing lipid efflux in glia via an LXR agonist or Abca1 overexpression strongly attenuates tau pathology and neurodegeneration in P301S/ApoE4 mice. We also demonstrate reductions in reactive astrocytes and microglia and changes in cholesterol biosynthesis and metabolism in glia of tauopathy mice in response to LXR activation. These data suggest that promoting efflux of glial lipids may serve as a therapeutic approach to ameliorate tau and ApoE4-linked neurodegeneration.
Keywords: ApoE4, Abca1, Tau, Lipid, Cholesterol Metabolism, LXR agonist
eTOC
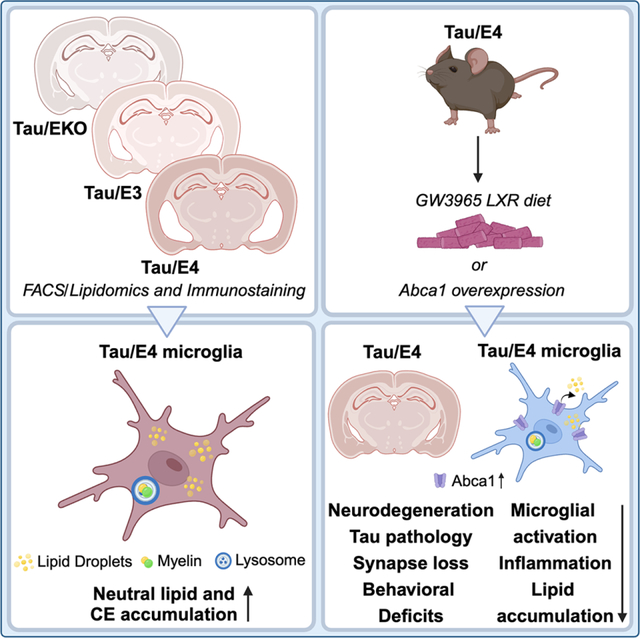
Using lipidomics coupled with immunostaining, Litvinchuk et al. demonstrate that ApoE promotes changes in cholesterol metabolism and lipid accumulation in glia of 9.5-month-old P301S mice. LXR agonist GW3965 diet and Abca1 overexpression markedly decrease tauopathy, neurodegeneration, synapse loss and behavioral deficits, neuroinflammation and glial lipid accumulation in 9.5-month-old P301S/ApoE4 mice.
Graphical Abstract:
INTRODUCTION
Apolipoprotein E (ApoE), the most abundant apolipoprotein in the brain, regulates lipid and cholesterol transport and metabolism, and in neurodegenerative conditions is linked to increased glial neuroinflammatory responses.1,2 The ε4 allele of APOE strongly increases and the ε2 allele decreases risk for developing late-onset AD (LOAD) when compared to more common ε3 allele. Lipid accumulation in glia is linked to enhanced inflammatory responses and, thus, could significantly promote neurodegeneration in AD and other neurodegenerative disorders.3–5 ApoE4 drives the accumulation of lipids and increased inflammatory cytokine production in vitro in human iPSC (induced pluripotent stem cell)-derived astrocytes, microglia and oligodendrocytes.6–9 In vivo, an increase in free cholesterol and/or cholesteryl esters was detected in astrocytes and microglia of ApoE KO mice which was enhanced in a model of demyelination.4,10 Generally, the genetics of LOAD are consistent with a pathogenic role of lipids, since polymorphisms in lipid metabolism-associated genes apart from APOE, such as CLU, TREM2, ABCA1, ABCA7, and ATP8B4, significantly modulate disease risk.11–13
ApoE4 strongly influences tau pathology and exacerbates microglia-mediated, tau-dependent neurodegeneration.2,14,15,16–19 However, it is not known if APOE isoforms influence glial lipid accumulation in tauopathy, which then influences tau-dependent neurodegeneration. We utilized targeted lipidomics coupled with immunostaining to dissect the role of ApoE isoforms in regulation of glial lipid metabolism in 9.5-month-old P301S tau transgenic mice with a targeted replacement of murine apoE with human ApoE3 (TE3) or ApoE4 (TE4) as well as in mice lacking ApoE (TEKO). We demonstrate that expression of ApoE4 induces significant elevations in cholesteryl esters in the forebrain and microglia of P301S mice and enhances the accumulation of BODIPY+ neutral lipids within microglia. Treatment with an LXR agonist GW3965 or overexpression of Abca1, reduces tau pathology and associated neurodegeneration, glial inflammation, and synaptic deficits in TE4 mice.
RESULTS
ApoE4 induces changes in cholesterol metabolism in forebrains of 9.5-month-old P301S mice.
As previously reported, 9.5-month-old TE4 mice exhibited prominent neurodegeneration of the hippocampus and entorhinal/piriform cortex and concomitant ventricular enlargement that was greater than that observed in TE3 mice (Fig. 1A–B). TEKO were largely protected from neurodegeneration (Fig. 1A–B).16 To characterize the specific lipid species/pathways dysregulated in P301S mice expressing different ApoE isoforms or ApoE KO, we performed lipidomic profiling of forebrain tissues (Fig. S1A).4 We detected over 181 differentially abundant lipid species across 6 groups of mice that reflect changes in lipid content of multiple cell types in brain, including neurons, astrocytes and microglia, and oligodendrocytes (Fig. 1C and Fig. S1B). We observed significant differences in sterols (cholesteryl esters (CEs), cholesterol sulfate and oxidized sterols (4-beta-hydroxycholesterol)), phospholipids (bis(monoacylglycerol) phosphate (BMP), hemi-BMPs, phosphatidylethanolamine (PE) and plasmalogens PE (PEp)), glycerolipids (monoacylglycerides (MGs) and diacylglycerides (DGs)), and sphingolipids (sulfatide (3-o-sulfo) (GalCer)) and sphingomyelin (SM)), in an ApoE- and tau-dependent manner (Fig. 1C). Compared to E3, E4 mice exhibited significant elevations of hemi-BMP and cholesterol sulfate, and reductions in several CEs in the absence of tauopathy (Fig. 1D). Interestingly, when we compared the forebrain lipidomes of E4 or E3 to EKO mice, we detected marked accumulation of CEs in EKO brains indicating impaired cholesterol metabolism with the loss of ApoE (Fig. S1C and D) consistent with previous work.4 When we analyzed the differences in lipidome profiles of E4 vs. EKO or E3 vs. EKO mice, we observed that E4 but not E3 forebrains exhibited drastic increases in endolysosomal phospholipid BMP, DGs and MGs, and PEs while accumulating significantly lower levels of CEs when compared to EKO mice (Fig. S1E–F). These results indicate ApoE isoform-dependent changes in cholesterol metabolism and lysosomal function of 9.5-month-old non-tau transgenic mice.
Fig. 1. ApoE4 induces changes in cholesterol metabolism in forebrains of 9.5-month-old P301S/ApoEKI mice.
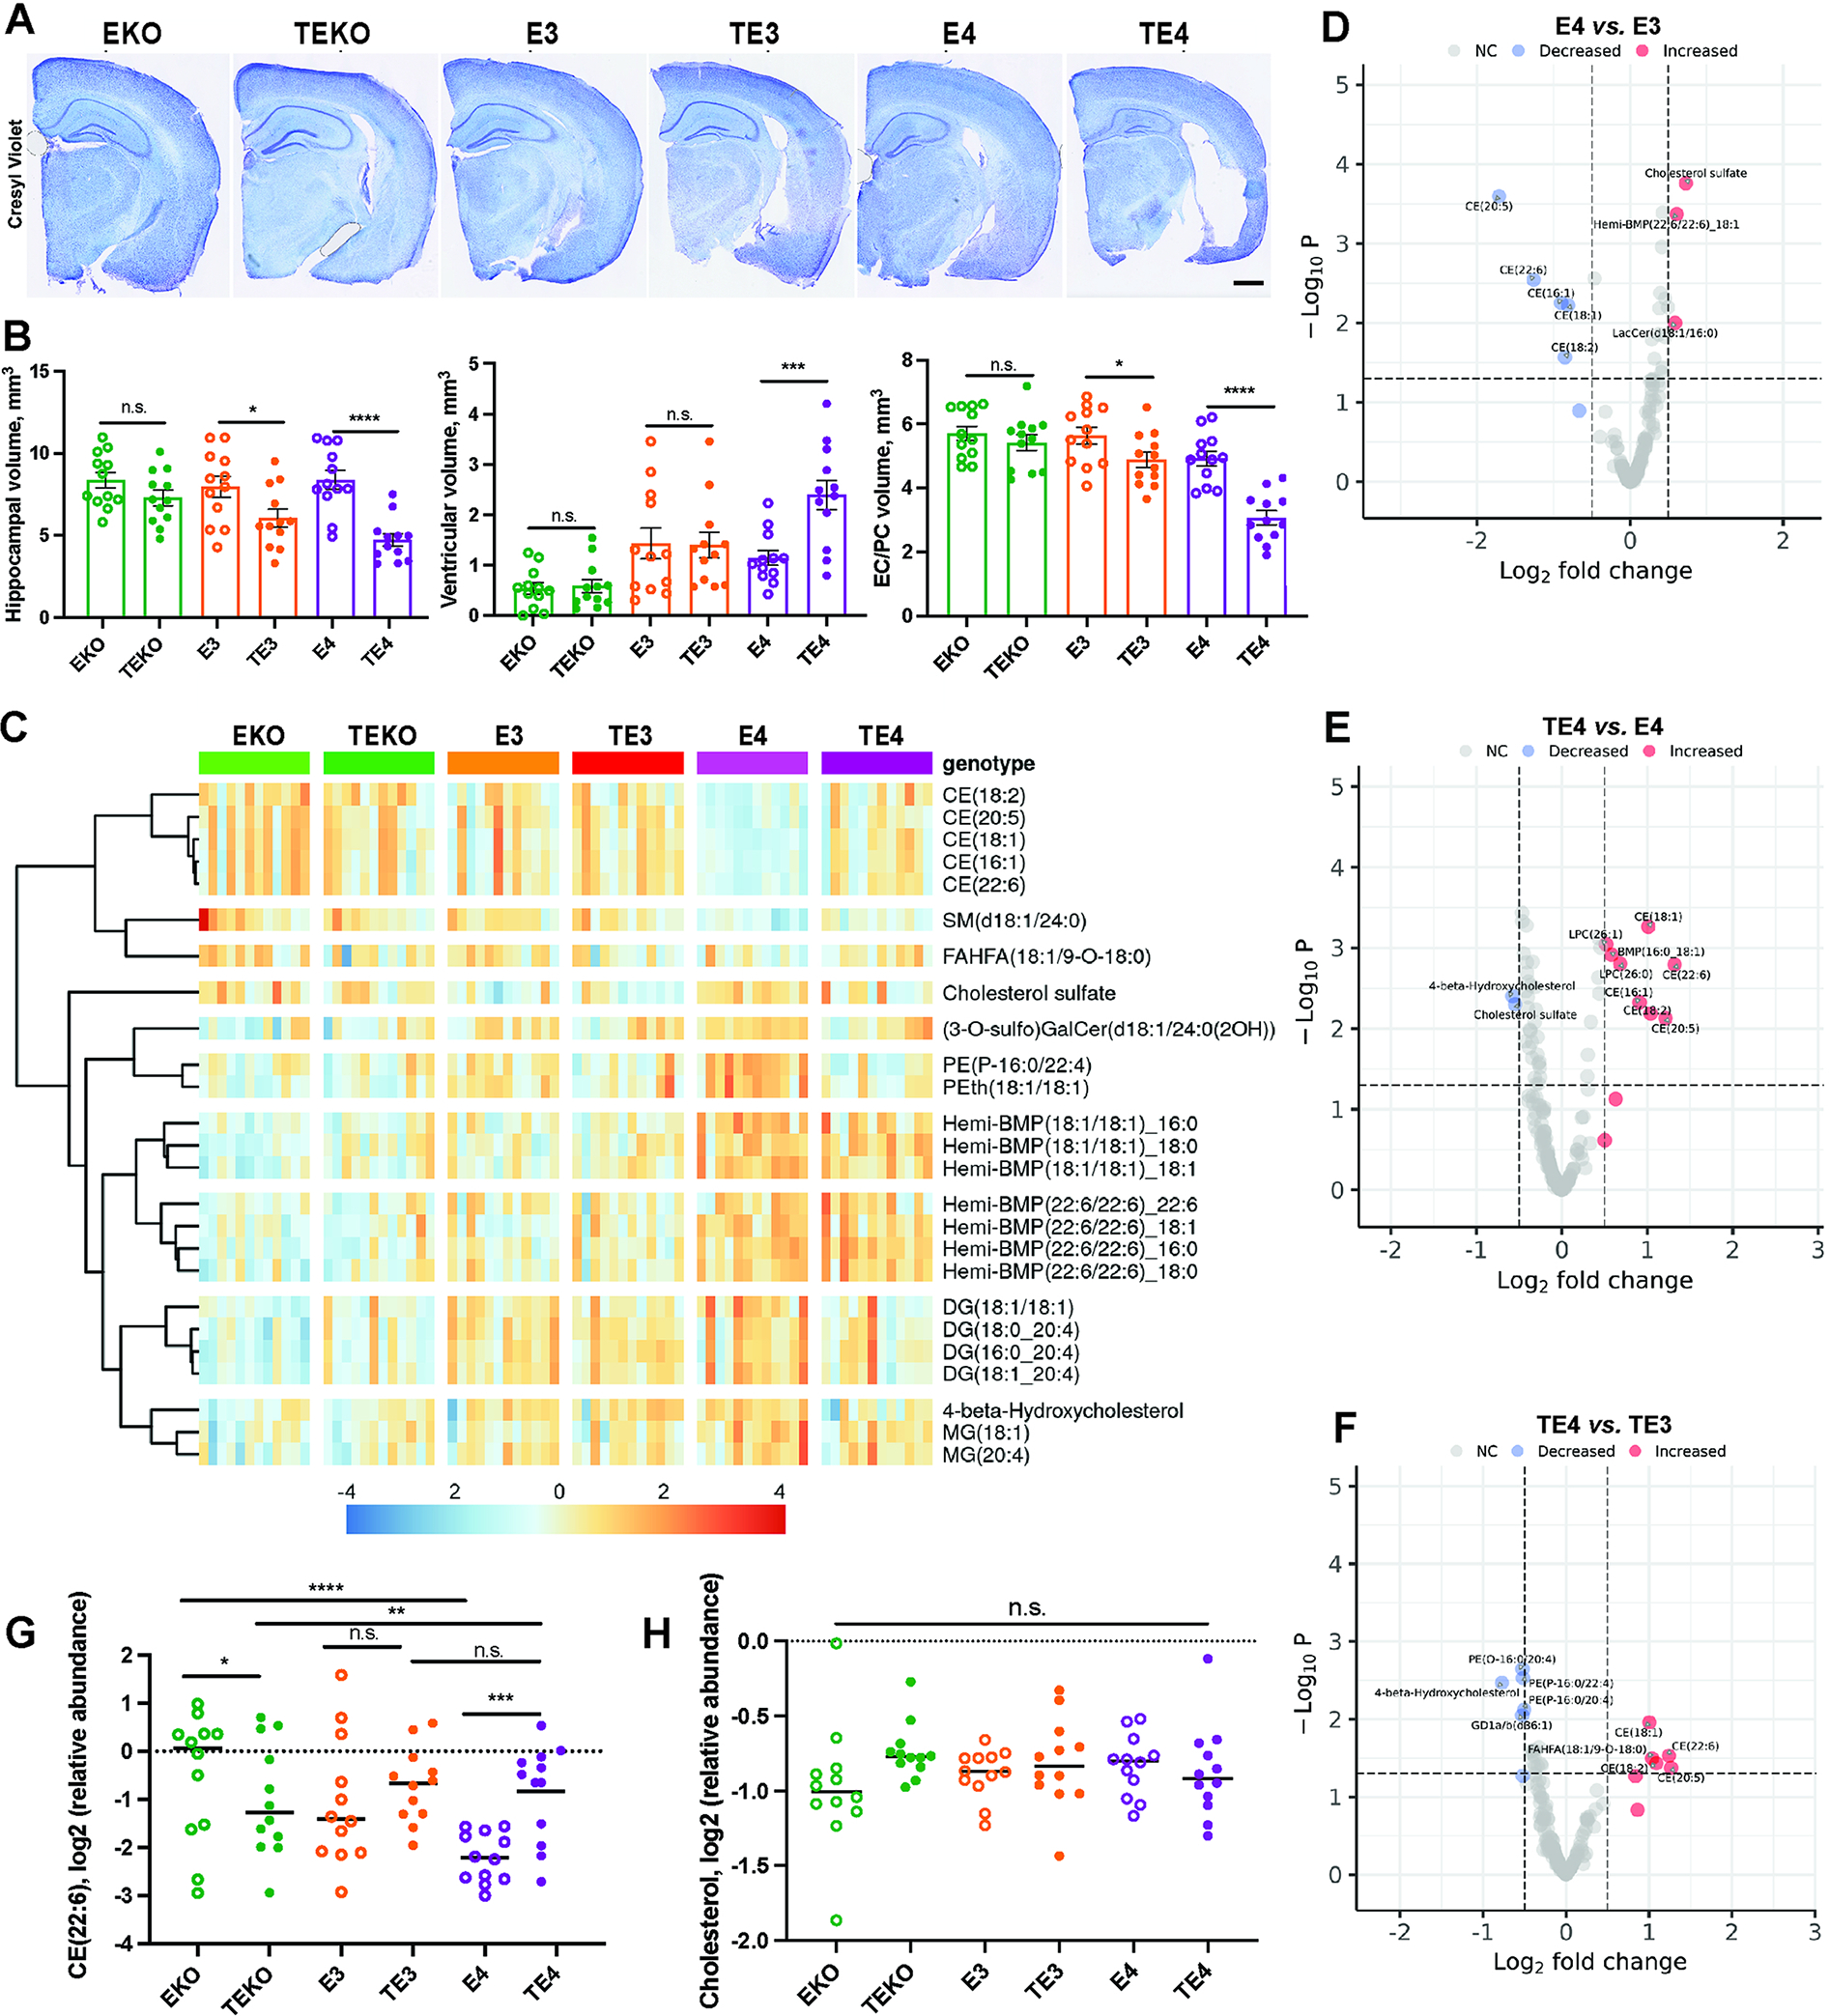
(A) Representative Cresyl Violet staining of brain sections from 9.5-month-old ApoE KO (EKO) and P301S/ApoE KO (TEKO), ApoE3 (E3) and P301S/ApoE3 (TE3), ApoE4 (E4) and P301S/ApoE4 (TE4) mice. (B) Quantification of hippocampal (left), entorhinal/piriform (EC/PC) cortex (middle), and ventricular volumes (right) from 9.5-months-old mice. (C) Heatmap of significantly changed lipids in forebrains of 9.5-months-old EKO and TEKO, E3 and TE3, E4 and TE4 mice. (D) Volcano plot of differentially abundant lipids in E4 vs. E3 mice. (E) Volcano plot of differentially abundant lipids in TE4 vs. E4 mice. (F) Volcano plot of differentially abundant lipids in TE4 vs. TE3 mice. (G-H) Relative levels of CE (22:6) (G) and free cholesterol (H) in forebrains of 9.5-month-old mice. (A-I) N=12 (6M and 6F)/genotype. p<0.05. Log2FC>0.5. 181 variables detected. Scale bar in (A): 100um. *p<0.05; ** p<0.01; *** p<0.001; **** p<0.0001. N.S. – non-significant. One-way ANOVA in B. P.adj. generated by R Statistical package for all lipids detected in lipidomic profiling analysis in G and H. See also Fig. S1–2.
Next, we examined the effects of tauopathy on the forebrain lipidome of E3, E4 and EKO mice (Fig. 1E–F and Fig. S1G–J) at 9.5 months of age. Although tauopathy did not induce drastic changes in forebrain lipidomes of TEKO and TE3 mice (Fig. S1G–I and Fig. S2A and B), TE4 mice exhibited significantly increased CE, BMP and pro-inflammatory lysophosphatidylcholine (LPC) lipid species as well as reduced cholesterol sulfate and 4-beta-hydroxycholesterol (Fig. 1E). Furthermore, we detected marked increases in CEs and significant decreases of 4-beta-hydroxycholesterol in TE4 vs. TE3 mice and DGs in TE4 vs. TEKO forebrains (Fig. 1F and Fig. S1J, respectively). We also detected a significant elevation in CEs (18:2; 20:5; 22:6) but not cholesterol in TE4 vs. E4 mice indicating that ApoE4 may promote cholesterol metabolism dysfunction in P301S mice (Fig. 1G and H). When we compared the cumulative effects of P301S and ApoE4 or ApoE KO on forebrain lipidomes, we detected significant elevations in CEs and LPCs in TE4 mice (Fig. S2C–E). Overall, these changes suggest a strong interaction between tauopathy and ApoE4 that may synergistically contribute to impaired cholesterol metabolism, endolysosomal lipid clearance, and subsequent neuroinflammation observed in 9.5-month-old TE4 mice.
ApoE4 induces neutral lipid accumulation in microglia and astrocytes of 9.5-month-old P301S mice.
To further characterize the patterns of lipid accumulation in glia of TE3, TE4, and TEKO mice, we stained neutral lipids with BODIPY and an oxidized phosphatidylcholine (oxPC) species with the E06 antibody (Fig. 2A–D and Fig. S3A–C).20 Although we did not observe detectable BODIPY staining in GFAP-positive astrocytes (data not shown), we detected large BODIPY+ inclusions within microglia of TE4 mice (Fig. 2A–B and E). Similar to our previous findings,18 the BODIPY signals were predominantly located within CD68+ phagolysosomes in microglia (Fig. 2C–E), indicating that the process of lysosomal degradation of neutral lipids, including CE, might be impaired in TE4 mice. Microglial BODIPY staining significantly correlated with brain atrophy in TE4 mice (Fig. S3D) but not TE3 or TEKO animals (data not shown). We also detected a significant increase in the E06+ oxidized lipid volumes within GFAP+ astrocytes (Fig. S3A (lower panel), S3B) and Iba1+ microglia (Fig. S3A (middle panel), S3C) of TE4 mice compared to other groups. E06 staining in astrocytes and microglia of TE4 and E4 mice significantly correlated with hippocampal and entorhinal/piriform atrophy and ventricular enlargement (Fig. S3E,F). Together, these results demonstrate that ApoE4 induces significant glial accumulation of lipids in TE4 mice.
Fig. 2. ApoE4 induces glial lipid accumulation in P301S mice.
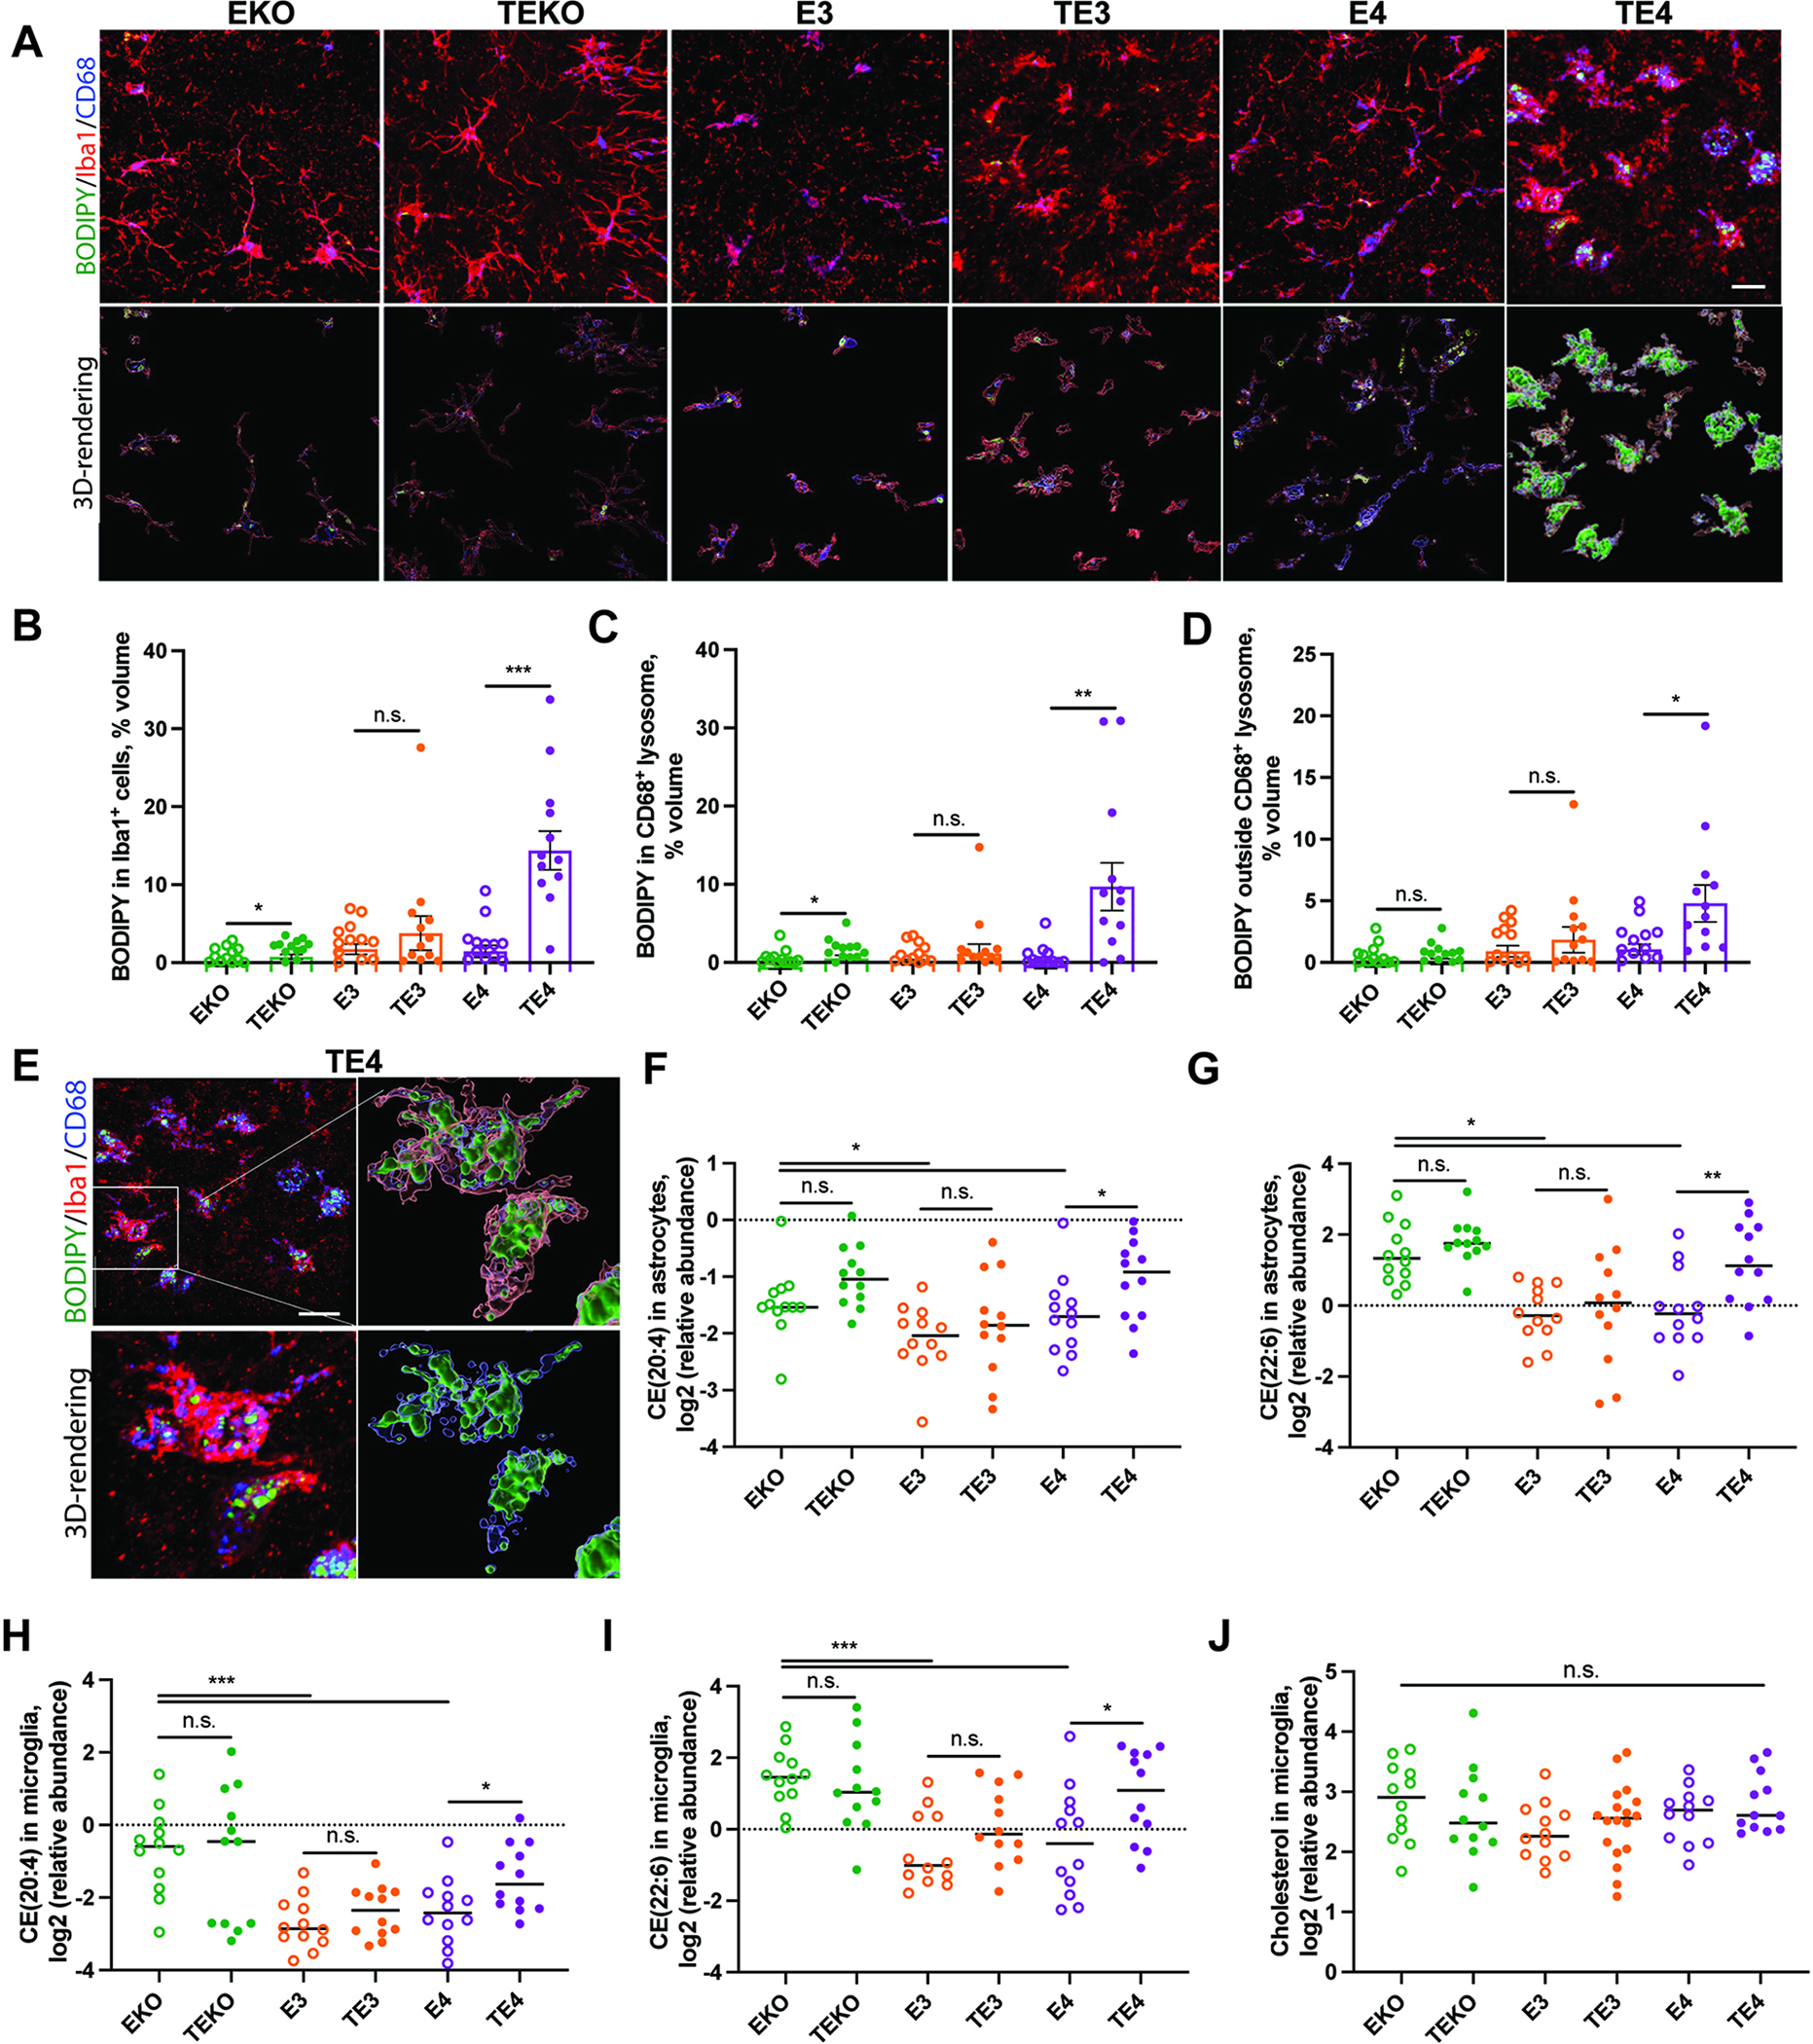
(A) Representative BODIPY (green), Iba1 (red) and CD68 (blue) co-immunostaining in hippocampus of 9.5-month-old EKO and TEKO, E3 and TE3, E4 and TE4 mice. (B-D) Quantification of BODIPY signal within Iba1 cells (B), within CD68-positive lysosomes (C) and outside CD68-positive lysosomes (D). (E) Representative BODIPY (green) staining and 3D-rendering of BODIPY signal within Iba1-positive microglial lysosomes (CD68-positive) of 9.5-month-old TE4 mice. (F-G) Relative levels of cholesteryl esters (CE) (20:4) (F) and CE (22:6) (G) in astrocytes from 9.5-month-old mice. (H-I) Relative levels of CE (20:4) (H) and CE (22:6) (I) in microglia from 9.5-month-old mice. (J) Relative levels of cholesterol in microglia from 9.5-month old mice. N=12 (6M and 6F)/genotype. Scale bar in (A): 100 um. Scale bar in (E): 5um. *p<0.05; ** p<0.01; *** p<0.001. N.S. – non-significant. One-way ANOVA in B-D. P.adj. generated by R Statistical package for all lipids detected in lipidomic profiling analysis in F and J. See also Fig. S3.
ApoE4 induces changes in cholesterol metabolism in microglia and astrocytes in 9.5-month-old P301S mice.
We next performed lipidomic analysis of FACS-isolated astrocytes and microglia (Fig. S1A). Similar to bulk forebrain lipidomic analysis (Fig. 1C), we detected notable changes in BMPs, MGs, DGs, GalCers, and other lipids in astrocytes (Fig. S2F) and microglia (Fig. S2G) from 6 groups of mice that occurred in an ApoE-isoform and tau-dependent manner. We also detected increases in several CEs in TE4 vs. E4 astrocytes (Fig. 2F,G) and microglia (Fig. 2H,I). Total cholesterol levels were unchanged in TE4 vs. E4 astrocytes (data not shown) or microglia (Fig. 2J). Overall, these results indicate that TE4 microglia accumulate CE species, likely accounting for the increase in BODIPY+ staining.
LXR agonist GW3965 induces Abca1 expression in brains of 9.5-month-old TE4 mice.
Lipid accumulation in glia is associated with increased oxidative stress and neuroinflammatory responses and, thus, may promote neurodegeneration. 3,6,7,21 Since we observed dramatic accumulation of neutral lipids/CE in glia of 9.5-month-old TE4 mice, we tested whether increasing cholesterol efflux in TE4 mice is associated with neuroprotective effects (Fig. S4A). To verify our dose and administration, we treated E4 mice with the liver-X receptor (LXR) agonist GW3965 at 10 mg/kg and measured the expression of LXR-target genes Abca1, Abca7, Abcg1, and APOE in the brain (Fig. S4B). We observed a significant 1.5–2-fold increase in Abca1 mRNA, accompanied by ~1.5–2-fold increase in Abca1 protein, but no upregulation in the other genes (Fig. S4B and C). We thus treated the E4 and TE4 mice with chow supplemented with GW3965 at 10 mg/kg from 6 months of age (i.e., the onset of tau pathology and neurodegeneration) and assessed neuropathological changes associated with tau accumulation in brain at 9.5 months (Fig. S4A).
LXR agonist GW3965 reduces neurodegeneration and improves nest-building behavior in 9.5-month-old TE4 mice.
Brain volumetric analysis (Fig. 3A) revealed a marked loss of hippocampal (Fig. 3A,B) and entorhinal/piriform cortex (Fig. 3A,C) volumes and a notable enlargement of the lateral ventricle (Fig. 3A,D) in TE4 mice on control diet (TE4-Ctrl) when compared to E4 mice on a control diet (E4-Ctrl). TE4 animals on LXR agonist diet (TE4-LXR) were significantly protected from brain atrophy in the hippocampus and entorhinal/piriform cortex (~10–25% higher volume) that was accompanied by a significant decrease in ventricular size (~30% reduction) when compared to control groups (Fig. 3A–D). We also documented significant decreases (30–40%) in degeneration of the dentate gyrus neurons (Fig. S4E, F, and G) in TE4-LXR vs. TE4-Ctrl mice. These results were corroborated by a ~30% decrease in plasma levels of the neurofilament light chain protein (NfL) in TE4-LXR vs. TE4-Ctrl (Fig. 3E).22 Plasma NfL levels significantly correlated with brain volumetric measures (Fig. S3H). Lastly, we assessed the nesting behavior of TE4 mice, an innate behavior correlated with cognitive function in mouse models of neurological damage (Fig. 3F).23,24 TE4-Ctrl mice displayed a significant decrease in nesting behavior in comparison to E4 animals. However, nest-building behavior was largely restored in TE4-LXR mice. Altogether, these results indicate that an LXR agonist protected TE4 mice from neurodegeneration and an associated behavioral deficit at 9.5 months-of-age.
Fig. 3. LXR agonist GW3965 reduces neurodegeneration, improves nesting behavior score and reduces phospho-Tau levels in 9.5-month-old TE4 mice.
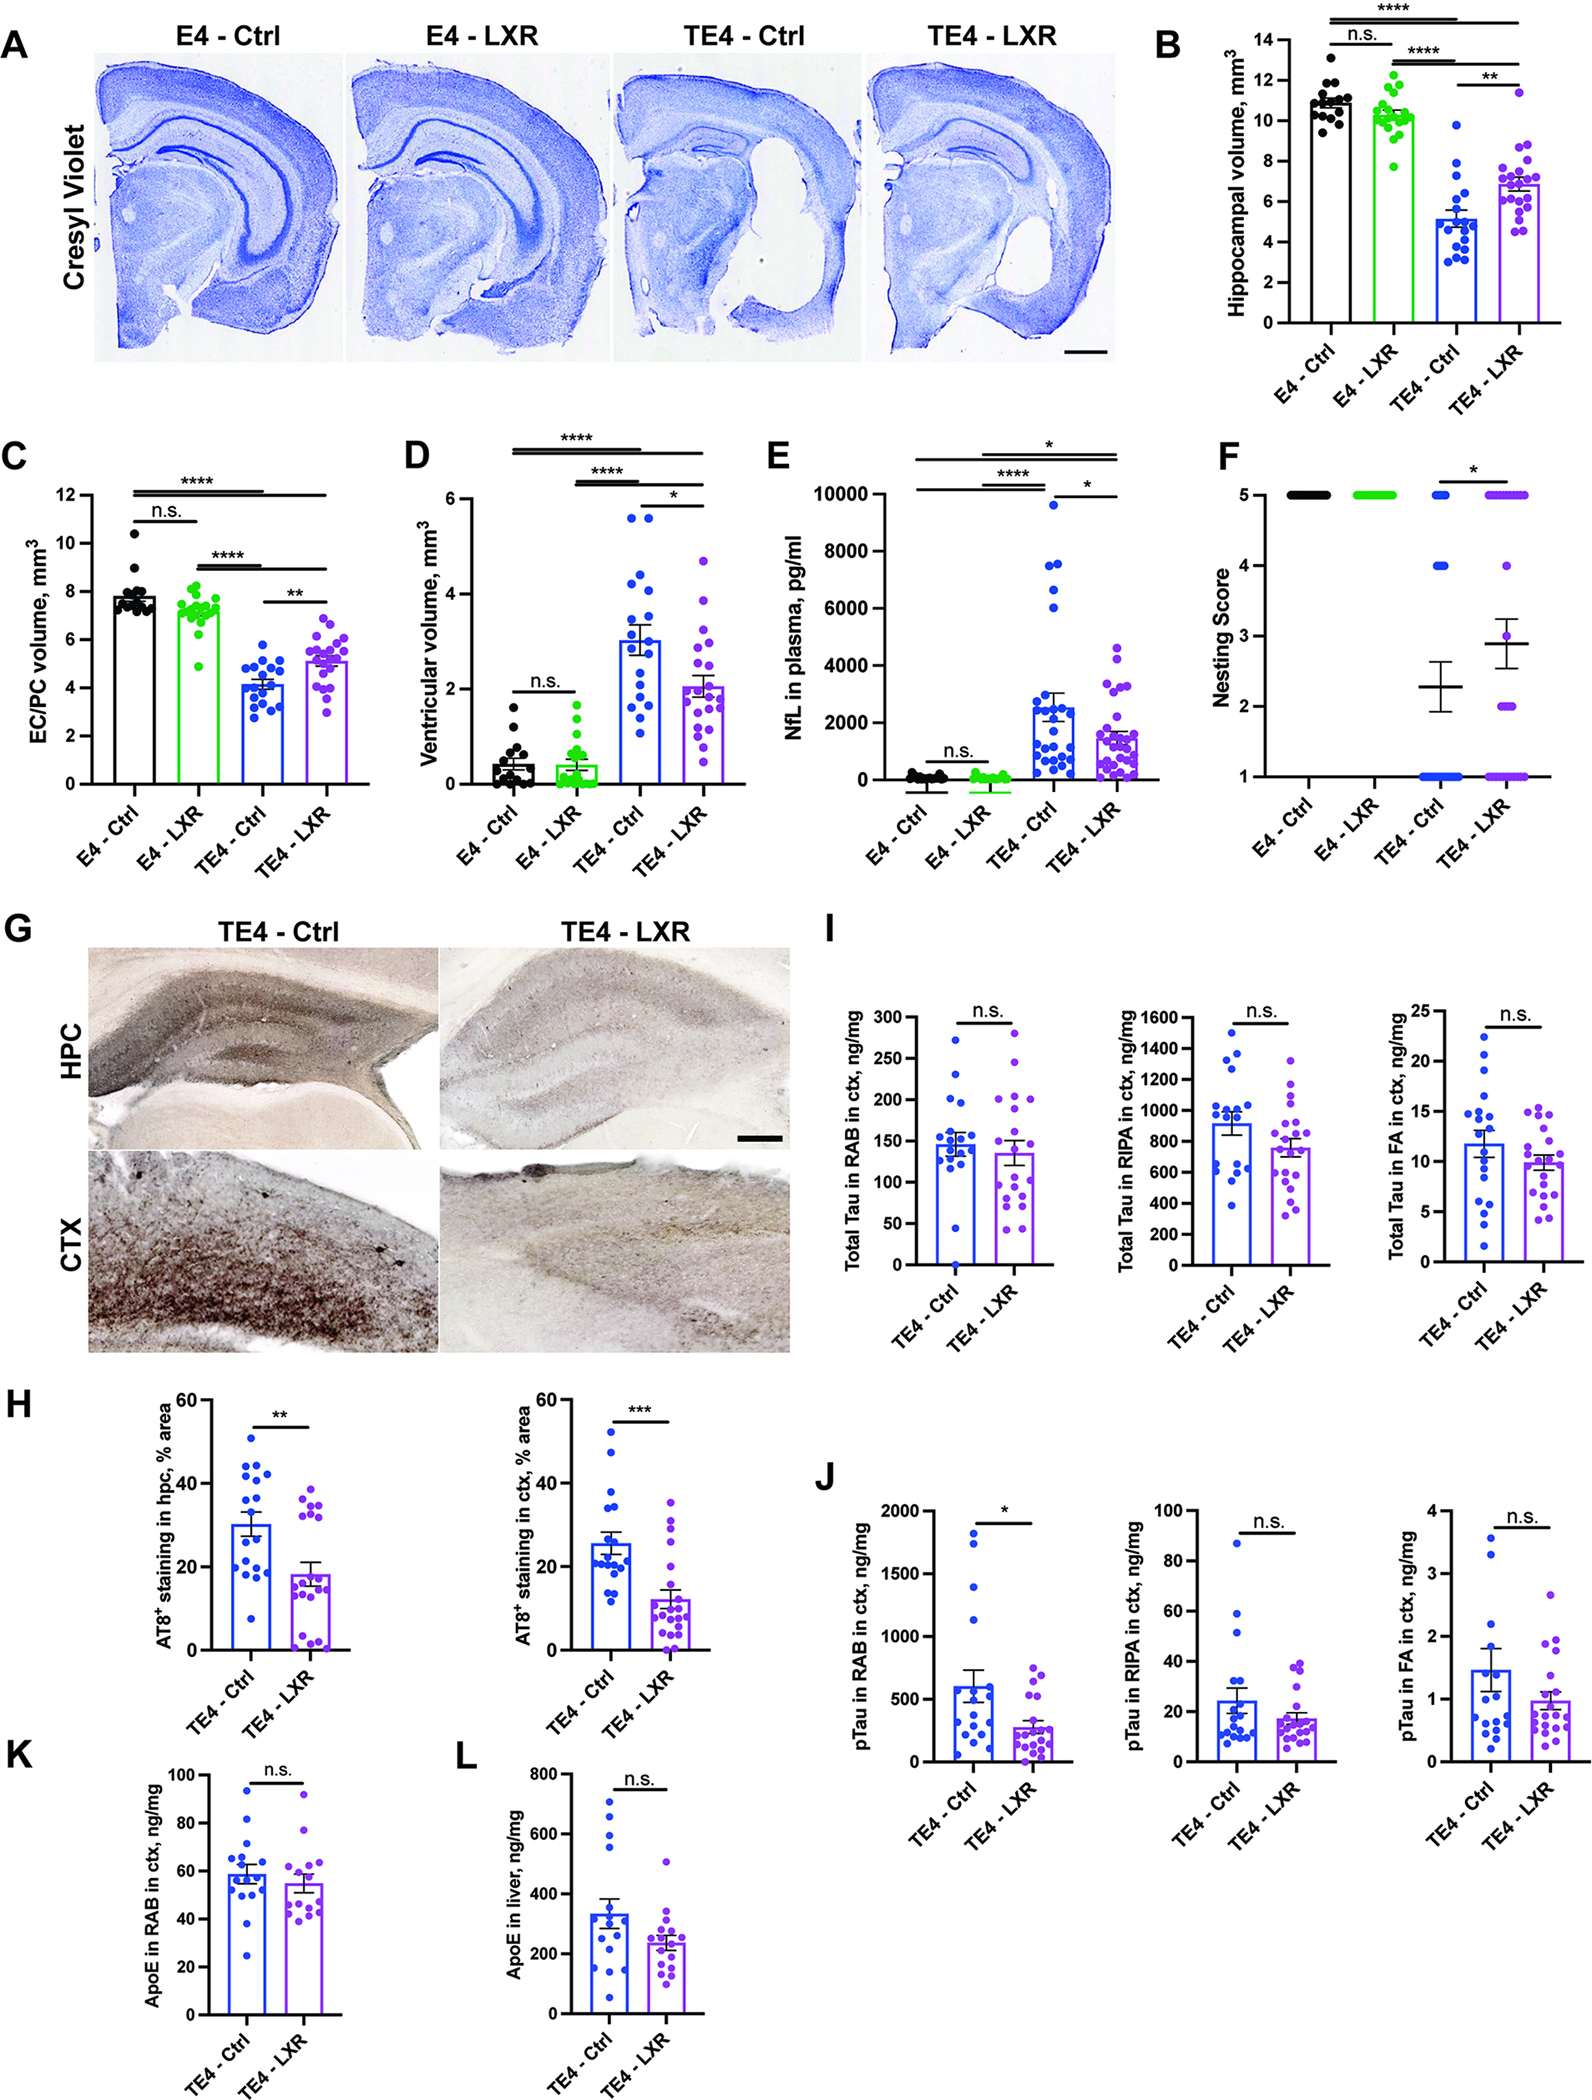
(A) Representative Cresyl Violet staining of brain sections from 9.5-month-old E4 and TE4 mice treated with either control (Ctrl) or 10mg/kg GW3965 LXR agonist diet (LXR) from 6 to 9.5 months. (B-D) Quantification of hippocampal (B), entorhinal/piriform (EC/PC) cortical (C) and ventricular brain volumes (D). (E) Neurofilament light chain (NfL) levels in plasma of 9.5-month-old mice. (F) Nesting behavior score in 9.5-month-old mice. 0 – no nestlets used; 1 - <10%, 2 – 20–50%, 3 – 50–90% nestlets used; 4 - <10% nestlets unused; 5 – 100% nestlets used. (G) Representative staining of AT8 phospho-tau in hippocampus (hpc) and cortex (ctx) of 9.5-month-old TE4 mice. (H) Quantification of AT8 signal in hippocampus and cortex. (I) Total tau levels in cortical RAB, RIPA and FA fractions. (J) Phospho-tau (AT8) levels in cortical RAB, RIPA and FA fractions. (K) hApoE levels in cortical RAB fraction. (L) hApoE levels in liver. Each dot represents one animal: N (E4 – Ctrl) = 15; N (E4 – LXR) = 15; N (TE4 - Ctrl) = 18; N (TE4-LXR) =21. Male mice. Scale Bar in A: 1 mm; G: 100 um. *p<0.05; ** p<0.01; *** p<0.001; **** p<0.0001. N.S. – non-significant. One-way ANOVA in B-E. Fisher’s exact test in F. Student’s T-Test in I-L. See also Fig. S4.
LXR agonist GW3965 reduces p-tau levels in 9.5-month-old TE4 mice.
To test the effects of LXR agonist on tau pathology, we first assessed phospho-tau by immunostaining with AT8 (Fig. 3G–H). LXR-TE4 mice had a ~40–60% reduction in AT8 staining in the hippocampus and cortex, respectively. We further assessed the levels of soluble and insoluble total tau and p-tau in the cortex (Fig. 3I–J). Although we did not observe significant changes in total tau levels (Fig. 3I), we detected a significant decrease in p-tau levels in the RAB fraction and a trend towards reductions in RIPA- and FA-soluble p-tau in the TE4-LXR group (Fig. 3J). We previously found that decreasing ApoE4 levels reduces pathological tau accumulation in TE4 mice.24,25 Additionally, some reports indicate that LXR agonists can alter ApoE expression in humans and mouse models of disease.26,27 We measured ApoE levels in RAB-soluble cortical brain fraction (Fig. 3K) and liver samples (Fig. 3L) but did not detect any significant changes in ApoE levels in response to GW3965 treatment in these tissues. Together, these results indicate that LXR agonist treatment results in a significant reduction of pathological tau in 9.5-month-old TE4 mice without affecting ApoE levels.
LXR agonist GW3965 reduces glial reactivity, T cell infiltration, and inflammation in 9.5-month-old TE4 mice.
Glial reactivity plays a crucial role in promoting tau pathology and neurodegeneration in TE4 mice.16,17,24,25,28–30 To test whether LXR agonist affects glial reactivity, we first quantified the area covered by GFAP+ staining and detected a ~30–40% decrease in hippocampus and cortex of TE4-LXR vs. TE4-Ctrl (Fig. 4A–B). The number of GFAP+ cells in hippocampus did not change in response to LXR treatment (Fig. S5A). Next, we assessed Iba-1 immunostaining that is present in microglia and infiltrated macrophages in brains of TE4 mice as well as a phago-lysosomal marker CD68 (Fig. 4C–E). LXR agonist treatment resulted in an almost ~50% reduction in Iba1 (Fig. 4C and D) and a ~60% reduction in CD68 staining (Fig. 4C and E) in hippocampus and cortex of TE4 mice. Interestingly, we also observed a significant reduction in the number of Iba1+ cells in hippocampus in TE4-LXR vs. TE4-Ctrl (Fig. S5B). These results were further corroborated by an ~70% decrease in disease-associated microglial (DAM)-associated Clec7a (Fig. 4F and G) and a significant 25–50% increase in the homeostatic microglia-associated P2ry12 (Fig. 4H and I) markers in hippocampus and cortex of TE4-LXR vs. TE4-Ctrl. These results indicate that an LXR agonist alters the overall astrocyte and microglial signature in TE4 mice.
Fig. 4. LXR agonist GW3965 reduces microglial and astrocytic activation in 9.5-month-old TE4.
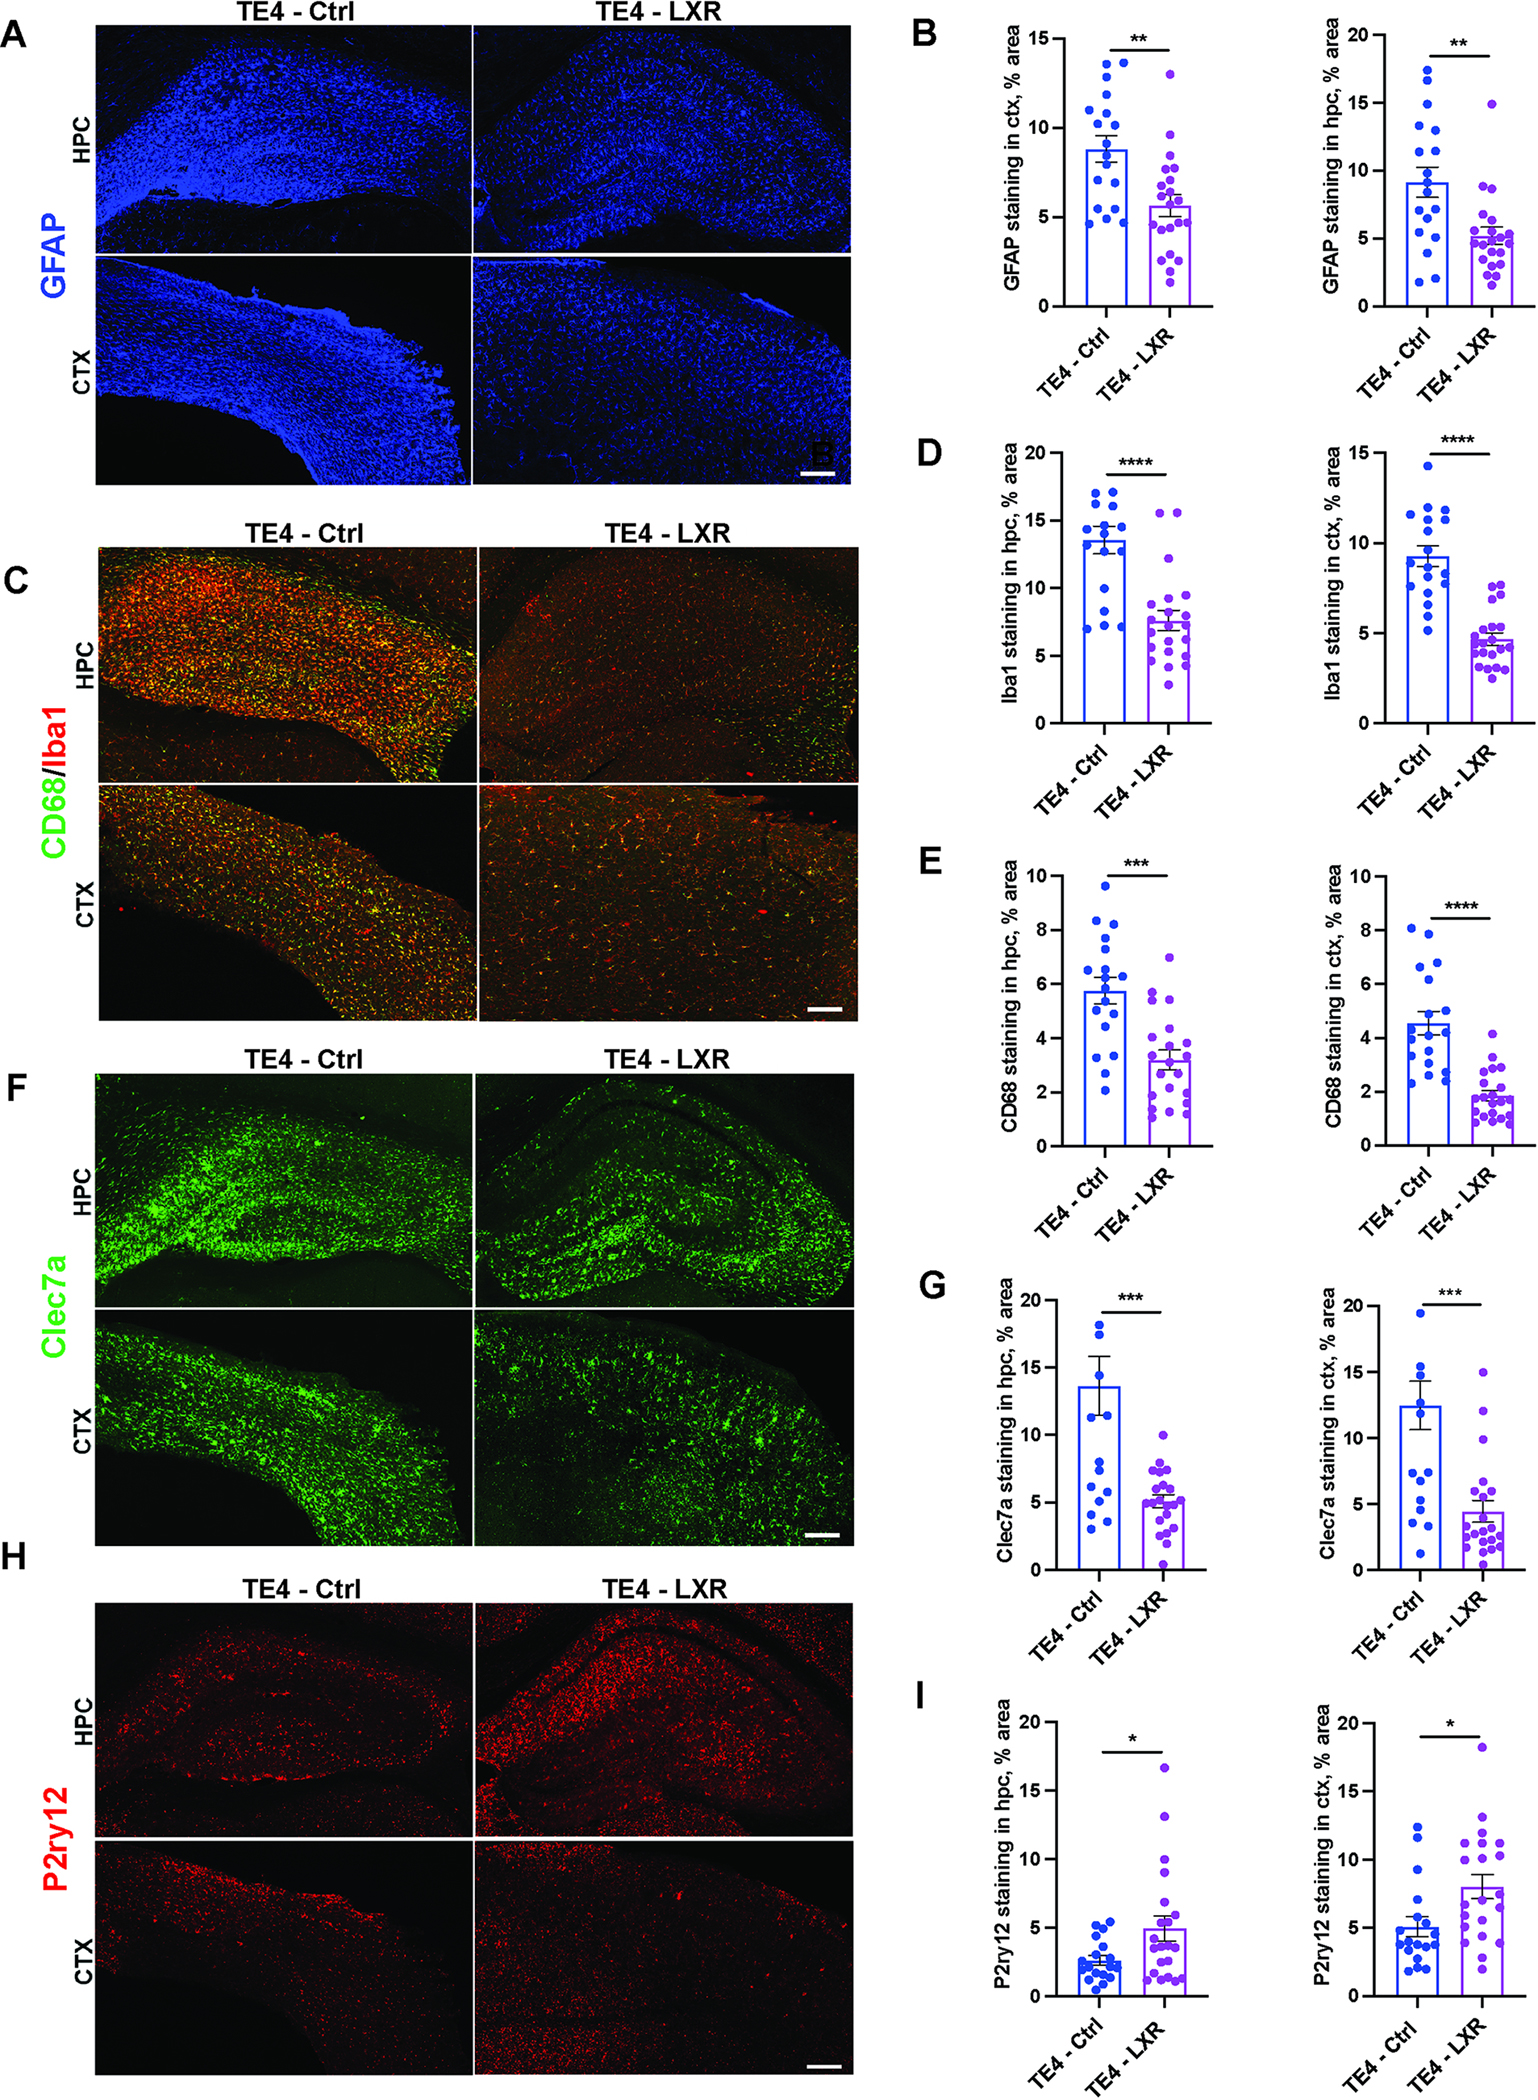
(A) Representative GFAP immunostaining in hippocampus (hpc) and cortex (ctx) of 9.5-month-old E4 and TE4 mice treated with either control (Ctrl) or 10mg/kg GW3965 LXR agonist diet (LXR) from 6 to 9.5 months. (B) Quantification of (A). (C) Representative CD68 (green) and Iba1 (red) co-immunostaining in hippocampus (hpc) and cortex (ctx). (D-E) Quantification of Iba1 (D) and CD68 stainings in (C). (F-G) Representative Clec7a immunostaining with quantification in (G). (H-I) Representative P2ry12 (red) immunostaining with quantification in (I). Each dot represents one animal: N (TE4 - Ctrl) = 18; N (TE4-LXR) =21. Male mice. Scale bar: 100 um. *p<0.05; ** p<0.01; *** p<0.001. N.S. – non-significant. Student’s T-Test.
We recently demonstrated that T cells are elevated in brain regions with tau pathology and contribute to neurodegeneration in TE4 mice.31 We found a marked decrease in the number of CD8+ T cells in the dentate gyrus of 9.5-month-old TE4-LXR compared to TE4-Ctrl (Fig. S5C–D). The number of T cells in this area significantly correlated with the degree of hippocampal (Fig. S5E) and dentate gyrus degeneration (Fig. S5F) as well as with the amount of BODIPY staining in Iba1+ microglia in hippocampus of TE4 mice (Fig. S5G).
Lastly, we assessed levels of various inflammation-associated cytokines in the hippocampus of 9.5-month-old TE4 and E4 mice (Fig. S5H–S). We detected marked increases in multiple cytokines/chemokines (e.g., IL1β, IL6, IL10, TNFα, IFNα IFNβ, CXCL1) in TE4-Ctrl vs E4-Ctrl mice, and significant decreases in cytokine/chemokines in TE4-LXR vs TE4-Ctrl mice (including IL1β, IFNα, Ccl3, Clcl4, Ccl5, and CXCL10 (Fig. S5H, L, P–S)). Combined, these results indicate that LXR agonist treatment reduces inflammation and alters the microglial and astrocyte signature, and decreases T cell infiltration in 9.5-month-old TE4 mice.
LXR agonist GW3965 reduces synaptic loss in 9.5-month-old TE4 mice.
We previously reported that TE4 mice exhibit severe synaptic loss associated with an increase in microglial synaptic engulfment in the CA3 area of hippocampus by 9.5 months of age.24,25 To test whether LXR agonist affected synapse loss in TE4 mice, we first quantified the area occupied with synaptophysin staining in the CA3 hippocampal region in E4-Ctrl, E4-LXR, TE4-Ctrl and TE4-LXR mice (Fig. 5A and C). While TE4-Ctrl exhibited a significant ~20% decrease in synaptophysin staining when compared to E4-Ctrl or E4-LXR, TE4-LXR mice were largely protected from the loss of synaptophysin staining (Fig. 5A and C). We next assessed the number of co-localized puncta (Fig. 5B and C) and individual pre-synaptic (synaptophysin-positive, Fig. 5B and E) and post-synaptic (PSD95-positive, Fig. 6B and G) puncta in the CA3 area. While the number of individual synaptic puncta and co-localized puncta were reduced in TE4-Ctrl compared to E4-Ctrl and E4-LXR mice, co-localized PSD95/synaptophysin synapses were partially rescued in TE4-LXR mice (Fig. 6B, D–E, G). Microglia have been reported to prune synapses, and in neurodegenerative conditions activated microglia were reported to engulf larger amounts of synaptic material.32,33 Since the microglial signature was altered in TE4-LXR mice (Fig. 5), we sought to estimate the microglial synapse engulfment in the hippocampus TE4-LXR and TE4-Ctrl mice by immunostaining (Fig. 5F, H–I). We observed significant increases in synaptophysin (Fig. 5H) and PSD95 (Fig. 5I) volumes in Iba1+ cells of TE4-Ctrl mice compared to E4-Ctrl and E4-LXR animals. The volume of synaptic marker staining in Iba1+ cells of TE4-LXR mice was decreased by almost ~ 50% in comparison to TE4-Ctrl (Fig. 5H–I). Together, these results suggest that LXR agonist diet protects TE4 mice from microglial-mediated synaptic loss.
Fig. 5. LXR agonist GW3965 reduces synaptic loss in 9.5-month-old TE4 mice.
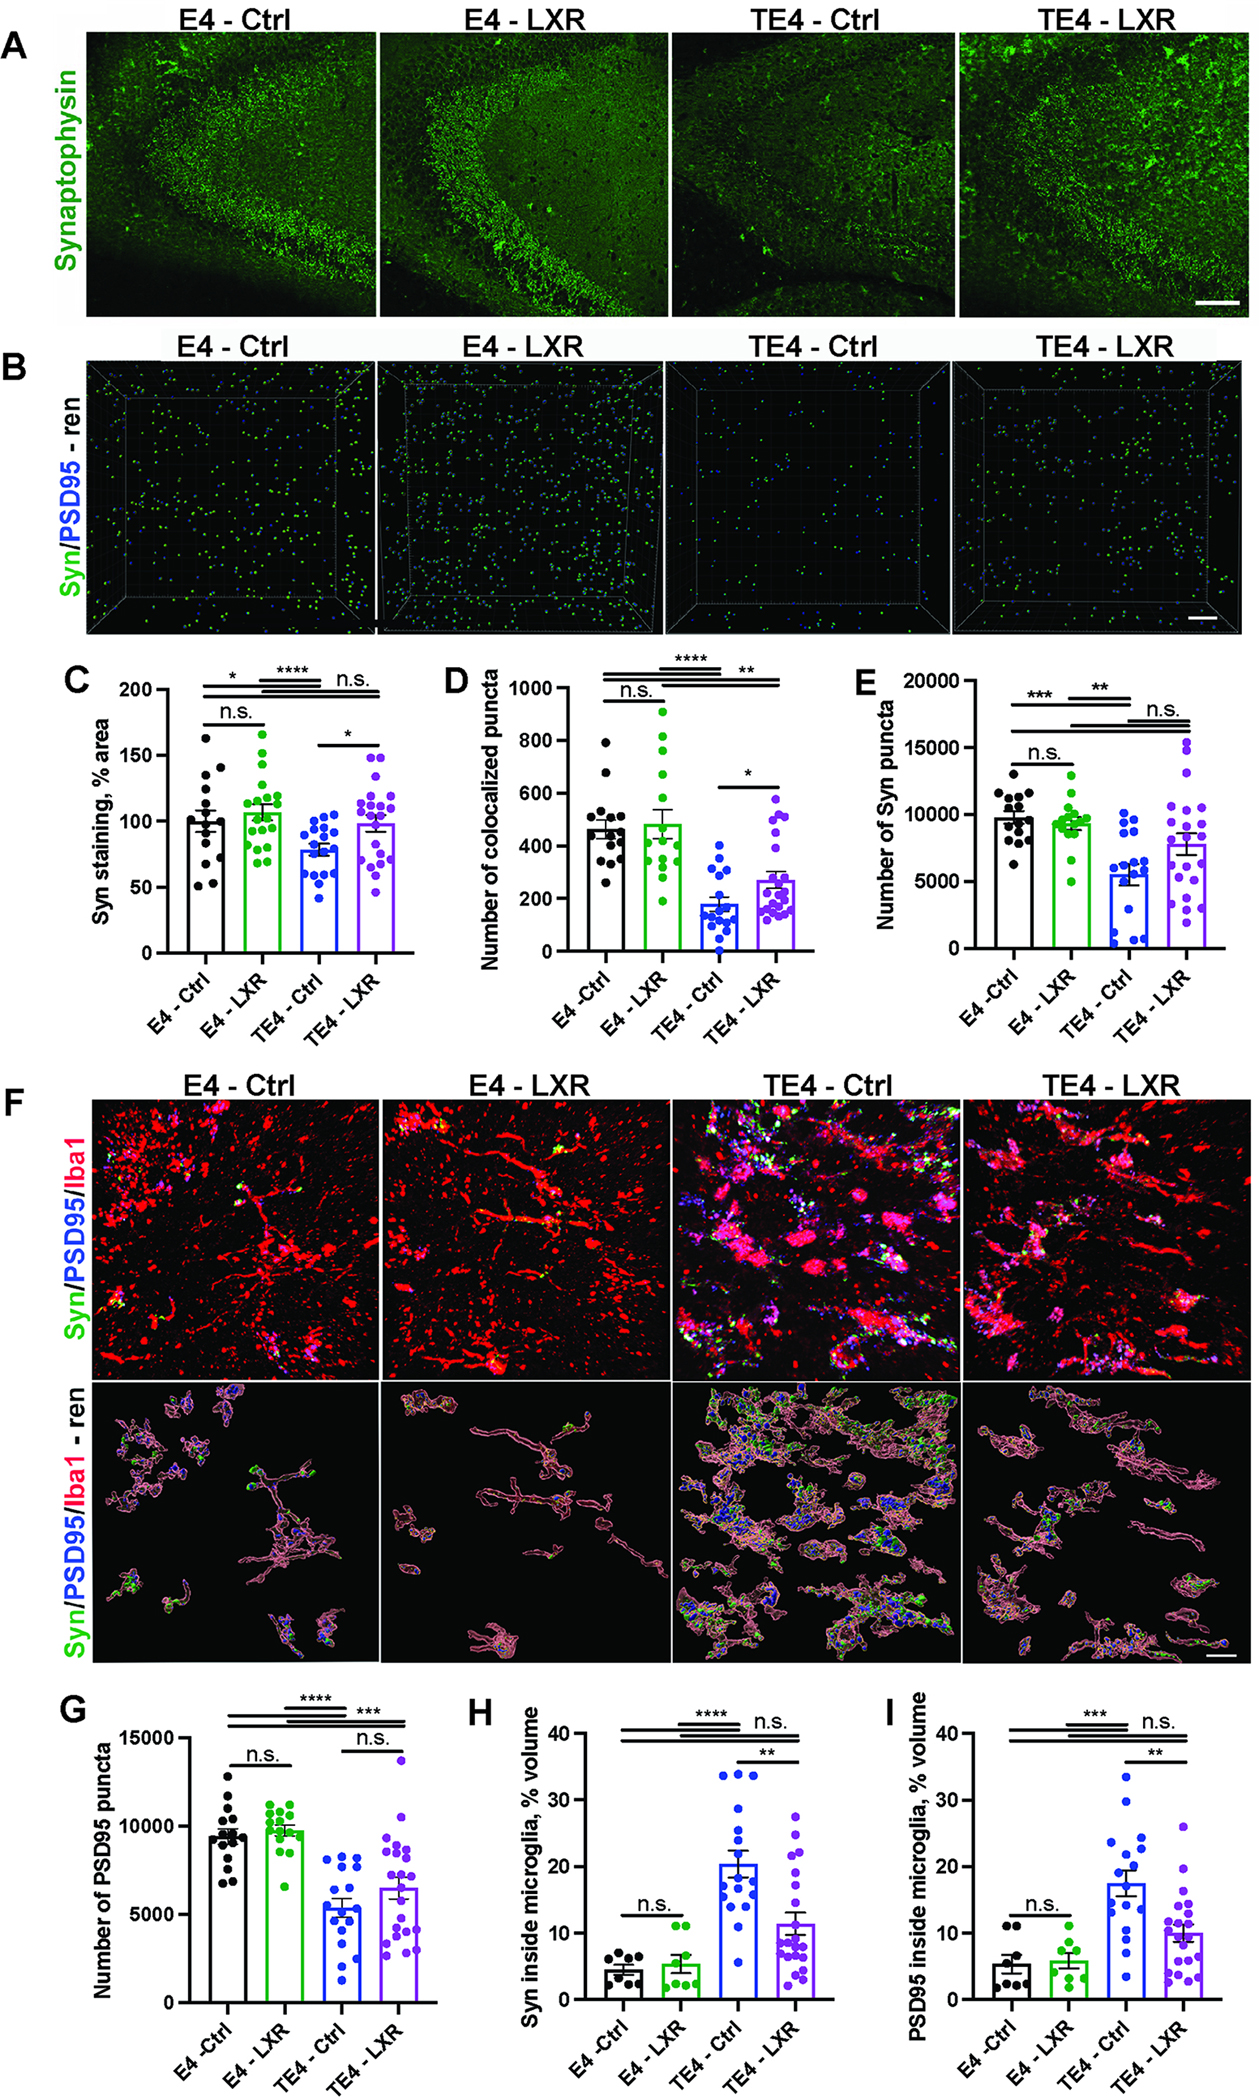
(A and C) Representative synaptophysin immunostaining in in CA3 area of hippocampus from 9.5-month-old E4 and TE4 mice treated with either control (Ctrl) or 10mg/kg GW3965 LXR agonist (LXR) and its quantification (C). (B) Representative 3D-rendering of co-localized synaptophysin (Syn) and PSD95 puncta in hippocampal CA3 area. (D-E and G) Quantification of co-localized puncta (D), synaptophysin (Syn) (E) or PSD95 (G) in CA3 area of hippocampus. (F) Representative synaptophysin (Syn, green) and PSD95 (blue) inside Iba1-postive microglia (red) from 9.5-month-old mice with 3D-rendering. (H-I) Quantification of synaptophysin (Syn) (H) and PSD95 (I) volumes within Iba1-positive microglia. Each dot represents one animal: N (E4 – Ctrl) = 15; N (E4 – LXR) = 15; N (TE4 - Ctrl) = 18; N (TE4-LXR) =21. Male mice. Scale bar in A: 100 um; B: 5 um; F: 50um. *p<0.05; ** p<0.01; *** p<0.001. N.S. – non-significant. One-way ANOVA in C-E, G-I.
Fig. 6. LXR agonist in 9.5-month-old TE4 mice induces changes in inflammatory response and cholesterol metabolism at a gene expression level.
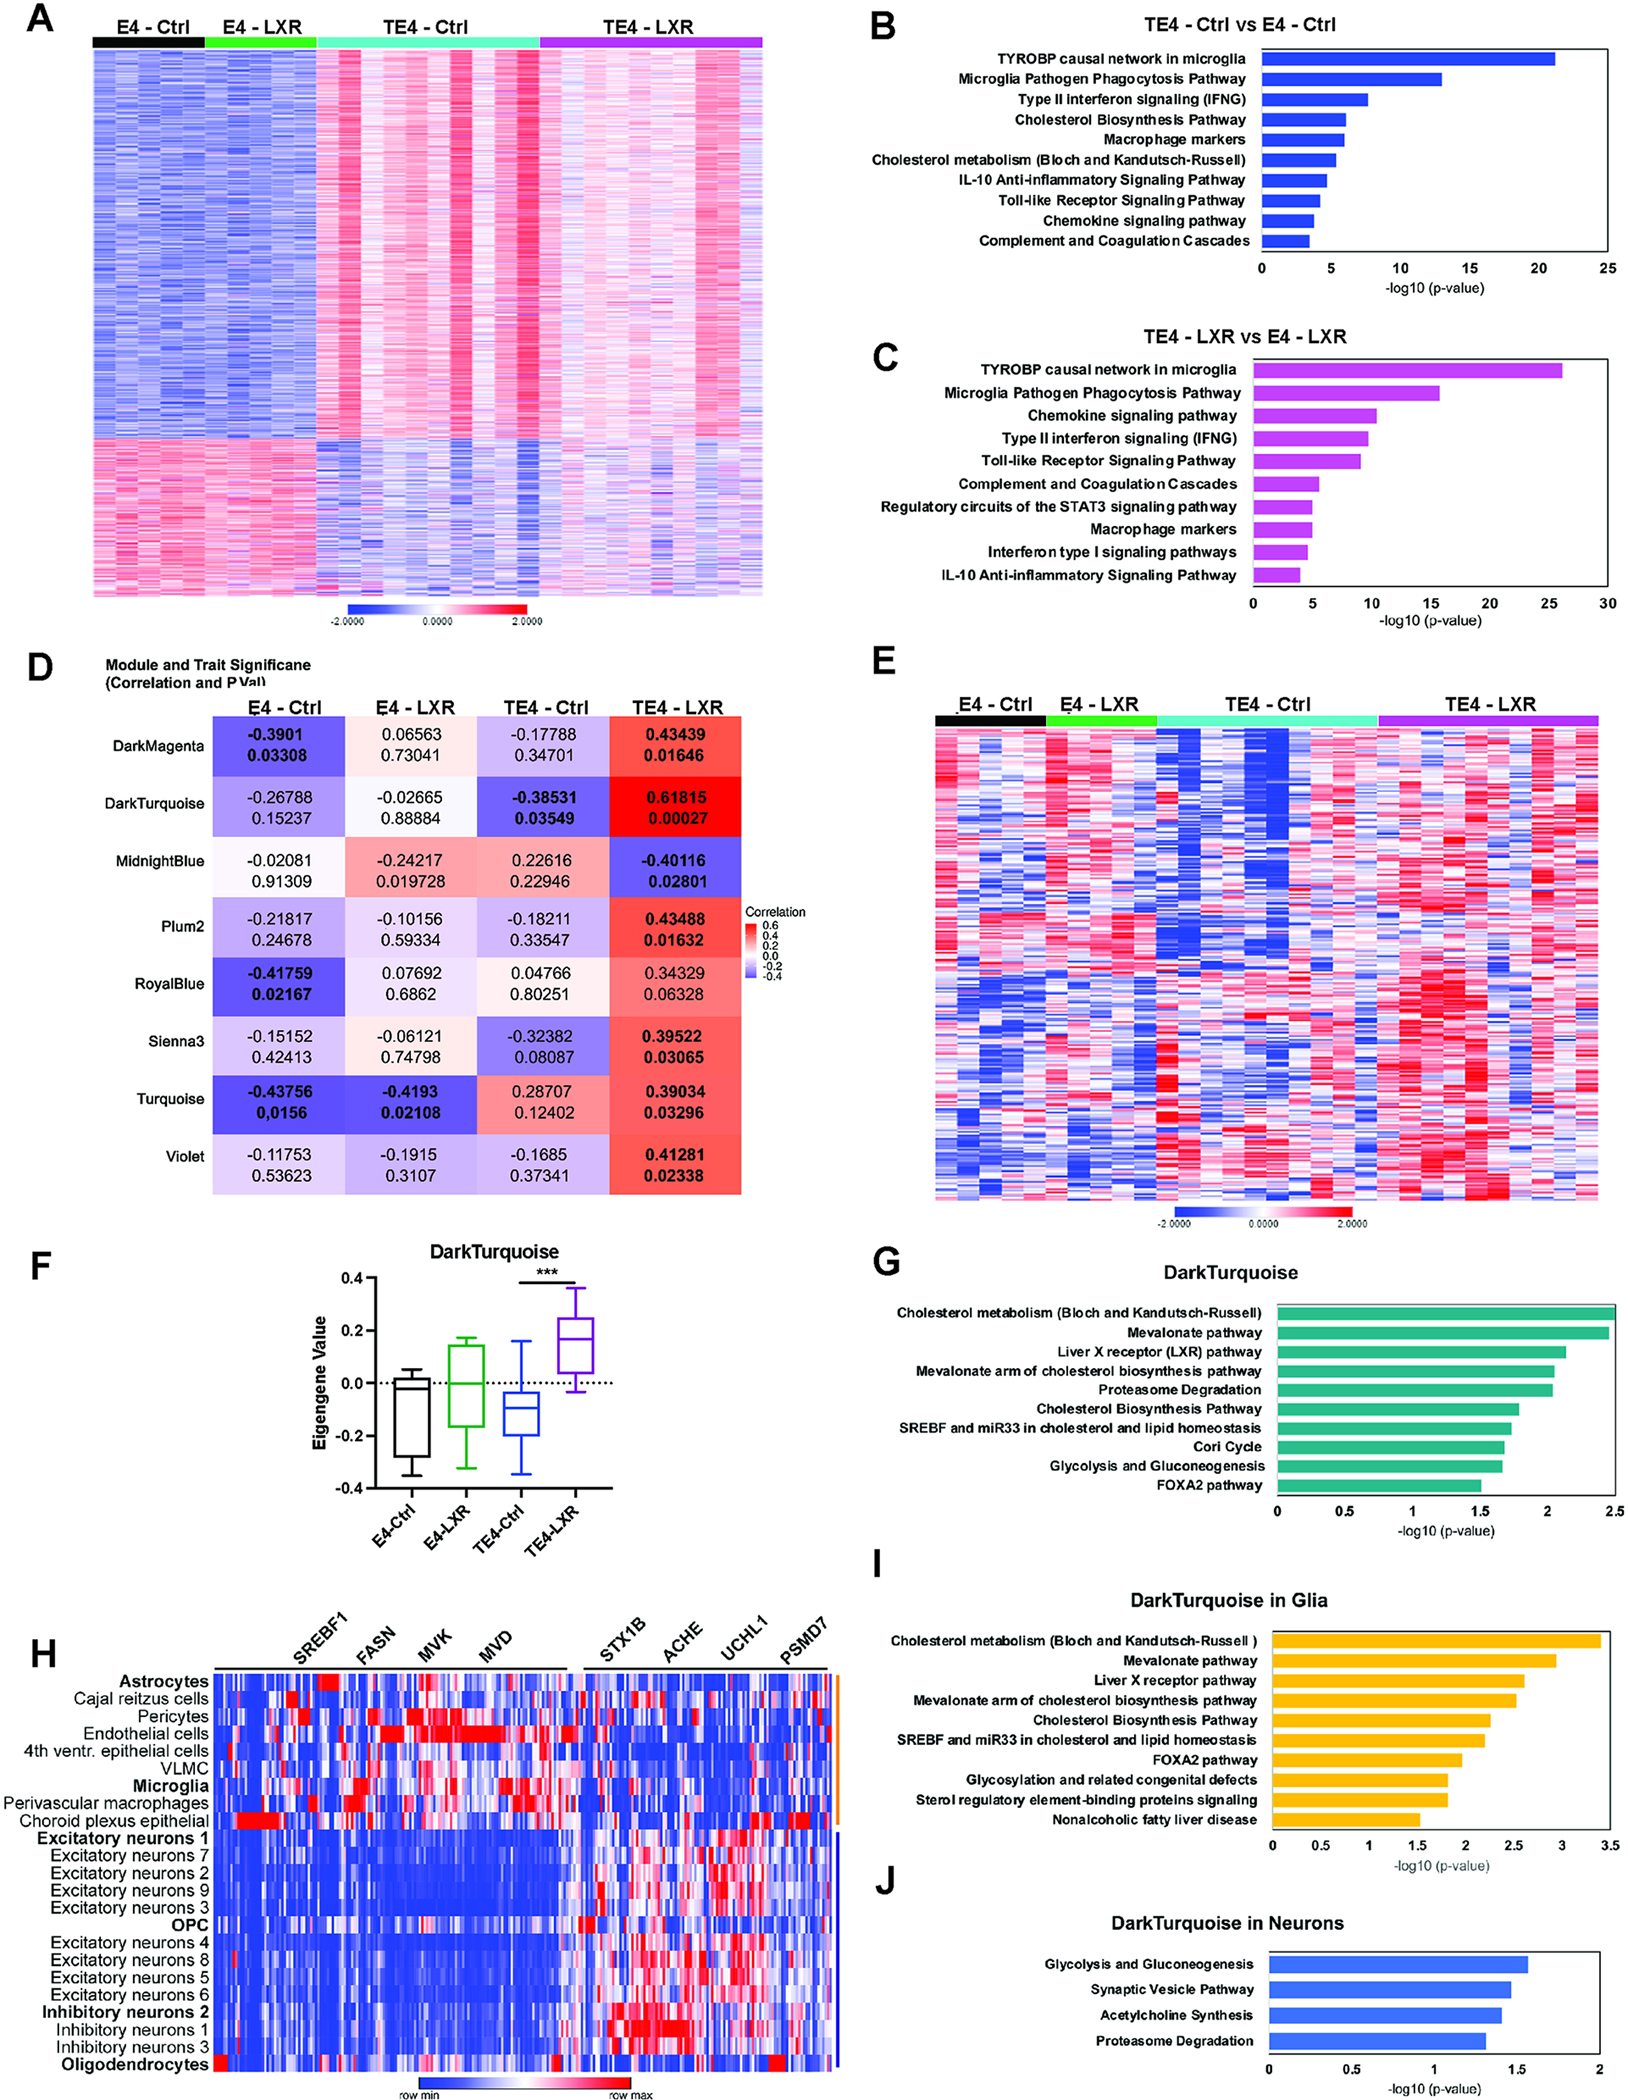
(A) Representative heatmap of 1738 DEGs between TE4 vs. E4 mice treated with control (Ctrl) or GW3965 (LXR) diet from 6 to 9.5 months. P.adj. <0.05. N(E4/treatment) =5; N(TE4/treatment) =10. Male mice. (B) Top 10 biological pathways (WikiPathway) enriched in TE4-Ctrl vs. E4-Ctrl with P.adj. <0.05. (C) Top 10 biological pathways (WikiPathway) enriched in TE4-LXR vs. E4-LXR with P.adj. <0.05. (D) Representative table of 8 WGCNA modules enriched in E4 and TE4 mice on control or LXR diets. (E) Representative heatmap of 266 genes from Dark Turquoise module identified by WGCNA analysis. (F) Average eigengene values from Dark Turquoise cluster. (G). Top 10 biological pathways (WikiPathway) from Dark Turquoise module upregulated in TE4-LXR mice but downregulated in TE4-Ctrl animals with P.adj. <0.05. (H) Heatmap, illustrating expression of 266 genes from Dark Turquoise module in TE4-LXR mice at single-cell level. Cells are clustered in two separate groups (yellow and blue) by gene expression. (I) Top 10 biological pathways (WikiPathway) enriched in TE4-LXR non-neuronal cells (including astrocytes and microglia, yellow cluster) with P.adj. <0.05. (J) Top 4 biological pathways (WikiPathway) enriched in TE4-LXR neuronal cells and OPC/oligodendrocytes (blue cluster) with P.adj. <0.05. See also Fig. S5–7.
LXR agonist alters glial transcriptional response in 9.5-month-old TE4 mice.
To further understand the impact of LXR activation on tau pathology and neurodegeneration at a transcriptional level, we performed RNA sequencing of hippocampal tissues from a subset of E4 (N=5/treatment) and TE4 (N=10/treatment) male mice treated with control or LXR diets from 6 to 9.5 months (Fig. 6 and Suppl. Fig. S6). After using principal component analysis (PCA), we detected 3 distinctive groups of samples by gene expression: E4 mice treated with control or LXR agonist diets (clustered on the left of the graph), TE4-Ctrl mice (clustered on the right of the graph), and predominantly TE4-LXR animals (middle), suggesting an intermediate gene expression phenotype between TE4-Ctrl and E4 mice (Fig. S6A). Using an adjusted p-value < 0.05, we identified 1738 DEGs in TE4-Ctrl vs. E4-Ctrl and 1464 DEGs in TE4-LXR vs. E4-LXR (Fig. 6A and Fig. S6B). We did not observe any significant differences in E4-LXR vs. E4-Ctrl and TE4-LXR vs. TE4-Ctrl comparisons. The majority of DEGs in TE4-Ctrl vs. E4-Ctrl (1471 out of 1738 genes) and TE4-LXR vs. E4-LXR were upregulated (1149 out of 1464 genes).
Functional annotation of the DEGs common to both TE4-Ctrl and TE4-LXR groups with WikiPathways identified pathways involved in microglia/macrophage activation and phagocytosis; interferon (type I and II) responses; complement and coagulation cascades; IL10, toll-like receptor and chemokine signaling pathways; consistent with a significant upregulation of immune responses in 9.5-month-old TE4 mice (Fig. 6B and C). We also detected significant enrichment in cholesterol biosynthesis and metabolism pathways in TE4-Ctrl vs. E4-Ctrl group (Fig. 6B).
We analyzed the patterns of expression of disease-associated astrocytes (DAA) and DAM in E4 and TE4 mice on control or LXR diets (Fig. S6C and D).34–36 We observed dramatic increases in expression of DAA genes in TE4-Ctrl vs. E4 mice on either control or LXR diets, including Aqp4, C4b, Clu, S100b and GFAP (Fig. S6C). Interestingly, the expression of these DAA genes trended towards a decrease in the TE4-LXR group. Similarly, we detected dramatic upregulation in DAM genes in TE4-Ctrl vs. E4-Ctrl and E4-LXR animals, including Cx3cr1, Clec7a, Trem2 (Fig. S5D). Together these results indicate that LXR agonist treatment leads to a reduction in reactive astrocytes and an alteration in the microglial/macrophage signature in 9.5-month-old TE4 mice.
To further understand the impact of LXR activation on tau pathology and neurodegeneration on cell type-specific gene expression, we performed snRNA sequencing of hippocampal tissues (Fig. S6E–G and S7). We obtained transcriptional data for 73,824 nuclei that were mapped onto 23 distinct clusters (Fig. S6E–G). We detected qualitative decreases in proportions of excitatory neuron populations (ex-neurons 1, 2, 3 and 4) in TE4-Ctrl vs. E4-Ctrl and E4-LXR groups consistent with the neurodegeneration in 9.5-month-old TE4 mice (Fig. S6G). Interestingly, these changes appeared attenuated in TE4-LXR mice, consistent with attenuated neurodegeneration. We also detected significant expansion of microglia in the TE4-Ctrl group when compared to E4 mice on either diet, which again appeared partially attenuated in TE4-LXR mice.
We next focused on mRNA changes in microglia and astrocytes in LXR-treated mice (Fig. S7). After re-clustering the individual astrocyte populations, we detected 2 populations of astrocytes (Fig. S7A–B). We found an increase in Cluster 1 astrocytes in TE4-Ctrl vs. E4-Ctrl and E4-LXR group which KEGG analysis identified as enriched for genes regulating Alzheimer’s disease, ubiquitin-mediated proteolysis, oxidative phosphorylation, lysosome and endocytosis pathways (Fig. S7B–E). Interestingly, astrocytes from TE4-LXR mice exhibited a trend towards reduction in Cluster 1 and an increase in Cluster 0 astrocytes, further suggesting attenuated astrocyte reactivity in TE4 mice.
In the microglia/macrophage cell population, we observed 5 distinctive clusters (Fig. S7F–O). These included “homeostatic” Cluster 2 a “reactive” Cluster 0 (KEGG ribosome and lysosome, oxidative phosphorylation, sphingolipid metabolism and steroid biosynthesis); a “DAM”-like microglia Cluster 1 (KEGG Alzheimer`s disease; lysosome and endocytosis, ubiquitin-mediated proteolysis and oxidative phosphorylation), and an interferon-responsive Cluster 3 (KEGG JAK-STAT pathway, endocytosis, ribosome, and chemokine signaling) (Fig. S7G–O). Interestingly, we detected a dramatic expansion of Clusters 0, 1 and 3 in TE4-Ctrl vs. E4-Ctrl and a noticeable reduction in the Cluster 2 microglial population suggesting an activation of a reactive DAM-like microglia/macrophage program in 9.5-month-old TE4 mice when compared to E4 (Fig. S7G). Interestingly, the LXR agonist treatment in TE4 mice induced a shift towards a decrease in Clusters 1 and 3 and a noticeable increase in Clusters 0 and 2. Together, these results suggest that increasing LXR gene expression in glia might drive transcriptional changes in microglia and astrocytes, resulting in reduction of neuroinflammatory responses in TE4 mice.
WGCNA reveals changes in cholesterol metabolism in LXR agonist - treated 9.5-month-old TE4 mice.
We next performed weighted-gene co-expression network analysis (WGCNA) to further study the effects of LXR agonist on E4 and TE4 mice (Fig. 6D–E).37,38 One module, dark turquoise, exhibited a robust and statistically significant positive correlation with the TE4-LXR group, and was also negatively correlated with the TE4-Ctrl group (Fig. 7D and E). Analysis of average eigengene values from the dark turquoise module revealed a significant increase of eigengene in TE4-LXR vs. TE4-Ctrl mice (Fig. 6F). Pathway analysis of the 266 genes in the dark turquoise module using WikiPathway annotations revealed enrichment for cholesterol metabolism and cholesterol biosynthesis, mevalonate pathway, LXR and SREBP1 pathways, as well as proteasome degradation, indicating a significant activation of cholesterol metabolism and efflux in TE4-LXR vs. TE4-Ctrl mice (Fig. 6G).
Fig. 7. LXR agonist GW3965 reduces lipid and CEs accumulation in forebrains of 9.5-month-old TE4 mice.
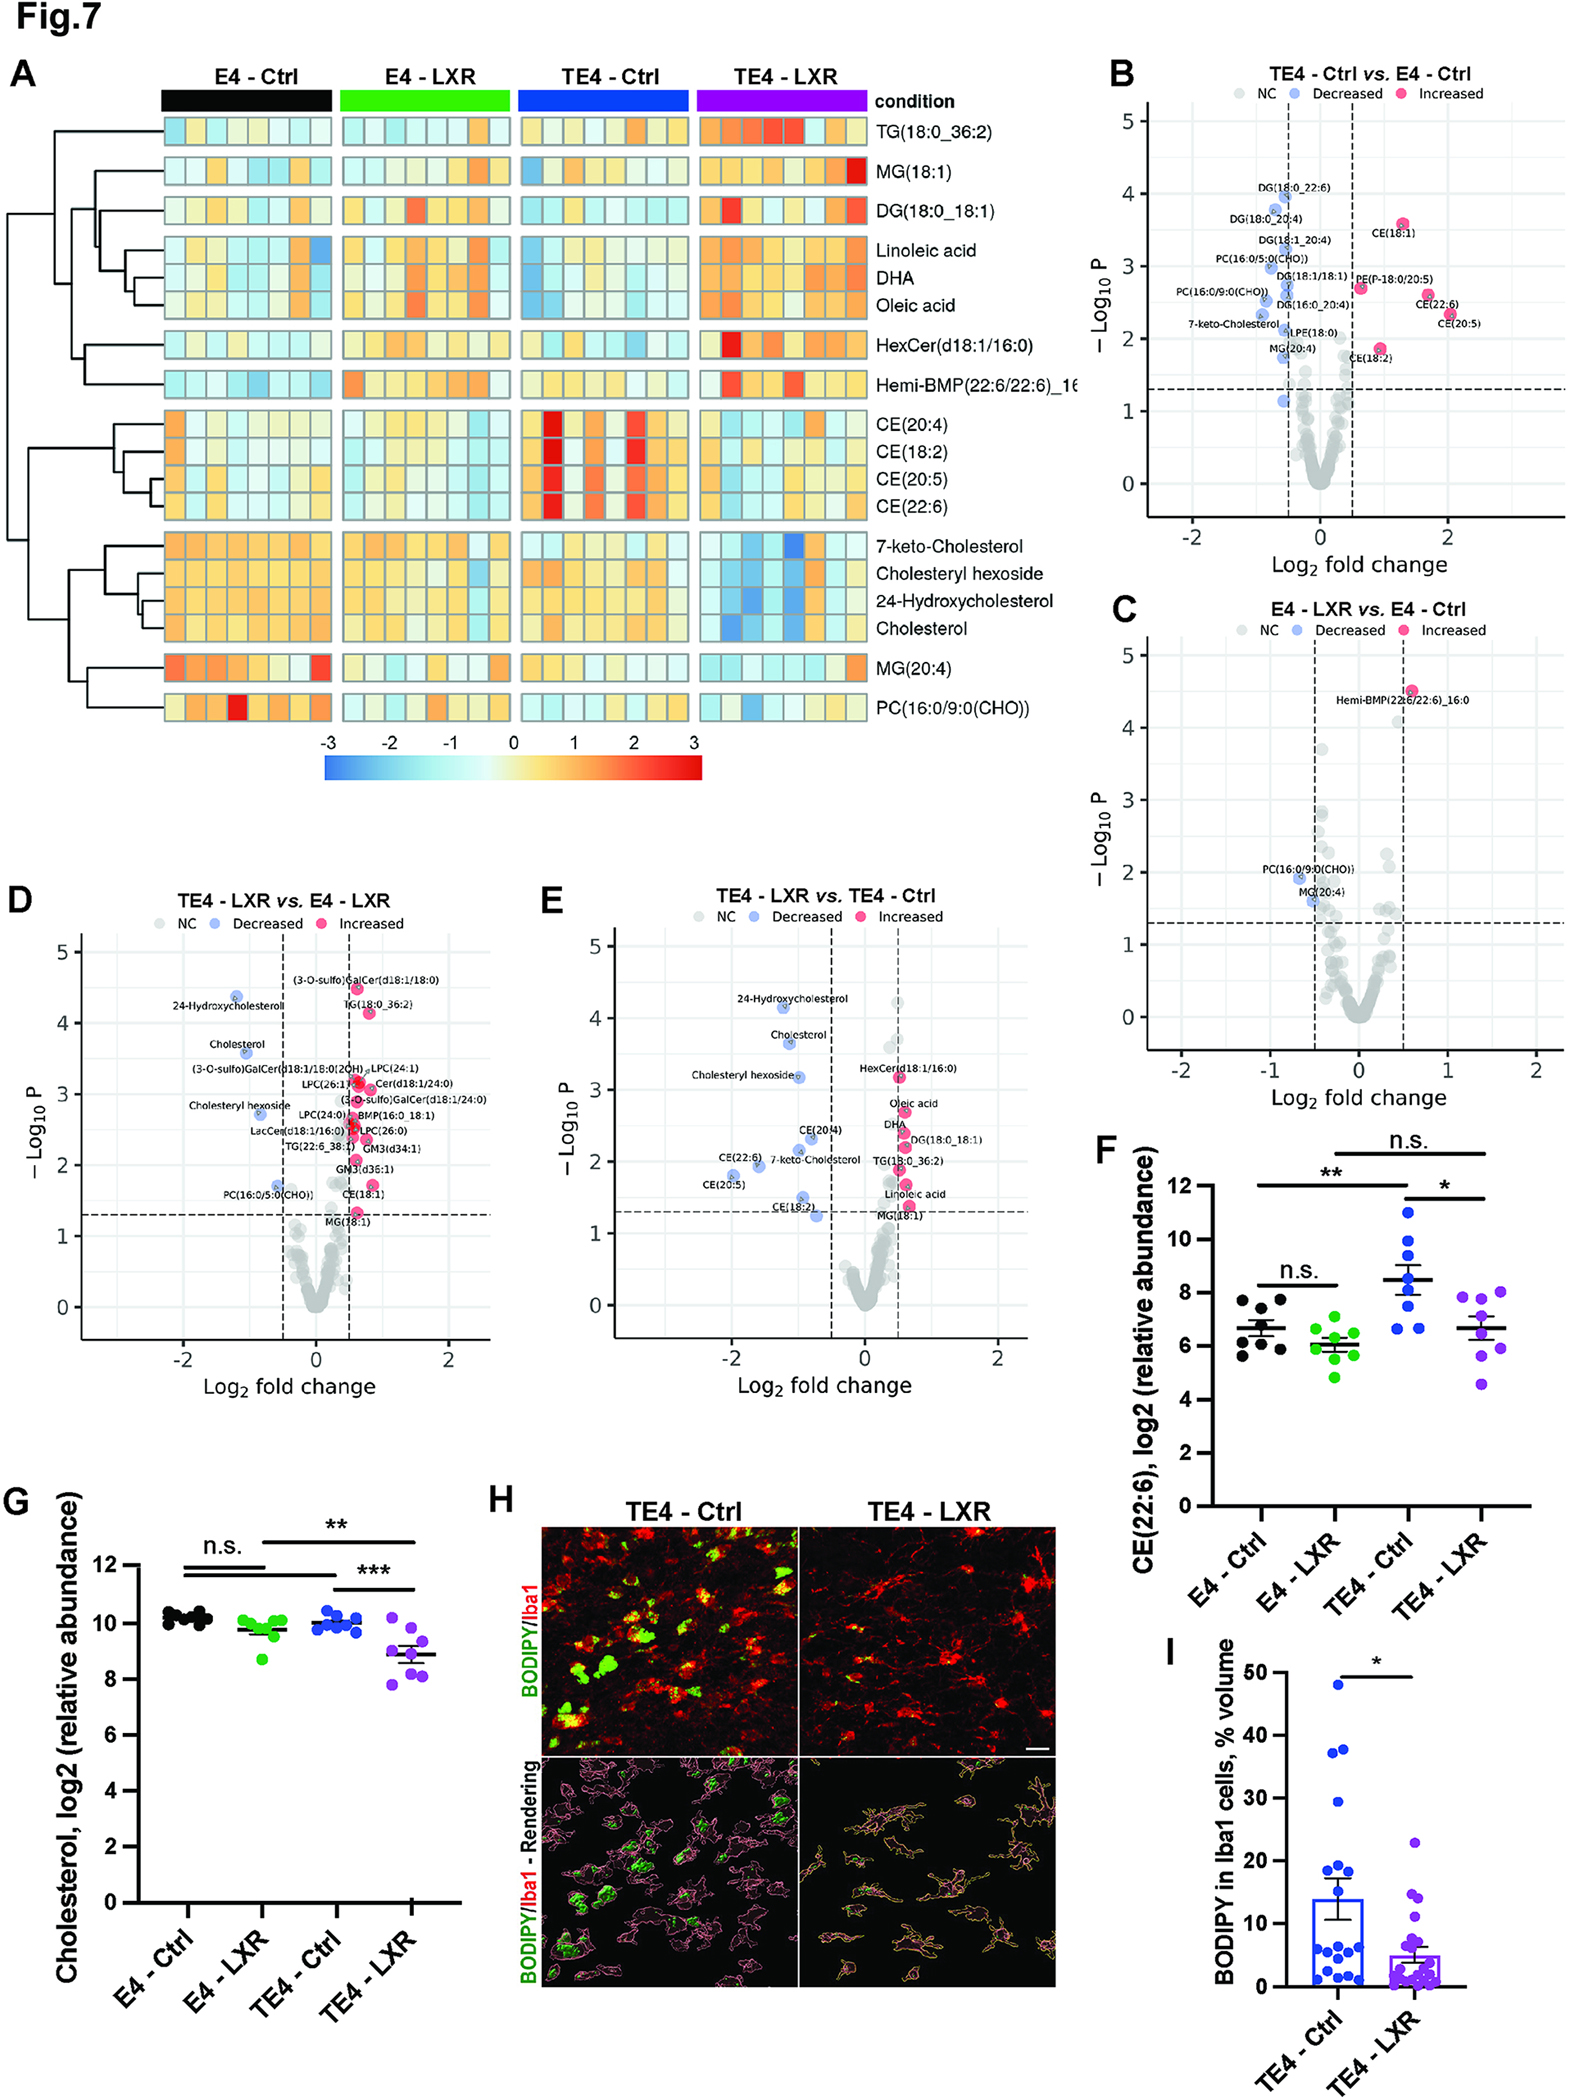
(A) Heatmap of significantly changed lipids in forebrains of 9.5-month-old E4 or TE4 mice treated with either control (Ctrl) or GW3965 (LXR) diets from 6 to 9.5 months. N=8/genotype/treatment. Male mice. (B) Volcano plot of differentially abundant lipids in TE4-Ctrl vs. E4-Ctrl mice. (C) Volcano plot of differentially abundant lipids in E4-LXR vs. E4-Ctrl mice. (D) Volcano plot of differentially abundant lipids in TE4-LXR vs. E4-LXR mice. (E) Volcano plot of differentially abundant lipids in TE4-LXR vs. TE4-Ctrl mice. (F-G) Relative levels of CE (22:6) (F) and free cholesterol (G) in forebrains of 9.5-month-old mice. (H-I) Representative BODIPY (green) and Iba1 (red) co-staining (upper panel) with 3D-IMARIS rendering (lower panel) and quantification (I) in hippocampus of 9.5-month-old mice. N=18–21/genotype/treatment. Male mice. Scale Bar: 100um; *p<0.05. ** p<0.01. N.S. – non-significant. P.adj. generated by R Statistical package for all lipids detected in lipidomic profiling analysis in F and G. Student’s T-Test in I. See also Fig. S8.
We further examined the cell-type patterns of expression of the dark turquoise module genes in TE4 mice by mapping the expression of dark turquoise genes in 23 different cell types distinguished by snRNAseq in TE4-LXR mice and performing k-means clustering to cluster genes. We noticed a significant distribution of gene expression in two clusters by cell type (Fig. 6H–J, yellow and blue clusters). Interestingly, non-neuronal cells (including microglia and astrocytes) were enriched in expression of genes involved in cholesterol biosynthesis and metabolism, LXR and SREBP1 pathways, mevalonate, and non-alcoholic fatty liver disease (Srebf1, Fasn, Mvk, Mvd) (Fig. 6H and I, yellow cluster). In contrast, neuronal cells (different populations of excitatory and inhibitory neurons) predominantly expressed genes involved in proteasome degradation, synapse, and acetylcholine synthesis as well as glycolysis and gluconeogenesis (Stx1b, Ache, Uchl1, Psmd7) (Fig. 6H and J, blue cluster). This could indicate that the activation of LXR/SREBP transcriptional programs in TE4 mice exerts its beneficial effects via regulation of cholesterol metabolism and biosynthesis in astrocytes and microglia and via induction of neuronal metabolism, synapse function and proteasome degradation in neuronal cells and OPC/oligodendrocytes.
LXR agonist GW3965 reduces lipid accumulation in 9.5-month-old TE4 mice.
Given the reduction in glial activation and significant activation of cholesterol metabolism and biosynthetic pathways in the TE4-LXR mice, we decided to test whether LXR agonist altered the brain lipid profile of TE4 mice by unbiased lipidomics (Fig. 7 and Fig. S8). We detected over 187 differentially abundant lipid species in forebrains of E4 and TE4 mice treated with control or LXR agonist diets from 6 to 9.5 months. We observed significant changes in CE, BMP, hemi-BMP, fatty acids (linoleic, oleic acids and DHA), glycerolipids (MGs, DGs and TGs), and oxidized sterols (7-keto-cholesterol, 24-hydroxycholesterol) (Fig. 7A and Fig. S8A). We then evaluated the lipidomic changes between TE4 mice vs. E4 mice on control diet and detected marked increases in CE, BMP, and LPC species in TE4 vs. E4 mice, further confirming impaired cholesterol metabolism, lysosomal dysfunction, and inflammation in P301S mice in the presence of ApoE4 (Fig. 7B).
LXR agonist in E4 and TE4 mice induced significant increases in fatty acids (linoleic, oleic acids and DHA), suggesting LXR and SREBP1 pathway activation, and in endolysosomal BMP lipids, indicating a potential activation of endolysosomal functions by BMPs in response to LXR activation (Fig. 7C and D). We next compared the forebrain lipidomic profiles of TE4-LXR and TE4-Ctrl mice (Fig. 7A and E). LXR agonist induced fatty acid (oleic acid and DHA) and BMP accumulation in TE4 mice similar to LXR effects in E4 mice (Fig. 7A) along with marked decreases in cholesterol (Fig. 7G) and oxidized 7-keto and 24-hydroxycholesterols (Fig. 7A). Interestingly, we also detected strong, significant decreases in multiple CE species (CEs (18:2), (20:4), (20:5), (22:6) (Fig. 7A, 7E, and 7F). These same CE species were elevated in TE4-Ctrl vs. E4-Ctrl (Fig. 7B), demonstrating a dramatic decrease in CE accumulation in response to LXR agonist treatment. Using a weighted lipid correlation network analysis (WLCNA), we detected a significant correlation of forebrain CEs with the plasma NfL levels in LXR agonist-treated mice (turquoise module), suggesting that NfL/neurodegeneration strongly correlates with CE accumulation in brain (Fig. S8E–H). Finally, we performed BODIPY staining in TE4 mice on control vs. LXR agonist diet and observed a ~50% reduction in BODIPY signal in microglia of TE4-LXR vs. TE4-Ctrl mice (Fig. 7H and I). Together, these results demonstrate that increasing cholesterol efflux in TE4 mice via LXR activation can reduce neutral lipid accumulation in the brain and in microglia, which could contribute to decreased inflammation and neuroprotection.
LXR agonist GW3965 reduces neuropathological and behavioral deficits in 7.5-month-old TE4 mice.
To study how LXR agonist GW3965 affects earlier stages of neuropathology and cognitive function in TE4 mice, we treated 6-month-old TE4 mice with 10 mg/kg GW3965 or control diet for 1.5 months and performed a series of neuropathological and behavioral tests at 7–7.5 months (Fig. S4I). We detected a significant ~2-fold increase in Abca1 mRNA in hippocampus of E4 mice after 1.5 month treatment with LXR similar to the 3.5 month treatment (Fig. S4J). Brain volumetric analysis (Fig. S9A) revealed a modest, but statistically significant decrease in volume of hippocampus (Fig. S8B) and entorhinal/piriform cortex (Fig. S9C) but not ventricular enlargement (Fig. S9D) of TE4 vs E4 mice at 7.5 months. The LXR diet significantly reduced the neurodegeneration in hippocampus of TE4 mice on LXR vs Ctrl diet but did not have a strong effect on cortical atrophy or ventricular enlargement. There were also no significant changes in plasma NfL levels of TE4-Ctrl vs E4-Ctrl or TE4-LXR vs TE4-Ctrl mice at this age (Fig. S9E).
To test the effect of LXR agonist on cognitive function during early stages of disease in TE4 mice, we performed a series of behavioral tests in 7–7.5 months old E4 and TE4 mice (Fig. S9F). We did not detect any baseline differences between TE4 and E4 mice on either diet during fear conditioning (Fig. S8G) or during contextual recall (Fig. S9H and J). We did, however, detect significant differences in cued fear recall (Fig. S9I) with E4-Ctrl mice showing significantly more freezing response on minutes 5–9 than TE4-Ctrl animals (Fig. S9I, black and blue dots). TE4-LXR mice exhibited a significant increase in freezing response on minutes 3–5 of cued fear conditioning when compared to TE4-Ctrl group (Fig. S9I, purple and blue dots) and a trend towards increased total freezing response in TE4-LXR vs TE4-Ctrl over 10 min (Fig. S9K). We also observed a significant improvement in nesting behavior of TE4-LXR vs TE4-Ctrl mice (Fig. S9F). Together, these data indicate that LXR diet in TE4 mice ameliorated behavioral deficits observed in TE4 vs E4 behavior at both 7.5 and 9.5 months.
We next analyzed the impact of LXR agonist treatment on early stages of tau pathology. We did not observe any significant changes in levels of phospho-Tau (AT8) in TE4-LXR vs TE4-Ctrl at 7.5 months as evidenced by quantification of AT8 immunostaining in cortex and hippocampus (Fig. S9L–M) or by total tau/pTau ELISA in cortical tissues (Fig. S9N–O).
We then analyzed how LXR agonist affected neuroinflammation in early stages of pathology in TE4 mice (Fig. S10). We detected significant increases in GFAP (Fig. S10A–B), Iba1, and CD68 immunoreactivity in hippocampus and cortex of TE4-Ctrl vs E4-Ctrl mice (Fig. S10C–E). While the LXR diet did not significantly reduce the astrocyte reactivity in TE4 mice at 7.5 months, we detected reductions in Iba1/CD68 staining in the hippocampus and cortex of TE4-LXR vs TE4-Ctrl mice (Fig. S10C–E). We also measured cytokine levels in hippocampal lysates of TE4 and E4 mice on LXR vs Ctrl diets at 7.5 months (Fig. S10F–Q). While we detected significant increases in Ccl5, CXCL1, CXCL10 in TE4 vs E4 mice (Fig. S10O–P), only CXCL1 levels were reduced in TE4-LXR mice.
We detected a marked reduction in synaptophysin staining in CA3 area of hippocampus (Fig. S11A–B) as well as a small change in the number of colocalized presynaptic synaptophysin and post-synaptic PSD95 puncta in TE4-Ctrl vs E4-Ctrl mice (Fig. S11C–D). Similar to the effects of LXR agonist on synapses at 9.5 months, we observed significant increases in synaptophysin and PSD95 volumes in TE4 microglia at 7.5 months that were reduced in LXR agonist-treated conditions (Fig. S11E–G).
Finally, we assessed the effects of LXR agonist on lipid accumulation (Fig. S11H–M). Forebrain lipidome profiling detected significant elevations in CEs ((18:2), (16:1), (20:5), (22:6)) in TE4-Ctrl vs E4-Ctrl which were reduced in TE4-LXR vs. TE4-Ctrl (Fig. S11H, K, L). No changes were detected in forebrain free cholesterol levels (Fig. S11M) or in BODIPY staining in TE4-Ctrl vs. E4-Ctrl mice (data not shown). Together, we observed significant beneficial effects of LXR agonist in TE4 mice at 7.5 months.
LXR agonist GW3965 markedly upregulates Abca1 and reduces lipid droplet accumulation in vitro.
To study the effects of LXR agonist GW3965 on microglial myelin uptake, neutral lipid accumulation and inflammation in vitro (Fig. S12), we first treated primary E4 microglia with 5uM GW3965 for 24 hrs and detected a marked ~30–40-fold increase in Abca1 expression in GW3965 vs DMSO-control groups (Fig. S12A). To test the effects of LXR agonism on myelin uptake, we then added 0.5 mg/ml of myelin, which is rich in cholesterol, to the E4 microglia pre-treated with 5uM GW3965 for 24 hrs and measured lipid droplet (LD) accumulation 24 hrs later using fluorescence microscopy (Fig. S12B). We detected a marked ~50% decrease in LipidToxGreen area per cell in the GW3965 vs DMSO-control groups (Fig. S12C and D).
We measured the effects of the LXR agonist on inflammation by quantifying the levels of cytokines/chemokines in conditioned media from E4 microglia treated with 5uM GW3965 or DMSO for 24 hrs and/or myelin for another 24 hrs (Fig. S12E–P). We detected reduction in several cytokines in conditioned media of GW3965 vs DMSO-control groups 24 hrs after the exposure to LXR agonist (Fig. S12I, J, P). Although 24 hours of myelin treatment did not have strong effects on cytokine production in E4 microglia, we detected a significant reduction in CXCL5 in response to LXR and myelin stimulation (Fig. S12P).
Abca1 overexpression reduces neurodegeneration, tau pathology, microglia activation and lipid accumulation in 9.5-month-old TE4 mice.
To test whether overexpression of the LXR-target gene Abca1 was sufficient to attenuate pathology in TE4 mice, we crossed TE4 mice with transgenic mice overexpressing Abca1 ~2-fold in the brain.39 Using primary microglial cultures, we first confirmed that Abca1/E4 microglia expressed Abca1 at increased levels compared to non-Abca1 transgenic microglia (Fig. 8A). We then assessed TE4 and TE4/Abca1 mice at 9.5 months of age. TE4/Abca1 mice were strongly protected from hippocampal and entorhinal/piriform cortex atrophy (by ~50%) when compared to TE4 mice (Fig. 8B–D); however, the ventricular volumes were not significantly changed (Fig. 8B and E). The overall reduction in brain neurodegeneration in TE4/Abca1 vs TE4 mice was further accompanied by a significant (~50%) decrease in levels of the neurofilament light chain protein (NfL) in plasma of TE4/Abca1 vs TE4 mice (Fig. 8F) and a functional improvement on nesting behavior test (Fig. 8G).
Fig. 8. Abca1 overexpression ameliorates neurodegeneration and tau pathology and reduces microglial/myeloid cells reactivity and lipid accumulation in 9.5-month-old TE4 mice.
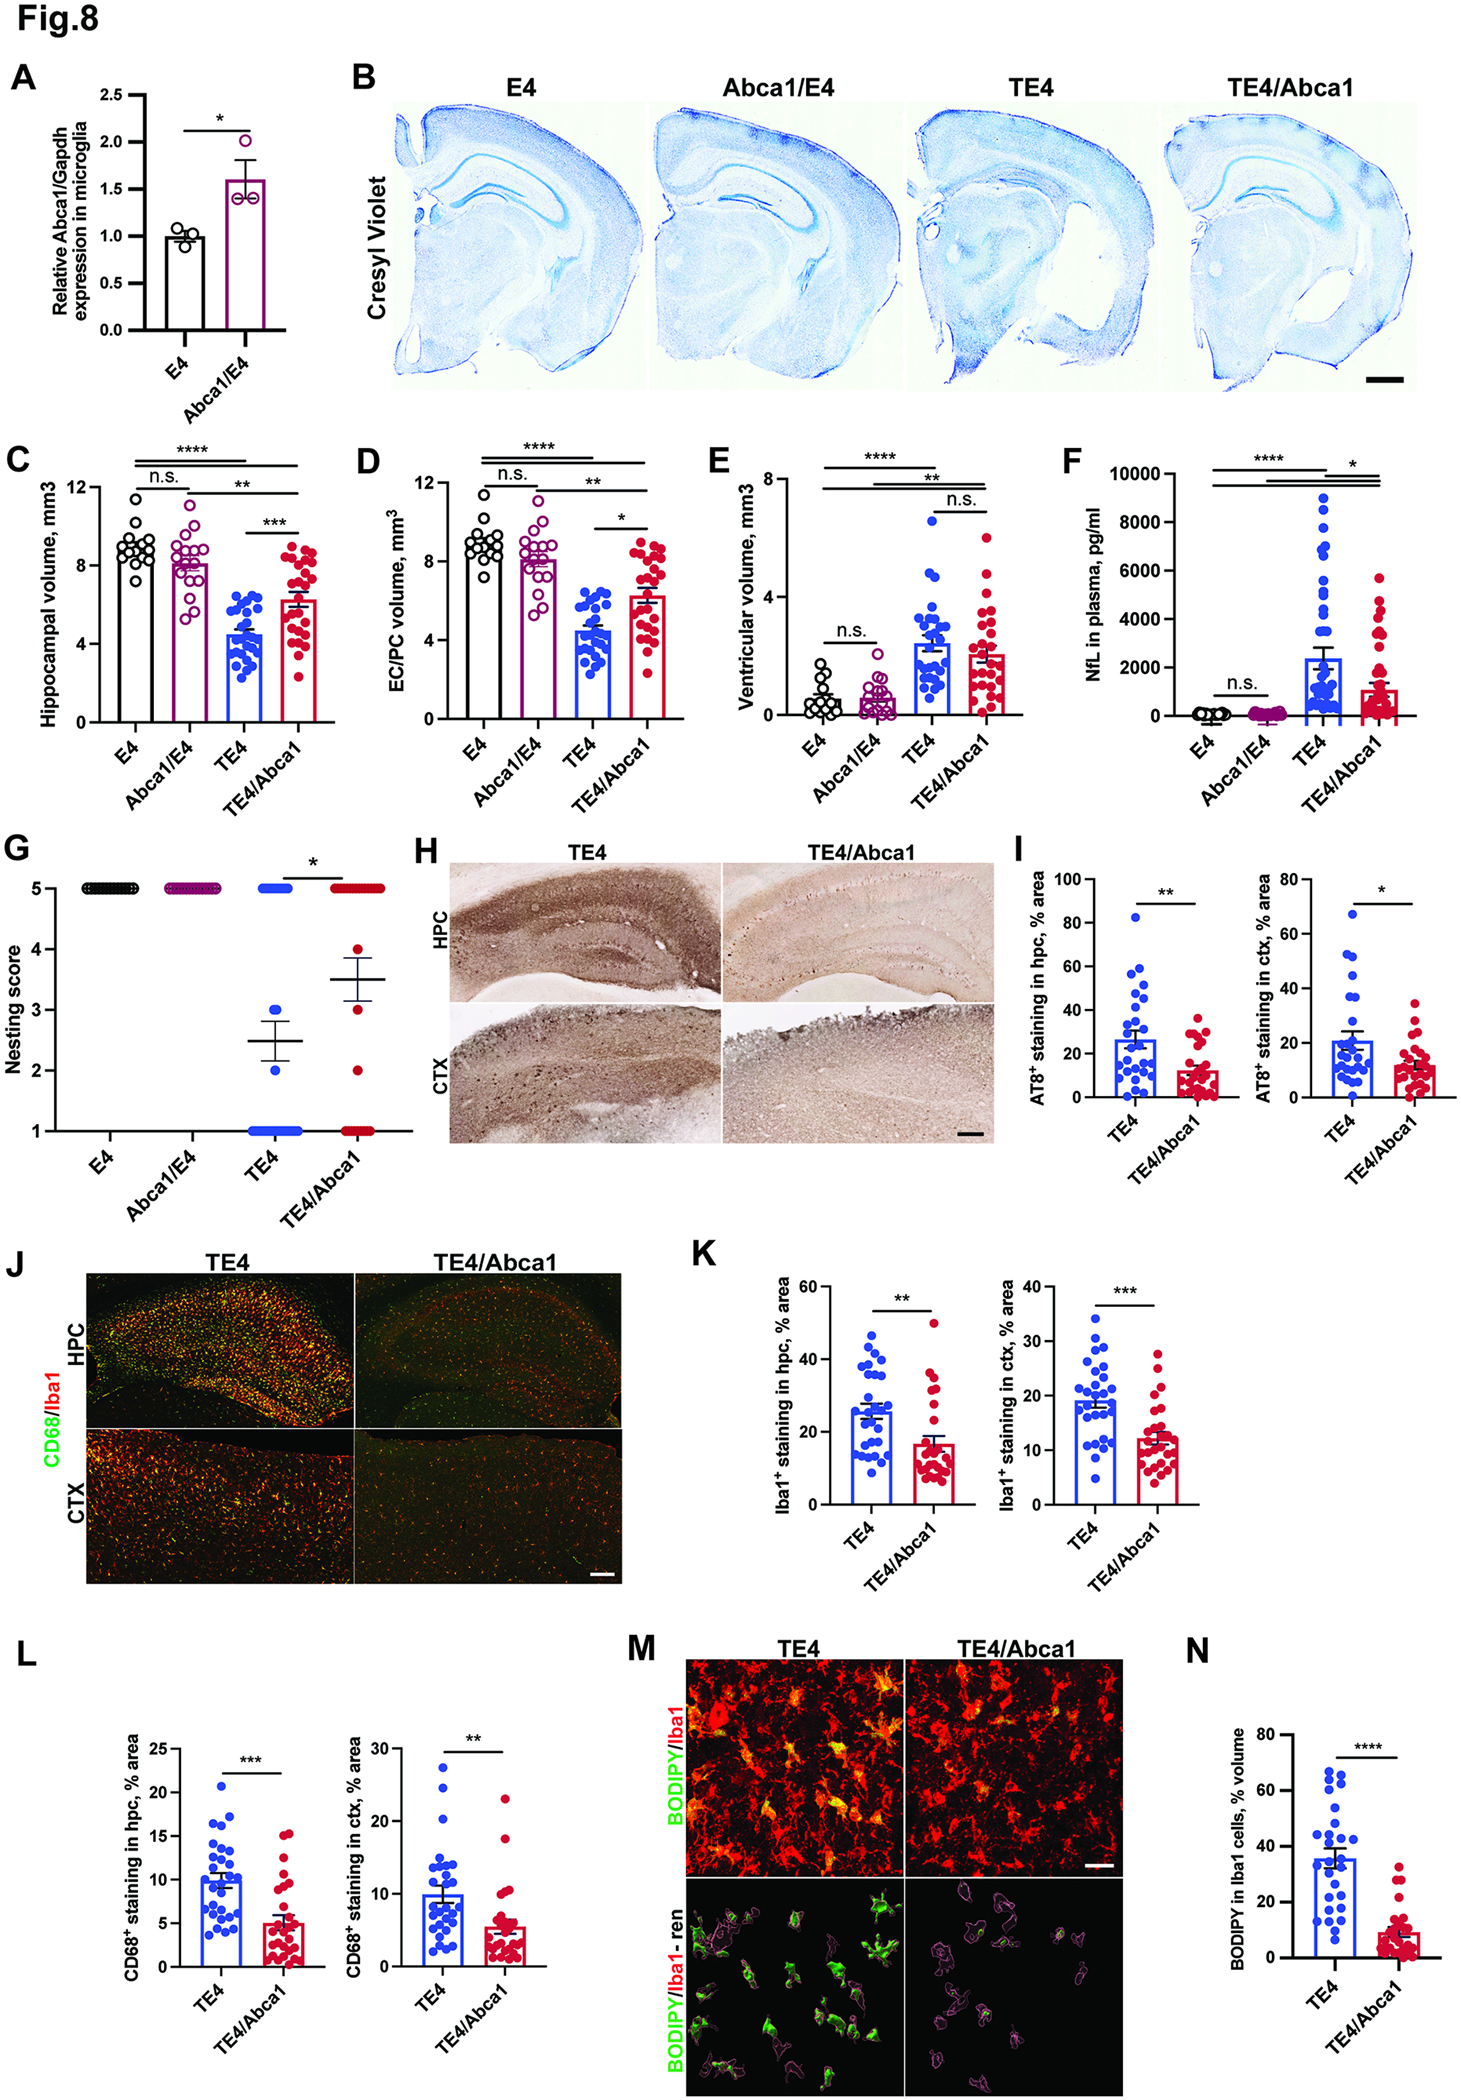
(A) Relative Abca1 mRNA expression in primary microglia isolated from of Abca1/E4 mice. (B) Representative Cresyl Violet staining of brain sections from 9.5-month-old E4, Abca1/E4, TE4 and TE4/Abca1 mice. (C-E) Quantification of hippocampal (C), entorhinal/piriform (EC/PC) cortical (D) and ventricular brain volumes in 9.5-month-old mice (E). (F) Neurofilament light chain (NfL) levels in plasma of 9.5-month-old mice. (G) Nesting behavior score in 9.5-month-old mice. (H) Representative immunohistochemical staining of AT8 phospho-tau in hippocampus (hpc) and cortex (ctx) of 9.5-month-old TE4 mice. (I) Quantification of AT8 signal in hippocampus and cortex. (J) Representative CD68 (green) and Iba1 (red) co-immunostaining in hippocampus (hpc) and cortex (ctx). (K-L) Quantification of Iba1 (K) and CD68 stainings in (L). (M-N) Representative BODIPY (green) and Iba1 (red) co-staining (upper panel) with 3D-IMARIS rendering (lower panel) (M) and quantification (N) in hippocampus of 9.5-month-old mice. Each dot represents one animal: N (E4) = 15; N (Abca1/E4) = 16; N (TE4) = 25; N (TE4/Abca1) =26. Male mice. Scale Bar in A: 1 mm; G and I: 100 um; L; 50um. *p<0.05; ** p<0.01; *** p<0.001; **** p<0.0001. N.S. – non-significant. One-way ANOVA in C-F. Fisher’s exact test in G. Student’s T-Test in A, I, K, L, N.
To assess the effects of Abca1 overexpression on tau pathology, we quantified the area covered with the AT8 staining in hippocampus and cortex of TE4/Abca1 and TE4 mice (Fig. 8G–I). We detected a significant ~40–60% reduction in AT8 staining in hippocampus and cortex of TE4/Abca1 vs TE4 mice (Fig. 8H and I). We then assessed microglial/macrophages in TE4/Abca1 vs TE4 mice by performing Iba1 and CD68 co-immunostaining and observed a ~40–60% decrease in Iba1 and CD68 immunoreactivity in both hippocampus and cortex of TE4/Abca1 vs TE4 mice (Fig. 8J–L). We also detected a marked ~80% reduction in BODIPY staining in TE4/Abca1 vs TE4 mice (Fig. 8M, N). Altogether, these results suggest that Abca1 overexpression in TE4 markedly protects the TE4 mice from neurodegeneration, tau pathology, microglial reactivity, and lipid accumulation, similar to the LXR-agonist GW3965 diet.
DISCUSSION
ApoE isoforms may differentially regulate brain lipid metabolism in AD and primary tauopathies.1,6,9,16,24,40 We found marked perturbation of forebrain lipid metabolism and accumulation of neutral and oxidized lipids in microglia of 9.5-month-old P301S tauopathy mice that occurs in an ApoE-isoform and tauopathy-dependent manner. Multiple studies on astrocytes, microglia, and oligodendrocytes derived from iPSCs demonstrate an important role for ApoE4 in cholesterol metabolism pathways.6–9 Utilizing the P301S/ApoE KI mouse models of tauopathy that develop marked neurodegeneration, tau pathology and neuroinflammation in an ApoE-dependent fashion, we demonstrate an accumulation of CE species within the forebrain, including within microglia of TE4 mice compared to TE3 mice. Importantly, while we did not detect substantial levels of neutral or oxidized lipids in glia of TEKO or TE3 mice by immunostaining, large accumulations of BODIPY+ neutral lipids were observed within microglial phagolysosomes of TE4 mice. Combining FACS isolation of glial cells with LCMS analyses,4 we showed that the neutral lipids that accumulate in TE4 microglia are likely CE species, rather than triglycerides, as observed for instance in microglia derived from APP knock-in mice.41 This suggests ApoE4 expression promotes buildup of neutral lipids/CEs in microglial lysosomes during tauopathy and neurodegeneration in TE4 mice. In contrast, elevated CE species detected by lipidomic analysis in ApoE KO brain do not appear to reside in microglial lysosomes. This difference in subcellular localization of lipid accumulations is likely somehow related to different effects of ApoE4 vs. ApoE KO on neurodegeneration in the presence of tau pathology. Another possibility is that CE-associated neurotoxicity requires extracellular transport by ApoE, which could explain why TEKO mice are protected despite CE accumulation. In line with lysosomal lipid accumulation in TE4 mice, we also detected significant E4-dependent increases in endolysosomal phospholipid BMP, which typically accumulates in lysosomal storage disorders and was recently reported to facilitate lysosomal lipid degradation in other models of neurodegeneration.42 As ApoE4 alone results in an increase in BMP, this suggests that ApoE4 leads to an increase in endolysosomal stress. However, as the increase in microglial CE only occurs with tauopathy and ApoE4, this suggests that CE accumulation in microglial lysosomes may be most damaging. Together, these results suggest that ApoE4 and Tau pathology may synergistically exacerbate neurodegeneration via dysregulation of cholesterol homeostasis and endolysosomal lipid processing within glia. Elevation of CEs and BMPs was also observed in LOAD patients’ entorhinal cortex, suggesting disease relevance.43,44 Fatty acid profiles from lipid rafts in AD brain generally show decreases in PUFA and these trends are noticeable in entorhinal cortex and frontal cortex in the earliest stages of disease. Understanding the lipid class and acyl-group dynamics discussed provides additional relevance to existing human data.
Lipid accumulation in microglia could stimulate deleterious inflammatory responses, including pro-inflammatory cytokine production, thus contributing to severe neurodegeneration observed in TE4 mice.10,17,18,44,45 To test whether alleviating lipid accumulation could reduce inflammation and neurodegeneration in TE4 mice, we utilized the synthetic LXR agonist GW3965. Previous studies in models of amyloid-β deposition demonstrated that GW3965 present in the diet at levels of 10–33 mg/kg per day leads to a dose-dependent reduction in amyloid-β load and an increase in extracellular ApoE lipidation by promoting cholesterol efflux largely via ABCA1 upregulation.27,46 Although these and other past studies largely focused on the beneficial effects of LXR/RXR agonists in the setting of different ApoE isoforms, different levels of Abca1,47–50 or in amyloid models that do not develop tau pathology or neurodegeneration, to date no one has explored the role of LXR agonism/Abca1 overexpression in regulation of tau-induced neurodegeneration in relation to inflammation, brain lipid metabolism and gene expression changes.
Here, we report that administration of GW3965 results in CNS target engagement, based on brain ABCA1 upregulation, and causes a significant decrease in tau pathology and associated neurodegeneration and neuroinflammation, and improvement in nesting behavior in TE4 mice. LXR agonist treatment markedly reduced free cholesterol and CE accumulation in the forebrain of TE4 mice and promoted the clearance of neutral lipids in TE4 microglia. Importantly, the beneficial effects of LXR diet on tau pathology, neurodegeneration and glial lipid accumulation were also recapitulated in 9.5-month-old TE4 mice overexpressing Abca1, indicating that promoting cholesterol efflux via the LXR-target gene Abca1 may be a mechanism by which an LXR agonist protects against tau-dependent neurodegeneration.
LXR activation modulates pro-inflammatory responses in animal models of atherosclerosis and neuroinflammation via inhibition of NF-kB and STAT-dependent gene transcription.51,52 These pathways were recently demonstrated to play an important role in microglial activation in context of tau pathology. 29,53 Additionally, several cytokines, including IL-1β and IL-6, can directly induce tau phosphorylation in vitro thus potentially contributing to the development of tau pathology.54–56 We observed significant decreases in major cytokine/chemokine levels in forebrains of 9.5-and 7.5-month-old TE4-LXR mice vs. TE4-Ctrl and decreases in several cytokines/chemokines in vitro in LXR agonist-treated E4 microglia. There were also significant reductions in hippocampal CD8+ T cells and GFAP+ reactive astrocytes and Clec7a+ microglia in cortex and hippocampus of TE4-LXR mice, consistent with reduced neuroinflammation in LXR agonist-treated mice.
Overall, we demonstrate that ApoE4 plays a fundamental role in cholesterol dysregulation in glia in the setting of tauopathy. These events are likely linked with microglial reactivity that has been reported to significantly exacerbate tau pathology and neurodegeneration in TE4 mice. LXR agonist GW3965 or overexpression of Abca1 in the brain of TE4 mice reduces sterol accumulation and inflammation in microglia and mitigates tau pathology, neurodegeneration, and synapse loss resulting in improvement of proteasome and synapse gene expression in neurons. It is worth noting, that higher levels of Abca1 expression in mouse brain via transgenic or viral gene delivery of Abca1 or alternative LXR agonist treatment paradigms could yield even higher degree of neuroprotection in TE4 mouse model. Additionally, other cell types (e.g., neurons, astrocytes, oligodendrocytes, cells of the blood-brain-barrier) not limited to microglia as well as other pathways could play a significant role in promoting the effects of LXRs and Abca1 in aged TE4 mice.
STAR METHODS
Resource Availability
Further information and requests for resources and reagents should be directed to and will be fulfilled by the Lead Contact, David M. Holtzman (holtzman@wustl.edu).
Materials availability
This study did not generate new unique reagents.
Data and code availability
EXPERIMENTAL MODEL AND STUDY PARTICIPANT DETAILS
Animals
The P301S tau transgenic mice (Stock No. 008169, Jackson Laboratories) overexpressing human 1N4R tau harboring the P301S mutation under PrnP promoter were backcrossed to C57BL/6 mice (Stock No. 027, Charles River) for more than 10 generations. These animals were then crossed to the human ApoE3 flox/flox, ApoE4 flox/flox or ApoE KO animals to generate P301S/ApoE KI or P301S/ApoE KO mice on murine apoE knockout background as previously described.60 The Abca1 line D transgenic mice overexpressing mouse Abca1 under control of the PrnP promoter (Cryopreserved, Holtzman Lab – Not available at JAX) were backcrossed to ApoE4 flox/flox for more than 10 generations to generate Abca1/ApoE4 mice on murine apoE background.39 These mice were then backcrossed to P301S/ApoE4 mice to generate P301S/Abca1/ApoE4 mice. Only male mice were used in this study unless stated otherwise in text or figure legends, Male P301S/ApoE4 mice were reported previously to develop significantly higher levels of neurodegeneration and tau pathology by 9.5 months of age (Wang et al., 2021). The animals were housed in a pathogen free mouse facility with ad libitum access to food and water on a 12hr light/dark cycle. All animal procedures and experiments were performed under guidelines approved by the Institutional Animal Care and Use Committee (IACUC) at Washington University School of Medicine.
METHOD DETAILS
GW3965 LXR agonist diet treatment
Rodent AIN-76 chow diet was supplemented with 40 mg/kg of GW3965 compound (HY-10627, MCE inhibitors) to provide 10 mg/kg animal weight daily intake upon manufacturer`s suggestion (Research Diets Inc.). Animals received control AIN-76 or AIN-76 diet supplemented with GW3965 starting from 6 months of age for 3.5 months. Animals had equal diet preferences and equal daily diet intake (data not shown). Mice were sacrificed at 285 days (9.5 months) for further analyses unless stated otherwise in the text.
Nesting behavior
Two days before collection, group-housed mice were separated into single-housing cages and provided with pre-weighted square nestlets. The remaining nestlets were weighted 24 hrs after, and animals were assigned the nesting score from 1 to 5 based on the percentage of remaining nesting material and shredded conditions: 1 - < 10% nestlets used; 2 – 10–50% nestlets used; 3 – 50–90% nestlets used; 4 – 90% nestlets used, but the nest is flat and uncompact; 5 – 100% nestlets used to make round nests with high walls.58
Fear conditioning
Fear conditioning tests was performed in E4 and TE4 mice at 7 months of age as previously described.59 In brief, on day one each mouse was placed into the conditioning chamber for 5 min to record the baseline freezing response during a 2 min period. After that, a conditioned stimulus (80 dB tone) was presented for 20s followed by an unconditioned stimulus (1.0 mA electric shock) presented for 1s. The tone-shock (T-S) pairing was repeated for the next 2 min, and the freezing response was quantified after each of the three tone-shock pairings. Twenty-four hours after training, each mouse was placed into the original chamber, and the contextual freezing response without tone or electric shock present was recorded for 8 min. Twenty-four hours after, each mouse was placed into a new chamber and presented with the auditory cue, freezing response was recorded for another 10 min, including 2 min of “altered context” baseline and 8 min of actual tone response. FreezeFrame (Actimetrics) software was used for the mouse behavior recording and analysis.
Brain volumetric analysis
After perfusion and tissue collection, mouse left hemispheres were fixed with 4% paraformaldehyde overnight and then incubated in 30% sucrose for at least 24 hrs. Serial 50-um thick coronal sections were cut on a Leica SM2010 Sliding Microtome for further analyses. Every sixth brain section (300um apart) between bregma +2.1 mm to bregma −3.9 mm was used for volumetric analysis of hippocampus, entorhinal/piriform cortex, and ventricle (7–8 brain sections per animal depending on degree of brain atrophy). Sections were stained with 0.25% cresyl violet for 5 min at room temperature, dehydrated in ethanol, cleared with xylene and then coverslipped with cytoseal. Slides were imaged with the Nanozoomer 2.0-HT system (Hamamatsu) at 20x magnification, and areas of interest were traced using the NDP Viewer software. The volume of region of interest was quantified using the following formula: volume = (sum of area) * 0.3 mm. To quantify the thickness of the dentate gyrus granular cell layer, a scale was drawn perpendicular to the cell layer at two spots on all slices, the average thickness value for each mouse was determined.
Immunostaining
For each experiment, three hippocampus-containing brain sections (300um apart) were selected for further immunofluorescent/immunohistochemical analysis. Briefly, after washing in TBS, sections were blocked with 2% donkey serum in TBS with 0.4% Triton X-100 buffer, then incubated with primary antibodies (AT8, Iba1, CD68, GFAP, Clec7a, P2ry12, E06, Synaptophysin, PSD95) diluted in blocking solution overnight at 4C followed by the incubation with secondary antibodies for 1hr at room temperature the next day. DAB staining was carried out using VECTASTAIN Elite ABC Kit (PK-6200) following manufacturer`s instructions. After washing in TBS, sections were mounted in Prolong Gold Solution with DAPI or Cytoseal (ThermoFisher Scientific, 8310–16).
For BODIPY staining, the brain sections were first incubated with primary antibodies in 2% donkey serum in TBS for 48hrs at 4C followed by incubation with secondary antibodies in in 2% donkey serum in TBS for 3–4 hrs at room temperature. Sections were then washed 3 times in PBS and incubated in BODIPY solution at 1:1000 for 15 min, washed 3 times in PBS, mounted and coverslipped wet as previously described.3
Primary cortical microglial culture
For each independent culture, an entire litter (~6 pups) of P2 floxed ApoE4flox/flox KI mice (Cure Alzheimer’s Fund, Taconic) were pooled. The pups were decapitated, and heads rinsed in a petri dish containing ice cold HBSS (Gibco, 14175–079). The brains were removed and placed into another Petri dish of HBSS where each complete cortex was dissected from the brainstem, midbrain, olfactory bulbs, meninges, and hippocampi. Cortices were pooled into 5 mL of ice cold HBSS, centrifuged at 300g for 5 min at 4C, and resuspended in 1 mL/brain of pre-warmed 0.25% Trypsin-EDTA (Gibco, 25200–056). The mixture was triturated ~10 times with a 1000 uL pipette tip, incubated at 37C for 2 minutes, then triturated again. The trypsin was inactivated with the addition of 2 volumes of astrocyte cell culture media comprised of 10% heat-inactivated FBS (Gibco, A38400–01) and 1% Penicillin-Streptomycin (Gibco, 15140–122) in supplemented DMEM (Gibco, 10569–010). After mixing, the cell suspension was filtered through a 100 um filter and spun at 300g for 5 min at RT. Cells were resuspended in media and seeded into T75 flasks (TPP) coated with 10 ug/mL poly-L-lysine (Sigma, P4707). Each flask received the equivalent of ~2 brains. After 2–3 days of incubation at 37C, the media was aspirated and replaced. For general maintenance, media was replaced every 7 days. To scale up microglia for experiments, the mixed glial cultures were stimulated with 4 ng/mL GM-CSF (Biolegend, 576304) in astrocyte media for 2–3 days. Once the desired microglial density was achieved, the microglia were separated from the astrocytes by shaking at 200 rpm for 1 hour at 37C. The microglial suspensions were spun at 500g for 5 minutes at 4°C and the pellets resuspended in astrocyte media. Cells were counted using a Countess automated cell counter and 15,000 cells in 200 uL media were seeded into each of 96-well tissue culture-treated glass-bottom microplates (ibidi, 89626). Cells were allowed to adhere for 30 minutes at RT before returning to the incubator to promote even adhesion. Up to four stimulation-harvest cycles were performed per culture.
Myelin uptake and clearance assays
Myelin debris were isolated from 10 week old male C57BL/6J as previously described61. In the present manuscript, the concentration of myelin is reported as bulk mass per volume PBS, not as a protein concentration. The day after seeding, microglia were rinsed once and then covered with 100 uL/well of serum free microglia media comprised of 0.1% BSA (Sigma, A1470), 10 ng/mL M-CSF1 (Biolegend, 576404), 1X GlutaMax (Gibco, 35050–061), 1X Sodium Pyruvate (Gibco, 11360–070), 1% Penicillin-Streptomycin, and 1X ITS supplement (R&D, AR013) in DMEM/F12 (Gibco, 11330–032). For uptake assays, 50 uL of 3X GW3965 (Sigma, G6295, 5 uM final concentration) or DMSO in serum free media were added to the appropriate wells. After 24 hours of drug pre-treatment, 50 uL of media containing 4X myelin and 1X drug were added so the final concentration of myelin was 0.5 mg/mL, and the drug concentration was unchanged. The cells were treated with drug and myelin debris in a staggered manner such that all of the indicated time points were collected at the same time in the same plate.
For the clearance experiments, 50 uL of 3X myelin (0.5 mg/mL final concentration) were added to the appropriate wells for 24 hours before the cells were rinsed once with 100 uL/well serum free media. After the wash was aspirated, 100 uL/well of 1X LXR agonist or DMSO in serum free media were added back to the cells. The cells were treated with myelin debris and drug in a staggered manner such that all of the indicated time points were collected at the same time in the same plate.
At the time of harvest, the cell media was collected into V-bottom plates and spun at 500g for 5 min at 4°C. Supernatants were moved to fresh PCR plates, sealed, and frozen at −80°C until subsequent cytokine analysis. The adhered cells were fixed with 4% PFA/PBS (EMS) or 10% buffered formalin (Fisherbrand) for 15–30 minutes at RT, rinsed twice with 100 uL/well PBS and stored sealed and covered at 4°C. Once all plates were ready for staining, the PBS was aspirated and replaced with a staining solution comprised of 1:1000 LipidTox Green (Invitrogen, H34475), 1:3000 Hoechst 33342 (Invitrogen, H3570), and 1:100 ProLong Live (Invitrogen, P36975) in PBS. Plates were stained for 2–3 days sealed and covered at 4°C before imaging on a Cytation 5 high content imager. After the neutral lipid images were acquired, cells were permeabilized with 0.2% Triton X-100/PBS for 10 minutes, rinsed twice with PBS, blocked with 5% donkey serum/PBS, and incubated with antibodies to Iba1 (rabbit, Wako, 019–19741, 1:500) in 1% donkey serum/PBS overnight at 4°C with rocking. After two PBS washes, cells were incubated in secondary antibodies (Alexa Fluor anti-mouse-647 and anti-rabbit-594, 1:1000) for 1 hour at RT, rinsed twice with PBS, covered with ProLong Live/PBS, and imaged using the Cytation 5.
Imaging and analysis of myelin uptake and clearance assays
For each well, a 4×4 matrix of evenly spaced 20X images were acquired with a Cytation 5 high content imager using the Hoechst nuclear stain as the laser autofocus channel. Image analysis was performed using the Gen5 software version 3.11. Images were stitched, downsized to 75%, and background subtracted using default settings. Thresholded LipidTox signal area measurements were and divided by nuclei count. Images containing substantial fluorescent debris were manually identified and omitted. In general, several thousands of cells from 14–16 images per well for 2–3 wells were analyzed per group.
Image Acquisition and Analysis
Confocal images were acquired using Zeiss LSM 980 Confocal microscope with Airyscan. For quantification of reactive glial activation and NFT load, fluorescent and DAB stainings were also scanned on Leica Stellaris 8 Confocal Microscope with 20x objective or Nanozoomer 2.0-HT system (Hamamatsu). Images were processed by ImageJ; background was subtracted by the ImageJ software for fluorescence images before quantification. All analyses were performed blinded to treatment and genotype.
IMARIS software with SURFACE and COLOCALIZE Functions was used for quantification of E06 and BODIPY signals within glial cells. Synaptic puncta colocalization was estimated as previously described.62 Following co-immunostaining with anti-synaptophysin, anti-PSD95 and anti-Iba1 antibodies, brain sections were imaged on a Zeiss LSM 980 Confocal Microscope with Airyscan with 63x objective and 1.6x zoom using 0.2 mm step. Image background was subtracted using ImageJ, and the total number of synaptophysin, PSD95 and colocalized puncta was estimated using IMARIS software with SPOTS function and COLOCALIZE Spots MAT Lab script. IMARIS SURFACE function was used to estimate the volume of engulfed synaptophysin or PSD95 material by Iba1-positive microglia.
Protein extraction
Mouse posterior cortical tissues were sequentially homogenized with RAB, RIPA and FA buffers as previously described 25. Briefly, brain tissues were first homogenized with RAB buffer (100mM MES, 1mM EGTA, 0.5mM MgSO4, 750mM NaCl, 20mM NaF, 1mM Na3VO4, pH=7.0), supplemented with protease/phosphatase inhibitors (Complete and PhosStop, Roche) and centrifuged at 50,000g for 20 min; the supernatant was collected as a RAB-soluble fraction. The pellet was resuspended in RIPA buffer (150mM NaCl, 50mM Tris, 0.5% deoxycholic acid, 1% Triton X-100, 0.1% SDS, 5mM EDTA, 20mM NaF, 1mM Na3VO4, pH 8.0 with protease/phosphatase inhibitors), sonicated, and centrifuged at 50,000×g for 20 min; the supernatant was collected as a RIPA-soluble fraction. The pellet was then dissolved in 70% formic acid, sonicated, and centrifuged at 50,000×g for 20 min; the supernatant was collected as a FA-soluble fraction. All fractions were stored at −80C until further analyzed.
Western Blot
Mouse brain tissues were lysed in RIPA buffer supplemented with protease/phosphatase inhibitors, sonicated, incubated on ice for 30 min and centrifuged at 20,000g for 15 min at 4C. Protein concentrations were determined with Micro BCA Protein Assay Kit. Proteins were separated by SDS-PAGE using 4–12% NuPage gels and then transferred on nitrocellulose membrane using iBlot2 system. The membranes were blocked with 1–5% milk in TBST buffer, incubated with primary antibodies (HJ-1 mouse monoclonal anti-Abca1-antibody, made in house or actin) overnight at 4C. The next day, membranes were incubated with corresponding secondary HRP-conjugated antibodies for 1hr at room temperature. The HRP-signal was developed with Pierce on ChemDoc MP Imaging System (Bio-Rad).
ELISA
Total tau, phospho-tau and ApoE Elisa were performed as described previously 25. Tau 5 (gift from L. Binder, Northwestern University, Chicago, IL), HJ14.5 (anti-human phospho-tau Thr181 antibody, made in-house) or HJ15.6 (anti-human ApoE antibody, made in-house) antibodies were used as coating antibodies for Tau or ApoE ELISAs. Biotinylated HT7 (ThermoFisher Scientific, MN1000B), AT8 (ThermoFisher#MN1020B) or HJ15.4 (in house-made) antibodies were used as detection antibodies for total tau, phospho-tau and ApoE ELISAs, respectively. Plasma neurofilament light chain (NfL) protein levels were measured by NF-Light Simoa Assay Advantage kit (103186) on Quanterix SIMOA HD-X according to manufacturer`s instructions. Invitrogen Immune Monitoring 48-Plex Mouse ProcartaPlex Panel (EPX480–20834-901) was used to measure cytokines/chemokines in mouse brain lysates and in conditioned media from primary microglia.
Fluorescent-activated cell sorting (FACS)
After perfusion with PBS, fresh mouse brain tissues were dissected into two hemispheres: one was used for immunostaining and forebrain lipidomic analysis, the other one - for preparation of single cell suspension for FACS using the Milteniy mouse brain dissociation kit according to manufacturer’s instructions (Milteniy Biotec 130–107-677). Cells were then blocked with Fc and stained with CD45-BV421, CD11b-FITC and ASCA2-APC antibodies for 25 minutes, washed in FACS buffer and passed through 100um filter prior to cell sorting as described previously 4,63. CD45+/CD11b+ microglia and ACSA-2+ astrocytes were separated by FACS Aria III (BD Biosciences) with a 100μm nozzle and collected for downstream qRT-PCR or lipidomic analyses.
Brain sample collection and preparation for LCMS analysis
Coronal mouse brain sections (1mm-thick) were flash frozen in liquid nitrogen after PBS perfusion. P301S/ApoE KI male and female mice (N=6/gender/genotype) were used in lipidomic experiments to account for potential sex-dependent differences in mouse brain lipidome (not detected). Otherwise, only male mice were used for lipidomics. Brain sections from matched forebrain regions were placed in a 1.5mL lo-bind tube (Eppendorf) containing a 3 mm stainless steel bead (QIAGEN) with 400 μL of LCMS grade methanol containing 2ul of internal standard master mix (see Table S1). Tubes were lysed using TissueLyser (QIAGEN) for 30 sec at 25Hz and 4°C. 20 μL of sample was removed for protein concentration measurements using the bicinchoninic acid (BCA) assay (Pierce, Rockford, IL, USA). Lysate was spun for 20 min, 18,000 × g at 4°C. Supernatant was transferred to new Eppendorf vials and incubated for 1 hr at −20 °C for further precipitation of proteins. These samples were centrifuged for at 21,000 × g for 10 min at 4 °C. Resultant supernatants were transferred to glass vials and stored at −80 °C until LCMS analyses. For LCMS of FACS-isolated cells, 400 μL of LCMS grade methanol containing internal standards was added, followed by 5 min shaking at 2000 rpm on a Thermomixer. Next, 800 μL of methyl-tert-butyl ether (MTBE) was added to each sample. After another 5 min shaking at 2000 rpm on a Thermomixer, samples were spun at 18,000 ×g for 10 min at 4°C. The MTBE supernatant was collected for LCMS analysis.
Targeted LC-MS/MS Lipidomic Analyses
Lipidomics profiling comparing the effects of ApoE KO and ApoE isoforms with or without tauopathy were performed as described previously using an ACQUITY I-Class Plus UPLC system coupled to XEVO TQ-S Micro triple quadrupole electrospray mass spectrometer (Waters).5 Lipidomics analyses examining the effects of LXR treatments were performed using an Agilent 1290 Infinity II UPLC system coupled to Agilent 6495c triple quadrupole electrospray mass spectrometer (Agilent). Targeted analysis of lipids were performed in both positive (141 lipid species) and negative (119 lipid species) ionization modes. For these analyses, 5 μl of above extracted samples were injected and analytes were resolved using an ACQUITY UPLC BEH C18 1.7 μm, 2.1 × 100 mm column (Waters) with flow rate set at 250 μl/min and column temperature set at 55 °C. For positive ionization mode, mobile phase A consisted of 60:40 acetonitrile/water (v/v) with 10 mM ammonium formate + 0.1% formic acid and mobile phase B consisted of 90:10 isopropyl alcohol/acetonitrile (v/v) with 10 mM ammonium formate + 0.1% formic acid. For negative ionization mode, mobile phase A consisted of 60:40 acetonitrile/water (v/v) with 10 mM ammonium acetate + 0.1% acetic acid; mobile phase B consisted of 90:10 isopropyl alcohol/acetonitrile (v/v) with 10 mM ammonium acetate + 0.1% acetic acid. The gradient was programmed as follows: 0.0–8.0 min from 45% B to 99% B, 8.0–9.0 min at 99% B, 9.0–9.1 min to 45% B, and 9.1–10.0 min at 45% B. Mass spectrometer source settings for XEVO TQ-S Micro were as follows: capillary voltage at 2.0 kV; source temperature at 150°C; desolvation temperature at 400°C; desolvation gas flow at 1000 L/hr; cone gas flow at 25 L/hr; cone voltage at 40 V; nebulizer gas at 7 bar. Source settings for Agilent 6495c were as follows: sheath gas temperature at 350 °C, sheath gas flow set at 12 l/min, gas temperature at 200 °C, gas flow set at 15 l/min, capillary voltage at 3.0 kV, nozzle voltage at 1.0 kV. Data acquisition was performed in multiple reaction monitoring mode (MRM) with the specific Q1/Q3 mass m/z values reported in Table S2. Lipids were identified based on specific retention times and mass transitions listed in Table S2. Glucosylceramide (GlcCer), galactosylceramide (GalCer), glucosylsphingosine (GlcSph) and galactosylsphingosine (GalSph) analyses were performed using an Agilent 1290 Infinity II UPLC system coupled to Agilent 6495c triple quadrupole electrospray mass spectrometer (Agilent). For each analysis, 10μL of sample was injected on a HALO HILIC 2.0 μm, 3.0 × 150 mm column (Advanced Materials Technology, Wilmington, DE, USA) using a flow rate of 0.45 mL/min at 45°C. Mobile phase A consisted of 92.5/5/2.5 acetonitrile/ isopropyl alcohol/water with 5 mM ammonium formate and 0.5% formic acid. Mobile phase B consisted of 92.5/5/2.5 water/ isopropyl alcohol/acetonitrile with 5 mM ammonium formate and 0.5% formic acid. The gradient was programmed as follows: 0.0–3.1 min at 100% B, 3.2 min at 95% B, 5.7 min at 85% B, hold to 7.1 min at 85% B, drop to 0% B at 7.25 min and hold to 8.75 min, ramp back to 100% at 10.65 min and hold to 11 min. Electrospray ionization was performed in the positive-ion mode applying the following settings: sheath gas temperature at 125 °C, gas flow set at 15 l/min, gas temperature at 225 °C, sheath gas flow was set at 3 l/min. Data acquisition was performed in MRM mode with the transitions and retention time values reported in Table S2.
For quantification, Skyline (Version 19, MacCoss Lab) was used to integrate and obtain areas for endogenous lipid species and those of spiked in internal standards. Areas of endogenous lipids were divided by specific spiked in surrogate internal standards of the same lipid classes listed in Table S2. Relative quantification of each lipid species was performed by dividing integrated areas of endogenous lipids with areas obtained from spiked in surrogate internal standards listed in Table S2.
Statistical analysis of lipidomics data
Area ratios of endogenous lipids were log2 transformed for all downstream analyses. Unwanted variations in data unrelated to biological factors of interests were removed using the ruv package (version 0.9.7.1). Statistical differences in means were assessed by using robust linear model using the limma package (version 3.52.4). Volcano plots of differentially regulated lipids were created using the enhanced volcano package (version 1.32.1). Heatmaps were created using the pheatmap package (version 1.0.12). Weighted lipid co-expression analysis was performed using the WGCNA package (version 1.71) using brain NfL values as quantitative trait. For this analysis, a thresholding power of 6 with minimum module size of 10 and cut height of 0.25 was used for initial clustering of lipid features. Association between 9 eigenlipids modules and tissue NfL concentrations were assessed by Pearson correlation. The association of specific lipids within eigenlipid modules significantly correlated with NfL was further investigated to identify top-drivers of NfL phenotype. All statistical analysis were performed using R statistical software (v4.2.1, R Core Team 2021).
RNA extraction and qRT-PCR analysis
Total RNA was extracted from frozen brain tissues using RNeasy mini kit (Qiagen, 71404) with Trizol. Reverse transcription was carried out using Superscript IV First Strand synthesis system (Invitrogen, 18091050). The qPCR analysis was performed using TaqMan primers using TaqMan Universal PCR Master Mix (Applied Biosystems, 43044437) on StepOnePlus or Quant Studio 12K Flex Real-Time PCR machines (Applied Biosystems) or Fluidigm Biobank HD Real-Time PCR System in collaboration with Genome Technology Access Core (GTAC) at Washington University in Saint-Louis.
Isolation of single nuclei from frozen tissues
Frozen hippocampi from 4 mice of the same genotype/treatment were pooled as a single sample. 8 mice per genotype/treatment were used to run the experiment in duplicates. Tissue was homogenized with Dounce homogenizer in lysis buffer (10mM Tris-HCl, pH 7.4, 10mM NaCl, 3mM MgCl2, 0.005% NP-40, 0.2 U/ul RNAase Inhibitors in nuclease-free water), and incubated on ice for 15 min. The suspension was filtered through a 30um MACS filter to remove debris and centrifuged at 500g for 5 min at 4C. After removal of supernatant, the nuclei pellet was washed, resuspended in Nuclei Wash Buffer (1% BSA and 0.2 U/ul RNAase Inhibitors in PBS) and centrifuged to remove cellular debris 2 more times. The nuclei pellet was then resuspended in 500ul of Nuclei Wash Buffer, mixed with 900ul Sucrose Cushion Buffer (2.7ml of Nuclei Pure 2M Sucrose Cushion Solution and 2ml of 1M Sucrose Cushion Solution mixture), layered on top of 500ul of Sucrose Cushion Buffer in a 2ml Eppendorf tube and centrifuged at 13,000 × g for 45 min at 4C. After centrifugation, the nuclear pellet was resuspended in Nuclei Wash and Resuspension Buffer. ~1200 nuclei/ul were then used for 10x Genomic protocol.
Single-nuclei RNA sequencing
Isolated nuclei from 4 groups of mice were subjected to droplet-based 3ènd massively parallel single-cell RNA sequencing using Chromium Single Cell 3` Reagents Kits (10x Genomics) following manufacturer`s instructions. The libraries were sequenced using Illumina HiSeq3000 machine at GTAC core at Washington University in Saint-Louis. Sample demultiplexing, barcode processing, and single-cell 3` counting were performed using the Cell Ranger Single-Cell Software Suite (10x Genomics). Cell Ranger count was used to align samples to a custom pre-mRNA reference package (mm10) containing the human APOE gene, quantify reads, and filter reads with a quality score below 30.
Data processing with Seurat package
The Seurat v3 package was used for data processing. For quality control, cell-free RNA contamination in each sample was removed using SoupX package in R. Nuclei with mitochondrial content >5% ot total UMI <200 or >300 were then removed, gene counts were normalized and variable features identified using the SCTransform function using Seurat. The top 3000 variable genes were used to integrate experimental groups using the PrepSCTIntegration, FindIntegrationAnchors, and IntegrateData commands in Seurat. Principal Component Analysis (PCA) was used on the integrated dataset to select top 20 PCA for downstream analysis using FindNeighbors algorithm. FindClusters algorithm with 0.1 – 1.2 granularity and 0.5 resolution was used to cell clustering analysis. Differential gene expression analysis with MAST test were performed using the MAST package to identify gene markers specific to individual cell clusters.64
Bulk RNA Sequencing and Analysis
Samples were prepared according to library kit manufacturer’s protocol, indexed, pooled, and sequenced on an Illumina NovaSeq 6000. Basecalls and demultiplexing were performed with Illumina’s bcl2fastq software and a custom python demultiplexing program with a maximum of one mismatch in the indexing read. RNA-seq reads were then aligned to the Ensembl release 101 primary assembly with STAR version 2.7.9a.65 Gene counts were derived from the number of uniquely aligned unambiguous reads by Subread:featureCount version 2.0.3.66 Isoform expression of known Ensembl transcripts were quantified with Salmon version 1.5.2.67 Sequencing performance was assessed for the total number of aligned reads, total number of uniquely aligned reads, and features detected. The ribosomal fraction, known junction saturation, and read distribution over known gene models were quantified with RSeQC version 4.0.68
All gene counts were then imported into the R/Bioconductor package EdgeR and TMM normalization size factors were calculated to adjust for samples for differences in library size.69 Ribosomal genes and genes not expressed in the smallest group size minus one samples greater than one count-per-million were excluded from further analysis. The TMM size factors and the matrix of counts were then imported into the R/Bioconductor package Limma.70 Weighted likelihoods based on the observed mean-variance relationship of every gene and sample were then calculated for all samples with the voomWithQualityWeights function and were fitted using a Limma generalized linear model with additional unknown latent effects as determined by surrogate variable analysis (SVA) 71. The performance of all genes was assessed with plots of the residual standard deviation of every gene to their average log-count with a robustly fitted trend line of the residuals. Differential expression analysis was then performed to analyze for differences between conditions and the results were filtered for only those genes with Benjamini-Hochberg false-discovery rate adjusted p-values less than or equal to 0.05.
For each contrast extracted with Limma, global perturbations in known Gene Ontology (GO) terms, MSigDb, and KEGG pathways were detected using the R/Bioconductor package GAGE to test for changes in expression of the reported log 2 fold-changes reported by Limma in each term versus the background log 2 fold-changes of all genes found outside the respective term.72 The R/Bioconductor package heatmap3was used to display heatmaps across groups of samples for each GO or MSigDb term with a Benjamini-Hochberg false-discovery rate adjusted p-value less than or equal to 0.05.73 Perturbed KEGG pathways where the observed log 2 fold-changes of genes within the term were significantly perturbed in a single-direction versus background or in any direction compared to other genes within a given term with p-values less than or equal to 0.05 were rendered as annotated KEGG graphs with the R/Bioconductor package Pathview. 74
To find the most critical genes, the Limma voomWithQualityWeights transformed log 2 counts-per-million expression data was then analyzed via weighted gene correlation network analysis with the R/Bioconductor package WGCNA.37 Briefly, all genes were correlated across each other by Pearson correlations and clustered by expression similarity into unsigned modules using a power threshold empirically determined from the data. An eigengene was then created for each de novo cluster and its expression profile was then correlated across all coefficients of the model matrix. Because these clusters of genes were created by expression profile rather than known functional similarity, the clustered modules were given the names of random colors where grey is the only module that has any pre-existing definition of containing genes that do not cluster well with others. These de-novo clustered genes were then tested for functional enrichment of known GO terms with hypergeometric tests available in the R/Bioconductor package clusterProfiler.38 Significant terms with Benjamini-Hochberg adjusted p-values less than 0.05 were then collapsed by similarity into clusterProfiler category network plots to display the most significant terms for each module of hub genes in order to interpolate the function of each significant module. The information for all clustered genes for each module were then combined with their respective statistical significance results from Limma to determine whether or not those features were also found to be significantly differentially expressed.
QUANTIFICATION AND STATISTICAL ANALYSIS
Statistics
All data were analyzed GraphPad Prism 9 software and presented as mean +/− SEM (* p<0.05, **p< 0.01, *** p <0.001, **** p<0.0001). For simple, two-group comparisons, Student`s t-test was used. For multiple comparisons, ANOVA followed by appropriate post-hoc testing was utilized and is specified for each experiment in the figure legend. All samples or animals were included in the statistical analysis, the value of n per group is included under figure legends.
Supplementary Material
Table.S1. Internal standard master mix composition. Related to “Brain sample collection and preparation for LCMS analysis“ STAR methods section.
Table S2. Internal standards retention times. Related to “Targeted LC-MS/MS Lipidomic Analyses“ STAR methods section.
KEY RESOURCES TABLE.
| REAGENT or RESOURCE | SOURCE | IDENTIFIER |
|---|---|---|
| Antibodies | ||
| Mouse monoclonal anti- Phopsho-tau (Ser202, Thr205) (AT8), biotinylated | Invitrogen | Cat#MN1020B; RRID: AB_223648 |
| Mouse monoclonal anti-tau (TAU-5) | Gift from L.Binder, Northwestern University | N/A |
| Mouse monoclonal anti-human tau (HT7) | Thermo Fisher Scientific | Cat#MN1000B; RRID: AB_223453 |
| Mouse monoclonal anti- Phospho-tau HJ14.5 (Thr181) | Produced in-house | N/A |
| Mouse monoclonal ApoE HJ15.6 | Produced in-house | N/A |
| Mouse monoclonal ApoE biotinylated HJ15.4 | Produced in-house | N/A |
| Goat polyclonal anti-Iba1 | Abcam | Cat#ab5076, RRID:AB_2224402 |
| Rabbit polyclonal anti-Iba1 | Waco | Cat#019-19741; RRID:AB_839504 |
| Mouse monoclonal anti-GFAP | Millipore Sigma | Cat#MAB3402; RRID:AB_94844 |
| Goat polyclonal anti-GFAP | Abcam | Cat#ab53554; RRID:AB_880202 |
| Rat polyclonal anti-CD68, clone FA-11 | Biolegend | Cat#137013; RRID:AB_10613469 |
| Rabbit anti-Synaptophysin | Abcam | Cat#ab32127; RRID:AB_2286949 |
| Mouse monoclonal anti-PSD95 | Millipore Sigma | Cat#MAB1596; RRID:AB_2092365 |
| Mouse monoclonal anti-Abca1 HJ.1 | Produced in-house | N/A |
| Rabbit polyclonal anti-ApoE | Cell Signaling Technology | Cat#13366; RRID: AB_2798191 |
| Rabbit polyclonal anti-P2ry12 | Gift from Dr. Oleg Butovsky, Harvard University | N/A |
| Rat monoclonal anti-Clec7a | InvivoGen | Cat#mabg-mdect; RRID: AB_2753143 |
| Rabbit monoclonal anti-Pan-Actin (D18C11) | Cell Signaling Technology | Cat#8456; RRID: AB_10998774 |
| Donkey anti-mouse CD45-BV421 | BD Biosciences | Cat#563890; RRID: AB_2651151 |
| Donkey anti-mouse CD11b-FITC | BD Biosciences | Cat#553310; RRID: AB_394774 |
| Donkey anti-mouse ACSA2-APC | Miltenyi Biotec | Cat#130-102-315; RRID: AB_2651190 |
| Mouse monoclonal anti-E06 | Avanti Polar Lipids | Cat#330001S |
| Mouse monoclonal anti-CD8 | Invitrogen | Cat#MA1-145 |
| Chemicals, Peptides, and Recombinant Proteins | ||
| GW3965 | MCE Inhibitors | Cat#HY-10627 |
| BODIPY | Invitrogen | Cat#D3922 |
| Cresyl Violet | Millipore Sigma | Cat#5042 |
| Mouse BD Fc Block | BD Biosciences | Cat#553141 |
| TMB super slow substrate for ELISA | Millipore Sigma | Cat#T5569 |
| LipidTox Green Neutral Lipid Stain | Invitrogen | Cat#H34475 |
| Critical Commercial Assays | ||
| NF-Light Simoa Assay Advantage Kit | Quanterix | Cat#103186 |
| VECTASTAIN Elite ABC-HRP Kit, Perpxidase (Standard) | Vector Laboratories | Cat#PK-6100 |
| DAB Eqv Peroxidase (HRP) Substrate | Vector Laboratories | Cat#SK-4103 |
| Micro BCA Protein Assay Kit | Thermo Fisher Scientific | Cat#23235 |
| RNeasy Mini Kit | QIAGEN | Cat#74104 |
| Nuclei Isolation Kit: Nuclei PURE Prep | Sigma-Aldrich | Cat#NUC201 |
| SuperScript IV RNA-cDNA System | Invitrogen | Cat#18091050 |
| Pierce ECL Plus | Invitrogen | Cat#32132 |
| Adult Mouse Brain Association Kit | Miltenyi Biotec | Cat#130-107-677 |
| TaqMan Universal PCR Master Mix | Invitrogen | Cat#4304437 |
| Immune Monitoring 48-Plex Mouse ProcartaPlex™ Panel | Invitrogen | Cat#EPX480-20834-901 |
| Deposited Data | ||
| Bulk RNAseq raw data | This paper | GSE242693 |
| snRNAseq raw data | This paper | GSE242180 |
| Experimental Models: Organisms/Strains | ||
| Mouse: ApoE4 flox/flox | Produced in-house | Huynh et al., 2017 |
| Mouse: ApoE3 flox/flox | Produced in-house | Huynh et al., 2017 |
| Mouse: ApoE KO line (B6.129P2-Apoetm1Unc/J) | Jackson Laboratory | Cat: #002052 RRID: IMSR_JAX:002052 |
| Mouse: PS19 (P301S Tau) line (B6; C3-Tg (Prnp MAPT*P301S) PS19Vle/J) | Jackson Laboratory | Cat#008169; RRID: IMSR_JAX:008169 |
| Mouse: Abca1 line D (mouse 2-fold Abca1 overexpression under PrnP promoter) | Produced in-house | Wahrle et al., 2004 |
| Oligonucleotides | ||
| Taqman mouse Abca1 primer | Invitrogen | Cat#: Mm00442646_m1 |
| Taqman mouse Gapdh primer | Invitrogen | Cat#: Mm99999915_g1 |
| Software and Algorithms | ||
| Prism 8 | GraphPad | |
| Fiji, ImageJ, 1.53c | National Institute of Health (NIH) | |
| NDP.view 2.7.25 | Hamamatsu | |
| R 3.6.3 | RStudio | |
| Imaris 11 | Bitplane | |
| SoupX R packages | ||
| Seurat v3 | ||
| Fgsear 3.12 | ||
| Other | ||
| Zeiss LSM 980 Airyscan FAST Confocal Microscope | Zeiss | Zeiss LSM 980 Airyscan FAST |
| Leica Stellaris 8 Confocal Microscope | Leica | Stellaris 8 |
| Hamamatsu Nanozoomer HT | Hamamatsu | Nanozoomer HT |
Highlights.
Lipidomic profiling reveals changes in cholesterol metabolism in P301S/ApoE4 mice.
LXR agonist GW3965 decreases tauopathy and neuroinflammation in P301S/E4 mice.
LXR agonist upregulates Abca1 and reduces lipid accumulation in vivo and in vitro.
Abca1 overexpression mitigates tauopathy and neuroinflammation in P301S/ApoE4 mice.
ACKNOWLEDGMENTS
This study was supported by the NIH grants NS090934, AG047644, 1U19AG069701 (DMH) and the BrightFocus Foundation Postdoctoral Fellowship A2022010F (AL). Immunohistochemical imaging was performed using Nano-Zoomer digital pathology system at the Hope Center Alafi Neuroimaging Laboratory. Confocal imaging was generated using Zeiss LSM 980 Airyscan confocal microscope (OD021629). We thank the Genome Technology Access Center (GTAC) in the Department of Genetics and Bursky Center for Human Immunology and Immunotherapy Core in the Department of Pathology and Immunology at Washington University School of Medicine, and the Flow Cytometry Core at Siteman Cancer at Barnes-Jewish Hospital for their assistance with Fluidigm RT-PCR analysis and FACS sorting. We also thank Jamal Alkabsh and Dylan Braun for technical assistance in lipidomic experiments.
Footnotes
DECLARATION OF INTERESTS
D.M.H. is on the scientific advisory board of C2N diagnostics and has equity. D.M.H. is on the scientific advisory board of Denali Therapeutics, Genentech, and Cajal Therapeutics and consults for Asteroid Therapeutics. J.H.S., J.L.G., H.P.B., S.S.D. and G.D.P. are full-time employees and shareholders of Denali Therapeutics Inc. K.L and N.B-L. are former employees of Denali Therapeutics Inc. All other authors declare no competing interests.
ADDITIONAL RESOURCES
None
Publisher's Disclaimer: This is a PDF file of an unedited manuscript that has been accepted for publication. As a service to our customers we are providing this early version of the manuscript. The manuscript will undergo copyediting, typesetting, and review of the resulting proof before it is published in its final form. Please note that during the production process errors may be discovered which could affect the content, and all legal disclaimers that apply to the journal pertain.
REFERENCES
- 1.Holtzman DM, Herz J, and Bu G (2012). Apolipoprotein E and apolipoprotein E receptors: Normal biology and roles in Alzheimer disease. Cold Spring Harb. Perspect. Med. 2, a006312. 10.1101/cshperspect.a006312. [DOI] [PMC free article] [PubMed] [Google Scholar]
- 2.Shi Y, and Holtzman DM (2018). Interplay between innate immunity and Alzheimer disease: APOE and TREM2 in the spotlight. Nat. Rev. Immunol. 18, 759–772. 10.1038/s41577-018-0051-1. [DOI] [PMC free article] [PubMed] [Google Scholar]
- 3.Marschallinger J, Iram T, Zardeneta M, Lee SE, Lehallier B, Haney MS, Pluvinage JV, Mathur V, Hahn O, David W, et al. (2020). Nature Neurosceince. Nat. Neurosci. 23, 194–208. 10.1038/s41593-019-0566-1.Lipid. [DOI] [PMC free article] [PubMed] [Google Scholar]
- 4.Nugent AA, Lin K, van Lengerich B, Lianoglou S, Przybyla L, Davis SS, Llapashtica C, Wang J, Kim DJ, Xia D, et al. (2020). TREM2 Regulates Microglial Cholesterol Metabolism upon Chronic Phagocytic Challenge. Neuron 105, 837–854.e9. 10.1016/j.neuron.2019.12.007. [DOI] [PubMed] [Google Scholar]
- 5.Logan T, Simon MJ, Rana A, Cherf GM, Srivastava A, Davis SS, Low RLY, Chiu CL, Fang M, Huang F, et al. (2021). Rescue of a lysosomal storage disorder caused by Grn loss of function with a brain penetrant progranulin biologic. Cell 184, 4651–4668.e25. 10.1016/j.cell.2021.08.002. [DOI] [PMC free article] [PubMed] [Google Scholar]
- 6.TCW J, Qian L, Pipalia NH, Chao MJ, Liang SA, Shi Y, Jain BR, Bertelsen SE, Kapoor M, Marcora E, et al. (2022). Cholesterol and matrisome pathways dysregulated in astrocytes and microglia. Cell 185, 2213–2233.e25. 10.1016/j.cell.2022.05.017. [DOI] [PMC free article] [PubMed] [Google Scholar]
- 7.Victor MB, Leary N, Luna X, Meharena HS, Bozzelli PL, Samaan G, Murdock MH, Maydell D von, Effenberger, A.H., Cerit, O., et al. (2022). Lipid Accumulation Induced by APOE4 Impairs Microglial Surveillance of Neuronal-Network Activity. Cell Stem Cell 29, 1197–1212. 10.1016/j.stem.2022.07.005. [DOI] [PMC free article] [PubMed] [Google Scholar]
- 8.Lin YT, Seo J, Gao F, Feldman HM, Wen HL, Penney J, Cam HP, Gjoneska E, Raja WK, Cheng J, et al. (2018). APOE4 Causes Widespread Molecular and Cellular Alterations Associated with Alzheimer’s Disease Phenotypes in Human iPSC-Derived Brain Cell Types. Neuron 98, 1141–1154.e7. 10.1016/j.neuron.2018.05.008. [DOI] [PMC free article] [PubMed] [Google Scholar]
- 9.Blanchard JW, Akay LA, Davila-Velderrain J, von Maydell D, Mathys H, Davidson SM, Effenberger A, Chen C-Y, Maner-Smith K, Hajjar I, et al. (2022). APOE4 impairs myelination via cholesterol dysregulation in oligodendrocytes. Nature 611, 769–779. 10.1038/s41586-022-05439-w. [DOI] [PMC free article] [PubMed] [Google Scholar]
- 10.Cantuti-Castelvetri L, Fitzner D, Bosch-Queralt M, Weil M-T, Su M, Sen P, Ruhwedel T, Mitkovski M, Trendelenburg G, Lutjohann D, et al. (2018). Defective cholesterol clearance limits remyelination in the aged central nervous system. Science (80-. ). 688, 684–688. [DOI] [PubMed] [Google Scholar]
- 11.Lewcock JW, Schlepckow K, Di Paolo G, Tahirovic S, Monroe KM, and Haass C (2020). Emerging Microglia Biology Defines Novel Therapeutic Approaches for Alzheimer’s Disease. Neuron 108, 801–821. 10.1016/j.neuron.2020.09.029. [DOI] [PubMed] [Google Scholar]
- 12.Romero-Molina C, Garretti F, Andrews SJ, Marcora E, and Goate AM (2022). Microglial efferocytosis: Diving into the Alzheimer’s disease gene pool. Neuron 110, 3513–3533. 10.1016/j.neuron.2022.10.015. [DOI] [PMC free article] [PubMed] [Google Scholar]
- 13.Holstege H, Hulsman M, Charbonnier C, Grenier-Boley B, Quenez O, Grozeva D, van Rooij JGJ, Sims R, Ahmad S, Amin N, et al. (2022). Exome sequencing identifies rare damaging variants in ATP8B4 and ABCA1 as risk factors for Alzheimer ‘ s disease. Nat. Genet. 54, 1786–1794. 10.1038/s41588-022-01208-7. [DOI] [PMC free article] [PubMed] [Google Scholar]
- 14.Brecht WJ, Harris FM, Chang S, Tesseur I, Yu GQ, Xu Q, Fish JD, Wyss-Coray T, Buttini M, Mucke L, et al. (2004). Neuron-Specific Apolipoprotein E4 Proteolysis Is Associated with Increased Tau Phosphorylation in Brains of Transgenic Mice. J. Neurosci. 24, 2527–2534. 10.1523/JNEUROSCI.4315-03.2004. [DOI] [PMC free article] [PubMed] [Google Scholar]
- 15.Agosta F, Vossel KA, Miller BL, Migliaccio R, Bonasera SJ, Filippi M, Boxer AL, Karydas A, Possin KL, and Gorno-Tempini ML (2009). Apolipoprotein E ε4 is associated with disease-specific effects on brain atrophy in Alzheimer’s disease and frontotemporal dementia. Proc. Natl. Acad. Sci. U. S. A. 106, 2018–2022. 10.1073/pnas.0812697106. [DOI] [PMC free article] [PubMed] [Google Scholar]
- 16.Shi Y, Yamada K, Liddelow SA, Smith ST, Zhao L, Luo W, Tsai RM, Spina S, Grinberg LT, Rojas JC, et al. (2017). ApoE4 markedly exacerbates tau-mediated neurodegeneration in a mouse model of tauopathy. Nature 549, 523–527. 10.1038/nature24016. [DOI] [PMC free article] [PubMed] [Google Scholar]
- 17.Shi Y, Manis M, Long J, Wang K, Sullivan PM, Serrano JR, Hoyle R, and Holtzman DM (2019). Microglia drive APOE-dependent neurodegeneration in a tauopathy mouse model. J. Exp. Med. 216, 2546–2561. 10.1084/jem.20190980. [DOI] [PMC free article] [PubMed] [Google Scholar]
- 18.Gratuze M, Schlachetzki JCM, D’Oliveira Albanus R, Jain N, Novotny B, Brase L, Rodriguez L, Mansel C, Kipnis M, O’Brien S, et al. (2022). TREM2-independent microgliosis promotes tau-mediated neurodegeneration in the presence of ApoE4. Neuron, 1–18. 10.1016/j.neuron.2022.10.022. [DOI] [PMC free article] [PubMed] [Google Scholar]
- 19.Seo D-O, O’Donnell D, Jain N, Ulrich JD, Herz J, Li Y, Lemieux M, Cheng J, Hu H, Serrano JR, et al. (2023). ApoE isoform- and microbiota-dependent progression of neurodegeneration in a mouse model of tauopathy. Science 379, eadd1236. 10.1126/science.add1236. [DOI] [PMC free article] [PubMed] [Google Scholar]
- 20.Dong Y, D’Mello C, Pinsky W, Lozinski BM, Kaushik DK, Ghorbani S, Moezzi D, Brown D, Melo FC, Zandee S, et al. (2021). Oxidized phosphatidylcholines found in multiple sclerosis lesions mediate neurodegeneration and are neutralized by microglia. Nat. Neurosci. 24, 489–503. 10.1038/s41593-021-00801-z. [DOI] [PubMed] [Google Scholar]
- 21.Sienski G, Narayan P, Bonner JM, Kory N, Boland S, Arczewska AA, Ralvenius WT, Akay L, Lockshin E, He L, et al. (2021). APOE4 disrupts intracellular lipid homeostasis in human iPSC-derived glia. Sci. Transl. Med. 13, 1–12. 10.1126/scitranslmed.aaz4564. [DOI] [PMC free article] [PubMed] [Google Scholar]
- 22.Khalil M, Teunissen CE, Otto M, Piehl F, Sormani MP, Gattringer T, Barro C, Kappos L, Comabella M, Fazekas F, et al. (2018). Neurofilaments as biomarkers in neurological disorders. Nat. Rev. Neurol. 14, 577–589. 10.1038/s41582-018-0058-z. [DOI] [PubMed] [Google Scholar]
- 23.DeVos SL, Miller RL, Schoch KM, Holmes BB, Kebodeaux CS, Wegener AJ, Chen G, Shen T, Tran H, Nichols B, et al. (2017). Tau reduction prevents neuronal loss and reverses pathological tau deposition and seeding in mice with tauopathy. Sci. Transl. Med. 9, 1–15. 10.1126/scitranslmed.aag0481. [DOI] [PMC free article] [PubMed] [Google Scholar]
- 24.Wang C, Xiong M, Gratuze M, Bao X, Shi Y, Andhey PS, Manis M, Schroeder C, Yin Z, Madore C, et al. (2021). Selective removal of astrocytic APOE4 strongly protects against tau-mediated neurodegeneration and decreases synaptic phagocytosis by microglia. Neuron 109, 1657–1674.e7. 10.1016/j.neuron.2021.03.024. [DOI] [PMC free article] [PubMed] [Google Scholar]
- 25.Litvinchuk A, Huynh TPV, Shi Y, Jackson RJ, Finn MB, Manis M, Francis CM, Tran AC, Sullivan PM, Ulrich JD, et al. (2021). Apolipoprotein E4 Reduction with Antisense Oligonucleotides Decreases Neurodegeneration in a Tauopathy Model. Ann. Neurol. 89, 952–966. 10.1002/ana.26043. [DOI] [PMC free article] [PubMed] [Google Scholar]
- 26.Laffitte BA, Repa JJ, Joseph SB, Wilpitz DC, Kast HR, Mangelsdorf DJ, and Tontonoz P (2001). LXRs control lipid-inducible expression of the apolipoprotein E gene in macrophages and adipocytes. Proc. Natl. Acad. Sci. U. S. A. 98, 507–512. 10.1073/pnas.98.2.507. [DOI] [PMC free article] [PubMed] [Google Scholar]
- 27.Donkin JJ, Stukas S, Hirsch-Reinshagen V, Namjoshi D, Wilkinson A, May S, Chan J, Fan J, Collins J, and Wellington CL (2010). ATP-binding cassette transporter A1 mediates the beneficial effects of the liver X receptor agonist GW3965 on object recognition memory and amyloid burden in amyloid precursor protein/presenilin 1 mice. J. Biol. Chem. 285, 34144–34154. 10.1074/jbc.M110.108100. [DOI] [PMC free article] [PubMed] [Google Scholar]
- 28.Yoshiyama Y, Higuchi M, Zhang B, Huang SM, Iwata N, Saido T, Maeda J, Suhara T, Trojanowski JQ, and Lee VMY (2007). Synapse Loss and Microglial Activation Precede Tangles in a P301S Tauopathy Mouse Model. Neuron 53, 337–351. 10.1016/j.neuron.2007.01.010. [DOI] [PubMed] [Google Scholar]
- 29.Litvinchuk A, Wan Y-W, Swartzlander DB, Chen F, Cole A, Propson NE, Wang Q, Zhang B, Liu Z, and Zheng H (2018). Complement C3aR Inactivation Attenuates Tau Pathology and Reverses an Immune Network Deregulated in Tauopathy Models and Alzheimer’s Disease. Neuron, 1–17. 10.1016/j.neuron.2018.10.031. [DOI] [PMC free article] [PubMed] [Google Scholar]
- 30.Mancuso R, Fryatt G, Cleal M, Obst J, Pipi E, Monzón-Sandoval J, Ribe E, Winchester L, Webber C, Nevado A, et al. (2019). CSF1R inhibitor JNJ-40346527 attenuates microglial proliferation and neurodegeneration in P301S mice. Brain 142, 3243–3264. 10.1093/brain/awz241. [DOI] [PMC free article] [PubMed] [Google Scholar]
- 31.Chen X, Firulyova M, Manis M, Herz J, Smirnov I, Aladyeva E, Wang C, Bao X, Finn MB, Hu H, et al. (2023). Microglia-mediated T cell infiltration drives neurodegeneration in tauopathy. Nature 615, 668–677. 10.1038/s41586-023-05788-0. [DOI] [PMC free article] [PubMed] [Google Scholar]
- 32.Schafer DP, Lehrman EK, Kautzman AG, Koyama R, Mardinly AR, Yamasaki R, Ransohoff RM, Greenberg ME, Barres BA, and Stevens B (2012). Microglia Sculpt Postnatal Neural Circuits in an Activity and Complement-Dependent Manner. Neuron 74, 691–705. 10.1016/j.neuron.2012.03.026. [DOI] [PMC free article] [PubMed] [Google Scholar]
- 33.Hong S, Beja-Glasser VF, Nfonoyim BM, Frouin A, Li S, Ramakrishnan S, Merry KM, Shi Q, Rosenthal A, Barres BA, et al. (2016). Complement and microglia mediate early synapse loss in Alzheimer mouse models. Science (80-. ). 352, 712–716. 10.1126/science.aad8373. [DOI] [PMC free article] [PubMed] [Google Scholar]
- 34.Krasemann S, Madore C, Cialic R, Baufeld C, Calcagno N, El Fatimy R, Beckers L, O’Loughlin E, Xu Y, Fanek Z, et al. (2017). The TREM2-APOE Pathway Drives the Transcriptional Phenotype of Dysfunctional Microglia in Neurodegenerative Diseases. Immunity 47, 566–581.e9. 10.1016/j.immuni.2017.08.008. [DOI] [PMC free article] [PubMed] [Google Scholar]
- 35.Keren-Shaul H, Spinrad A, Weiner A, Matcovitch-Natan O, Dvir-Szternfeld R, Ulland TK, David E, Baruch K, Lara-Astaiso D, Toth B, et al. (2017). A Unique Microglia Type Associated with Restricting Development of Alzheimer’s Disease. Cell 169, 1276–1290.e17. 10.1016/j.cell.2017.05.018. [DOI] [PubMed] [Google Scholar]
- 36.Habib N, McCabe C, Medina S, Varshavsky M, Kitsberg D, Dvir-Szternfeld R, Green G, Dionne D, Nguyen L, Marshall JL, et al. (2020). Disease-associated astrocytes in Alzheimer’s disease and aging. Nat. Neurosci. 23, 701–706. 10.1038/s41593-020-0624-8. [DOI] [PMC free article] [PubMed] [Google Scholar]
- 37.Langfelder P, and Horvath S (2008). WGCNA: An R package for weighted correlation network analysis. BMC Bioinformatics 9. 10.1186/1471-2105-9-559. [DOI] [PMC free article] [PubMed] [Google Scholar]
- 38.Yu G, Wang LG, Han Y, and He QY (2012). ClusterProfiler: An R package for comparing biological themes among gene clusters. Omi. A J. Integr. Biol. 16, 284–287. 10.1089/omi.2011.0118. [DOI] [PMC free article] [PubMed] [Google Scholar]
- 39.Wahrle SE, Jiang H, Parsadanian M, Kim J, Li A, Knoten A, Jain S, Hirsch-Reinshagen V, Wellington CL, Bales KR, et al. (2008). Overexpression of ABCA1 reduces amyloid deposition in the PDAPP mouse model of Alzheimer disease. J. Clin. Invest. 118, 671–682. 10.1172/JCI33622. [DOI] [PMC free article] [PubMed] [Google Scholar]
- 40.Miranda AM, Ashok A, Chan RB, Zhou B, Xu Y, McIntire LB, Area-Gomez E, Di Paolo G, Duff KE, Oliveira TG, et al. (2022). Effects of APOE4 allelic dosage on lipidomic signatures in the entorhinal cortex of aged mice. Transl. Psychiatry 12, 129. 10.1038/s41398-022-01881-6. [DOI] [PMC free article] [PubMed] [Google Scholar]
- 41.Xia D, Lianoglou S, Sandmann T, Calvert M, Suh JH, Thomsen E, Dugas J, Pizzo ME, DeVos SL, Earr TK, et al. (2022). Novel App knock-in mouse model shows key features of amyloid pathology and reveals profound metabolic dysregulation of microglia. Mol. Neurodegener. 17, 41. 10.1186/s13024-022-00547-7. [DOI] [PMC free article] [PubMed] [Google Scholar]
- 42.Simon MJ, Logan T, DeVos SL, and Di Paolo G (2023). Lysosomal functions of progranulin and implications for treatment of frontotemporal dementia. Trends Cell Biol. 33, 324–339. 10.1016/j.tcb.2022.09.006. [DOI] [PubMed] [Google Scholar]
- 43.Chan RB, Oliveira TG, Cortes EP, Honig LS, Duff KE, Small SA, Wenk MR, Shui G, and Di Paolo G (2012). Comparative lipidomic analysis of mouse and human brain with Alzheimer disease. J. Biol. Chem. 287, 2678–2688. 10.1074/jbc.M111.274142. [DOI] [PMC free article] [PubMed] [Google Scholar]
- 44.Duewell P, Kono H, Rayner KJ, Sirois CM, Vladimer G, Bauernfeind FG, Abela GS, Franchi L, Nuñez G, Schnurr M, et al. (2010). NLRP3 inflammasomes are required for atherogenesis and activated by cholesterol crystals. Nature 464, 1357–1361. 10.1038/nature08938. [DOI] [PMC free article] [PubMed] [Google Scholar]
- 45.Andreone BJ, Przybyla L, Llapashtica C, Rana A, Davis SS, van Lengerich B, Lin K, Shi J, Mei Y, Astarita G, et al. (2020). Alzheimer’s-associated PLCγ2 is a signaling node required for both TREM2 function and the inflammatory response in human microglia. Nat. Neurosci. 23, 927–938. 10.1038/s41593-020-0650-6. [DOI] [PubMed] [Google Scholar]
- 46.Zelcer N, Khanlou N, Clare R, Jiang Q, Reed-Geaghan EG, Landreth GE, Vinters HV, and Tontonoz P (2007). Attenuation of neuroinflammation and Alzheimer’s disease pathology by liver x receptors. Proc. Natl. Acad. Sci. U. S. A. 104, 10601–10606. 10.1073/pnas.0701096104. [DOI] [PMC free article] [PubMed] [Google Scholar]
- 47.Carter AY, Letronne F, Fitz NF, Mounier A, Wolfe CM, Nam KN, Reeves VL, Kamboh H, Lefterov I, and Koldamova R (2017). Liver X receptor agonist treatment significantly affects phenotype and transcriptome of APOE3 and APOE4 Abca1 haplo-deficient mice. PLoS One 12, e0172161. 10.1371/journal.pone.0172161. [DOI] [PMC free article] [PubMed] [Google Scholar]
- 48.Boehm-Cagan A, and Michaelson DM (2014). Reversal of apoE4-driven brain pathology and behavioral deficits by bexarotene. J. Neurosci. Off. J. Soc. Neurosci. 34, 7293–7301. 10.1523/JNEUROSCI.5198-13.2014. [DOI] [PMC free article] [PubMed] [Google Scholar]
- 49.Fitz NF, Cronican A, Pham T, Fogg A, Fauq AH, Chapman R, Lefterov I, and Koldamova R (2010). Liver X receptor agonist treatment ameliorates amyloid pathology and memory deficits caused by high-fat diet in APP23 mice. J. Neurosci. 30, 6862–6872. 10.1523/JNEUROSCI.1051-10.2010. [DOI] [PMC free article] [PubMed] [Google Scholar]
- 50.Kratzer A, Buchebner M, Pfeifer T, Becker TM, Uray G, Miyazaki M, Miyazaki-Anzai S, Ebner B, Chandak PG, Kadam RS, et al. (2009). Synthetic LXR agonist attenuates plaque formation in apoE−/−mice without inducing liver steatosis and hypertriglyceridemia. J. Lipid Res. 50, 312–326. 10.1194/jlr.M800376-JLR200. [DOI] [PMC free article] [PubMed] [Google Scholar]
- 51.Joseph SB, Castrillo A, Laffitte BA, Mangelsdorf DJ, and Tontonoz P (2003). Reciprocal regulation of inflammation and lipid metabolism by liver X receptors. Nat. Med. 9, 213–219. 10.1038/nm820. [DOI] [PubMed] [Google Scholar]
- 52.Pascual-García M, Rué L, León T, Julve J, Carbó JM, Matalonga J, Auer H, Celada A, Escolà-Gil JC, Steffensen KR, et al. (2013). Reciprocal negative cross-talk between liver X receptors (LXRs) and STAT1: effects on IFN-γ-induced inflammatory responses and LXR-dependent gene expression. J. Immunol. 190, 6520–6532. 10.4049/jimmunol.1201393. [DOI] [PubMed] [Google Scholar]
- 53.Wang C, Fan L, Khawaja RR, Liu B, Zhan L, Kodama L, Chin M, Li Y, Le D, Zhou Y, et al. (2022). Microglial NF-κB drives tau spreading and toxicity in a mouse model of tauopathy. Nat. Commun. 13. 10.1038/s41467-022-29552-6. [DOI] [PMC free article] [PubMed] [Google Scholar]
- 54.Quintanilla R. a., Orellana DI, González-Billault C, and Maccioni RB (2004). Interleukin-6 induces Alzheimer-type phosphorylation of tau protein by deregulating the cdk5/p35 pathway. Exp. Cell Res. 295, 245–257. 10.1016/j.yexcr.2004.01.002. [DOI] [PubMed] [Google Scholar]
- 55.Li Y, Liu L, Barger SW, Sue W, and Griffin T (2003). Interleukin-1 Mediates Pathological Effects of Microglia on Tau Phosphorylation and on Synaptophysin Synthesis in Cortical Neurons through a p38-MAPK Pathway. 23, 1605–1611. 23/5/1605 [pii]. [DOI] [PMC free article] [PubMed] [Google Scholar]
- 56.Ising C, Venegas C, Zhang S, Scheiblich H, Schmidt SV, Vieira-Saecker A, Schwartz S, Albasset S, McManus RM, Tejera D, et al. (2019). NLRP3 inflammasome activation drives tau pathology. Nature 575, 669–673. 10.1038/s41586-019-1769-z. [DOI] [PMC free article] [PubMed] [Google Scholar]
- 57.van der Kant R, Langness VF, Herrera CM, Williams DA, Fong LK, Leestemaker Y, Steenvoorden E, Rynearson KD, Brouwers JF, Helms JB, et al. (2019). Cholesterol Metabolism Is a Druggable Axis that Independently Regulates Tau and Amyloid-β in iPSC-Derived Alzheimer’s Disease Neurons. Cell Stem Cell 24, 363–375.e9. 10.1016/j.stem.2018.12.013. [DOI] [PMC free article] [PubMed] [Google Scholar]
- 58.Deacon RMJ (2006). Assessing nest building in mice. Nat. Protoc. 1, 1117–1119. 10.1038/nprot.2006.170. [DOI] [PubMed] [Google Scholar]
- 59.Yuede CM, Wozniak DF, Creeley CE, Taylor GT, Olney JW, and Farber NB (2010). Behavioral consequences of NMDA antagonist-induced neuroapoptosis in the infant mouse brain. PLoS One 5, e11374. 10.1371/journal.pone.0011374. [DOI] [PMC free article] [PubMed] [Google Scholar]
- 60.Huynh TPV, Wang C, Tran AC, Tabor GT, Mahan TE, Francis CM, Finn MB, Spellman R, Manis M, Tanzi RE, et al. (2019). Lack of hepatic apoE does not influence early Aβ deposition: Observations from a new APOE knock-in model. Mol. Neurodegener. 14, 37. 10.1186/s13024-019-0337-1. [DOI] [PMC free article] [PubMed] [Google Scholar]
- 61.Rolfe AJ, Bosco DB, Broussard EN, and Ren Y (2017). In Vitro Phagocytosis of Myelin Debris by Bone Marrow-Derived Macrophages. J. Vis. Exp. 10.3791/56322. [DOI] [PMC free article] [PubMed] [Google Scholar]
- 62.Schafer DP, Lehrman EK, Heller CT, and Stevens B (2014). An engulfment assay: A protocol to assess interactions between CNS phagocytes and neurons. J. Vis. Exp. 88. 10.3791/51482. [DOI] [PMC free article] [PubMed] [Google Scholar]
- 63.Swartzlander DB, Propson NE, Roy ER, Wang B, Zheng H, Saito T, and Saido T (2018). Concurrent cell type–specific isolation and profiling of mouse brains in inflammation and Alzheimer’s disease. JCI Insight 3, 1–14. 10.1172/jci.insight.121109. [DOI] [PMC free article] [PubMed] [Google Scholar]
- 64.Finak G, McDavid A, Yajima M, Deng J, Gersuk V, Shalek AK, Slichter CK, Miller HW, McElrath MJ, Prlic M, et al. (2015). MAST: A flexible statistical framework for assessing transcriptional changes and characterizing heterogeneity in single-cell RNA sequencing data. Genome Biol. 16, 1–13. 10.1186/s13059-015-0844-5. [DOI] [PMC free article] [PubMed] [Google Scholar]
- 65.Dobin A, Davis CA, Schlesinger F, Drenkow J, Zaleski C, Jha S, Batut P, Chaisson M, and Gingeras TR (2013). STAR: Ultrafast universal RNA-seq aligner. Bioinformatics 29, 15–21. 10.1093/bioinformatics/bts635. [DOI] [PMC free article] [PubMed] [Google Scholar]
- 66.Liao Y, Smyth GK, and Shi W (2014). FeatureCounts: An efficient general purpose program for assigning sequence reads to genomic features. Bioinformatics 30, 923–930. 10.1093/bioinformatics/btt656. [DOI] [PubMed] [Google Scholar]
- 67.Patro R, Duggal G, Love MI, Irizarry RI, and Kinsford C (2017). Salmon: fast and bias-aware quantification of transcript expression using dual-phase inference. Nat.Methods 14, 417–419. 10.5040/9781635577068-1566. [DOI] [PMC free article] [PubMed] [Google Scholar]
- 68.Wang L, Wang S, and Li W (2012). RSeQC: Quality control of RNA-seq experiments. Bioinformatics 28, 2184–2185. 10.1093/bioinformatics/bts356. [DOI] [PubMed] [Google Scholar]
- 69.Robinson MD, McCarthy DJ, and Smyth GK (2009). edgeR: A Bioconductor package for differential expression analysis of digital gene expression data. Bioinformatics 26, 139–140. 10.1093/bioinformatics/btp616. [DOI] [PMC free article] [PubMed] [Google Scholar]
- 70.Ritchie ME, Phipson B, Wu D, Hu Y, Law CW, Shi W, and Smyth GK (2015). Limma powers differential expression analyses for RNA-sequencing and microarray studies. Nucleic Acids Res. 43, e47. 10.1093/nar/gkv007. [DOI] [PMC free article] [PubMed] [Google Scholar]
- 71.Leek JT, and Storey JD (2007). Capturing heterogeneity in gene expression studies by surrogate variable analysis. PLoS Genet. 3, 1724–1735. 10.1371/journal.pgen.0030161. [DOI] [PMC free article] [PubMed] [Google Scholar]
- 72.Luo W, Friedman MS, Shedden K, Hankenson KD, and Woolf PJ (2009). GAGE: Generally applicable gene set enrichment for pathway analysis. BMC Bioinformatics 10, 1–17. 10.1186/1471-2105-10-161. [DOI] [PMC free article] [PubMed] [Google Scholar]
- 73.Zhao S, Guo Y, Sheng Q, and Shyr Y (2014). Advanced Heat Map and Clustering Analysis Using Heatmap3. Biomed Res. Int. 2014. 10.1155/2014/986048. [DOI] [PMC free article] [PubMed] [Google Scholar]
- 74.Luo W, and Brouwer C (2013). Pathview: An R/Bioconductor package for pathway-based data integration and visualization. Bioinformatics 29, 1830–1831. 10.1093/bioinformatics/btt285. [DOI] [PMC free article] [PubMed] [Google Scholar]
Associated Data
This section collects any data citations, data availability statements, or supplementary materials included in this article.
Supplementary Materials
Table.S1. Internal standard master mix composition. Related to “Brain sample collection and preparation for LCMS analysis“ STAR methods section.
Table S2. Internal standards retention times. Related to “Targeted LC-MS/MS Lipidomic Analyses“ STAR methods section.