

Summary
Long-lived plasma cells (PCs) secrete antibodies that can provide sustained immunity against infection. High affinity cells are proposed to preferentially select into this compartment, potentiating the immune response. We used single cell RNA-seq to track the germinal center (GC) development of Ighg2A10 B cells, specific for the Plasmodium falciparum circumsporozoite protein (PfCSP). Following immunization with Plasmodium sporozoites we identified 3 populations of cells in the GC light zone (LZ). One LZ population expressed a gene signature associated with the initiation of PC differentiation and readily formed PCs in vitro. The estimated affinity of these pre-PC B cells was indistinguishable from that of LZ cells that remained in the GC. This remained true when high- or low-avidity recombinant PfCSP proteins were used as immunogens. These findings suggest that the initiation of PC development occurs via an affinity-independent process.
Keywords: Germinal center, Plasma cells, B cells, single cell RNA seq, Affinity maturation, Plasmodium
eTOC Blurb
High affinity cells are proposed to preferentially develop into long-lived plasma cells. Sutton et al examine the differentiation of Ighg2A10 B cells, specific for the Plasmodium falciparum circumsporozoite protein (PfCSP) and find that cells initiating plasma cell differentiation have similar affinities to those that continue cycling in the germinal center.
Introduction
Following vaccination, antibody responses to many pathogens can be sustained for periods of decades, in some cases conferring life-long protection against disease1,2. Sustained antibody production is maintained by long-lived Plasma Cells (PCs) which reside in multiple organs, but notably the bone marrow (BM) and spleen3,4. BM PCs secrete high affinity antibodies that have undergone a process of somatic hypermutation and selection called affinity maturation5,6. This process takes place in structures called germinal centers (GC) where antigen specific B cells cycle between the dark zone (DZ), the primary site of cell proliferation and the light zone (LZ) where B cells encounter cognate antigen and obtain help from T cell7–9. Cells that fail to bind antigen and obtain T cell help will die, facilitating a Darwinian selection process called affinity maturation. Cells that survive make a choice between continuing to cycle in the GC or exiting as a Memory B cell (MBC) or PC.
It has long been noticed that MBCs are, on average, of lower affinity than PCs10. Low affinity cells in the GC are also preferentially selected into the MBC compartment11,12. To address the role of affinity in extrafollicular plasmablast (PB) formation, Paus et al. combined immunizations with variants of Hen Egg Lysozyme (HEL) with SW-HEL mice, a genetically engineered mouse model with a HEL specific-B cell receptor (BCR) inserted into the immunoglobulin locus13. In this setting, GC B cell responses develop normally upon immunization with a low affinity variant of HEL, but PB responses are attenuated compared to native HEL immunization13. However, it is not clear if this is due to a skew in cell fate determination or if PBs proliferate more after stimulation with a high affinity antigen14. In this same system, PCs carry affinity enhancing mutations at a higher frequency than GC B cells early in the GC response, suggesting that there is a rapid selection of the highest affinity cells into the PC response15. High affinity B cells may also be able to obtain more antigen for presentation on MHC, facilitating access T cell help, which is required for differentiation into antibody secreting cells16–18. However, paradoxically, access to stronger T cell help by high affinity cells also aids their recycling into the DZ19.
Another model, based on BrdU pulse-chase labelling experiments, proposes that longer lived PCs in the BM are preferentially formed in the late GC20. As late GCs contain more affinity matured cells, this temporal switch model does not require the preferential differentiation of high affinity GC cells into PCs. Tamoxifen lineage tracking approaches in mice show that PCs emerge at a constant rate from the GC, challenging the temporal switch model21. However similar lineage tracing experiments show that early GC emigrants are replaced by later emigrants, explaining why most long-lived PCs derive from the late GC22,23. To examine the role of affinity in the initial differentiation of PCs we tracked Ighg2A10 cells specific for the malaria vaccine antigen P. falciparum circumsporozoite protein (PfCSP) by single cell RNA-seq in the GC. This analysis allowed us to identify distinct populations of LZ B cells associated with different cell fates and different affinity signatures.
Results
Stochastic cell fate choice and stereotypic affinity maturation in Ighg2A10 cells
Ighg2A10 mice have the unmutated common ancestor (UCA) of the heavy chain of the 2A10 mAb, specific for the PfCSP repeat domain genetically engineered into the IgM locus24. Because the Ighg2A10 heavy chain is free to pair with any light chain, we reasoned that we might detect populations in this mouse that vary in their ability to bind to PfCSP. In agreement with this we identified populations binding high, intermediate, and low amounts of PfCSP probe relative to their IgM expression (Figure 1A). Single cell BCR sequencing revealed that all PfCSP-binding cells utilized the Igkv10–94 gene, which is also used by the 2A10 mAb25,26. However, in the different PfCSP-binding populations this Igkv gene was paired with Igkj2 (J2; high), Igkj2 (J1; intermediate) or Igkj4 (J4; low) genes resulting in different aromatic amino acids being present at position LC_116 (Figure 1B). ELISA of recombinant antibodies (rAbs) carrying each light chain confirmed that these changes results in expected reductions in affinity compared to the 2A10 UCA (Figure 1C).
Figure 1. Affinity determinants and their influence on early cell fate choice in Ighg2A10 cells.

A. Flow cytometry plots demonstrating 3 distinct populations of Ighg2A10 B cells separated by their binding to PfCSP repeat ((NANP)9-PE and (NANP)9-APC probes B. The LC-CDR3 amino acid sequence and Igkj gene used by each probe binding population compared to the predicated germline 2A10 LC-CDR3. C. ELISA showing the PfCSP binding ability of recombinant antibodies generated using sequences from (C) compared to 2A10 D. Representative flow plots demonstrating the gating strategy used to sort PfCSP-specific Ighg2A10 PB, GC and EM B cells 4 days post PbPf-SPZ immunizations. E. Igkj gene usage in either naïve Ighg2A10 B cells or PB, GC and EM B cells 4 days post immunization with Pb-PfSPZ. F. Proportions of Ighg2A10 PB, GC or EM B cells utilizing either the J1, J2 or J4 Igkj gene G. Experimental schematic of time course analysis of Ighg2A10 GC evolution. H. Representative flow cytometry plot plots demonstrating the gating strategy used to identify PfCSP-specific Ighg2A10 PCs in the BM. I. Frequency of J gene usage and occurrence of LC_L114X and/or LC_Q106X mutations in GC B cells over time. J. The number of PfCSP-specific Ighg2A10 PC per femur pair over time K. Frequency of J gene usage and occurrence of LC_L114X and/or LC_Q106X mutations in BM PCs over time. L. Competition ELISA showing the binding of the indicated to rAbs to plate bound (NANP)9 peptide in the presence of the indicated concentrations of soluble (NANP)9 peptide; Mean ± SEM shown from 3 independent experiments. M. Affinities (KD) of mAbs carrying the indicated variants; all values represent the geometric mean of binding signals collected in duplicate from n = 2 independent experiments. ND, could not be determined.
High affinity B cells are proposed to preferentially become PBs, while GCs form from cells with lower affinity13,14,27. To test this hypothesis Ighg2A10 cells were transferred to mice which were subsequently immunized with irradiated P. berghei sporozoites expressing PfCSP in place of their endogenous P. berghei CSP molecule (Pb-PfSPZ)28. Immunization with irradiated sporozoites is an established method for generating sterilising immunity against malaria in mice and humans29,30. Four days after immunization, PBs, GC B cells, and early memory (EM) B cells were single cell sorted and the light chains sequenced (Figure 1D). Overall, when cells were separated by cell type (χ2=11.3; df=9; p=0.25) or J chain use (χ2=1.89; df=4; p=0.76) there was no clear difference in the propensity to become a particular cell type (Figure 1E–F). Thus, our data are consistent with early cell fate choices being largely stochastic.
To understand how Ighg2A10 cells mature in the GC we extended the earlier analysis to multiple time points after immunization (Figure 1G). As the BM is the site of residence of long-lived PCs, we also tracked Ighg2A10 BM PCs after immunization using the Blimp1-GFP reporter31 to facilitate the identification of BM PCs (Figure 1H). In the 2A10 lineage most affinity maturation occurs in the LC so we focussed on this chain25. At day 7 some cells carried a C328T mutation that codes for a LC_L114F substitution (Figure S1A–B; Figure 1I). This mutation was more common initially in J1 cells which had become rarer than at day 4, perhaps because of greater selective pressure on these cells (Figure 1I). By day 8 the LC_L114F mutation was rapidly selected, such that it was found in ~80% of cells (Figure 1I). By day 21 an LC_Q106X substitution occurring in ~50% of GC B cells had become next most common (Figure 1I). At this position different changes were observed depending in part upon whether the J1 or J2 LC was used (Table S1). In the BM, numbers of Ighg2A10 PCs remained roughly constant (Figure 1J), but early unmutated cells were largely replaced by later emigrants carrying both position LC_L114F and LC_Q106X mutations (Figure 1K).
Competition ELISA of recombinant antibodies (rAbs) carrying these mutations confirmed that these mutations resulted in progressively higher affinity for the (NANP)9 repeat (Figure 1L). To precisely measure the effect of these mutations on BCR affinity we generated antigen-binding fragments (Fabs) containing these mutations and measured binding to PfCSP by surface plasmon resonance (SPR; Figure S1C). The SPR analysis revealed that the L114F mutation on its own resulted in a modest (1.49-fold) increase in affinity over the J2 UCA (Figure 1M). Improvements in affinity due to the L114F substitution could not be determined in the J1 lineage due to the negligible binding signals of the J1 UCA. Interestingly the C328T (LC_L114F) mutation occurs at a WGCW super-hotspot for AID targeting32, potentially explaining the rapid selection of this mutation despite a relatively small affinity advantage. Additional LC_Q106K/Q106R mutations substantially enhanced affinity in both lineages, conferring a 65-fold increase in affinity to the J2/L114F light chain and an 18.2-fold increase in affinity to the J1/L114F light chain respectively (Figure 1M).
Single cell RNA sequencing allows the identification of distinct LZ populations within the GC.
Because we can see stereotypic selection events occurring among GC B cells based on Ighg2A10 cells we exploited this feature to determine if these affinity changes were related to cell fate decisions in the GC. Specifically, we aimed to use single cell RNA-seq to identify PC precursors among Ighg2A10 cells in the GC and combine this transcriptomic data with V(D)J sequencing to determine if any sub-populations in the GC contained generally higher or lower affinity cells (Figure 2A). Accordingly, we sorted and sequenced IgD− Ighg2A10 cells at days 7 (n=4) and 21 (n=5) post immunization with Pb-PfSPZ (Figure S2A–B; Table S2). Days 7 and 21 were chosen as at each of these days ~50% of GC B cells carried the LC_L114F and LC_Q106X mutations respectively (Figure 1K). To facilitate the identification of precursor PC and MBC populations we included CITE-seq33 Abs specific for the PC precursor marker CD69, and CD38 which is upregulated on MBC precursors cells18,34,35. We also included antibodies specific for CD11c and CXCR3 to distinguish atypical B cells from conventional MBCs36,37.
Figure 2: Single cell RNA-seq identifies populations of PreMems and PrePCs within the GC.

A. Experimental Schematic. B. Unsupervised clustering of PfCSP -specific Ighg2A10 B cells pooled from all mice visualized using UMAP. Each cell is represented by a point and coloured by cluster C. Heatmap of key genes differentially expressed between clusters. D. Overall frequencies of each population at different days, bars are mean ± SEM by mouse. E. Frequencies of LZ3 and DZ cells in the GC in each mouse; analysis by by 2-tailed t-test. F. Gating strategy for the sorting of Mem, DZ, LZ1+LZ2 and LZ3 populations. G. Representative FACS plots showing live B cells after culture of the indicated cells in the indicated conditions. H. Number of PCs recovered after αCD40-IL21 or I. αCD40-IL21-Antigen stimulation; circles are technical replicates from 3 independent experiments indicated by different shading; analysis by one-way ANOVA including experiment as a blocking factor in the model
Dimensionality reduction analysis showed 4 major populations of cells (Figure 2B) which we identified as dying cells, GC B cells, PCs and MBCs using a combination of gene set enrichment and the expression of hallmark genes (Figure 2C; Figure S2C). The dying cells had higher levels of mtRNA (Figure S2C) and might include cells harmed by experimental manipulation as well as those counter-selected in the GC and so were excluded from downstream analysis. Among MBCs, we could detect a population of cells with high surface CD11c expression that were identified as atBCs (Figure S2D). Among GC B cells we identified two clusters of DZ cells based on their cell cycle stage and the expression of Aicda, Mki67 and Ccnb1 (Figure 2C; Figure S2E) which conform to a previous classification of DZ cells as proliferating (DZp) or differentiating (DZd)38. Three populations (LZ1, LZ2, LZ3) were observed with high expression of LZ genes including Cxcr5, Cd86 and Cd83 (Figure 2C and Figure S2B). LZ1was located most proximally to DZ cells and appeared to represent conventional LZ cells. In contrast LZ2 cells were located proximal to the MBC population in our UMAP projection (Figure 2B) and had a similar gene expression profile to MBCs (Figure S2C). CITE-seq analysis also revealed that these had slightly higher surface expression of CD38 suggesting these cells could be differentiating into MBCs (Figure S2D). LZ3, was significantly enriched for genes including Cd86, Myc, Cd40 and Icam1 which have been previously identified by others18 as “Fraction 1” LZ cells which are primed for differentiation into PCs and do not contribute to GC recycling (Figure 2C; Figure S2C). Fraction 1 cells are reported to have high surface expression of CD6918, which was also true of our LZ3 cells (Figure S2D). Pseudotime analysis showed that when LZ1 B cells were set as the root, 3 distinct trajectories could be seen, one leading to DZ recycling and the other two passing through either LZ2 to MBC or LZ3 to PC (Figure S2F). Analysis of the proportions of different cell populations showed that there is a shift from DZ to LZ populations by d21 including an expansion of LZ3 cells (Figure 2D–E).
To test whether LZ3 cells were able to differentiate into PCs we sorted Ighg2A10 LZ3 cells based on upregulation of CD69 and ICAM1 (Figure 2F) and stimulated the cells in vitro using conditions previously shown to promote PC differentiation from bulk GC B cells39. Under these conditions LZ3 cells, had significantly greater capacity to form PCs than other LZ cells, DZ cells or MBCs (Figure 2G–I). Collectively these data support the hypothesis that LZ3 cells have initiated differentiation into a PC population.
Affinity signatures of GC B cell populations
We next asked if the different GC populations differed in the frequency of affinity increasing mutations. On day 7 atMBC, MBC and PC cells were mostly unmutated, however ~50% of cells in the GC carried the LC_L114F mutation, though this was more common in the DZd, DZp, and LZ1 populations compared to the LZ2 and LZ3 populations (Figure 3A). Logistic regression analyses revealed that LZ2 cells were significantly less likely to contain the LC_L114F mutation compared with other cell types (OR = 0.096, 95% CI [0.046,0.21]). MBCs have previously been shown to differentiate from low affinity cells11,12 supporting the hypothesis that LZ2 could represent a population of GC B cells primed to differentiate into MBCs. Conversely DZp cells were enriched in the LC_L114F mutation relative to other cells (OR=2.7, 95% CI [1.66,2.86] and Igkj2 gene (OR = 1.92, 95% CI = [1.66,2.86]) consistent with rapid selection of this mutant at this time (Figure 3B). One possibility is that if LZ2 cells are MBC precursors they might have begun to differentiate before LC_L114F selection had occurred. However, overall levels of mutation are similar in this population compared to other GC populations, suggesting these cells are only just exiting GC cycling (Figure 3C).
Figure 3: Mutational dynamics the germinal center.

Mice were immunized and analyzed as in Figure 2A. A. Frequency of J gene usage and occurrence of LC_L114F and LC_Q106X mutations 7 days post immunization in non-GC and GC populations; data are expressed as mean ± SD of the 5 mice. B. Likelihood of the LC_L114F mutation being present in different GC populations 7 days post immunization; data are expressed as Log Odds ±95% CI from logistic regression analysis controlling for mouse as random effect. C. Mean AA substitutions in each mouse 7 days post immunization in non-GC and GC populations; data are expressed as mean ± SD. D. Frequency of J gene usage and occurrence of L114X and/or Q106X mutations 21 days post immunization in non-GC and GC populations; data are expressed as mean ± SD of the 5 mice. E. Likelihood of the LC_Q106X mutation being present in different GC populations 21 days post immunization; data are expressed as Log Odds ±95% CI from logistic regression analysis controlling for mouse as random effect. F. Mean AA substitutions in each mouse 21 days post immunization in non-GC and GC populations; data are expressed as mean ± SD. G. Frequency (mean ± SEM) of mutation at each HC and LC AA position in each mouse ranked from highest to lowest, inset shows the frequency of the top 10 mutations at day 21. H. Proportion of mutations accounted for by mutations at each position, ranked from most to least common. I. Likelihood of each of the top 10 most common mutations being found in cells in different GC populations; data are expressed as Log Odds ±95% CI from main effect logistic regression analysis controlling for mouse as random effect.
By day 21 the LC_L114F mutation had nearly reached fixation in GC populations, and the small number of spleen PC cells; however, some MBC and most atBC were unmutated, suggesting these cells are either GC-independent or formed very early in the response (Figure 3D). Because the LC_L114F mutation was ubiquitous in the GC and no longer useful for distinguishing affinity, we examined the prevalence of mutations at LC_Q106. These were present in roughly 50% of DZd, DZp and LZ1 cells, but only around 30% of LZ2 and LZ3 cells (Figure 3D). Logistic regression analysis revealed that the LC_Q106X mutations were under-represented in LZ2 cells (OR = 0.28, 95% CI [0.17–0.47]), and over-represented in DZp cells (OR = 1.50, 95% CI [1.12,2.02]) (Figure 3E). There was no evidence that cells with LC_Q106X mutations or carrying the J2 allele were preferentially selected into the LZ3 compartment (OR = 0.61, 95% CI [0.30,1.27]). Finally, as at day 7, overall mutation frequencies were similar among all GC populations in all mice indicating recent differentiation into the LZ2 or LZ3 compartments (Figure 3F).
We were concerned that our results were biased by focussing on a small number of pre-selected mutations. We therefore examined the frequency of other mutations in the Ighg2A10 lineage and their associations with cell type. After LC_114 and LC_106, mutations at amino acids HC_39, HC_59 and HC_68 were the next most common across all mice (Figure 3G; Figure S3A–B). Collectively mutations at the top 10 positions accounted for around 40% of the mutation burden Ighg2A10 cells (Figure 3H). Phylogenetic analysis of cell lineages at day 21 revealed that these mutations typically arose close to the root of the trees and were responsible for strong selection events among the GC B cells (Data S1). These mutations generally arose independently of each other, though mutations at positions HC_39, HC_40 and the light chain CDR3 were slightly favoured when a LC_Q106X mutation was present (Figure S3C).
To address whether any specific mutations were associated with cell type we performed a main-effects logistic regression analysis which showed that mutations at 3 of the 5 most mutated positions (LC_106; HC_59; HC_40) were significantly under-represented in LZ2 cells (Figure 3I). Notably the HC_N59I mutation, has been shown to contribute to the affinity of the 2A10 mAb25. Again, no clear signature could be determined among LZ3 cells though mutations at HC_59 were significantly rarer in this population. Overall, these data support the hypothesis that LZ2 cells are MBC precursors generally derived from lower affinity cells in the GC but that LZ3 cells are PC precursors that differentiate in an affinity independent manner.
LZ3 cells form in an affinity-independent process after protein immunization.
The finding that LZ3 cells are primed for PC differentiation and yet do not exhibit higher affinity than other LZ cells was unexpected. However, PfCSP is densely arrayed on the Pb-PfSPZ surface and carries 42 NANP/NVDP repeats28. This structural arrangement could result in avidity effects that effectively elevate the affinity of all transferred cells in absolute terms. Moreover, previous work has suggested that high affinity antigen-BCR affinity interactions may lead to restricted antigen availability for processing and presentation on MHC Class II40,41. We therefore replicated our single-cell analysis of GC B cells, this time following immunization with the previously characterized CSP27 and CSP9 immunogens42. CSP27 incorporates six 2A10 epitopes while CSP9, carries two42. We were further concerned that Ighg2A10 cells might have a competitive advantage in wild type mice again preventing us from detecting a high affinity signature for LZ3 cells, and so we also included groups in which cells were transferred to MD4 transgenic mice43 carrying a BCR specific for the irrelevant antigen HEL (Figure 4A; Figure S4A–B; Table S3).
Figure 4: Affinity relationships in the GC after protein immunization.
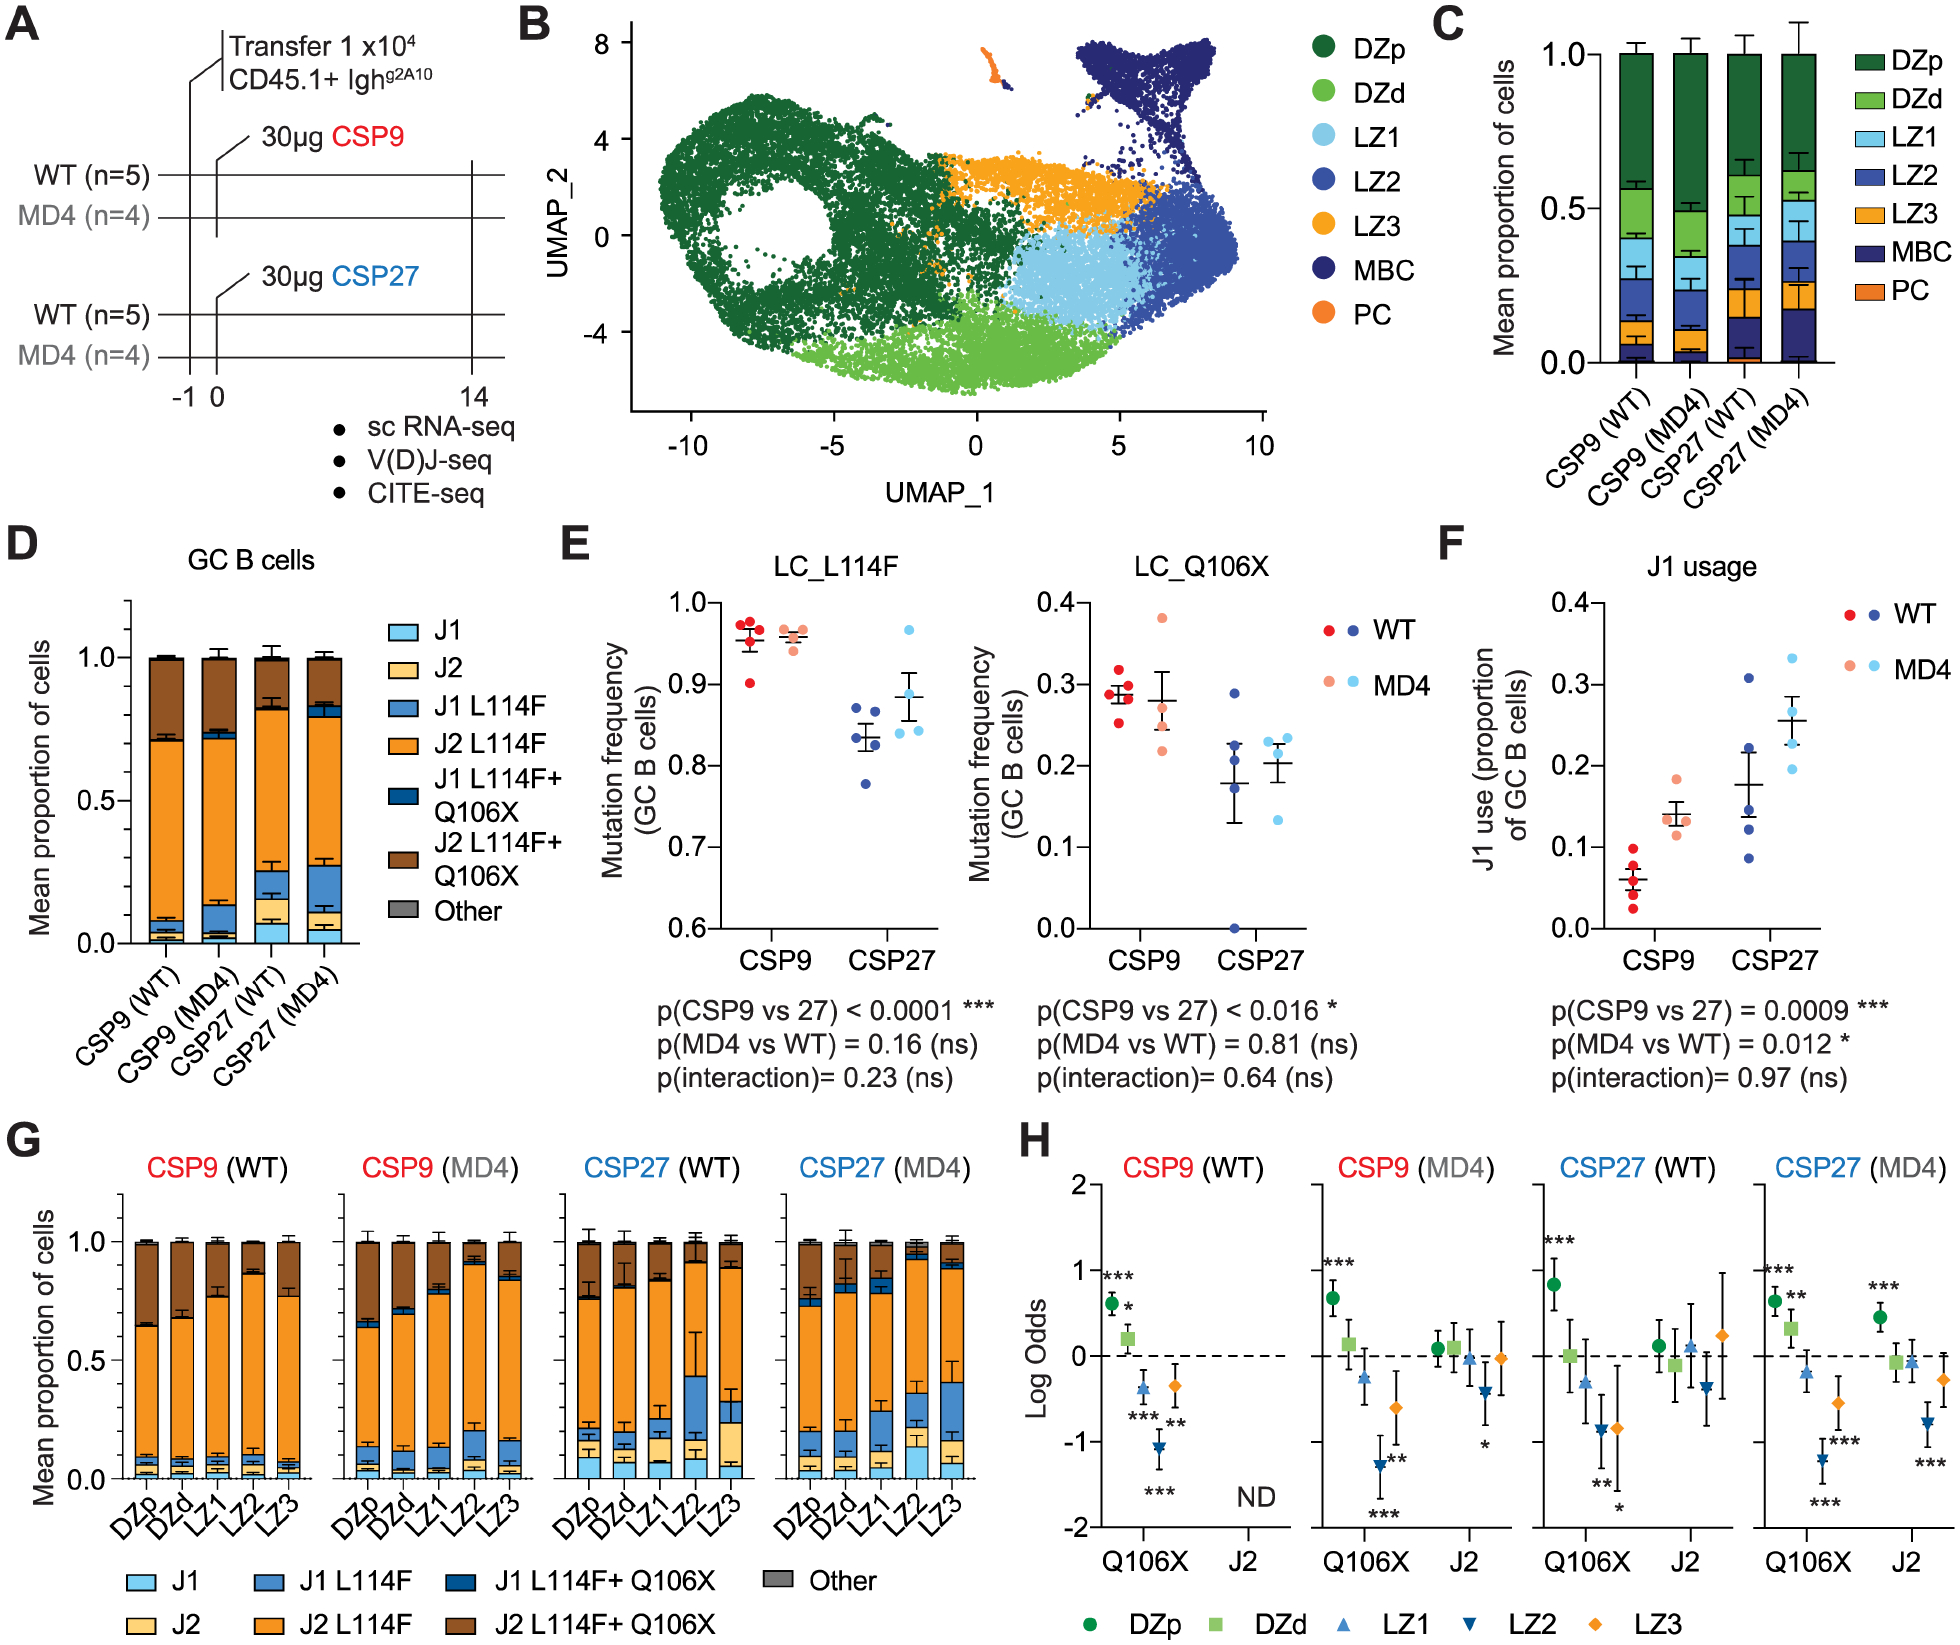
A. Experimental Schematic. B. Unsupervised clustering of Ighg2A10 B cells pooled from all mice visualized using UMAP. Each cell is represented by a point and coloured by cluster. C. Overall frequencies of each population under different immunization conditions, bars are mean ± SEM by mouse. D. Frequency of J gene usage and occurrence of LC_L114F and LC_Q106X mutations among GC B cells data are expressed as mean ± SD of the individual mice. E. Frequency of the LC_L144F and LC_Q106X mutations in different immunization conditions; mean ± SEM shown, analysis by two-way ANOVA. F. Frequency of J1 usage in different immunization conditions; mean ± SEM shown, analysis by two-way ANOVA. G. Frequency of J gene usage and occurrence of LC_L114F and LC_Q106X mutations 7 days post immunization in non-GC and GC populations; data are expressed as mean ± SD of the 5 mice. H. Likelihood of the LC_L114F mutation being present in different GC populations 7 days post immunization; data are expressed as Log Odds ±95% CI from logistic regression analysis controlling for mouse as random effect.
Through unsupervised clustering, we discovered that the same GC populations identified in the context of Pb-PfSPZ immunization were seen following immunization with CSP27 or CSP9 (Figure 4B–C; Figure S4C–D). atBCs were not distinguished in these conditions indicating these cells may not be efficiently generated after protein immunization. CITE-seq analysis confirmed the highest expression of ICAM1 and CD69 was on LZ3 cells (Figure S4E).
Both antigen avidity and host cell genotypes had significant effects on the prevalence of affinity increasing mutations in PCs, MBCs and GCs (Figure 4D; Figure S4F). Ighg2A10 cells in wild-type mice immunized with low avidity CSP9 had higher frequencies of LC_L114F and LC_Q106X mutations compared to CSP27 immunized mice (Figure 4F). A scarcity of low-affinity J1 cells was also apparent within the GCs of CSP9-immunized mice, reflecting heightened competition for antigen (Figure 4F). These effects were also seen during immunization of MD4 mice, however in the absence of endogenous competition mice more J1 cells were able to persist in the GC (Figure 4F). A broader analysis of the most common mutations revealed that these were usually present at higher frequency after low avidity (CSP9) immunization and in a competitive (wild type) environment (Figure S4G).
Finally, we examined the frequency of affinity increasing mutations in different GC populations (Figure 4G). Similar to results from Pb-PfSPZ immunization, logistic regression analyses revealed that the LC_Q106X mutation was underrepresented in LZ2 cells compared to other populations irrespective of antigen avidity or the presence of endogenous competition (Figure 4H). This more highly powered analysis also revealed that the LC_Q106X mutation was underrepresented in LZ3 cells in all immunization conditions when compared to the GC as a whole or DZ cells in particular. Overall mutational frequencies in LZ3 cells were similar to LZ1 cells suggesting that affinity is not a major determinant of differentiation into this compartment (Figure 4H).
Discussion
Understanding the initial mechanisms of PC differentiation will have important implications for optimizing the induction of long-lived antibody responses and inform vaccine design. Prior studies have suggested that binding affinity can control this process. Here, using single cell RNA-seq data we show that the initiation of PC differentiation in the GC occurs in an affinity independent manner. This is consistent across two models using pathogen and protein immunization and was unlinked to the avidity of the immunogen used.
Our findings showing an affinity independent effect on PC differentiation using PfCSP-specific cells differ from previous work using the SW-HEL system which shows that 10 days after immunization PCs, but not GC B cells, were enriched for affinity enhancing mutations15. In this study, the number of mice used and number of cells sequenced may account for some of the differences in the respective findings. In our data, across multiple timepoints and immunization schedules, PCs are delayed in the accumulation of affinity enhancing mutations compared to the GC B cells, while LZ3 cells that are enriched for PC precursors have similar or slightly lower affinity than B cells that continue cycling in the GC. Nonetheless, it is possible that SW-HEL B cell responses which form short-lived GC responses may not be representative of more polyclonal GC reactions, such as those seen in our Ighg2A10 mice or the endogenous response.
Other data that support an affinity-based model for PC development include the finding that PCs generally have higher affinity than memory B cells at the resolution of the primary immune response10. However, the relationship of these PCs to other cells present in the GC at the time of their formation was not explored. Two recent studies have used GC fate mapping approaches and sequenced endogenous, GC-derived PCs alongside contemporaneous GC B cells44,45. Sprumont et al., using probes to identify HA-specific cells after Influenza infection or immunization, find that the recently emerged PC population includes both high and low affinity cells, reflecting the broad range of affinities of GC B cells45. ElTanbouly et al. also used a fate mapping approach, but without antigen probes, to identify endogenous GC B cells responding to NP-OVA immunization44. This approach captures multiple GC B cells expressing BCRs that have undetectable or very low affinity for monovalent antigen which do not contribute to the PC compartment44. However, the fate of these very low affinity cells is unclear: we also observed significant numbers of lower affinity cells in the GC, but these were over-represented in the LZ2 compartment and may develop into low affinity memory cells11. Moreover, in the ElTanbouly et al. study, PC and GC B cells that have detectable binding to NP-OVA express BCRs of similar affinity44. Nonetheless it is possible that there is an absolute affinity floor for PC differentiation, albeit at the lower limit of detectable antigen binding.
In the absence of affinity-based selection into the PC compartment, a high affinity pool of PCs could be generated if the formation of BM PCs is favoured later in the GC20. In our data a temporal switch mode is also supported by the increased proportion of LZ3 cells at day 21 compared to day 7, and by the finding that early low affinity PCs in the BM are replaced by later GC emigrants. A limited role for BCR affinity in later selection events in the GC is also compatible with studies showing alterations to the signalling capacity of B cells in the GC46–48. Affinity based selection in the PC compartment has been considered an optimal strategy for generating protective immune responses, however an excessive diversion of high affinity cells away from DZ recycling in the GC reaction may also be detrimental to the overall process of affinity maturation, thus the stochastic formation of PCs in the waning GC may represent an efficient strategy for generating protective immune responses.
Limitations of the study
A key limitation of our study is that LZ3 cells may be a heterogenous population, only some of which may complete PC differentiation. It is also clear that there is an excess of LZ3 cells relative to the number of PCs in our system, suggesting there may be a major bottleneck in PC formation. It is possible that some of these Myc+ cells may continue recycling in the GC. However, LZ3 cells decrease expression of Bcl6 and GC specific ablation of Irf4 results in a loss of both the LZ3/Fraction 1 population and PCs, without affecting GC recycling18. Additionally, DZ cells consistently exhibited higher affinity than LZ3 cells. The absence of high-affinity cells within the LZ3 pool could stem from the rapid completion of PC differentiation by the highest affinity cells or the occurrence of subsequent selection events, possibly during T cell licensing16,18. However, these hypotheses would be inconsistent with the data from the lineage tracing studies that do not detect evidence of affinity-based selection in the transition from GC B cell to PC44,45. A second limitation is that we have used probes to detect PfCSP-specific B cells, which may miss the lowest affinity cells unlike fate mapping approaches. Nonetheless our multimeric probes can detect B cells (e.g. J1 B cells) that have affinities that are undetectable by SPR techniques. Finally, we cannot exclude the possibility that high affinity cells may have a survival advantage in the BM niche, perhaps based on signals they have received in GC. However, survival in the bone marrow is likely independent of isotype and GC origin22,49
STAR Methods
Lead contact
Further information and requests for resources and reagents should be directed to and will be fulfilled by the Lead Contact, Ian Cockburn (ian.cockburn@anu.edu.au).
Materials availability
This study did not generate new unique reagents
Data and code availability
Single cell RNA-seq data have been deposited at NCBI Gene Expression Omnibus and is publicly available. Accession number is listed in the key resources table.
This paper does not report original code.
Any additional information required to reanalyze the data reported in this paper is available from the lead contact upon request.
Key resources table
| REAGENT or RESOURCE | SOURCE | IDENTIFIER |
|---|---|---|
| Antibodies | ||
| TotalSeq™-C0301 anti-mouse Hashtag 1 Antibody | Biolegend | Cat#155861 |
| TotalSeq™-C0301 anti-mouse Hashtag 2 Antibody | Biolegend | Cat#155863 |
| TotalSeq™-C0301 anti-mouse Hashtag 3 Antibody | Biolegend | Cat#155865 |
| TotalSeq™-C0301 anti-mouse Hashtag 4 Antibody | Biolegend | Cat#155867 |
| TotalSeq™-C0301 anti-mouse Hashtag 5 Antibody | Biolegend | Cat#155869 |
| TotalSeq™-C0557 anti-mouse CD38 Antibody | Biolegend | Cat#102735 |
| TotalSeq™-C0197 anti-mouse CD69 Antibody | Biolegend | Cat#104551 |
| TotalSeq™-C0228 anti-mouse CD183 (CXCR3) Antibody | Biolegend | Cat#126545 |
| TotalSeq™-C0106 anti-mouse CD11c Antibody | Biolegend | Cat#117361 |
| Brilliant Violet 510™ anti-mouse CD45.1 Antibody | Biolegend | Cat#110741 |
| Brilliant Violet 605™ anti-mouse IgD Antibody | Biolegend | Cat#405727 |
| Brilliant Violet 605™ anti-mouse/human CD45R/B220 Antibody | Biolegend | Cat#103243 |
| Pacific Blue™ anti-mouse/human GL7 Antigen (T and B cell Activation Marker) Antibody | Biolegend | Cat#144614 |
| PE/Cyanine7 anti-mouse CD138 (Syndecan-1) Antibody | Biolegend | Cat#142514 |
| BUV395 Rat Anti-Mouse CD19 | BD | Cat#563557 |
| IgM Monoclonal Antibody (II/41), APC-eFluor™ 780, eBioscience™ | ThermoFisher | Cat#47-5790-82 |
| CD38 Monoclonal Antibody (90), Alexa Fluor™ 700, eBioscience™ | ThermoFisher | Cat#56-0381-82 |
| PerCP/Cyanine5.5 anti-mouse/human CD11b Antibody | Biolegend | Cat#101228 |
| PerCP/Cyanine5.5 anti-mouse Ly-6G/Ly-6C (Gr-1) Antibody | Biolegend | Cat#108428 |
| PerCP/Cyanine5.5 anti-mouse CD3 Antibody | Biolegend | Cat#100218 |
| FITC anti-mouse IgD Antibody | Biolegend | Cat#405704 |
| Chemicals, peptides, and recombinant proteins | ||
| Agencourt AMPure XP beads | Beckman Coulter | Cat#A63880 |
| Betaine 5M | Sigma-Aldrich | Cat#B300-1VL |
| CloneAmp HiFi PCR Premix | Takara | Cat#639298 |
| ERCC Spike-In Mix | ThermoFisher | Cat#4456740 |
| RNAse inhibitor | Clontech | Cat#2313A |
| SuperScript II RT | Life Technologies | Cat#18064-071 |
| Triton X-100 | Sigma-Aldrich | Cat#T9284 |
| dNTP | ThermoFisher | Cat#R0182 |
| Taq DNA polymerase recombinant | ThermoFisher | Cat#EP0404 |
| Critical commercial assays | ||
| Chromium Next GEM chip G Single cell Ki | 10X Genomics | Cat#1000127 |
| Chromium Next GEM Single Library and Gel Bead Kit | 10X Genomics | Cat#1000128 |
| Chromium Single cell 5′ Feature Barcode Kit | 10X Genomics | Cat#1000256 |
| Chromium Single cell Library Construction Kit | 10X Genomics | Cat#1000190 |
| Chromium Single Cell Mouse BCR Amplification Kit | 10X Genomics | Cat#1000255 |
| Single Index Kit N Set A | 10X Genomics | Cat#1000212 |
| Single Index Kit T Set A | 10X Genomics | Cat#1000213 |
| Deposited data | ||
| Singel cell RNA-seq datasets | This study | GSE248377 |
| Experimental models: Organisms/strains | ||
| Mouse: Ighg2A10 | McNamara et al [24] | N/A |
| Mouse: MD4 (C57BL/6-Tg(IghelMD4)4Ccg/J) | Goodnow et al [43] | N/A |
| Oligonucleotides | ||
| mVkappaF: 5′-TCGTCGGCAGCGTCAGATGTGTATAAGAGACAGGAYATTGTGMTSACMCARWCTMCA-3′ | ThermoFisher | N/A |
| mCkappaR: 5′-GTCTCGTGGGCTCGGAGATGTGTATAAGAGACAGACTGAGGCACCTCCAGATGTT-3′ | ThermoFisher | N/A |
| Oligo-dT: 5′-AAGCAGTGGTATCAACGCAGAGTACT30VN-3′ | ThermoFisher | N/A |
| TS primer : 5′-AAGCAGTGGTATCAACGCAGAGTACATrGrG+G-3′ | Qiagen | N/A |
| ISPCR: 5′-AAGCAGTGGTATCAACGCAGAGT-3′ | ThermoFisher | N/A |
| Software and algorithms | ||
| CellRanger | 10X Genomics | https://support.10xgenomics.com/single-cell-gene-expression/software/pipelines/latest/using/tutorial_in |
| Seurat (V3) | Butler et al [50] | https://satijalab.org/seurat/ |
| R | R Core Team | https://www.r-project.org/ |
| Monocle3 | Trapnell et al [52] | https://cole-trapnell-lab.github.io/monocle3/ |
| Immcantation | Gupta et al [53] | https://immcantation.readthedocs.io/en/stable/index.html |
| FlowJo | FlowJo | https://www.flowjo.com/ |
| Prism | Graphpad | https://www.graphpad.com/ |
Experimental Model Details
Mice
C57BL/6NCrl were purchased from the Australian Phenomics Facility (Canberra, ACT, Australia). MD4 (C57BL/6-Tg(IghelMD4)4Ccg/J; MGI: 2384162)43 and Blimp1GFP/+ (C57BL/6(Prdm1tm1Nutt; MGI: 3510704) mice were a kind gift from Carola Vinuesa (The Australian National University)31. Ighg2A10 were generated and described by us previously24. Mice were bred and maintained under specific pathogen free conditions in individually ventilated cages at the Australian National University. All animal procedures were approved by the Animal Experimentation Ethics Committee of the Australian National University (Protocol numbers: A2016/17 and A2019/36). All mice were 5–8 weeks old at the commencement of experiments. Within each experiment, mice were both age matched. Female mice were used throughout the experiments.
Parasites
P. berghei parasites expressing falciparum CSP were crossed to either mCherry or GFP background28 in order to easily identify infected Anopheles stephensi mosquitoes, and were maintained by serial passage through the mosquitoes. Sporozoites were collected by harvesting the salivary glands of infected Anopheles stephensi mosquitoes and were counted and irradiated (200k Rad) using a MultiRad 225 (Flaxitron) irradiator prior to injection.
Method Details
Flow Cytometry and sorting
Spleen and bone marrow of mice were collected and were prepared into single cell suspension for flow cytometric analysis and sorting. Splenocytes were isolated by mechanically disrupting the spleens through a 70μm nylon mesh filter while bone marrow cells were flushed from femurs and tibias with FACs buffer in 27g syringes. Cells were incubated with 1μg/mL Streptavidin and 10 μg/mL TruStain fcX antibody diluted in FACS buffer for 30min on ice. Cells were then incubated in a staining cocktail containing fluorescent antibodies and tetramer probes (as well as oligo-bound TotalSeq-C antibodies (Biolegend) for 10x sorting experiments) for 30 mins in the dark at 4°C. ACK lysis buffer (Sigma) was used to lyse red blood cells from the single cell suspensions and then cells were washed twice with FACS buffer. 1% 7AAD was then added as a Live/Dead dye immediately prior sorting or analysis. Flow-cytometric data was collected on a BD Fortessa or X20 flow cytometer (Becton Dickinson) and analyzed using FlowJo software (FlowJo). A BD FACs Aria I or II (Becton Dickinson) machine was used for FACS sorting of cells. (NANP)9 tetramer probes were prepared in house by mixing PE or APC conjugated streptavidin (Invitrogen) with biotinylated (NANP)9 peptide in a 1:4 molar ratio.
Adoptive cell transfer and immunization
The number of probe+ CD19+ Ighg2A10 B cells to transfer were quantified from donor spleens via flow cytometry. 2×10⁴ probe+ CD19+ Ighg2A10 B cells were then transferred into each recipient mouse via intravenously (IV) injection. Mice were immunized 1–2 days after adoptive transfer of donor cells. For immunization with irradiated sporozoites, C57BL/6 or MD4 mice were IV injected with 3–5×10⁴ irradiated sporozoites resuspended in PBS. For immunization with recombinant protein, 30μg recombinant PfCSP carrying 27 repeats (CSP27) or 9 repeats (CSP9) were emulsified in alum and intraperitoneally injected as described previously42.
Single Cell Light Chain Sequencing
RNA was extracted and cDNA synthesized from sorted, single Ighg2A10 B cells using a modified SMARTseq 2 protocol (Picelli et al., 2014). Cells were sorted into plates with wells containing 1ul of the cell lysis buffer, 0.5 ml dNTP mix (10 mM) and 0.5 ml of the oligo-dT primer at 5mM. The amount reagent used in the following reverse-transcription and PCR amplification step was reduced by half the original protocol while the concentration of the IS PCR primer was also further reduced to 50nM. The BCR light chain was then amplified from the cDNA using a 10–94 specific forward primer with kappa specific reverse primer with the following thermocycler settings: 1 cycle at 95°C for 5 minutes followed by 50 cycles at 95°C for 1 minute, 43°C for 1 minute and 72°C for 1.5 minutes then finally 1 cycle at 72°C for 5 minutes before holding at 4° to cool. Amplified light chain sequences were then sequenced via sanger sequencing. Sequences were analyzed using IMGT Vquest
scRNA-seq
Probe+ IgD− Ighg2A10 B cells stained with TotalSeq-C feature and hashtag antibodies were sorted into FACS buffer then spun down. Cells were resuspended and loaded into a Chromium (10x Genomics). Indexed V(D)J, Feature Barcode and GEX libraries of sorted samples were prepared according to the protocol for Single Indexed 10X Genomics V(D)J 5’ kit for mice with Feature barcoding kit (10X Genomics). Libraries were then sequenced using on an Illumina NovaSeq6000
Generation of g2A10 antibody variants
Constructs containing minigenes for the germline heavy (isotype: IgG2A) and light chains of the 2A10 antibody in a pcDNA3.1+ backbone were ordered commercially (Biomatik). To generate intermediate and low affinity 2A10 light chain variants, as well as those containing the F114L and Q106X AA changes mutations were introduced using the QuikChange II site directed mutagenesis kit according to the manufacturers instructions (Agilent). Antibodies were generated by transfecting HEK293T cells grown in DMEM supplemented with Nutridoma-SP (Roche) with 15 μg of each of the heavy and light chain plasmids in 0.06mg/ml branched PEI in 120mM NaCl. 3 and 6 days following transfections supernatants were collected, concentrated over a 100kDa Ultra-15 centrifugal filter unit, Ultracell-100 membrane (Amicon). Antibody concentrations were determined by sandwich ELISA on coats plated with anti-mouse kappa (Southern Biotech) as capture antibodies and horseradish peroxidase conjugated anti-mouse IgG2A (KPL) as detection antibodies.
ELISA
Binding of 2A10 antibody variants was determined by ELISA. Nunc Maxisorp Plates (Nunc-Nucleon) were coated overnight with 1ug/ml streptavidin followed by binding of biotinylated (NANP)9 peptide for 1 hour. After blocking with 1% BSA, serial dilutions of the antibodies were incubated on the plates for 1 hour and after washing, incubated with HRP conjugated anti-IgG2A antibodies (KPL).
Analysis of PfCSP binding kinetics
Ighg2A10 germline and mutant Fabs were recombinantly expressed (Genscript) and their binding to recombinant PfCSP (Genscript) was assessed using surface plasmon resonance (SPR). An HC30M chip (Carterra, 4279) was conditioned using successive injections of 50 mM NaOH, 0.5 M NaCl and 10 mM Glycine pH 2.0, and then primed twice with 25 mM MES with 0.05% Tween-20 before activation of the chip’s surface with a 1:1 mixture of 400 nM EDC (Pierce, PG82079) and 100 mM NHS (Pierce, 24510). A 0.625 μg/mL concentration of each Fab was prepared using sodium acetate pH 4.5 with 0.05% Tween, and each Fab was coupled to the chip’s surface in duplicate immediately following chip activation. Excess binding sites were blocked with 1M ethanolamine pH 8.5. A three-fold dilution series of PfCSP (0.23 – 500 nM) was injected onto the chip in ascending concentration without regeneration between successive injections. HEPES-buffered saline with Tween-20 and EDTA (HBSTE) with 0.05% BSA was used as running buffer throughout the assay. Binding data was collected over a 10 minute association phase and 30 minute dissociation phase for each antibody-antigen interaction. Data were analyzed using Kinetics Software (Carterra) and curves which deviated from the software-predicted model of 1:1 antigen-antibody binding interaction were excluded from the analysis of binding kinetics. Dissociation rates (kd), association rates (ka) as well as dissociation constants (KD) were calculated using the Kinetics Software.
In vitro stimulation of GC B cells
2×10⁴ Ighg2A10 B cells were IV transferred into WT recipients followed by Pb-PfSPZ immunization. Splenocytes were then collected on day14 post immunization. Ighg2A10 B cells were positively enriched. 2000 cells per well of sorted Ighg2A10 MBC, DZ, LZ1+LZ2 and LZ3 were left untreated or treated with 5 μg/ml anti-CD40, 20ng/ml IL21 w/wo100ng/ml CSP27 in complete RPMI for 48h. Flow cytometry was performed to analyze the formation of PC.
Quantification and Statistical Analysis
Statistical analyses
Details of specific statistical tests and experimental design are given in the relevant figure legends. Mouse experiments had 3–5 mice per group and were performed either in duplicate or triplicate. All data points are plotted from all replicate experiments. ANOVA analyses were performed in R version 4.2.2 (The R Foundation for Statistical Computing) on the pooled data from all replicate experiments using the lmer function. Where data was pooled from multiple experiments, each experiment was included as a blocking factor in the analysis. Where data are plotted on a log-scale data were log-transformed prior to analysis. Logistic regression analyses were performed using the glm function and included specific mutations as fixed factors and mouse as the random factor. Abbreviations for p values are as follows: p < 0.05 = *, p < 0.01 = **, p < 0.001 = ***, p < 0.0001 = ****; with only significant p values shown. No blinding or randomization was performed, however all readouts (ELISA, flow cytometry and sequencing) are objective readouts that are not subject to experimental bias.
Single Cell RNA transcriptomic analysis
Cell Ranger (10X Genomics) was used to process the V(D)J, Feature Barcode and GEX sequences and prepare them for downstream analysis. Seurat (version 3.1)50 was used for graph-based clustering and visualizations of the gene expression data and demultiplexing. All functions described are from Seurat or base R (version 3.60) using the default parameters unless otherwise stated. Individual GEX samples were initially analysed separately using the following procedures. Cells that expressed fewer than 200 genes and genes that were expressed in fewer than 3 cells were excluded, along with cells that had greater than 5% mitochondrial genes. Gene expression was normalized for the mRNA assay using the NormalizeData function. Centered Log-Ratio normalization was used for the CITE-seq assay. The 2000 most variable genes for each sample were identified using FindVariableFeatures. Expression of all genes was scaled using ScaleData to linearly regress out sources of variation and Principal Components Analysis (PCA) on the variable genes identified above was then run with RunPCA. Louvain clustering was conducted via the FindNeighbours and FindCluster functions to identify clusters of Non-B cells, which were excluded from further analyses. The remaining cells in each sample were then normalized and scaled again as above. Demultiplexing of hash-tagged samples was done using either HTODemux for the sporozoite immunisation experiments or MULTIDemux for the immunisation experiments.
Samples were then combined using FindIntegrationAnchors and then Intergratedata to create combined datasets. The combined dataset was then scaled again as above and a PCA was run. FindNeighbours and FindClusters was used again to identify clusters. DEGs were identified using FindAllMarkers. The clustering was visualized with Uniform Manifold Approximation and Projection (UMAP) dimensionality reduction using RunUMAP and plotted using DimPlot with umap as the reduction. Log-normalized gene expression data was visualized using violin plots (VlnPlots) as well as onto -UMAP plots (FeaturePlot). Heatmaps were generated using DoHeatmap. Genesets for LZ, DZ51, MBC34 and PrePCs18 were added to the seurat object via the addModule and visualised via UMAP. Pseudotime analysis was performed using Monocle 352.
10x VDJ sequence analysis
AssignGenes.py and MakeDb.py from Change-O, part of the Immcantation portal53 were used to convert the 10X V(D)J output from CellRanger into an AIRR community standardized format to allow for further downstream analysis. Inferred germline V and J sequences were added with CreateGermline.py.
Heatmaps for differentially expressed genes
For each gene of interest, normalized expression levels were averaged based on specified groupings (e.g., cell phenotypes, experimental groups, and mouse). Expression values were then scaled using Z-score normalization to represent the number of standard deviations from the mean to ensure a consistent scale across genes and enhanced visualization of differences in expression.
Lineage tree analysis
To reconstruct a lineage tree for each mouse over all cell types, a maximum likelihood estimation was used based on the HLP19 substitution model for B-cell somatic hypermutation (SHM)54. HLP19 is based on GY9455 which is a codon-based model for the evolution of protein-coding DNA sequences which provides better fit and synonymous/nonsynonymous substitution rate estimates than nucleotide-based models. HLP19 in addition models known hotspot (WRC, GYW, WA, TW) and cold spot (SYC, GRS) motifs arising in B-cell SHM that violate assumptions in standard phylogenetic substitution models like GY94. Separate trees were estimated for HC and LC (J2). The mean tree depth, in units of mutations/site, was estimated from separate subtrees for each cell type.
The computational pipeline processes as input the AIRR-formatted dataset of sequences for each mouse using the Change-O53 and IgPhyML54,56 tools using the following commandlines: (1) Clonal clustering with “DefineClones.py -d input.tsv --act set --model ham --norm len --dist 0.9”. (2) Germlines reconstructed with “CreateGermlines.py -d input_clone-pass.tsv --cloned -g dmask -r imgt_mouse_IGLV.fasta imgt_mouse_IGLJ.fasta imgt_mouse_IGHJ.fasta imgt_mouse_IGHV.fasta imgt_mouse_IGKV.fasta imgt_mouse_IGHD.fasta imgt_mouse_IGKJ.fasta”. (3) Phylogenetic trees estimated with “BuildTrees.py -d input_clone-pass_germ-pass.tsv --outname input_tree_optim --asr 0.1 --outdir input --igphyml --nproc 1 --collapse --optimize tlr --clean all”.
Supplementary Material
Data S1 (related to Figure 3): Lineage trees for Ighg2A10 cells responding to sporozoite immunization Lineage trees for each individual mouse at the day 21 timepoint based on a maximum likelihood estimation based on the HLP19 substitution model for B-cell somatic hypermutation (SHM). To present the key non-synonymous mutations within the context of the overall sequence evolution of the cells, the ancestral sequences of internal nodes were estimated and the first appearance of the key mutations are highlighted in the phylogenetic tree. The x-axis is scaled to mutations/base. Colors indicate the phenotype of each individual cell at the leaf nodes of the tree.
Table S1 (related to Figure 1): Affinity maturation of Ighg2A10 cells. Nucleotide and amino acid sequences from the sequencing of light chains from flow sorted Ighg2A10 cells isolated from the spleen or bone marrow at different time points post immunization. Source data for Figure 1 D–H, Figure S1 and Figure 4 H–I.
Table S2 (related to Figure 2): Mutations in Ighg2A20 B cells after sporozoite immunization. Nucleotide sequences in AIRR format for each cell from the VDJ analysis determined from 10x Chromium sequencing of sporozoite immunized mice. A total 4154 cells from 10 mice (5 mice per timepoint) were included in the analysis after excluding any cells with incomplete or truncated sequences. A separate table with the corresponding amino acid sequences is also provided.
Table S3 (related to Figure 4): Mutations in Ighg2A20 B cells after protein immunization. Nucleotide sequences for each cell from the VDJ analysis determined from 10x Chromium sequencing of CSP9 or CSP27 immunized mice. A total of 21843 cells from 18 mice were included in the analysis after excluding any cells with incomplete or truncated sequences. A separate table with the corresponding amino acid sequences is also provided.
Highlights.
Ighg2A10 B cells follow a canonical program of germinal center affinity maturation
Single cell RNA-seq identifies three light zone populations including pre-plasma cells
Pre-plasma cells have similar affinity to cells that remain in the germinal center
Low avidity antigens induce more stringent germinal center selection
Acknowledgments:
We thank M. Devoy, H. Vohra, and C. Gillespie of the Flow Cytometry Facility at the John Curtin School of Medical Research for assistance with flow cytometry. We further thank the Maxim Nekrasov and Peter Milburn for of the Biomedical Resource Facility at the John Curtin School of Medical Research for assistance with single cell RNA seq.
Funding:
This study was funded by grants (GNT1158404, GNT2003035 and GNT2008648) from the National Health and Medical Research Council (Australia) to IAC.
Footnotes
Publisher's Disclaimer: This is a PDF file of an unedited manuscript that has been accepted for publication. As a service to our customers we are providing this early version of the manuscript. The manuscript will undergo copyediting, typesetting, and review of the resulting proof before it is published in its final form. Please note that during the production process errors may be discovered which could affect the content, and all legal disclaimers that apply to the journal pertain.
Competing interests: Authors declare that they have no competing interests.
References
- 1.Plotkin SA (2020). Updates on immunologic correlates of vaccine-induced protection. Vaccine 38, 2250–2257. 10.1016/j.vaccine.2019.10.046. [DOI] [PubMed] [Google Scholar]
- 2.Amanna IJ, Carlson NE, and Slifka MK (2007). Duration of humoral immunity to common viral and vaccine antigens. N Engl J Med 357, 1903–1915. 10.1056/NEJMoa066092. [DOI] [PubMed] [Google Scholar]
- 3.Slifka MK, Matloubian M, and Ahmed R (1995). Bone marrow is a major site of long-term antibody production after acute viral infection. J Virol 69, 1895–1902. 10.1128/JVI.69.3.1895-1902.1995. [DOI] [PMC free article] [PubMed] [Google Scholar]
- 4.Slifka MK, and Ahmed R (1996). Long-term antibody production is sustained by antibody-secreting cells in the bone marrow following acute viral infection. Ann N Y Acad Sci 797, 166–176. 10.1111/j.1749-6632.1996.tb52958.x. [DOI] [PubMed] [Google Scholar]
- 5.Jerne NK (1951). A study of avidity based on rabbit skin responses to diphtheria toxin-antitoxin mixtures. Acta Pathol Microbiol Scand Suppl (1926) 87, 1–183. [PubMed] [Google Scholar]
- 6.Eisen HN, and Siskind GW (1964). Variations in Affinities of Antibodies during the Immune Response. Biochemistry 3, 996–1008. 10.1021/bi00895a027. [DOI] [PubMed] [Google Scholar]
- 7.Nieuwenhuis P, and Opstelten D (1984). Functional anatomy of germinal centers. Am J Anat 170, 421–435. 10.1002/aja.1001700315. [DOI] [PubMed] [Google Scholar]
- 8.Victora GD, Schwickert TA, Fooksman DR, Kamphorst AO, Meyer-Hermann M, Dustin ML, and Nussenzweig MC (2010). Germinal center dynamics revealed by multiphoton microscopy with a photoactivatable fluorescent reporter. Cell 143, 592–605. 10.1016/j.cell.2010.10.032. [DOI] [PMC free article] [PubMed] [Google Scholar]
- 9.Allen CD, Okada T, Tang HL, and Cyster JG (2007). Imaging of germinal center selection events during affinity maturation. Science 315, 528–531. 10.1126/science.1136736. [DOI] [PubMed] [Google Scholar]
- 10.Smith KG, Light A, Nossal GJ, and Tarlinton DM (1997). The extent of affinity maturation differs between the memory and antibody-forming cell compartments in the primary immune response. EMBO J 16, 2996–3006. 10.1093/emboj/16.11.2996. [DOI] [PMC free article] [PubMed] [Google Scholar]
- 11.Viant C, Weymar GHJ, Escolano A, Chen S, Hartweger H, Cipolla M, Gazumyan A, and Nussenzweig MC (2020). Antibody Affinity Shapes the Choice between Memory and Germinal Center B Cell Fates. Cell 183, 1298–1311 e1211. 10.1016/j.cell.2020.09.063. [DOI] [PMC free article] [PubMed] [Google Scholar]
- 12.Wong R, Belk JA, Govero J, Uhrlaub JL, Reinartz D, Zhao H, Errico JM, D’Souza L, Ripperger TJ, Nikolich-Zugich J, et al. (2020). Affinity-Restricted Memory B Cells Dominate Recall Responses to Heterologous Flaviviruses. Immunity 53, 1078–1094 e1077. 10.1016/j.immuni.2020.09.001. [DOI] [PMC free article] [PubMed] [Google Scholar]
- 13.Paus D, Phan TG, Chan TD, Gardam S, Basten A, and Brink R (2006). Antigen recognition strength regulates the choice between extrafollicular plasma cell and germinal center B cell differentiation. J Exp Med 203, 1081–1091. 10.1084/jem.20060087. [DOI] [PMC free article] [PubMed] [Google Scholar]
- 14.Chan TD, Gatto D, Wood K, Camidge T, Basten A, and Brink R (2009). Antigen affinity controls rapid T-dependent antibody production by driving the expansion rather than the differentiation or extrafollicular migration of early plasmablasts. J Immunol 183, 3139–3149. 10.4049/jimmunol.0901690. [DOI] [PubMed] [Google Scholar]
- 15.Phan TG, Paus D, Chan TD, Turner ML, Nutt SL, Basten A, and Brink R (2006). High affinity germinal center B cells are actively selected into the plasma cell compartment. J Exp Med 203, 2419–2424. 10.1084/jem.20061254. [DOI] [PMC free article] [PubMed] [Google Scholar]
- 16.Krautler NJ, Suan D, Butt D, Bourne K, Hermes JR, Chan TD, Sundling C, Kaplan W, Schofield P, Jackson J, et al. (2017). Differentiation of germinal center B cells into plasma cells is initiated by high-affinity antigen and completed by Tfh cells. J Exp Med 214, 1259–1267. 10.1084/jem.20161533. [DOI] [PMC free article] [PubMed] [Google Scholar]
- 17.Inoue T, Moran I, Shinnakasu R, Phan TG, and Kurosaki T (2018). Generation of memory B cells and their reactivation. Immunol Rev 283, 138–149. 10.1111/imr.12640. [DOI] [PubMed] [Google Scholar]
- 18.Ise W, Fujii K, Shiroguchi K, Ito A, Kometani K, Takeda K, Kawakami E, Yamashita K, Suzuki K, Okada T, and Kurosaki T (2018). T Follicular Helper Cell-Germinal Center B Cell Interaction Strength Regulates Entry into Plasma Cell or Recycling Germinal Center Cell Fate. Immunity 48, 702–715 e704. 10.1016/j.immuni.2018.03.027. [DOI] [PubMed] [Google Scholar]
- 19.Gitlin AD, Shulman Z, and Nussenzweig MC (2014). Clonal selection in the germinal centre by regulated proliferation and hypermutation. Nature 509, 637–640. 10.1038/nature13300. [DOI] [PMC free article] [PubMed] [Google Scholar]
- 20.Weisel FJ, Zuccarino-Catania GV, Chikina M, and Shlomchik MJ (2016). A Temporal Switch in the Germinal Center Determines Differential Output of Memory B and Plasma Cells. Immunity 44, 116–130. 10.1016/j.immuni.2015.12.004. [DOI] [PMC free article] [PubMed] [Google Scholar]
- 21.Robinson MJ, Dowling MR, Pitt C, O’Donnell K, Webster RH, Hill DL, Ding Z, Dvorscek AR, Brodie EJ, Hodgkin PD, et al. (2022). Long-lived plasma cells accumulate in the bone marrow at a constant rate from early in an immune response. Sci Immunol 7, eabm8389. 10.1126/sciimmunol.abm8389. [DOI] [PubMed] [Google Scholar]
- 22.Koike T, Fujii K, Kometani K, Butler NS, Funakoshi K, Yari S, Kikuta J, Ishii M, Kurosaki T, and Ise W (2023). Progressive differentiation toward the long-lived plasma cell compartment in the bone marrow. J Exp Med 220. 10.1084/jem.20221717. [DOI] [PMC free article] [PubMed] [Google Scholar]
- 23.Xu AQ, Barbosa RR, and Calado DP (2020). Genetic timestamping of plasma cells in vivo reveals tissue-specific homeostatic population turnover. Elife 9. 10.7554/eLife.59850. [DOI] [PMC free article] [PubMed] [Google Scholar]
- 24.McNamara HA, Idris AH, Sutton HJ, Vistein R, Flynn BJ, Cai Y, Wiehe K, Lyke KE, Chatterjee D, Kc N, et al. (2020). Antibody Feedback Limits the Expansion of B Cell Responses to Malaria Vaccination but Drives Diversification of the Humoral Response. Cell Host Microbe 28, 572–585 e577. 10.1016/j.chom.2020.07.001. [DOI] [PubMed] [Google Scholar]
- 25.Fisher CR, Sutton HJ, Kaczmarski JA, McNamara HA, Clifton B, Mitchell J, Cai Y, Dups JN, D’Arcy NJ, Singh M, et al. (2017). T-dependent B cell responses to Plasmodium induce antibodies that form a high-avidity multivalent complex with the circumsporozoite protein. PLoS Pathog 13, e1006469. 10.1371/journal.ppat.1006469. [DOI] [PMC free article] [PubMed] [Google Scholar]
- 26.Anker R, Zavala F, and Pollok BA (1990). VH and VL region structure of antibodies that recognize the (NANP)3 dodecapeptide sequence in the circumsporozoite protein of Plasmodium falciparum. Eur J Immunol 20, 2757–2761. 10.1002/eji.1830201233. [DOI] [PubMed] [Google Scholar]
- 27.Glaros V, Rauschmeier R, Artemov AV, Reinhardt A, Ols S, Emmanouilidi A, Gustafsson C, You Y, Mirabello C, Bjorklund AK, et al. (2021). Limited access to antigen drives generation of early B cell memory while restraining the plasmablast response. Immunity 54, 2005–2023 e2010. 10.1016/j.immuni.2021.08.017. [DOI] [PMC free article] [PubMed] [Google Scholar]
- 28.Espinosa DA, Christensen D, Munoz C, Singh S, Locke E, Andersen P, and Zavala F (2017). Robust antibody and CD8(+) T-cell responses induced by P. falciparum CSP adsorbed to cationic liposomal adjuvant CAF09 confer sterilizing immunity against experimental rodent malaria infection. NPJ Vaccines 2. 10.1038/s41541-017-0011-y. [DOI] [PMC free article] [PubMed] [Google Scholar]
- 29.Seder RA, Chang LJ, Enama ME, Zephir KL, Sarwar UN, Gordon IJ, Holman LA, James ER, Billingsley PF, Gunasekera A, et al. (2013). Protection against malaria by intravenous immunization with a nonreplicating sporozoite vaccine. Science 341, 1359–1365. 10.1126/science.1241800. [DOI] [PubMed] [Google Scholar]
- 30.Nussenzweig RS, Vanderberg J, Most H, and Orton C (1967). Protective immunity produced by the injection of x-irradiated sporozoites of plasmodium berghei. Nature 216, 160–162. 10.1038/216160a0. [DOI] [PubMed] [Google Scholar]
- 31.Kallies A, Hasbold J, Tarlinton DM, Dietrich W, Corcoran LM, Hodgkin PD, and Nutt SL (2004). Plasma cell ontogeny defined by quantitative changes in blimp-1 expression. J Exp Med 200, 967–977. 10.1084/jem.20040973. [DOI] [PMC free article] [PubMed] [Google Scholar]
- 32.Pham P, Bransteitter R, Petruska J, and Goodman MF (2003). Processive AID-catalysed cytosine deamination on single-stranded DNA simulates somatic hypermutation. Nature 424, 103–107. 10.1038/nature01760. [DOI] [PubMed] [Google Scholar]
- 33.Stoeckius M, Hafemeister C, Stephenson W, Houck-Loomis B, Chattopadhyay PK, Swerdlow H, Satija R, and Smibert P (2017). Simultaneous epitope and transcriptome measurement in single cells. Nat Methods 14, 865–868. 10.1038/nmeth.4380. [DOI] [PMC free article] [PubMed] [Google Scholar]
- 34.Laidlaw BJ, Schmidt TH, Green JA, Allen CD, Okada T, and Cyster JG (2017). The Eph-related tyrosine kinase ligand Ephrin-B1 marks germinal center and memory precursor B cells. J Exp Med 214, 639–649. 10.1084/jem.20161461. [DOI] [PMC free article] [PubMed] [Google Scholar]
- 35.Suan D, Krautler NJ, Maag JLV, Butt D, Bourne K, Hermes JR, Avery DT, Young C, Statham A, Elliott M, et al. (2017). CCR6 Defines Memory B Cell Precursors in Mouse and Human Germinal Centers, Revealing Light-Zone Location and Predominant Low Antigen Affinity. Immunity 47, 1142–1153 e1144. 10.1016/j.immuni.2017.11.022. [DOI] [PubMed] [Google Scholar]
- 36.Perez-Mazliah D, Gardner PJ, Schweighoffer E, McLaughlin S, Hosking C, Tumwine I, Davis RS, Potocnik AJ, Tybulewicz VL, and Langhorne J (2018). Plasmodium-specific atypical memory B cells are short-lived activated B cells. Elife 7. 10.7554/eLife.39800. [DOI] [PMC free article] [PubMed] [Google Scholar]
- 37.Sutton HJ, Aye R, Idris AH, Vistein R, Nduati E, Kai O, Mwacharo J, Li X, Gao X, Andrews TD, et al. (2021). Atypical B cells are part of an alternative lineage of B cells that participates in responses to vaccination and infection in humans. Cell Rep 34, 108684. 10.1016/j.celrep.2020.108684. [DOI] [PMC free article] [PubMed] [Google Scholar]
- 38.Kennedy DE, Okoreeh MK, Maienschein-Cline M, Ai J, Veselits M, McLean KC, Dhungana Y, Wang H, Peng J, Chi H, et al. (2020). Novel specialized cell state and spatial compartments within the germinal center. Nat Immunol 21, 660–670. 10.1038/s41590-020-0660-2. [DOI] [PMC free article] [PubMed] [Google Scholar]
- 39.Luo W, Conter L, Elsner RA, Smita S, Weisel F, Callahan D, Wu S, Chikina M, and Shlomchik M (2023). IL-21R signal reprogramming cooperates with CD40 and BCR signals to select and differentiate germinal center B cells. Sci Immunol 8, eadd1823. 10.1126/sciimmunol.add1823. [DOI] [PMC free article] [PubMed] [Google Scholar]
- 40.Batista FD, and Neuberger MS (2000). B cells extract and present immobilized antigen: implications for affinity discrimination. EMBO J 19, 513–520. 10.1093/emboj/19.4.513. [DOI] [PMC free article] [PubMed] [Google Scholar]
- 41.Batista FD, and Neuberger MS (1998). Affinity dependence of the B cell response to antigen: a threshold, a ceiling, and the importance of off-rate. Immunity 8, 751–759. 10.1016/s1074-7613(00)80580-4. [DOI] [PubMed] [Google Scholar]
- 42.Chatterjee D, Lewis FJ, Sutton HJ, Kaczmarski JA, Gao X, Cai Y, McNamara HA, Jackson CJ, and Cockburn IA (2021). Avid binding by B cells to the Plasmodium circumsporozoite protein repeat suppresses responses to protective subdominant epitopes. Cell Rep 35, 108996. 10.1016/j.celrep.2021.108996. [DOI] [PMC free article] [PubMed] [Google Scholar]
- 43.Goodnow CC, Crosbie J, Jorgensen H, Brink RA, and Basten A (1989). Induction of self-tolerance in mature peripheral B lymphocytes. Nature 342, 385–391. 10.1038/342385a0. [DOI] [PubMed] [Google Scholar]
- 44.ElTanbouly MA, Ramos V, MacLean AJ, Chen ST, Loewe M, Steinbach S, Ben Tanfous T, Johnson B, Cipolla M, Gazumyan A, et al. (2024). Role of affinity in plasma cell development in the germinal center light zone. J Exp Med 221. 10.1084/jem.20231838. [DOI] [PMC free article] [PubMed] [Google Scholar]
- 45.Sprumont A, Rodrigues A, McGowan SJ, Bannard C, and Bannard O (2023). Germinal centers output clonally diverse plasma cell populations expressing high- and low-affinity antibodies. Cell. 10.1016/j.cell.2023.10.022. [DOI] [PMC free article] [PubMed] [Google Scholar]
- 46.Luo W, Hawse W, Conter L, Trivedi N, Weisel F, Wikenheiser D, Cattley RT, and Shlomchik MJ (2019). The AKT kinase signaling network is rewired by PTEN to control proximal BCR signaling in germinal center B cells. Nat Immunol 20, 736–746. 10.1038/s41590-019-0376-3. [DOI] [PMC free article] [PubMed] [Google Scholar]
- 47.Luo W, Weisel F, and Shlomchik MJ (2018). B Cell Receptor and CD40 Signaling Are Rewired for Synergistic Induction of the c-Myc Transcription Factor in Germinal Center B Cells. Immunity 48, 313–326 e315. 10.1016/j.immuni.2018.01.008. [DOI] [PMC free article] [PubMed] [Google Scholar]
- 48.Khalil AM, Cambier JC, and Shlomchik MJ (2012). B cell receptor signal transduction in the GC is short-circuited by high phosphatase activity. Science 336, 1178–1181. 10.1126/science.1213368. [DOI] [PMC free article] [PubMed] [Google Scholar]
- 49.Robinson MJ, Ding Z, Dowling MR, Hill DL, Webster RH, McKenzie C, Pitt C, O’Donnell K, Mulder J, Brodie E, et al. (2023). Intrinsically determined turnover underlies broad heterogeneity in plasma-cell lifespan. Immunity 56, 1596–1612 e1594. 10.1016/j.immuni.2023.04.015. [DOI] [PubMed] [Google Scholar]
- 50.Butler A, Hoffman P, Smibert P, Papalexi E, and Satija R (2018). Integrating single-cell transcriptomic data across different conditions, technologies, and species. Nat Biotechnol 36, 411–420. 10.1038/nbt.4096. [DOI] [PMC free article] [PubMed] [Google Scholar]
- 51.Victora GD, Dominguez-Sola D, Holmes AB, Deroubaix S, Dalla-Favera R, and Nussenzweig MC (2012). Identification of human germinal center light and dark zone cells and their relationship to human B-cell lymphomas. Blood 120, 2240–2248. 10.1182/blood-2012-03-415380. [DOI] [PMC free article] [PubMed] [Google Scholar]
- 52.Trapnell C, Cacchiarelli D, Grimsby J, Pokharel P, Li S, Morse M, Lennon NJ, Livak KJ, Mikkelsen TS, and Rinn JL (2014). The dynamics and regulators of cell fate decisions are revealed by pseudotemporal ordering of single cells. Nat Biotechnol 32, 381–386. 10.1038/nbt.2859. [DOI] [PMC free article] [PubMed] [Google Scholar]
- 53.Gupta NT, Vander Heiden JA, Uduman M, Gadala-Maria D, Yaari G, and Kleinstein SH (2015). Change-O: a toolkit for analyzing large-scale B cell immunoglobulin repertoire sequencing data. Bioinformatics 31, 3356–3358. 10.1093/bioinformatics/btv359. [DOI] [PMC free article] [PubMed] [Google Scholar]
- 54.Hoehn KB, Lunter G, and Pybus OG (2017). A Phylogenetic Codon Substitution Model for Antibody Lineages. Genetics 206, 417–427. 10.1534/genetics.116.196303. [DOI] [PMC free article] [PubMed] [Google Scholar]
- 55.Goldman N, and Yang Z (1994). A codon-based model of nucleotide substitution for protein-coding DNA sequences. Mol Biol Evol 11, 725–736. 10.1093/oxfordjournals.molbev.a040153. [DOI] [PubMed] [Google Scholar]
- 56.Hoehn KB, Pybus OG, and Kleinstein SH (2022). Phylogenetic analysis of migration, differentiation, and class switching in B cells. PLoS Comput Biol 18, e1009885. 10.1371/journal.pcbi.1009885. [DOI] [PMC free article] [PubMed] [Google Scholar]
Associated Data
This section collects any data citations, data availability statements, or supplementary materials included in this article.
Supplementary Materials
Data S1 (related to Figure 3): Lineage trees for Ighg2A10 cells responding to sporozoite immunization Lineage trees for each individual mouse at the day 21 timepoint based on a maximum likelihood estimation based on the HLP19 substitution model for B-cell somatic hypermutation (SHM). To present the key non-synonymous mutations within the context of the overall sequence evolution of the cells, the ancestral sequences of internal nodes were estimated and the first appearance of the key mutations are highlighted in the phylogenetic tree. The x-axis is scaled to mutations/base. Colors indicate the phenotype of each individual cell at the leaf nodes of the tree.
Table S1 (related to Figure 1): Affinity maturation of Ighg2A10 cells. Nucleotide and amino acid sequences from the sequencing of light chains from flow sorted Ighg2A10 cells isolated from the spleen or bone marrow at different time points post immunization. Source data for Figure 1 D–H, Figure S1 and Figure 4 H–I.
Table S2 (related to Figure 2): Mutations in Ighg2A20 B cells after sporozoite immunization. Nucleotide sequences in AIRR format for each cell from the VDJ analysis determined from 10x Chromium sequencing of sporozoite immunized mice. A total 4154 cells from 10 mice (5 mice per timepoint) were included in the analysis after excluding any cells with incomplete or truncated sequences. A separate table with the corresponding amino acid sequences is also provided.
Table S3 (related to Figure 4): Mutations in Ighg2A20 B cells after protein immunization. Nucleotide sequences for each cell from the VDJ analysis determined from 10x Chromium sequencing of CSP9 or CSP27 immunized mice. A total of 21843 cells from 18 mice were included in the analysis after excluding any cells with incomplete or truncated sequences. A separate table with the corresponding amino acid sequences is also provided.
Data Availability Statement
Single cell RNA-seq data have been deposited at NCBI Gene Expression Omnibus and is publicly available. Accession number is listed in the key resources table.
This paper does not report original code.
Any additional information required to reanalyze the data reported in this paper is available from the lead contact upon request.
Key resources table
| REAGENT or RESOURCE | SOURCE | IDENTIFIER |
|---|---|---|
| Antibodies | ||
| TotalSeq™-C0301 anti-mouse Hashtag 1 Antibody | Biolegend | Cat#155861 |
| TotalSeq™-C0301 anti-mouse Hashtag 2 Antibody | Biolegend | Cat#155863 |
| TotalSeq™-C0301 anti-mouse Hashtag 3 Antibody | Biolegend | Cat#155865 |
| TotalSeq™-C0301 anti-mouse Hashtag 4 Antibody | Biolegend | Cat#155867 |
| TotalSeq™-C0301 anti-mouse Hashtag 5 Antibody | Biolegend | Cat#155869 |
| TotalSeq™-C0557 anti-mouse CD38 Antibody | Biolegend | Cat#102735 |
| TotalSeq™-C0197 anti-mouse CD69 Antibody | Biolegend | Cat#104551 |
| TotalSeq™-C0228 anti-mouse CD183 (CXCR3) Antibody | Biolegend | Cat#126545 |
| TotalSeq™-C0106 anti-mouse CD11c Antibody | Biolegend | Cat#117361 |
| Brilliant Violet 510™ anti-mouse CD45.1 Antibody | Biolegend | Cat#110741 |
| Brilliant Violet 605™ anti-mouse IgD Antibody | Biolegend | Cat#405727 |
| Brilliant Violet 605™ anti-mouse/human CD45R/B220 Antibody | Biolegend | Cat#103243 |
| Pacific Blue™ anti-mouse/human GL7 Antigen (T and B cell Activation Marker) Antibody | Biolegend | Cat#144614 |
| PE/Cyanine7 anti-mouse CD138 (Syndecan-1) Antibody | Biolegend | Cat#142514 |
| BUV395 Rat Anti-Mouse CD19 | BD | Cat#563557 |
| IgM Monoclonal Antibody (II/41), APC-eFluor™ 780, eBioscience™ | ThermoFisher | Cat#47-5790-82 |
| CD38 Monoclonal Antibody (90), Alexa Fluor™ 700, eBioscience™ | ThermoFisher | Cat#56-0381-82 |
| PerCP/Cyanine5.5 anti-mouse/human CD11b Antibody | Biolegend | Cat#101228 |
| PerCP/Cyanine5.5 anti-mouse Ly-6G/Ly-6C (Gr-1) Antibody | Biolegend | Cat#108428 |
| PerCP/Cyanine5.5 anti-mouse CD3 Antibody | Biolegend | Cat#100218 |
| FITC anti-mouse IgD Antibody | Biolegend | Cat#405704 |
| Chemicals, peptides, and recombinant proteins | ||
| Agencourt AMPure XP beads | Beckman Coulter | Cat#A63880 |
| Betaine 5M | Sigma-Aldrich | Cat#B300-1VL |
| CloneAmp HiFi PCR Premix | Takara | Cat#639298 |
| ERCC Spike-In Mix | ThermoFisher | Cat#4456740 |
| RNAse inhibitor | Clontech | Cat#2313A |
| SuperScript II RT | Life Technologies | Cat#18064-071 |
| Triton X-100 | Sigma-Aldrich | Cat#T9284 |
| dNTP | ThermoFisher | Cat#R0182 |
| Taq DNA polymerase recombinant | ThermoFisher | Cat#EP0404 |
| Critical commercial assays | ||
| Chromium Next GEM chip G Single cell Ki | 10X Genomics | Cat#1000127 |
| Chromium Next GEM Single Library and Gel Bead Kit | 10X Genomics | Cat#1000128 |
| Chromium Single cell 5′ Feature Barcode Kit | 10X Genomics | Cat#1000256 |
| Chromium Single cell Library Construction Kit | 10X Genomics | Cat#1000190 |
| Chromium Single Cell Mouse BCR Amplification Kit | 10X Genomics | Cat#1000255 |
| Single Index Kit N Set A | 10X Genomics | Cat#1000212 |
| Single Index Kit T Set A | 10X Genomics | Cat#1000213 |
| Chromium Next GEM chip G Single cell Ki | 10X Genomics | Cat#1000127 |
| Chromium Next GEM Single Library and Gel Bead Kit | 10X Genomics | Cat#1000128 |
| Chromium Single cell 5′ Feature Barcode Kit | 10X Genomics | Cat#1000256 |
| Chromium Single cell Library Construction Kit | 10X Genomics | Cat#1000190 |
| Chromium Single Cell Mouse BCR Amplification Kit | 10X Genomics | Cat#1000255 |
| Single Index Kit N Set A | 10X Genomics | Cat#1000212 |
| Single Index Kit T Set A | 10X Genomics | Cat#1000213 |
| Deposited data | ||
| Singel cell RNA-seq datasets | This study | GSE248377 |
| Experimental models: Organisms/strains | ||
| Mouse: Ighg2A10 | McNamara et al [24] | N/A |
| Mouse: MD4 (C57BL/6-Tg(IghelMD4)4Ccg/J) | Goodnow et al [43] | N/A |
| Oligonucleotides | ||
| mVkappaF: 5′-TCGTCGGCAGCGTCAGATGTGTATAAGAGACAGGAYATTGTGMTSACMCARWCTMCA-3′ | ThermoFisher | N/A |
| mCkappaR: 5′-GTCTCGTGGGCTCGGAGATGTGTATAAGAGACAGACTGAGGCACCTCCAGATGTT-3′ | ThermoFisher | N/A |
| Oligo-dT: 5′-AAGCAGTGGTATCAACGCAGAGTACT30VN-3′ | ThermoFisher | N/A |
| TS primer : 5′-AAGCAGTGGTATCAACGCAGAGTACATrGrG+G-3′ | Qiagen | N/A |
| ISPCR: 5′-AAGCAGTGGTATCAACGCAGAGT-3′ | ThermoFisher | N/A |
| Software and algorithms | ||
| CellRanger | 10X Genomics | https://support.10xgenomics.com/single-cell-gene-expression/software/pipelines/latest/using/tutorial_in |
| Seurat (V3) | Butler et al [50] | https://satijalab.org/seurat/ |
| R | R Core Team | https://www.r-project.org/ |
| Monocle3 | Trapnell et al [52] | https://cole-trapnell-lab.github.io/monocle3/ |
| Immcantation | Gupta et al [53] | https://immcantation.readthedocs.io/en/stable/index.html |
| FlowJo | FlowJo | https://www.flowjo.com/ |
| Prism | Graphpad | https://www.graphpad.com/ |