

Abstract
The molecular determinants of amyloid protein misfolding and aggregation are key for development of therapeutic interventions in neurodegenerative disease. Although small synthetic molecules, bifunctional molecules, and natural products offer a potentially advantageous approach to therapeutics to remodel aggregation, their evaluation requires new platforms that inform at the molecular level. To that end, we chose pulsed hydrogen/deuterium exchange mass spectrometry (HDX-MS) to discern phenomena of aggregation modulation for a model system of alpha synuclein (αS) and resveratrol, an anti-amyloid compound. We invoked, as a complement to HDX, advanced kinetic modeling, described here, to illuminate the details of aggregation and to determine the number of oligomeric populations by kinetically fitting the experimental data under conditions of limited proteolysis. The misfolding of αS is most evident within and nearby the non-amyloid-β component (NAC) region, and resveratrol significantly remodels that aggregation. HDX distinguishes a less solvent-accessible, more structured oligomer that co-exists with a solvent-accessible, more disordered oligomer during aggregation. A view of the misfolding emerges from time-dependent changes in the fractional species across the protein with or without resveratrol while details were determined through kinetic modeling of the protected species. A detailed picture of the inhibitory action of resveratrol with time and regional specificity emerges, a picture that can be obtained for other inhibitors and amyloid proteins. Moreover, the model reveals new states of aggregation are sampled, providing new insights on amyloid formation. The findings were corroborated with circular dichroism and transmission electron microscopy.
Keywords: pulsed hydrogen/deuterium exchange, resveratrol, limited proteolysis, amyloid formation, protein aggregation, modulator of alpha-synuclein, kinetic modeling of aggregation
Graphical Abstract

INTRODUCTION
Alpha-synuclein (αS) is a synaptic, intrinsically disordered protein (IDP) that self-assembles into transient intermediates (small oligomers and protofibrils) giving rise to large, insoluble amyloid fibrils1,2. Aggregated αS is the primary component of Lewy-bodies observed in synucleinopathies and Parkinson’s disease3, which affects > 6 million people worldwide4. Various oligomeric intermediates of αS have been associated with neurotoxicity and synaptic damage5–8. It has been long debated whether the large insoluble, amyloid fibrils deposited in the brain represent innocuous end products or play an important role in the pathology of disease9.
The underlying causes of misfolding are numerous10–12. For the more prevalent, sporadic form of Parkinson’s disease (PD),13 self-assembly of αS can be instigated by changes in cellular environment (e.g., disturbances in metal homeostasis, oxidative stress14, mitochondrial imbalance15, impairment of cellular clearance16). Importantly, the mere presence of missense mutations can lead to an enhanced aggregation propensity in the familial forms of Parkinson’s disease17.
Anti-amyloid agents may slow disease progression, reduce amyloid formation, stabilize early, non-toxic oligomers, or enhance cellular clearance. Recent in vitro studies highlighted positive modulatory effects of short β-sheet breaking peptides18, molecular chaperones19, antibodies20, and numerous natural products21–23. The latter group includes epigallocatechin-3-gallate (EGCG) derived from green tea24,25, tannic acid from tree bark23, curcumin from turmeric26, myricetin27, gallic acid28–30, rosmarinic acid27, baicalein31, and scutellarin32.
We chose to investigate αS aggregation in the presence of resveratrol to gain insights on aggregation and to continue development of pulsed HDX, limited proteolysis, and kinetic modeling to probe aggregation. Resveratrol (trans-3,5,4-trihydroxy-trans-stilbene), a naturally occurring polyphenol abundant in grape seeds33, berries34, and nuts35), affects amyloid formation of various proteins and peptides prone to misfolding. For example, resveratrol remodels soluble Aβ aggregates with a random coil or β-sheet into SDS resistant, disordered intermediates36. Furthermore, it diverts soluble oligomers and fibrillar forms of Aβ into off-pathway forms of different properties36. Resveratrol binds to monomeric Aβ40, Aβ42, and fibrils, as indicated by nuclear magnetic resonance (NMR) and surface plasmon resonance (SPR)37, alters morphology, and shortens fibril length. Nevertheless, lipids modulate the inhibitory function of resveratrol on Aβ40, in the presence of large unilamellar vesicles (LUVs) the inhibition was reduced38.
Resveratrol also binds to plaques in brain slices from Alzheimer’s disease (AD) patients37. Moreover, resveratrol inhibits Aβ42 fibril formation and toxicity in neuroblastoma cells and changes the conformation of oligomers, reducing their toxicity39. Resveratrol in combination with rifampicin improved cognitive function of APP-, tau- and αS-Tgmice, reduced oligomer burden, and restored hippocampal synatophysin levels40. In particular, in the αS-Tg mice it was shown that combined treatment of rifampicin and resveratrol resulted in significant improvement of memory recovery. Immunohistochemistry results showed that the levels of αS oligomers in the visual cortex and hippocampus were lower following administration of the compounds40. Resveratrol in AD is overall safe and well tolerated41, and a follow-up concluded that resveratrol influences neuroinflammation and induces adaptive immunity42.
One working hypothesis for the inhibition of fibril formation is that the stilbene moiety of resveratrol destabilizes β-sheet rich conformations to give smaller oligomers39,43. For example, resveratrol can bind to the hydrophobic core of Aβ, preventing stacking of Aβ molecules39,44. Richard et al.45 demonstrated that H-bonds can form between of the hydroxyl groups of resveratrol and the donor or acceptor groups of neurotensin.
Islet amyloid polypeptide (IAPP) undergoes amylin misfolding, causing cell death of β-Langerhans cells in type II diabetes, dialysis-related amyloidosis, and islet transplantation46. Resveratrol also inhibits IAPP self-assembly47 by interacting with aromatic and basic residues47,48 via polyphenol hydrogen bonding, π-π stacking, and hydrophobic interactions49,50. The data reveal that resveratrol, by decreasing inter-peptide associations and reducing α-helicity, decreases the probability of fibril formation. The simulation data reinforce the importance of contacts involving aromatic and basic side chains of monomeric IAPP49.
Transthyretin (TTR), a naturally occurring protein homotetramer, causes sporadic senile systemic amyloidosis51 by affecting transport of thyroxine (T4) and the co-transport of vitamin-A in complex with retinol-binding protein 4 (RBP4). Resveratrol markedly reduces TTT fibril formation by fitting into the T4 binding pocket of TTR52.
Despite these efforts to understand inhibition of amyloid proteins, the kinetics of αS aggregation are not understood particularly on a regional (peptide) level. Resveratrol may activate sirtuitin, a neuroprotective protein that protects SK-N-BE cells from oxidative stress exerted by mutant A30P αS53. It was demonstrated that resveratrol rescued αS induced cytotoxicity in SH-SY5Y neuroblastoma cells. Furthermore, it ameliorated the adverse effects of αS in a A53T mice model by numerous pathways. Resveratrol improved motor performance of A53T mice, improved memory deficits, alleviated neuroinflammation, reduced the levels of Lewy Body-509-positive αS in the brain and caused a reduction in A11 as well as W20-positive oligomers54. Studies55 show that resveratrol inhibits aggregation of αS in vitro in a similar manner as Congo Red and curcumin. Congo Red and lacmoid both interact with the alipathic N-terminus and, to some extent, the central region56 to alter aggregation. Lacmoid has a higher affinity for the hydrophobic core of αS56 whereas Congo Red may induce formation of large, insoluble aggregates, supposedly via destabilization of a native–like state whereas lacmoid stabilizes the native state and thereby inhibit its self-assembly56.
That resveratrol affects aggregation motivated us to delve into the molecular details of aggregation. Although NMR can probe the monomer, cryo electron microscopy (cryo EM) and solid-state NMR the final solid fibril, methods that produce molecular information with regional spatial resolution during the aggregation are lacking. Promising is the recent NMR based Self-Assembly monitored by Temperature-Induced Relaxation Enhancement approach that utilizes solutions of primarily monomers at low temperatures and tracks progressive formation of oligomers by using 15N - R2 rates and the progressive formation of thermally induced oligomers across a temperature gradient57. Pulsed HDX is another approach that can be applied over the entire aggregation time, as shown here.
RESULTS and DISCUSSION
Different aggregation pathways for αS and αS-resveratrol.
Existing in vitro screening techniques of αS aggregation track conformational changes in the presence of an amyloid-inhibitor; however, they do not provide region-specific information. Many of these platforms afford high-throughput55 (e.g., thioflavin-T fluorescence, protein misfolding cyclic amplification (PMCA), and surface plasmon resonance arrays) but cannot spatially localize inhibitory/binding interactions. Alternative spectroscopic measurements, single molecule fluorescence and fluorescence resonance energy transfer (FRET), require submicromolar concentrations58,59, yet they rely on conjugation of fluorophores to the protein and provide ensemble measurements. By contrast, high-resolution structural methods (e.g. NMR)60–62, offer residue-level binding specifics at given snapshots, even during the early stages of aggregation57.
To extend these methods, we implemented a medium resolution method, pulsed hydrogen deuterium exchange mass spectrometry (HDX-MS), without the need for any other additional label (other than deuterium)63–65 for characterization of the aggregation kinetics of αS in vitro in the presence of a modulatory compound, resveratrol. Pulsed HDX-MS has distinct advantages for amyloid formation63–65, providing a temporally and spatially-resolved picture of the exchangeable amide H-network. During protein aggregation, conformational hotspots experience structural transitions that result in altered solvent accessibility and H-bonding. When residues misfold, they can either gain structure or become buried upon interacting with an inhibitor, resulting in lower accessibility for HDX. Furthermore, kinetic modeling of the HDX data can determine the number of populations involved in the aggregation, with and without an inhibitor, as shown here.
When aS is in its natively unstructured form, its exchangeable hydrogens undergo fast exchange with a typical unimodal distribution because the protein is in an open, dynamic conformation characteristic of IDPs66,67. In our prior68 and present experiments, a fast exchanging, highly solvent accessible oligomer populated at the start represents the soluble αS protein, and we refer to it as species2. During self-assembly, this species becomes more folded owing to intermolecular interactions, hence less solvent accessible and more resistant to HDX, yielding a second oligomer (species1). The relative abundance of the two species can be clearly observed as parts of distinct bimodal distributions that correspond to solution species that appear as aggregation proceeds, in agreement with our previous results68. In this study, the starting concentration of αS was slightly higher (90 µM) than in our previous report (80 µM)68, and that may explain the higher amplitudes of species1 because aggregation of αS depends on concentration and a range of experimental conditions69. As aggregation proceeds, the relative abundance of the starting material undergoing high exchange (species2) decreases to give rise to the protected counterpart, reporting more closely on the aggregation itself (species1). Furthermore, the appearance of the protected species shows regional specificity pertaining to the structural determinants of its aggregation.
The effect of αS N-terminus on its aggregation is better understood from continuous HDX studies of both different monomeric αS variants70 and of oligomeric assemblies71,72 . We also find that the N-terminus experiences a decrease in HDX, gaining more structure during misfolding over an extended period of aggregation in vitro, as shown by a representative peptic peptide 5–17 (2+) either in the presence or absence of resveratrol (Fig 1; representative mass spectra spanning all time points of our HDX exchange are in SI Part 1 Fig S1). The relative abundance of protected species1 is significantly lower for αS aggregated in the presence of resveratrol, yielding a lower fractional species1. On the N-terminus, the protected species1 is nearly completely absent over the first 32 h of aggregation when resveratrol is present, whereas in its absence, the variation of species1 abundance is similar to that of species2 after 32 h (Part 1 Fig S1).
Figure 1.

Narrow range mass spectra of peptide 5–17 (2+; MKGLSKAKEGVVA) during HDX without (black) or with resveratrol (w Resv; red) at selected time points during aggregation. The plots display mass shifts as compared to the control in the absence of D2O (at the top (blue)). The isotopic envelopes exhibit a bimodal distribution shaded with gray (species1) or without shading (species2). The protected, slow exchanging population indicative of aggregation is shaded by gray and denoted as species1, whereas the fast exchanging, initial population that gradually begins to deplete in abundance is without shading and referred to as species2. The distinct isotopic profiles are marked with dashed lines, and the fit (continuous line) is the sum of the two components.
For peptide 18–38 (3+), two sub-species appear in addition to the protected species1, yielding trimodal distributions that indicate heterogeneity of this peptide segment (mass spectra covering all time points are shown in SI, Part 1 Fig S2). The intermediate species (species2i) is less populated in the presence of resveratrol, and this observation is important because it suggests that the N-terminus adapts a different conformation when resveratrol is present. This intermediate species is much more apparent in our current study because the exchange was carried out at 4 °C as opposed to 21 °C and under less vigorous digestion than used previously68. Temperature is a critical parameter during HDX, decreasing the rate of HDX by a factor of 10 when the temperature is decreased from 25 °C to 4 °C73. It is possible that αS assumes two or more distinct protected conformational entities that exchange differentially from 27 h onward and represent different conformers, as discussed in the study on αS oligomers by Paslawski et al71 (see Part 1 Fig S2). The two species clearly have time dependence and local specificity, and they develop into these states as aggregation continues. These two adjacent peptic peptides, 5–17 (2+) and 18–38 (3+) reveal the heterogeneity of the N-terminus; peptide 5–17 (2+) shows a clear bimodal profile, whereas peptide 18–38 (3+) is characterized by trimodal character.
The interaction of resveratrol may be transient similar to that of another phenolic compound, gallic acid28,29, and electrostatic in accord with native MS of the monomer that showed no complex formation (Part 1 Fig S3). The next peptic peptide, 39–54 (2+), situated near the hydrophobic, amyloid-forming structural domain of αS, exhibited a characteristic bimodal distribution throughout the time of aggregation (from 0.1 h to 171 h) (complete pulsed HDX patterns are in SI Part 1 Fig S4). Resveratrol conferred the greatest protective effect in this region, as evidenced by the lowest abundance of species1 over all time points.
In the most aggregation prone, central region, HDX protection is manifest as bimodal distributions whose proportions are a function of time as illustrated by peptide 77–89 (2+) (Fig 2). The central, NAC region displays the highest level of protection consistent with solid state NMR60,61 and continuous HDX-MS results66 (the complete time series for this peptide is in SI Part 1 Fig S5).
Figure 2.

Narrow range mass spectra of peptide 77–89 (2+; VAQKTVEGAGSIA) during HDX without (black) or with resveratrol (w Resv; red) at selected aggregation times. The spectral mass shifts are manifest when compared to an isotope distribution in the absence of D2O (top, blue). The isotopic envelopes exhibit a binomial distribution shaded with gray (species1) or without shading (species2). The protected, slow exchanging population that reports on aggregation is shaded by gray and denoted as species1, whereas the fast exchanging, initial population that gradually begins to deplete in abundance is without shading and refers to species2.The outlines of the two distinct isotopic clusters are marked by dotted lines and the fit (continuous line) is the sum of the two profiles.
Broad picture of aggregation.
Examining the phenomenology of the aggregation, we see that regions represented by peptides 39–54 (2+), 55–69 (2+), 55–75 (2+) and 77–89 (2+) reach a fractional species1 value of approximately 0.8 or greater, suggesting that the majority of αS in the regions represented by these peptides continue to aggregate in a smooth way as evidenced by the monotonic decrease in solvent accessibility or increase in H bonding. A change in aggregation (Fig 3), however, is seen for the fractional species as a function of time in the presence of resveratrol compared to its absence. As aggregation proceeds, αS aggregation changes course and clearly assumes conformations with lower protection (more solvent accessibility) as revealed by the lower value for fractional species1 of all peptic peptides located nearby or within the central region of the protein. (All species or populations containing the NAC and adjoining regions, represented by peptides 5–17 (2+), 18–38 (3+), 39–54 (2+) and 90–113 (3+), are revealed in the modeling, described later, as shown in SI Part 1 Fig S6.) The NAC regions represented by peptides 55–69, 55–75, and 75–89 must be part of another population or species that exhibits more protection comparable to the monomer and initially formed oligomers. The C-terminal region becomes only very moderately protected and remains predominantly solvent accessible (e.g., peptide 132–140 (2+)) (SI, Part 1 Fig S7).
Figure 3.

Average fractions of species1 and species2 with standard deviation for peptides, 55–69 (2+), 55–75 (2+) and 77–89 (2+) residing near in the NAC region in the absence (left) or in the presence of resveratrol (w Resv; right) across the complete time series of aggregation. The protected, slow exchanging population is shown with red open circles and denoted as species1, whereas the fast exchanging, initial species that decreases in abundance is shown by purple open circles and referred to as species2. Corresponding fits derived from modeling (described later) are shown with solid lines.
Another way to view the effect of resveratrol is to compare the maximum fractional species1 of all peptides (SI, Part 1 Fig S8). Resveratrol clearly lowers the relative abundance of species1, showing again that resveratrol significantly hinders the formation of buried, less exchanging species1 during aggregation both on the N-terminus and in the pivotal NAC region.
Perspective on use of modeling for aggregation.
We expect that more detail can be extracted from the experiments by kinetic modeling. This is not an original idea. Different methods of measuring the progress of protein aggregation respond with different mixes of information (different projections). An example is amyloid β42 (Aβ42) for which Garai and Frieden74 covalently labeled an N-terminal lysine with tetramethylrhodamine (TMR) to measure fluorescence self-quenching and to compare that to changes reported by fluorescence of ThioflavinT (ThT). TMR reports an early decrease in signal during aggregation interpreted as the formation of small oligomers, and this change is not matched in the lag phase of the ThT trend. Additionally, the sigmoidal growth-phase reported by TMR occurs earlier than for ThT, which is explained as TMR reporting formation of larger oligomers not detected by ThT.
Li et al.75 used hydroxyl radicals via fast photochemical oxidation of proteins (FPOP) to label solvent-exposed Aβ42 residues and show that, after an initial drop in labeling attributed to the formation of small oligomers, there are two subsequent sigmoidal growth features. Clearly, there are more features than just a single sigmoidal signal change in the time course of aggregation.
Models76,77 for these aggregations are different in ways that correspond to the projections produced by the experiment method and data. Garai and Frieden74 modeled the early changes reported by TMR as reversible sequential dimerization and trimerization reactions. Li et al.75 used dimerization followed by a cascade of two Morris et al.78 autocatalytic processes for their modeling. Nucleation-dependent polymerization models, using a nucleation-elongation-fragmentation (or secondary nucleation) master equation for an ensemble of polymers reduced to two principal moments,79–81 can characterize polymerization-time curves that have a single sigmoidal feature. For Aβ42 as an example, single-sigmoidal curves as a function of initial monomer concentration and orbital shaking rate were modeled with secondary nucleation for low shaking rates82.
Kinetics measured by EPR83 show evidence of populations of oligomers and fibrils (αS cysteine substituted at position 56 was spin labeled after being reduced). The spin labeled αS was diluted 10 to 1 with unlabeled αS (position 56 is on the N-terminal side of the NAC (61–95) and in the proteolytic peptides 55–69 and 55–75 of this work). EPR spectra taken as αS aggregates over time discerned three size populations: monomers, fibrils and an intermediate size claimed to be oligomers. The intermediate population rose quickly but was fully dissipated by 30 h. The fibril population reached its half-maximum at ~25 h. Notably, a parallel ThT experiment indicates the fibril population half-maximum occurs at 35 h. The EPR results were modeled by a seven order (although order 3 also works) reversible reaction of monomer to form oligomers. A conversion reaction produces fibrils from oligomers, and the fibrils then elongate and fragment. The results suggest there is more kinetic detail than revealed by the EPR signals.
Another example is single-molecule FRET that shows evidence for two populations of oligomers and a population of fibrils84. Alanine of αS was substituted by a cysteine at position 90 and labeled with Alexa Fluor 488 for one portion and Alexa Fluor 594 for a second equal portion and mixed in 1:1 stoichiometric ratio for starting monomer concentrations from 0.5 to 140 µM for an aggregation time course (position 90 is near the C-terminal end of the NAC region and in the proteolytic peptide 90–113 of this work). Two populations, “disordered” low FRET efficiency oligomers and “more compact” high efficiency FRET oligomers, were discerned over aggregation of 54 h. The low FRET efficiency oligomers show an immediate rise at the beginning of aggregation while appearing to maximize at ~ 30 h for 140 and 70 µM while the high efficiency FRET oligomers show a lag phase while appearing to level off after 30 h. The fibril mass trend was measured by using ThT fluorescence to give a midpoint of ~ 32 h. This evidence and others support the argument that these populations are on path with low FRET efficiency oligomers forming first and leading to the formation of high efficiency FRET oligomers that go on to fibrils.
The aggregation time course curves were modeled as monomer, a low FRET efficiency oligomer population, a high efficiency FRET oligomer population, and a fibril population. The preferred nucleation-conversion-polymerization model begins with monomers forming low FRET efficiency oligomers with a primary nucleation order of approximately one. Unimolecular conversions give rise to high efficiency FRET oligomers from low FRET efficiency oligomers and form fibrils from high efficiency FRET oligomers. These conversion reactions were modeled as irreversible. Each of three populations are characterized with two first principal moments, mass concentration and number concentration. Each population’s polymers also undergo elongation.
Implementation of modeling for this work.
To examine quantitatively regions of αS, we fit their bimodal distributions to express the fractional species for each individual isotopic cluster and modeled the HDX kinetics of the species as described in SI, Parts 1 and 2.The modeling for the aggregation kinetics adopted the features of Iljina’s84 effort as a starting point. Additionally, elongation in each population was allowed to be reversible via dissociation. While quiescent αS aggregation experiments seem to involve monomer dependent secondary nucleation,85 this work uses agitation, and the aggregation time course curves for peptides containing the NAC region show shapes that closely resemble the model fragmentation curves of Gaspar et al.85. Thus, the fragmentation was incorporated within each population. Given the cumulative complexity of seven peptide signals for two conditions (without and with resveratrol), six populations were required for the modeling effort described in SI Part 1. This was reduced to five populations for the less flawed modeling effort described in SI Part 2, where some accounting is made for proteolysis yield (see under Extended Modeling).
The model is based on a “closed” system of kinetic equations derived for the two first principal moments, mass concentration and number concentration, from the nucleation-elongation-fragmentation master equation for an ensemble of polymers79. The polymer ensemble is transported through populations, each having two principal moments where mass concentration is termed as beginning with “M”, and number concentration is termed beginning with “P”, each a function of time.
The system is governed by a collection of reactions. The first is primary nucleation that takes soluble monomer to form a polymer of critical nucleus size nc (here nc = 1) in the first population M1/P1 (denoted henceforth as M1). A unimolecular conversion reaction irreversibly carries a polymer (particle) from one population to the next. Within each population, there are elongation reactions that add a monomer to the ends of a polymer, dissociation reactions that remove a monomer from the polymer ends, and fragmentation that breaks a polymer into two pieces. Rate constants govern the flux of subunits from one population to another and the transformations of polymer length within each population. These rate constants are the searched variables that fit the model-derived to the experiment-derived peptide signals. The best fit with the experimental results affords a set of rate constants that define a model. Those rate constants allow us to construct a fractional species plot that shows how the particles trade off with each other (see SI, Parts 1 and 2).
To accommodate the experimental signals in a kinetic scheme that achieves a good fit, we used, as described above, six populations that are more complicated than the monomer (designated M1, M2, M3, M4, M5, and M6). There are also populations of monomer comprised of m, the original monomer and m* and m**, monomers formed by dissociation of the oligomers at their termini (Fig 4). We also incorporated incomplete proteolysis in the model by extending it (explained in SI Part 2).
Figure 4.
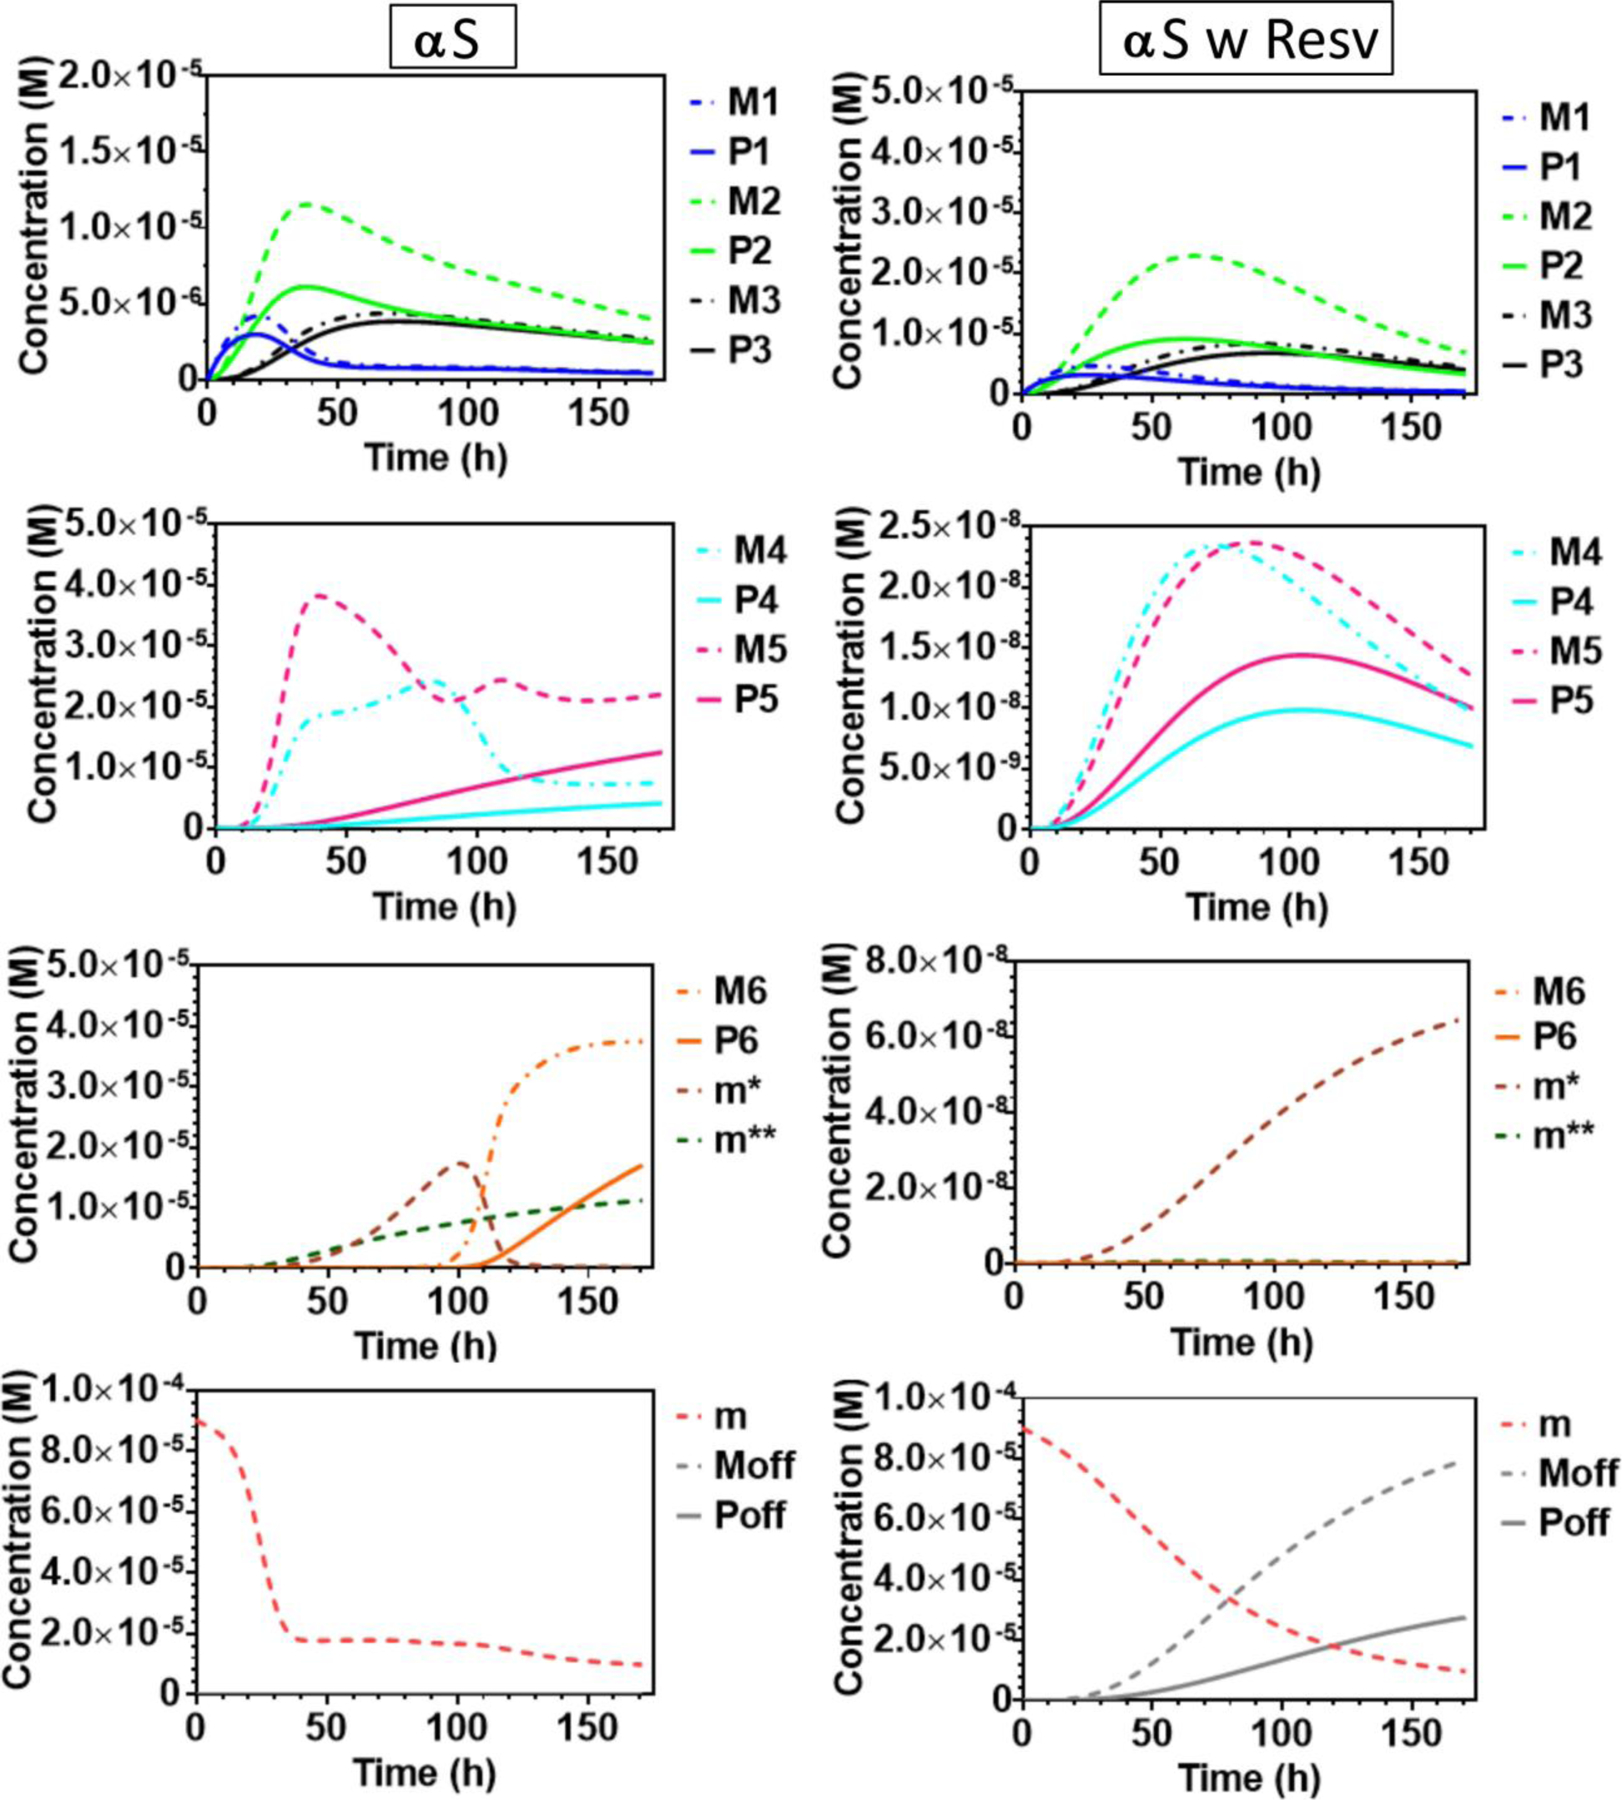
Model mass and number concentration plots from fitting as described in SI Part 1 to all the seven peptide species fraction data vs aggregation time. These model mass concentration trends are combined as specified in the Signal Table SI1 to form the model HDX species fractions to match the experiment HDX species fractions for each peptide as shown in Figure S6. The mass concentration of each modeled population is color coded as follows: M1: dark blue dotted line, M2: green dotted line, M3: black dotted line, M4: light blue dotted line, M5: pink dotted line, M6: orange dotted line, m* brown dotted line, m**: dark green dotted line, m: red dotted line and Moff: grey dotted line and the number concentrations corresponding to each population are shown with a continuous line in matching color.
Integration of modeling with experimental results.
All the peptide signals from experiments of αS without resveratrol show buildup of protection, which is explained by several populations (M2, M3, M4 and M5) followed by their approximate leveling off except for the production of M6, which becomes the predominant population at long time. Different parts of the subunits of these particles are protected in HDX, depending on the population from which they originate, and comprise species1 for different peptide signals. This general feature of this scheme pertains, ignoring details, to all regions of αS except the C terminus. If these soluble particles are the ones that impart toxicity, bypassing them could be the function of a good inhibitor to prevent toxicity, and employing limited proteolysis may emphasize them.
With resveratrol, lower order populations (M1, M2, M3) accumulate mostly, but as they do, they form the higher order populations (M4, M5, M6) at less than three orders of magnitude (note y axes in Fig 4) than those states that are important in aggregation of αS (Part 2 Fig S9). Instead, the aggregation continues to afford Moff, oligomeric populations that contain α-helical character and remain solvent-accessible and unprotected. This remarkable change in aggregation kinetics is caused by the introduction of the natural product, resveratrol, a putative inhibitor of αS, essentially bypassing some populations and forming new ones consisting of αS proteins that are now α-helical and highly solvent-accessible. These product populations are not monomers or monomer-like because if they were, a steady state would be established that would prevent their corresponding signals from trending toward zero, which is observed. Instead, this seventh population, Moff, are oligomers formed or “unmasked” (in terms of HDX protection) via an interaction of αS with resveratrol. We cannot distinguish at this point monomeric αS interacting with resveratrol, requiring stoichiometric amounts of the compound, from oligomeric αS interacting with it. This is the subject for future research.
The particles formed in the presence of resveratrol possess a strong inhibitory-like behavior, particularly at the end stages of aggregation across all peptides discussed here. This is reflected in a marked drop of fractional species1 at 120 and 171 h and suggests that resveratrol either destabilizes intermediate aggregates or interacts with αS to bypass various aggregation pathways. To ensure that the phenomena are reproducible, we repeated the sample set up and MS analyses at several time points and found consistent results. More importantly, we analyzed samples in triplicate in a random order to ensure that carry-over did not influence our outcomes during the entire MS analysis86.
Extended Modeling.
The conditions we chose for digestion did not give 100% yield in peptides; that is, the proteolysis was limited. The efficiency of peptic digestion of kinetic intermediates (Figs S9 and S10) decreased as the aggregation time for αS without resveratrol increased and reached a minimum at approximately 32 h (Fig S10, SI Part 2), nearly the same time that the abundances of species1 and species2 level off. The first model we used does not account for the resistant species that do not proteolyze and are silent to our analyses. Instead of establishing conditions for more complete proteolysis (e.g., changing denaturant, using higher concentration of denaturant) and repeating the study, we took the incomplete proteolysis as an opportunity to utilize more completely the extensive data set that was gathered at great effort and incorporate digestion efficiency in the model. To do this, we input the peptide ion signal intensities as a function of time, which are reasonably reproducible (a better approach for future studies is to add an internal standard to calibrate the signal intensities). We view limited proteolysis87 as a selective “protein footprint”, emphasizing soluble oligomers rather than the entire population. Given that soluble oligomers may be the toxic populations in causing neurodegenerative disease5,7, the approach is well-motivated. It should be noted, however, that in vitro toxic oligomers are more resistant to digestion by proteinase K, as determined previously59. The extended modeling is described in SI Part 2, and the outcomes of its use are in the fractional species variation is shown in Part 2, Figs S11 and S12.
The extended modeling is also motivated by two considerations that point to issues with the first stage of modeling in SI Part 1. First, as shown in Fig 5, the monomer mass concentration decays slowly in the presence of resveratrol. If the proteolysis efficiency of the monomer is constant, then each peptide total signal should also decay slowly, which is not the case as seen in Fig S10. Second, as shown for the population M2/P2, the mass concentration is approximately twice the number concentration, strongly suggesting that this population is composed mostly of dimers. Using the fitted model rate constants for exit pathways from M2/P2 indicated the minimum lifetime of the dimers would be orders of magnitude greater than the experimentally observed maximum in vitro lifetime of 3 s88. The 3-second dimers would likely not be detectable with the one-minute deuteration pulse that we used here.
Figure 5.

Model mass and number concentration plots from fitting as described in SI Part 2 to seven peptide species fraction data vs aggregation time and to seven peptide total signals vs aggregation time. These model mass concentration trends are combined as specified in the Signal Table SI5 to form the model HDX species fractions after accounting for proteolysis yields to match the experiment HDX species fractions for each peptide as shown in Figures S11 and S12. Each population mass concentration modeled is dotted and color coded as given in the legends. The number concentrations corresponding to each population are shown with a continuous line in matching color. The R suffix denotes binding to resveratrol. The lower left quadrant is left blank because there are no populations bound with resveratrol.
In the extended modeling, the population Moff/Poff is replaced with a more detailed mR, M1R/P1R through M6R/P6R, m*R and m**R as shown in Fig 5. This choice is driven by the observation of a clear elevated total signal for a number of peptides for the last two time points in the case of aggregation in the presence of resveratrol. This imitates an end stage feature exhibited by M6-P6 for peptide 18–38 (3+) in the absence of resveratrol and suggests a similar reaction scheme is at work for the resveratrol case but with different HDX responses.
The outcome of the extended model shows that the three issues with the original model are now resolved. First, the limited proteolysis is accounted for (see SI Part 2, Figs S11 and S12, third column). Second, the monomer concentration for αS and resveratrol now decays quickly to allow consistency with the total ion signal. Third, the model, which shows overlap of M2/P2 in Fig 5, indicates no evidence of a detected dimer in the timescale of our pulsed HDX.
CD and TEM for aggregation of αS in presence of resveratrol.
To assess the aggregation intermediates of αS in the absence or presence of αS, we monitored the secondary structure transitions by circular dichroism (CD). Far-UV CD spectra of αS at different aggregation times shows that the natively unstructured protein with a single minimum near 205 nm (0.1 and 6 h) acquired a more structured conformation for which the characteristic negative band (at 22, 27, 32, 53 h) is lost. The aggregating structures transition to a conformation resembling a β-sheet rich amyloid structure by the later stages of aggregation (72, 95, 120, and 171 h), displaying a negative band at ~ 225 nm and a positive band at ~ 200 nm observed for αS (Fig 5; note the spectral transition from navy through orange to gray). In the presence of resveratrol, the secondary structure transitions are markedly different. Although the characteristic natively unstructured protein with the single minimum at 205 nm started to transition at 27 h, its secondary structure rearranged to one of α-helical conformation (Fig 6) with two negative minima at 210 nm and 235 nm (32, 53, 72, and 95 h). Aggregates formed in the presence of resveratrol never reached a β-sheet rich structure as judged by the ellipticity (the CD spectra of αS for the complete time series without or with resveratrol are in SI Part 2 Fig S13). Conclusions from the CD spectra are consistent with those of pulsed HDX.
Figure 6.

Far-UV CD spectra of αS without or with of resveratrol (w Resv) at selected times of the aggregation. All far-UV CD represent average of seven scans after buffer subtraction.
To evaluate the effect of resveratrol on aggregate morphology during self-assembly, we obtained TEM electron micrographs (Fig 7). αS exists as small, soluble oligomers both at 0.1 and 6 h, whereas from 22 h onward it assembles into larger protofibrillar deposits (22, 27 h). At 32, 53, 72, 95, 120, and 171 h, αS in the absence of resveratrol is characterized by large, long fibrils, whereas in its presence, oligomers are seen in electron micrographs. At 32, 53, 72, and 95 h, we see intermediate size protofibrils that are shorter and less clustered or dense in comparison with the corresponding αS fibrils stained at these time points. At 120 and 171 h, resveratrol caused αS to become disaggregated, amorphous deposits (SI Part 2 Fig S14), corroborating our observations from pulsed HDX-MS and CD.
Figure 7.

Transmission electron microscopy images of aS without or with resveratrol at selected times of aggregation. The electron micrographs were obtained by staining with 4% uranyl acetate. The scale bars represent 200 nm.
The morphology of aggregates in the presence of resveratrol54 is similar to that reported in the presence of gallic acid and other species by Ardah et al.29. The investigators inferred that gallic acid binds via OH groups and stabilizes oligomeric intermediates to prevent formation of fully mature fibrils and thereby reduces αS toxicity in M17 neuroblastoma cells. The inhibition relies on the binding vis OH groups, whose positions on the phenol ring are important for efficacy and for quinone formation. The hydrophobic interactions of OH groups and the dipole-dipole interactions with αS bring about potent inhibition. Gallic acid derivatives may act through π-π stacking with oligomers of αS, remodeling the energy landscape to favor alternative aggregation pathways. Meanwhile, the disaggregation properties of gallic acid derivatives are proposed to be due to their oxidation products that can interrupt β-sheets of αS. An ion mobility MS study shows that gallic acid stabilizes the extended conformation of A53T αS, preventing its collapse into the aggregation-competent compact conformation28. This interaction appears to be transient on the basis of NMR28. Interestingly, another study38 showed that the inhibitory effect of resveratrol on αS was diminished in the presence of large unilamellar vesicles (LUVs) in unseeded aggregation assays. In seeded assays, resveratrol, LUVs and αS together aggregated faster than αS alone38.
Molecular dynamics (MD) simulations focusing on two 11-mer peptides of αS (aa 68–78 and 85–95 located at the core or at the C-terminal end of the aggregation competent NAC region, respectively, revealed that resveratrol promotes peptide-peptide reorientation with preferred terminal interactions, resulting in a barrier-free solvent separated conformation30. Based on the examination of these peptide segments, we note that resveratrol may not be able to directly disrupt β-sheets critical in aggregation, but rather act as a modulator that drives αS toward a more extended conformation. Analysis of the full-length protein on the other hand indicated a restricted conformational space of αS owing to steric hindrance or reduced solvation dynamics. The observed modulatory effects of resveratrol, therefore, are more consistent with a mechanism, whereby resveratrol interacts non-covalently with oligomeric intermediates or it stabilizes monomers and/or oligomers by covalent-bonds30. This is somewhat analogous to what has been reported using MD tools to explain the mechanism of action of dopamine89 and norephinephrine,89,90 which are able to disrupt pre-formed αS protofibrils harboring aa 44–9689. The critical nucleus for αS44–96 fibrils was found to be a trimer and the smallest stable nucleus a tetramer. Dopamine and norepinephrine can bind to the turn regions of oligomers; however in this instance, their effects are disruptive and more pronounced in the adjacent β-sheet structure. To a lesser degree they can bind to the β-sheet regions of oligomers and destabilize this segment and affect the E46-K80 salt bridge89. The exact mechanism of action of resveratrol, however, will remain to be understood. Notably, trans-resveratrol (Part 2 Fig S15) can degrade to products91 like 4-hydroxybenzoic acid, which was previously shown to inhibit moderately aggregation of αS itself29. It is plausible, that the strikingly late phases of resveratrol inhibitory action at 120 and 171 h are attributable to break-down products developing during an extended period of incubation. The main interactions of resveratrol and αS share these basic principles of hydrophobic interactions and π-π stacking. A synthetic resveratrol derivative, AM17 was shown to be capable of directly disassembling oligomers and fibrils of αS in vitro92.
CONCLUSIONS
Numerous reports point to the anti-amyloid effects of resveratrol with various amyloid proteins30,36,37,42,42,48,52,55. Herva et al.55 observed an inhibitory effect of resveratrol with αS by employing protein misfolding cyclic amplification (PMCA) assays in combination with other biophysical tools. We harnessed pulsed HDX mass spectrometry and showed its utility for studying amyloidogenic systems93. Further, we generated another view of αS aggregation and uncovered aspects of the modulatory effects in the presence of resveratrol. As previously reported for Abeta and αS, we observed primarily bimodal distributions as self-assembly occurred68,94. We followed the misfolding more closely via the aggregation-prone, protected species1 and obtained near sigmoidal curves upon fitting the fractional species of this population that develops at the expense of species2.
In the presence of resveratrol, aggregation is re-directed down an alternate route that yields strikingly different fractional species1. Aggregation affects less the N-terminus of αS and the central, hydrophobic core. Moreover, at the end stages of aggregation (120 h and 171 h), abundance of fractional species1 decreases, suggesting that resveratrol destabilizes the aggregates even further. The C-terminus of αS, however, remains largely unstructured during the time course of aggregation. We were able to fit the details of the aggregation with an extended model that includes limited proteolysis and all seven proteolytic peptides. Thus, a comprehensive picture of aggregation seems to emerge, occupying a unique means for the analysis of potential inhibitors and modulators. If necessary, the spatial resolution can be increased by more vigorous digestion to give smaller peptides or by employing electron-capture or electron-transfer dissociation strategies.
From our results, the aggregation still proceeds in the presence of resveratrol. The protected fraction in HDX is much less in the presence of resveratrol than in its absence (Part 1, Fig S8). From the CD, the aggregates are more helical (Fig 6 and S13). Furthermore, the proteolysis yield is less in the presence of resveratrol than in its absence (SI Part 2, Fig S10). These conclusions are in accord with other work30, where a MD calculation hints at the notion that aggregation still proceeds in the presence of resveratrol, that the aggregate conformations become more open, and that resveratrol interacts by clustering around αS. The more open conformation would be consistent with an increase in helical content and the loss of HDX protection, whereas the proteolysis yield would be reduced by steric interference by the clustering of resveratrol.
Besides HDX, complementary tools also shed light on this inhibitory action of resveratrol with reference to secondary structure. Distinct conformational transitions of αS occur in the presence of resveratrol, but they do not progress to the β-sheet rich conformations. Far-UV CD spectra revealed different secondary structure between αS and αS with resveratrol at corresponding time points of aggregation. Morphology of these samples of αS and αS with resveratrol taken at different aggregation times provide further insights into the distinct aggregation pathways and reinforced our HDX-MS findings. In the presence of resveratrol, fewer and shorter protofibrils form, and they are unlike the long and clustered αS fibrils appearing in the aggregation of αS alone from 32 h onward. Interestingly, resveratrol seemed to disaggregate αS at the latest time points (120 h and 171 h). The inhibitory action may arise from a transient interaction, whereby hydrophobic45,52 and π-π interactions49 play a substantial role as reported earlier for gallic acid and its derivatives28,29. The interaction may involve the monomer or more likely the early oligomeric states, demonstrated for a series of natural compounds29,56.
Important questions remain to be addressed about the bioavailability, metabolism, and blood-brain barrier permeability of resveratrol if this compound and its derivatives are evaluated for therapeutic use. Research is underway to assess its tolerability, dosage and side effects in neurodegeneration41,42 and to develop novel ways of delivery95,96. Nevertheless, our approach affords mechanistic insights for modulation of aggregation and suggests a framework for informing future therapeutic design of small molecules. The approach supports pulsed HDX-MS as a tool for assessing potency of inhibitory molecules of amyloid proteins, providing a temporally resolved picture of aggregation at the peptide level that, when complemented with kinetic modeling, can be incorporated into and accompanied by biophysical investigations of anti-amyloid candidates.
METHODS
Protein expression and purification of wild type αS.
WT αS protein expression was performed in E. coli BL21 (DE3) Gold. Bacteria were grown in Luria Broth (LB) and induced for expression at OD600 0.5 with 1 mM Isopropyl β-D-1-thiogalactopyranose (IPTG) that was further incubated at 30 °C overnight. Cells were harvested by centrifugation at 4,000 rpm at 4 °C for 30 min in a Sorvall centrifuge (SLC-6000 rotor). The pellet was frozen, then thawed, and lysed mechanically in 10 mM Tris-HCl with 1 mM EDTA, pH 8.0 (lysis buffer), containing 1 mM phenylmethylsulfonyl fluoride (PMSF) and 2 μL benzonase. The lysate was boiled for 20 min. Ammonium sulfate (360 mg/mL) was added to the supernatant and stirred at 4 °C for 15 min. After centrifugation at 4,000 rpm at 4 °C for 30 min (Eppendorf 5810R), the pellet was re-suspended in 25 mM Tris, pH 7.7 purification buffer. After re-suspension, the excess ammonium sulfate was removed by buffer exchanging the pellet in a Spectra/Por 3.5 kDa MWCO (VWR) dialysis tubing in 25 mM Tris buffer, pH 7.7 overnight with continuous stirring. The crude lysate solution was filtered through a 0.22 μM syringe filter and loaded onto a 6 mL ResourceTM Q column (GE HealthCare Life Sciences). The column was equilibrated with five column volumes (CV) of 25 mM Tris purification buffer (pH 7.7), then with five CV of 25 mM Tris and 1 M NaCl, pH 7.7 elution buffer, and finally with five CV of purification buffer. αS was eluted with a linear salt gradient from 0% to 100% buffer. SDS-PAGE analysis of ResourceTM Q fractions was performed, Coomassie stained, and fractions enriched for αS were pooled. Fractions containing pure αS were collected, and aS was dialyzed extensively at 4 °C in 3 L 10 mM ammonium bicarbonate buffer, pH 7.3, with the buffer being changed at least three times. Aliquots were made of purified protein and lyophilized for long-term storage at −20 °C. The protein concentration was measured by UV-Vis spectrophotometry (Nanodrop Onec, Thermo Scientific, Madison, WI) at 280 nm, using an extinction coefficient of 5960 M−1 cm−1.
Aggregation assay.
To obtain a seedless, monomeric starting material, lyophilized αS was dissolved in 10 mM NaOH, sonicated for 15 min, and filtered through a 50 kDa MWCO Amicon filter unit (EMD Millipore) for 15 min at 14,000 rpm on a benchtop centrifuge (Eppendorf 5418, Hamburg, Germany). The flow-through was collected, and UV-Vis spectrophotometry was used to determine the concentration of αS at neutral pH. The aggregation assay was set up by diluting αS to a 90 µM final concentration into 100 mM sodium phosphate with 10 mM NaCl, and the pH was adjusted to 7.4. Multiple aliquots were set up in the absence or in the presence of 210 µM resveratrol, pipetting 45 µL of the respective solution into low binding Eppendorf tubes containing a 2 mm glass stir bead (VWR) in replicate and agitated at 37 °C, at continuous shaking at 300 rpm on an Eppendorf Thermomixer 5350 benchtop shaker (Hauppauge, NY). Vials were sealed with parafilm to minimize evaporation. Samples were withdrawn at 0, 0.1, 6, 22, 27, 32, 53, 72, 95, 120, and 171 h and allowed to equilibrate on ice for 5 min prior to pulsed labeling.
Mass Spectrometry Analysis.
A solution of 10 µM αS was reconstituted in 25 mM ammonium acetate (NH4OAC), pH 7.4 in the absence or presence of 23 µM resveratrol and filtered through an Amicon 50 kDa MWCO filter membrane (Millipore) for 15 min at 4 °C. Samples were incubated for several times in low binding Eppendorf tubes with a 2 mm glass bead on an orbital shaker at 300 rpm continuous agitation at 37 °C. A 10 µL aliquot was withdrawn and loaded into a commercial, borosilicate emitter (Thermo Fisher Scientific) that was introduced to a Bruker 12 T FT-ICR mass spectrometer (Bruker Daltonics, Bremen, Germany). The settings were: capillary exit: 240 V, deflector: 240 V, funnel: 150 V, skimmer: 10 V, funnel amplitude: 240 V, octapole: 5 mHz, RF amplitude: 300 Vpp, collision cell: −2 V, DC exact bias: 0.5 V, RF frequency: 2 MHz, collision RF amplitude: 1800 V, transfer optics time of flight: 0.800 ms, frequency: 4 MHz, dry gas: 1 L/min and dry temp: 100 °C. The data shown here are a sum of 128 scans. All spectra were plotted in Origin2016 (64-bit, Sr2, OriginLab Corporation).
HDX-MS.
Pulsed deuterium exchange was initiated by adding 10 µL 90 µM αS solution taken at various time points of the assay to 180 µL of D2O buffer for 1 min at 4 °C. Ice-cold reducing quenching buffer, 3 M urea with 1% trifluoroacetic acid (TFA), pH 2.5, was added to the solution at 1:1 (v/v) to stop the HDX. Samples were snap frozen and stored at −80 °C until analysis. Triplicate measurements were performed. Online pepsin digestion and HPLC separation were performed as previously described68. All αS protein samples were subjected to digestion on a custom-packed online pepsin column. The resulting peptides were trapped and desalted on a C8 trap column (Zorbax XDB, Agilent Inc., Santa Clara, CA). Separation of the peptide mixtures was carried out on a 1.9 µM reversed-phase C18 column (Hypersil Gold Thermo Fisher Scientific, Waltham, MA) with a 9.5 min linear gradient. Solvent A was water with 0.1% formic acid, and solvent B consisted of 80% acetonitrile with 0.1% formic acid. The gradient was set up for elution and re-equilibration as follows: 0.0 min 95% A and 5% B to 0.3 min 85% A and 15% B, ramped to 5.5 min 50% A and 50% B, from 6.0 min 100% B held to 7.5 min, and from 7.6 min 95% A and 5% B held to 9.5 min. All experiments were performed in triplicate (n = 3).
MS analysis of the eluted peptides was conducted on a LTQ-FTICR instrument (Thermo Scientific, Santa Clara, CA) using a positive–ion electrospray ionization (ESI) mode over the mass range of m/z 400–2000. The ESI spray voltage was maintained at 5 kV, the temperature at 275 °C, the capillary voltage at 38 V, the sheath gas flow rate at 10 L/min, and nebulizer gas flow rate at 8 L/min, respectively.
HDX–MS Data Analysis.
Identification of un-deuterated peptic peptides was achieved by tandem mass spectrometry mapping by using collision-induced dissociation (CID) fragmentation on the LTQ-FTICR (Thermo Scientific, Santa Clara, CA) instrument. Product-ion spectra were then analyzed in MassMatrix (version 2.4.2)97 for identification, and manually inspected. Search criteria included non-restricted, non-specific cleavage, min pp score: 5, min pp tag: 1.3, peptide tolerance: 10 ppm, MS/MS tolerance: 0.8 Da, decoy: reversed. For deuterated samples, all data were processed by HDX Workbench (Scripps Inst., Florida) to determine differential deuterium uptake by considering the centroids of isotopic profiles, where D2O dilution was taken into account. For envelopes with multimodal distributions, a custom-built program implemented in MathCAD (v14, Parametric Technology Corp., MA) was utilized to fit the HDX isotopic envelopes of peptide with two or three binomial distributions as appropriate. Isotopic clusters were confirmed by using the chemical composition of a peptide and calculating the probabilities of deuterium uptake of each given peptide, with exclusion of the first two amides and proline residues. After cluster selection, relative intensities were used for modeling to determine fractional species. Fractional species were expressed as follows:
All data were plotted with Prism 6 (GraphPad, La Jolla, CA) and Origin2016 (64-bit, Sr2, OriginLab Corporation). Statistical analysis of maximum factional species1 was performed by using one way-Anova with Sidak’s multiple comparisons test between selected pairs of peptides with or without resveratrol; n=3. Alpha was set at 0.05 to determine the level of significance.
Kinetic Modeling:
A six compartment (population) containing polymerization model (from M1-P1 to M6-P6) building on the on the kinetics described by Iljina et al.84. The kinetic model of aS aggregation in the presence of resveratrol has to include an additional Moff-Poff compartment.
Modeling of peptides 18–38 (3+) with three species appearing as trimodal clusters (Fig. S2) were modeled as two main species, where species1 was same as before and species2 was comprised of the sum of the two sub-species, species2i and species2, r to apply a uniform model based on the Occam Razor principle. The detailed description of modeling can be found in the SI Part 1 (Table SI1–3) and extended modeling in SI Part 2.
Circular dichroism.
An aliquot 10 µL incubated in the presence or absence of resveratrol was withdrawn at several time points, and 90 µL aggregation buffer was added to it, followed by monitoring secondary structure changes during fibrillization. All far-UV spectra were obtained on a J-715 instrument (JASCO Corp, Tokyo, Japan) in the range of 195 nm to 260 nm. Spectra were collected at scanning speed: 50 nm/min, in continuous mode, with a response time: of 1 s, bandwidth of 1 nm, with an accumulation of 7 spectra, using a quartz cuvette with a path length of 0.01 cm in 100 mM sodium phosphate with 10 mM NaCl, at 9 µM protein concentration. Buffer control was subtracted from each reading. Ellipticity was expressed as (degcm X 106)/(path length (cm) X concentration (µM) X number of peptide bonds).
Transmission electron microscopy.
Electron microscopy images were produced in the presence or absence of resveratrol. 10 μL of the aggregation products were deposited on 200-mesh copper grids (Ted Pella) for 30 s, followed by two rounds of washing with 10 μL deionized H2O for 30 s. Thereafter, 10 μL of 4% uranyl acetate stain was loaded onto the film for 30 s. Excess liquid was wicked off using a Chem Wipe, and the grids were allowed to air-dry under a fume hood. Images were taken by a FEI Tecnai G2 Spirit microscope with a LaB6 filament operating at 120 V (Thermo Fisher Scientific, Hillsboro, Oregon).
Supplementary Material
Acknowledgements
We thank Professor Jan Bieschke, formerly of WU, for providing materials for and access to recombinant protein expression and purification and Professor Carl Frieden for access to circular dichroism. We are grateful to Dr Weidong Cui for FT-ICR training and Dr Henry Rohrs for help with HDX-MS instrumentation. We also acknowledge the Nano Research Facility at Washington University in St Louis for access to TEM. We thank the American Parkinson’s Disease Association and the NIH (Grants P41GM103422 and R24GM136766) for funding.
Footnotes
Conflicts of interest
M.L.G. is an unpaid member of the science advisory boards of Protein Metrics and Gen Next, two companies interested in developing tools for protein footprinting.
SI contents
Extended methods – αS modeling in Part 1 and extended modeling in Part 2; Table SI1. Signal Table; Table SI2. Reactions occurring that are considered in the employed kinetic model; Table SI3. List of Rx# whose rate constants are searched as independent variables; Figure S1. HDX-MS exchange pattern of peptide 5–17 (2+); Figure S2. HDX-MS exchange pattern of peptide 18–38 (3+); Figure S3. Mass spectra of αS with or without resveratrol under native-like conditions; Figure S4. HDX-MS exchange pattern of peptide 39–54 (2+); Figure S5. HDX-MS exchange pattern of peptide 77–89 (2+); Figure S6. Fractional species of all seven peptides and associated kinetic modeling; Figure S7. HDX-MS exchange pattern of peptide 132–140 (2+); Figure S8. Pairwise comparison of species1. Table SI5. Signal Table; Table SI6 Reactions considered in the employed kinetic model; Figure S9. Average total signal; Figure S10. Grouped peptide total signals; Figure S11. Signals with relevant modeled components for non-resveratrol experiment; Figure S12. Signals with relevant modeled components for resveratrol experiment; Figure S13. CD spectra; Figure S14. TEM images; Figure S15 Mass spectra of resveratrol
References
- (1).Fink AL The Aggregation and Fibrillation of Alpha-Synuclein. Acc. Chem. Res 2006, 39 (9), 628–634. 10.1021/ar050073t. [DOI] [PubMed] [Google Scholar]
- (2).Kalia LV; Kalia SK; McLean PJ; Lozano AM; Lang AE Alpha-Synuclein Oligomers and Clinical Implications for Parkinson Disease. Ann. Neurol 2013, 73 (2), 155–169. 10.1002/ana.23746; 10.1002/ana.23746. [DOI] [PMC free article] [PubMed] [Google Scholar]
- (3).Spillantini MG; Schmidt ML; Lee VM; Trojanowski JQ; Jakes R; Goedert M Alpha-Synuclein in Lewy Bodies. Nature 1997, 388 (6645), 839–840. 10.1038/42166. [DOI] [PubMed] [Google Scholar]
- (4).Fields CR; Bengoa-Vergniory N; Wade-Martins R Targeting Alpha-Synuclein as a Therapy for Parkinson’s Disease. Front. Mol. Neurosci 2019, 12, 299. 10.3389/fnmol.2019.00299 [doi]. [DOI] [PMC free article] [PubMed] [Google Scholar]
- (5).Winner B; Jappelli R; Maji SK; Desplats PA; Boyer L; Aigner S; Hetzer C; Loher T; Vilar M; Campioni S; Tzitzilonis C; Soragni A; Jessberger S; Mira H; Consiglio A; Pham E; Masliah E; Gage FH; Riek R In Vivo Demonstration That Alpha-Synuclein Oligomers Are Toxic. Proc. Natl. Acad. Sci. U. S. A 2011, 108 (10), 4194–4199. 10.1073/pnas.1100976108; 10.1073/pnas.1100976108. [DOI] [PMC free article] [PubMed] [Google Scholar]
- (6).Martin ZS; Neugebauer V; Dineley KT; Kayed R; Zhang W; Reese LC; Taglialatela G Alpha-Synuclein Oligomers Oppose Long-Term Potentiation and Impair Memory through a Calcineurin-Dependent Mechanism: Relevance to Human Synucleopathic Diseases. J. Neurochem 2012, 120 (3), 440–452. 10.1111/j.1471-4159.2011.07576.x; 10.1111/j.1471-4159.2011.07576.x. [DOI] [PMC free article] [PubMed] [Google Scholar]
- (7).Kim HY; Cho MK; Kumar A; Maier E; Siebenhaar C; Becker S; Fernandez CO; Lashuel HA; Benz R; Lange A; Zweckstetter M Structural Properties of Pore-Forming Oligomers of Alpha-Synuclein. J. Am. Chem. Soc 2009, 131 (47), 17482–17489. 10.1021/ja9077599; 10.1021/ja9077599. [DOI] [PubMed] [Google Scholar]
- (8).Stockl MT; Zijlstra N; Subramaniam V Alpha-Synuclein Oligomers: An Amyloid Pore? Insights into Mechanisms of Alpha-Synuclein Oligomer-Lipid Interactions. Mol. Neurobiol 2013, 47 (2), 613–621. 10.1007/s12035-012-8331-4; 10.1007/s12035-012-8331-4. [DOI] [PubMed] [Google Scholar]
- (9).Wakabayashi K; Tanji K; Odagiri S; Miki Y; Mori F; Takahashi H The Lewy Body in Parkinson’s Disease and Related Neurodegenerative Disorders. Mol. Neurobiol 2013, 47 (2), 495–508. 10.1007/s12035-012-8280-y; 10.1007/s12035-012-8280-y. [DOI] [PubMed] [Google Scholar]
- (10).Breydo L; Wu JW; Uversky VN Alpha-Synuclein Misfolding and Parkinson’s Disease. Biochim. Biophys. Acta 2012, 1822 (2), 261–285. 10.1016/j.bbadis.2011.10.002. [DOI] [PubMed] [Google Scholar]
- (11).Uversky VN Alpha-Synuclein Misfolding and Neurodegenerative Diseases. Curr. Protein Pept. Sci 2008, 9 (5), 507–540. [DOI] [PubMed] [Google Scholar]
- (12).Houlden H; Singleton AB The Genetics and Neuropathology of Parkinson’s Disease. Acta Neuropathol. (Berl.) 2012, 124 (3), 325–338. 10.1007/s00401-012-1013-5; 10.1007/s00401-012-1013-5. [DOI] [PMC free article] [PubMed] [Google Scholar]
- (13).Wood-Kaczmar A; Gandhi S; Wood NW Understanding the Molecular Causes of Parkinson’s Disease. Trends Mol. Med 2006, 12 (11), 521–528. 10.1016/j.molmed.2006.09.007. [DOI] [PubMed] [Google Scholar]
- (14).Jomova K; Vondrakova D; Lawson M; Valko M Metals, Oxidative Stress and Neurodegenerative Disorders. Mol. Cell. Biochem 2010, 345 (1–2), 91–104. 10.1007/s11010-010-0563-x. [DOI] [PubMed] [Google Scholar]
- (15).Mullin S; Schapira A Alpha-Synuclein and Mitochondrial Dysfunction in Parkinson’s Disease. Mol. Neurobiol 2013, 47 (2), 587–597. 10.1007/s12035-013-8394-x; 10.1007/s12035-013-8394-x. [DOI] [PMC free article] [PubMed] [Google Scholar]
- (16).Esther S; Mandy K; A, E. A. N.; Alejandro M-C Cellular Regulation of Amyloid Formation in Aging and Disease. Front Neurosci 2017, 11, 64. [DOI] [PMC free article] [PubMed] [Google Scholar]
- (17).Flagmeier P; Meisl G; Vendruscolo M; Knowles TPJ; Dobson CM; Buell AK; Galvagnion C Mutations Associated with Familial Parkinson’s Disease Alter the Initiation and Amplification Steps of a-Synuclein Aggregation. Proc. Natl. Acad. Sci 2016, 113 (37), 10328–10333. 10.1073/pnas.1604645113. [DOI] [PMC free article] [PubMed] [Google Scholar]
- (18).Kim YS; Lim D; Kim JY; Kang SJ; Kim YH; Im H Beta-Sheet-Breaking Peptides Inhibit the Fibrillation of Human Alpha-Synuclein. Biochem. Biophys. Res. Commun 2009, 387 (4), 682–687. 10.1016/j.bbrc.2009.07.083 [doi]. [DOI] [PubMed] [Google Scholar]
- (19).Hinault MP; Cuendet AF; Mattoo RU; Mensi M; Dietler G; Lashuel HA; Goloubinoff P Stable Alpha-Synuclein Oligomers Strongly Inhibit Chaperone Activity of the Hsp70 System by Weak Interactions with J-Domain Co-Chaperones. J. Biol. Chem 2010, 285 (49), 38173–38182. 10.1074/jbc.M110.127753; 10.1074/jbc.M110.127753. [DOI] [PMC free article] [PubMed] [Google Scholar]
- (20).Iljina M; Hong L; Horrocks MH; Ludtmann MH; Choi ML; Hughes CD; Ruggeri FS; Guilliams T; Buell AK; Lee JE; Gandhi S; Lee SF; Bryant CE; Vendruscolo M; Knowles TPJ; Dobson CM; Genst ED; Klenerman D Nanobodies Raised against Monomeric A-Synuclein Inhibit Fibril Formation and Destabilize Toxic Oligomeric Species. BMC Biol 2017, 15 (1), 57-017-0390-0396. 10.1186/s12915-017-0390-6 [doi]. [DOI] [PMC free article] [PubMed] [Google Scholar]
- (21).Stefani M; Rigacci S Protein Folding and Aggregation into Amyloid: The Interference by Natural Phenolic Compounds. Int J Mol Sci 2013, 12, 12411–12457. [DOI] [PMC free article] [PubMed] [Google Scholar]
- (22).Sgarbossa A Natural Biomolecules and Protein Aggregation: Emerging Strategies against Amyloidogenesis. Int. J. Mol. Sci 2012, 13 (12), 17121–17137. 10.3390/ijms131217121 [doi]. [DOI] [PMC free article] [PubMed] [Google Scholar]
- (23).Ono K; Yamada M Antioxidant Compounds Have Potent Anti-Fibrillogenic and Fibril-Destabilizing Effects for Alpha-Synuclein Fibrils in Vitro. J. Neurochem 2006, 97 (1), 105–115. 10.1111/j.1471-4159.2006.03707.x. [DOI] [PubMed] [Google Scholar]
- (24).Bieschke J; Russ J; Friedrich RP; Ehrnhoefer DE; Wobst H; Neugebauer K; Wanker EE EGCG Remodels Mature Alpha-Synuclein and Amyloid-Beta Fibrils and Reduces Cellular Toxicity. Proc. Natl. Acad. Sci. U. S. A 2010, 107 (17), 7710–7715. 10.1073/pnas.0910723107 [doi]. [DOI] [PMC free article] [PubMed] [Google Scholar]
- (25).Xu Y; Zhang Y; Quan Z; Wong W; Guo J; Zhang R; Yang Q; Dai R; McGeer PL; Qing H Epigallocatechin Gallate (EGCG) Inhibits Alpha-Synuclein Aggregation: A Potential Agent for Parkinson’s Disease. Neurochem. Res 2016, 41 (10), 2788–2796. 10.1007/s11064-016-1995-9 [doi]. [DOI] [PubMed] [Google Scholar]
- (26).Singh PK; Kotia V; Ghosh D; Mohite GM; Kumar A; Maji SK Curcumin Modulates Alpha-Synuclein Aggregation and Toxicity. ACS Chem. Neurosci 2013, 4 (3), 393–407. 10.1021/cn3001203; 10.1021/cn3001203. [DOI] [PMC free article] [PubMed] [Google Scholar]
- (27).Takahashi R; Ono K; Takamura Y; Mizuguchi M; Ikeda T; Nishijo H; Yamada M Phenolic Compounds Prevent the Oligomerization of Alpha-Synuclein and Reduce Synaptic Toxicity. J. Neurochem 2015, 134 (5), 943–955. 10.1111/jnc.13180 [doi]. [DOI] [PubMed] [Google Scholar]
- (28).Liu Y; Carver JA; Calabrese AN; Pukala TL Gallic Acid Interacts with Alpha-Synuclein to Prevent the Structural Collapse Necessary for Its Aggregation. Biochim. Biophys. Acta 2014, 1844 (9), 1481–1485. 10.1016/j.bbapap.2014.04.013 [doi]. [DOI] [PubMed] [Google Scholar]
- (29).Ardah MT; Paleologou KE; Lv G; Khair SBA; Kazim AS; Minhas ST; Al-Tel TH; Al-Hayani AA; Haque ME; Eliezer D; El-Agnaf OM Structure Activity Relationship of Phenolic Acid Inhibitors of Alpha-Synuclein Fibril Formation and Toxicity. Front. Aging Neurosci 2014, 6, 197. 10.3389/fnagi.2014.00197 [doi]. [DOI] [PMC free article] [PubMed] [Google Scholar]
- (30).Martins GF; Nascimento C; Galamba N Mechanistic Insights into Polyphenols’ Aggregation Inhibition of α-Synuclein and Related Peptides. ACS Chem. Neurosci 2023, 14 (10), 1905–1920. 10.1021/acschemneuro.3c00162. [DOI] [PMC free article] [PubMed] [Google Scholar]
- (31).Zhu M; Rajamani S; Kaylor J; Han S; Zhou F; Fink AL The Flavonoid Baicalein Inhibits Fibrillation of Alpha-Synuclein and Disaggregates Existing Fibrils. J. Biol. Chem 2004, 279 (26), 26846–26857. 10.1074/jbc.M403129200. [DOI] [PubMed] [Google Scholar]
- (32).Zaidi FK; Deep S Scutellarin Inhibits the Uninduced and Metal-Induced Aggregation of a-Synuclein and Disaggregates Preformed Fibrils: Implications for Parkinson’s Disease. Biochem. J 2020. https://doi.org/BCJ20190705 [pii]. [DOI] [PubMed]
- (33).Shi J; He M; Cao J; Wang H; Ding J; Jiao Y; Li R; He J; Wang D; Wang Y The Comparative Analysis of the Potential Relationship between Resveratrol and Stilbene Synthase Gene Family in the Development Stages of Grapes (Vitis Quinquangularis and Vitis Vinifera). Plant Physiol. Biochem. PPB 2014, 74, 24–32. 10.1016/j.plaphy.2013.10.021 [doi]. [DOI] [PubMed] [Google Scholar]
- (34).Lyons MM; Yu C; Toma RB; Cho SY; Reiboldt W; Lee J; Breemen R. B. van. Resveratrol in Raw and Baked Blueberries and Bilberries. J. Agric. Food Chem 2003, 51 (20), 5867–5870. 10.1021/jf034150f [doi]. [DOI] [PubMed] [Google Scholar]
- (35).Lu Q; Zhao Q; Yu QW; Feng YQ Use of Pollen Solid-Phase Extraction for the Determination of Trans-Resveratrol in Peanut Oils. J. Agric. Food Chem 2015, 63 (19), 4771–4776. 10.1021/jf505938w [doi]. [DOI] [PubMed] [Google Scholar]
- (36).Ladiwala ARA; Lin JC; Bale SS; Marcelino-Cruz AM; Bhattacharya M; Dordick JS; Tessier PM Resveratrol Selectively Remodels Soluble Oligomers and Fibrils of Amyloid Aβ into Off-Pathway Conformers. J. Biol. Chem 2010, 285, 24228–24237. [DOI] [PMC free article] [PubMed] [Google Scholar]
- (37).Ge JF; Qiao JP; Qi CC; Wang CW; Zhou JN The Binding of Resveratrol to Monomer and Fibril Amyloid Beta. Neurochem. Int 2012, 61 (7), 1192–1201. 10.1016/j.neuint.2012.08.012 [doi]. [DOI] [PubMed] [Google Scholar]
- (38).Sanders HM; Jovcevski B; Marty MT; Pukala TL Structural and Mechanistic Insights into Amyloid-β and α-Synuclein Fibril Formation and Polyphenol Inhibitor Efficacy in Phospholipid Bilayers. FEBS J 2022, 289 (1), 215–230. 10.1111/febs.16122. [DOI] [PMC free article] [PubMed] [Google Scholar]
- (39).Feng Y; Wang XP; Yang SG; Wang YJ; Zhang X; Du XT; Sun XX; Zhao M; Huang L; Liu RT Resveratrol Inhibits Beta-Amyloid Oligomeric Cytotoxicity but Does Not Prevent Oligomer Formation. Neurotoxicology 2009, 30, 986–995. [DOI] [PubMed] [Google Scholar]
- (40).Umeda T; Sakai A; Shigemori K; Yokota A; Kumagai T; Tomiyama T Oligomer-Targeting Prevention of Neurodegenerative Dementia by Intranasal Rifampicin and Resveratrol Combination - A Preclinical Study in Model Mice. Front. Neurosci 2021, 15, 763476. 10.3389/fnins.2021.763476. [DOI] [PMC free article] [PubMed] [Google Scholar]
- (41).Turner RS; Thomas RG; Craft S; H, van DC; Mintzer J; Reynolds BA; Brewer JB; Rissman RA; Raman R; Aisen PS A randomized, double-blind, placebo-controlled trial of resveratrol for Alzheimer disease. Neurology, 2015, 85, 1383–1391. [DOI] [PMC free article] [PubMed] [Google Scholar]
- (42).Moussa C; Hebron M; Huang X; Ahn J; Rissman RA; Aisen PS; Turner RS Resveratrol regulates neuro-inflammation and induces adaptive immunity in Alzheimer’s disease. J. Neuroinflammation, 2017, 14, 1. [DOI] [PMC free article] [PubMed] [Google Scholar]
- (43).Tartaglia GG; Cavalli A; Pellarin R; Caflisch A The Role of Aromaticity, Exposed Surface, and Dipole Moment in Determining Protein Aggregation Rates. Protein Sci. Publ. Protein Soc 2004, 13 (7), 1939–1941. 10.1110/ps.04663504 [doi]. [DOI] [PMC free article] [PubMed] [Google Scholar]
- (44).Findeis MA Approaches to Discovery and Characterization of Inhibitors of Amyloid Beta-Peptide Polymerization. Biochim. Biophys. Acta 2000, 1502 (1), 76–84. https://doi.org/S0925-4439(00)00034-X [pii]. [DOI] [PubMed] [Google Scholar]
- (45).Richard T; Vitrac X; Merillon JM; Monti JP Role of Peptide Primary Sequence in Polyphenol-Protein Recognition: An Example with Neurotensin. Biochim. Biophys. Acta 2005, 1726 (3), 238–243. https://doi.org/S0304-4165(05)00299-0 [pii]. [DOI] [PubMed] [Google Scholar]
- (46).Akter R; Cao P; Noor H; Ridgway Z; Tu LH; Wang H; Wong AG; Zhang X; Abedini A; Schmidt AM; Raleigh DP Islet Amyloid Polypeptide: Structure, Function, and Pathophysiology. J. Diabetes Res 2016, 2016, 2798269. 10.1155/2016/2798269 [doi]. [DOI] [PMC free article] [PubMed] [Google Scholar]
- (47).Tu L-H; M, L. Y.; G, A. W.; E, A. A.; E, S. R.; P, D. R. Mutational Analysis of the Ability of Resveratrol To Inhibit Amyloid Formation by Islet Amyloid Polypeptide: Critical Evaluation of the Importance of Aromatic–Inhibitor and Histidine–Inhibitor Interactions. Biochemistry 2015, 54, 666–676. [DOI] [PMC free article] [PubMed] [Google Scholar]
- (48).Wei L; Jiang P; Xu W; Li H; Zhang H; Yan L; Chan-Park MB; Liu XW; Tang K; Mu Y; Pervushin K The Molecular Basis of Distinct Aggregation Pathways of Islet Amyloid Polypeptide. J. Biol. Chem 2011, 286 (8), 6291–6300. 10.1074/jbc.M110.166678 [doi]. [DOI] [PMC free article] [PubMed] [Google Scholar]
- (49).Nedumpully-Govindan P; Kakinen A; Pilkington EH; Davis TP; Ke PC; Ding F Stabilizing Off-Pathway Oligomers by Polyphenol Nanoassemblies for IAPP Aggregation Inhibition. Sci. Rep 2016, 6, 19463. 10.1038/srep19463 [doi]. [DOI] [PMC free article] [PubMed] [Google Scholar]
- (50).Abedini A; P, D. R. A Critical Assessment of the Role of Helical Intermediates in Amyloid Formation by Natively Unfolded Proteins and Polypeptides. Protein Eng Sel 2009, 22, 453–459. [DOI] [PMC free article] [PubMed] [Google Scholar]
- (51).Benson MD Pathogenesis of Transthyretin Amyloidosis. Amyloid Int. J. Exp. Clin. Investig. Off. J. Int. Soc. Amyloidosis 2012, 19 Suppl 1, 14–15. 10.3109/13506129.2012.668501 [doi]. [DOI] [PubMed] [Google Scholar]
- (52).Klabunde T; Petrassi HM; Oza VB; Raman P; Kelly JW; Sacchettini JC Rational Design of Potent Human Transthyretin Amyloid Disease Inhibitors. Nat. Struct. Biol 2000, 7 (4), 312–321. 10.1038/74082 [doi]. [DOI] [PubMed] [Google Scholar]
- (53).Albani D; Polito L; Batelli S; Mauro SD; Fracasso C; Martelli G; Colombo L; Manzoni C; Salmona M; Caccia S; Negro A; Forloni G The SIRT1 Activator Resveratrol Protects SK-N-BE Cells from Oxidative Stress and against Toxicity Caused by Alpha-Synuclein or Amyloid-Beta (1–42) Peptide. J. Neurochem 2009, 110 (5), 1445–1456. 10.1111/j.1471-4159.2009.06228.x [doi]. [DOI] [PubMed] [Google Scholar]
- (54).Zhang L-F; Yu X-L; Ji M; Liu S-Y; Wu X-L; Wang Y-J; Liu R-T Resveratrol Alleviates Motor and Cognitive Deficits and Neuropathology in the A53T α-Synuclein Mouse Model of Parkinson’s Disease. Food Funct 2018, 9 (12), 6414–6426. 10.1039/c8fo00964c. [DOI] [PubMed] [Google Scholar]
- (55).Herva ME; Zibaee S; Fraser G; Barker RA; Goedert M; Spillantini MG Anti-Amyloid Compounds Inhibit Alpha-Synuclein Aggregation Induced by Protein Misfolding Cyclic Amplification (PMCA). J. Biol. Chem 2014, 289 (17), 11897–11905. 10.1074/jbc.M113.542340 [doi]. [DOI] [PMC free article] [PubMed] [Google Scholar]
- (56).Lendel C; Bertoncini CW; Cremades N; Waudby CA; Vendruscolo M; Dobson CM; Schenk D; Christodoulou J; Toth G On the Mechanism of Nonspecific Inhibitors of Protein Aggregation: Dissecting the Interactions of Alpha-Synuclein with Congo Red and Lacmoid. Biochemistry 2009, 48 (35), 8322–8334. 10.1021/bi901285x [doi]. [DOI] [PubMed] [Google Scholar]
- (57).Ahmed R; Huang J; Akimoto M; Shi T; Melacini G Atomic Resolution Map of Hierarchical Self-Assembly for an Amyloidogenic Protein Probed through Thermal (15)N-R(2) Correlation Matrices. J. Am. Chem. Soc 2021, 143 (12), 4668–4679. 10.1021/jacs.0c13289 [doi]. [DOI] [PubMed] [Google Scholar]
- (58).Munishkina LA; Fink AL Fluorescence as a Method to Reveal Structures and Membrane-Interactions of Amyloidogenic Proteins. Biochim. Biophys. Acta 2007, 1768 (8), 1862–1885. 10.1016/j.bbamem.2007.03.015. [DOI] [PubMed] [Google Scholar]
- (59).Cremades N; Cohen SI; Deas E; Abramov AY; Chen AY; Orte A; Sandal M; Clarke RW; Dunne P; Aprile FA; Bertoncini CW; Wood NW; Knowles TP; Dobson CM; Klenerman D Direct Observation of the Interconversion of Normal and Toxic Forms of Alpha-Synuclein. Cell 2012, 149 (5), 1048–1059. 10.1016/j.cell.2012.03.037. [DOI] [PMC free article] [PubMed] [Google Scholar]
- (60).Vilar M; Chou HT; Luhrs T; Maji SK; Riek-Loher D; Verel R; Manning G; Stahlberg H; Riek R The Fold of Alpha-Synuclein Fibrils. Proc. Natl. Acad. Sci. U. S. A 2008, 105 (25), 8637–8642. 10.1073/pnas.0712179105 [doi]. [DOI] [PMC free article] [PubMed] [Google Scholar]
- (61).Tuttle MD; Comellas G; Nieuwkoop AJ; Covell DJ; Berthold DA; Kloepper KD; Courtney JM; Kim JK; Barclay AM; Kendall A; Wan W; Stubbs G; Schwieters CD; Lee VMY; George JM; Rienstra CM Solid-State NMR Structure of a Pathogenic Fibril of Full-Length Human [Alpha]-Synuclein. Nat Struct Mol Biol 2016, 23, 5–409–415. [DOI] [PMC free article] [PubMed] [Google Scholar]
- (62).Orcellet ML; Fernandez CO Structures behind the Amyloid Aggregation of Alpha-Synuclein: An NMR Based Approach. Curr. Protein Pept. Sci 2011, 12 (3), 188–204. [DOI] [PubMed] [Google Scholar]
- (63).Zhang Y; Rempel DL; Zhang J; Sharma AK; Mirica LM; Gross ML Pulsed Hydrogen-Deuterium Exchange Mass Spectrometry Probes Conformational Changes in Amyloid Beta (Abeta) Peptide Aggregation. Proc. Natl. Acad. Sci. U. S. A 2013, 110 (36), 14604–14609. 10.1073/pnas.1309175110 [doi]. [DOI] [PMC free article] [PubMed] [Google Scholar]
- (64).Wang H; Shu Q; Rempel DL; Frieden C; Gross ML Continuous and Pulsed Hydrogen-Deuterium Exchange and Mass Spectrometry Characterize CsgE Oligomerization. Biochemistry 2015, 54 (42), 6475–6481. 10.1021/acs.biochem.5b00871 [doi]. [DOI] [PMC free article] [PubMed] [Google Scholar]
- (65).Moorthy BS; Ghomi HT; Lill MA; Topp EM Structural Transitions and Interactions in the Early Stages of Human Glucagon Amyloid Fibrillation. Biophys. J 2015, 108 (4), 937–948. 10.1016/j.bpj.2015.01.004 [doi]. [DOI] [PMC free article] [PubMed] [Google Scholar]
- (66).Mar CD; Greenbaum EA; Mayne L; Englander SW; Jr VLW Structure and Properties of Alpha-Synuclein and Other Amyloids Determined at the Amino Acid Level. Proc. Natl. Acad. Sci. U. S. A 2005, 102 (43), 15477–15482. https://doi.org/0507405102 [pii]. [DOI] [PMC free article] [PubMed] [Google Scholar]
- (67).Keppel TR; Howard BA; Weis DD Mapping Unstructured Regions and Synergistic Folding in Intrinsically Disordered Proteins with Amide H/D Exchange Mass Spectrometry. Biochemistry 2011, 50 (40), 8722–8732. 10.1021/bi200875p [doi]. [DOI] [PubMed] [Google Scholar]
- (68).Illes-Toth E; Rempel DL; Gross ML Pulsed Hydrogen-Deuterium Exchange Illuminates the Aggregation Kinetics of Alpha-Synuclein, the Causative Agent for Parkinson’s Disease. ACS Chem. Neurosci 2018, 9 (6), 1469–1476. 10.1021/acschemneuro.8b00052 [doi]. [DOI] [PMC free article] [PubMed] [Google Scholar]
- (69).Afitska K; Fucikova A; Shvadchak VV; Yushchenko DA α-Synuclein Aggregation at Low Concentrations. Biochim. Biophys. Acta BBA - Proteins Proteomics 2019, 1867 (7), 701–709. 10.1016/j.bbapap.2019.05.003. [DOI] [PubMed] [Google Scholar]
- (70).Stephens AD; Zacharopoulou M; Moons R; Fusco G; Seetaloo N; Chiki A; Woodhams PJ; Mela I; Lashuel HA; Phillips JJ; Simone AD; Sobott F; Schierle GSK Extent of N-Terminus Exposure of Monomeric Alpha-Synuclein Determines Its Aggregation Propensity. Nat. Commun 2020, 11 (1), 2820. 10.1038/s41467-020-16564-3. [DOI] [PMC free article] [PubMed] [Google Scholar]
- (71).Paslawski W; Mysling S; Thomsen K; Jorgensen TJ; Otzen DE Co-Existence of Two Different Alpha-Synuclein Oligomers with Different Core Structures Determined by Hydrogen/Deuterium Exchange Mass Spectrometry. Angew. Chem. Int. Edin Engl 2014, 53 (29), 7560–7563. 10.1002/anie.201400491 [doi]. [DOI] [PubMed] [Google Scholar]
- (72).Grønnemose AL; Østerlund EC; Otzen DE; Jørgensen TJD EGCG Has Dual and Opposing Effects on the N-Terminal Region of Self-Associating α-Synuclein Oligomers. J. Mol. Biol 2022, 434 (23), 167855. 10.1016/j.jmb.2022.167855. [DOI] [PubMed] [Google Scholar]
- (73).Bai Y; Englander JJ; Mayne L; Milne JS; Englander SW Thermodynamic Parameters from Hydrogen Exchange Measurements. Methods Enzymol 1995, 259, 344–356. https://doi.org/0076-6879(95)59051-X [pii]. [DOI] [PubMed] [Google Scholar]
- (74).Garai K; Frieden C Quantitative Analysis of the Time Course of Aβ Oligomerization and Subsequent Growth Steps Using Tetramethylrhodamine-Labeled Aβ. Proc. Natl. Acad. Sci. U. S. A 2013, 110 (9), 3321–3326. 10.1073/pnas.1222478110. [DOI] [PMC free article] [PubMed] [Google Scholar]
- (75).Li KS; Rempel DL; Gross ML Conformational-Sensitive Fast Photochemical Oxidation of Proteins and Mass Spectrometry Characterize Amyloid Beta 1–42 Aggregation. J. Am. Chem. Soc 2016, 138 (37), 12090–12098. 10.1021/jacs.6b07543 [doi]. [DOI] [PMC free article] [PubMed] [Google Scholar]
- (76).Gillam JE; MacPhee CE Modelling Amyloid Fibril Formation Kinetics: Mechanisms of Nucleation and Growth. J. Phys. Condens. Matter Inst. Phys. J 2013, 25 (37), 373101. 10.1088/0953-8984/25/37/373101. [DOI] [PubMed] [Google Scholar]
- (77).Alraawi Z; Banerjee N; Mohanty S; Kumar TKS Amyloidogenesis: What Do We Know So Far? Int. J. Mol. Sci 2022, 23 (22). 10.3390/ijms232213970. [DOI] [PMC free article] [PubMed] [Google Scholar]
- (78).Morris AM; Watzky MA; Agar JN; Finke RG Fitting Neurological Protein Aggregation Kinetic Data via a 2-Step, Minimal/”Ockham’s Razor” Model: The Finke-Watzky Mechanism of Nucleation Followed by Autocatalytic Surface Growth. Biochemistry 2008, 47 (8), 2413–2427. 10.1021/bi701899y [doi]. [DOI] [PubMed] [Google Scholar]
- (79).Cohen SIA; Vendruscolo M; Welland ME; Dobson CM; Terentjev EM; Knowles TPJ Nucleated Polymerization with Secondary Pathways. I. Time Evolution of the Principal Moments. J. Chem. Phys 2011, 135 (6), 065105. 10.1063/1.3608916. [DOI] [PMC free article] [PubMed] [Google Scholar]
- (80).Knowles TPJ; Waudby CA; Devlin GL; Cohen SIA; Aguzzi A; Vendruscolo M; Terentjev EM; Welland ME; Dobson CM An Analytical Solution to the Kinetics of Breakable Filament Assembly. Science 2009, 326 (5959), 1533–1537. 10.1126/science.1178250. [DOI] [PubMed] [Google Scholar]
- (81).Michaels TCT; Šarić A; Meisl G; Heller GT; Curk S; Arosio P; Linse S; Dobson CM; Vendruscolo M; Knowles TPJ Thermodynamic and Kinetic Design Principles for Amyloid-Aggregation Inhibitors. Proc. Natl. Acad. Sci. U. S. A 2020, 117 (39), 24251–24257. 10.1073/pnas.2006684117. [DOI] [PMC free article] [PubMed] [Google Scholar]
- (82).Cohen SI; Linse S; Luheshi LM; Hellstrand E; White DA; Rajah L; Otzen DE; Vendruscolo M; Dobson CM; Knowles TP Proliferation of Amyloid-Beta42 Aggregates Occurs through a Secondary Nucleation Mechanism. Proc. Natl. Acad. Sci. U. S. A 2013, 110 (24), 9758–9763. 10.1073/pnas.1218402110 [doi]. [DOI] [PMC free article] [PubMed] [Google Scholar]
- (83).Zurlo E; Kumar P; Meisl G; Dear AJ; Mondal D; Claessens MMAE; Knowles TPJ; Huber M In Situ Kinetic Measurements of α-Synuclein Aggregation Reveal Large Population of Short-Lived Oligomers. PloS One 2021, 16 (1), e0245548. 10.1371/journal.pone.0245548. [DOI] [PMC free article] [PubMed] [Google Scholar]
- (84).Iljina M; Garcia GA; Horrocks MH; Tosatto L; Choi ML; Ganzinger KA; Abramov AY; Gandhi S; Wood NW; Cremades N; Dobson CM; Knowles TP; Klenerman D Kinetic Model of the Aggregation of Alpha-Synuclein Provides Insights into Prion-like Spreading. Proc. Natl. Acad. Sci. U. S. A 2016, 113 (9), E1206–15. 10.1073/pnas.1524128113 [doi]. [DOI] [PMC free article] [PubMed] [Google Scholar]
- (85).Gaspar R; Meisl G; Buell AK; Young L; Kaminski CF; Knowles TPJ; Sparr E; Linse S Secondary Nucleation of Monomers on Fibril Surface Dominates α-Synuclein Aggregation and Provides Autocatalytic Amyloid Amplification. Q. Rev. Biophys 2017, 50, e6. 10.1017/S0033583516000172. [DOI] [PubMed] [Google Scholar]
- (86).Guttman M; Lee KK Isotope Labeling of Biomolecules: Structural Analysis of Viruses by HDX-MS. Methods Enzymol 2016, 566, 405–426. 10.1016/bs.mie.2015.05.021 [doi]. [DOI] [PMC free article] [PubMed] [Google Scholar]
- (87).Schopper S; Kahraman A; Leuenberger P; Feng Y; Piazza I; Müller O; Boersema PJ; Picotti P Measuring Protein Structural Changes on a Proteome-Wide Scale Using Limited Proteolysis-Coupled Mass Spectrometry. Nat. Protoc 2017, 12 (11), 2391–2410. 10.1038/nprot.2017.100. [DOI] [PubMed] [Google Scholar]
- (88).Lv Z; Krasnoslobodtsev AV; Zhang Y; Ysselstein D; Rochet J-C; Blanchard SC; Lyubchenko YL Direct Detection of α-Synuclein Dimerization Dynamics: Single-Molecule Fluorescence Analysis. Biophys. J 2015, 108 (8), 2038–2047. 10.1016/j.bpj.2015.03.010. [DOI] [PMC free article] [PubMed] [Google Scholar]
- (89).Zou Y; Qian Z; Gong Y; Tang Y; Wei G; Zhang Q Critical Nucleus of Greek-Key-like Core of α-Synuclein Protofibril and Its Disruption by Dopamine and Norepinephrine. Phys Chem Chem Phys 2020, 22 (1), 203–211. 10.1039/C9CP04610K. [DOI] [PubMed] [Google Scholar]
- (90).Wang G; Zhu L; Wu X; Qian Z Influence of Protonation on the Norepinephrine Inhibiting α-Synuclein 71–82 Oligomerization. J. Phys. Chem. B 2023, 127 (37), 7848–7857. 10.1021/acs.jpcb.3c03270. [DOI] [PubMed] [Google Scholar]
- (91).Silva CG; Monteiro J; Marques RR; Silva AM; Martinez C; Canle M; Faria JL Photochemical and Photocatalytic Degradation of Trans-Resveratrol. Photochem. Photobiol. Sci. Off. J. Eur. Photochem. Assoc. Eur. Soc. Photobiol 2013, 12 (4), 638–644. 10.1039/c2pp25239b [doi]. [DOI] [PubMed] [Google Scholar]
- (92).Chau E; Kim H; Shin J; Martinez A; Kim JR Inhibition of Alpha-Synuclein Aggregation by AM17, a Synthetic Resveratrol Derivative. Biochem. Biophys. Res. Commun 2021, 574, 85–90. 10.1016/j.bbrc.2021.08.049. [DOI] [PMC free article] [PubMed] [Google Scholar]
- (93).Wagner WJ; Gross ML Using Mass Spectrometry-Based Methods to Understand Amyloid Formation and Inhibition of Alpha-Synuclein and Amyloid Beta. Mass Spectrom. Rev. n/a (n/a) 10.1002/mas.21814. [DOI] [PMC free article] [PubMed]
- (94).Illes-Toth E; Meisl G; Rempel DL; Knowles TPJ; Gross ML Pulsed Hydrogen–Deuterium Exchange Reveals Altered Structures and Mechanisms in the Aggregation of Familial Alzheimer’s Disease Mutants. ACS Chem. Neurosci 2021, 12 (11), 1972–1982. 10.1021/acschemneuro.1c00072. [DOI] [PMC free article] [PubMed] [Google Scholar]
- (95).Guo C; Yin J; Chen D Co-Encapsulation of Curcumin and Resveratrol into Novel Nutraceutical Hyalurosomes Nano-Food Delivery System Based on Oligo-Hyaluronic Acid-Curcumin Polymer. Carbohydr. Polym 2018, 181, 1033–1037. https://doi.org/S0144-8617(17)31332-2 [pii]. [DOI] [PubMed] [Google Scholar]
- (96).Neves AR; Queiroz JF; Reis S Brain-Targeted Delivery of Resveratrol Using Solid Lipid Nanoparticles Functionalized with Apolipoprotein E. J Nanobiotechnology 2016, 14, 27. [DOI] [PMC free article] [PubMed] [Google Scholar]
- (97).Xu H; Freitas MA MassMatrix: A Database Search Program for Rapid Characterization of Proteins and Peptides from Tandem Mass Spectrometry Data. Proteomics 2009, 9 (6), 1548–1555. 10.1002/pmic.200700322 [doi]. [DOI] [PMC free article] [PubMed] [Google Scholar]
Associated Data
This section collects any data citations, data availability statements, or supplementary materials included in this article.