

Abstract
The MHC class I (MHC-I) molecule H-2Dk conveys resistance to acute murine cytomegalovirus (MCMV) infection in both C57L (H-2Dk transgenic) and MA/My mice. M.H2k/b mice are MA/My background aside from a C57L-derived region spanning the MHC (Cmv5s), which diminishes this resistance and causes significant spleen histopathology. To hone in on the effector elements within the Cmv5s interval, we generated several Cmv5-recombinant congenic mouse strains and screened them in vivo, allowing us to narrow the phenotype-associated interval more than 6 times and segment the genetic mechanism to at least 2 independent loci within the MHC region. In addition, we sought to further characterize the Cmv5s-associated phenotypes in their temporal appearance and potential direct relation to viral load. To this end, we found that Cmv5s histopathology and NK cell activation could not be fully mirrored in the MA/My mice with increased viral dose, and that marginal zone destruction was the first apparent Cmv5s phenotype, being reliably quantified as early as 2 days post infection (dpi) in the M.H2k/b mice, prior to divergence in viral load, weight loss, or NK cell phenotype. Finally, we further dissect NK cell involvement, finding no intrinsic differences in NK cell function, despite increased upregulation of activation markers and checkpoint receptors. In conclusion, these data dissect the genetic and immunologic underpinnings of Cmv5 and reveal a model in which polymorphism within the MHC region of the genome leads to the development of tissue damage and corrupts protective NK cell immunity during acute viral infection.
Introduction.
Innate immunity to viral infection is a topic of high clinical relevance that is heavily influenced by the genetic makeup of the host, with the ability to predispose individuals to severe outcomes of infection (1). NK cells are important innate antiviral effector cells that use a balance of activating and inhibitory signals to distinguish healthy from infected or cancerous cells (2), and mount an immune response through direct cytotoxic activity and production of effector cytokines such as IFNγ (3). Interactions between inhibitory Ly49 receptors on NK cells and host cell MHC-I molecules contribute to NK cell-mediated antiviral immunity, preventing NK cells from mounting an autoimmune response, but also augmenting NK cell function in a process termed NK cell licensing (4–7). Licensed NK cells are tuned by this interaction to recognize and respond to instances of missing or altered “self” MHC-I expression, seen when cells become infected or cancerous (5, 8).
Murine cytomegalovirus (MCMV) has been used to study genetic regulation of NK cell-mediated immunity, as NK cells are required for acute viral control (9–11), and different inbred mouse strains vary in levels of resistance or susceptibility to the virus (11, 12). Much of this variability in response is due to the highly polymorphic MHC and Natural Killer Gene Complex (NKC) genetic regions (12, 13), encoding MHC-I molecules and Ly49 receptors, respectively. MA/My and C57L mice have Nkc-Ly49 haplotypes that are very similar (14), however MA/My (H-2k) mice are much more resistant to MCMV infection than C57L (H-2b) mice (11). Previous work identified MHC-I molecule H-2Dk in MA/My mice, which interacts with inhibitory Ly49G2 receptor on NK cells to mediate protection against MCMV infection (6, 15, 16). These Ly49G2+ NK cells licensed on H-2Dk show substantial expansion with increased activation and effector function during acute MCMV infection in vivo compared to Ly49G2− counterparts (6, 15). Importantly, this protection mediated by Ly49G2+ NK cells can be transferred to C57L mice with genetic addition of the H-2Dk molecule (16).
The MHC region of the genome itself is over 3-Megabases (Mb) in size and contains more than 150 protein-coding genes, including host MHC-I and MHC class II (MHC-II) molecules (17, 18). While many diseases are associated with polymorphisms in the MHC region, very few of these diseases can be fully traced to any one gene variant or protein polymorphism (19), suggesting that interactions between MHC-linked genes may be an important yet poorly understood determinant of disease pathology. In line with this idea, we identified a C57L-derived, MHC-linked Quantitative Trait Locus (QTL) that significantly diminishes resistance to MCMV infection and causes substantial splenic tissue damage in MA/My background mice (20, 21) despite the presence of the protective H-2Dk-Ly49G2 pair. This QTL-containing genetic interval is referred to as Cmv5, whereas the C57L-derived allele that conveys MCMV susceptibility and tissue damage is referred to as Cmv5s, initially described at approximately 23-Mb in size (20–22) (Supplemental Table S1). As mice homozygous for the Cmv5s interval do not express H-2Dk, to better understand how Cmv5s corrupts this otherwise protective H-2Dk-driven response, we limited our analysis to Cmv5 heterozygous mice.
Since the publication of the original Cmv5s-bearing M.H2k/b mouse strain, we have substantially narrowed the size of the QTL interval and more rigorously defined the genetic boundaries and interval-associated phenotypes in several new Cmv5-recombinant congenic mouse strains. We discovered that at least two immune-modulatory loci within the region contribute to acute MCMV susceptibility and tissue damage in Cmv5s mice. Additionally, we have separated the tissue damage phenotype in the spleen from the increased viral load and provide evidence suggesting Cmv5s causes the development of an environment not conducive to effective NK cell antiviral immunity rather than causing an inherent defect in the NK cell’s ability to function.
Together this work sheds light on complex genetic networks within the MHC region that contribute to variation in susceptibility during acute viral infection via profound effects on the innate immune environment. These results and this model system together offer insight into how polymorphism within the MHC can mask the effects of known resistance factors in heterogeneous populations, and further characterization of these genetic networks serves to enhance not only our understanding of early immunity to viral infections, but also the predictive ability of genetic screening, offering the opportunity for more efficient and effective medical intervention.
Materials and Methods.
Animals.
The original Cmv5s (MA/My.C57L-H2k/b) strain was produced from MA/My × C57L F1 with selective back-crossing to MA/My (20). We have continued this backcrossing while screening offspring for recombination events using HRM-PCR (described below). Newly generated recombinant mice were then bred to MA/My parent strain, carried and used as the heterozygote (M.H2k/b). Experimental groups use littermates and/or non-cohoused mice, as available. Individual experiments with controls are sex matched for either males or females of a similar age. Results have been pooled regardless of age/sex as we did not note significant differences in our phenotypes by these metrics. Experimental mice were bred and maintained in-house at UVA. All mouse experiments were performed in accordance with the Animal Welfare Act and approved by the UVA Animal Care and Use Committee.
Cmv5-Recombinant Animal Nomenclature.
All of the newly generated Cmv5-recombinant mice were derived from the MA/My.C57L-H2k/b parent strain, and long-form names would be as such: MA/My.C57L-H2k/b-RX, where X is the number for the identified recombinant. However, as most recombinants are no longer heterozygous for the entire H2 region (H2k/b), we refer to them as being heterozygous for the new recombinant interval more specifically in the format of M.RXk/b.
Genotyping by HRM-PCR.
DNA was isolated from toe and/or tail clips from pre-weanling pups. PCR was run using the Promega GoTaq® kit (Cat. M3008) reagents, dNTPs purchased from Genesee Scientific (Cat. 42–410), EvaGreen® dye purchased from Biotium (Cat. 31000), and appropriate primers from IDT Technologies. Recombinant offspring were screened using both inner boundary primers (See Supplemental Table S1) designed based on published whole exome sequence data (22). Primers used for genotyping formatted as Gene (Forward; Reverse): Glo1 (CTG CTA TGA AGT TCT CGC TC; CTG CTA TGA AGT TCT CGC TC), Notch3 (CAT TGT GTA GGC ACT GAA CG; GTG AGA TCA ATG AGG ACG AC), Wiz (CGT CTT GAA GTC AGG AAG CT; CAC CCA TCA ACA TCC TGC AA), Cyp4f13 (AAC ACA TCT GGG CCA TGA CT; AGC AAT GAA GTT CGG GTG GA), Wdr46 (CTT GAG CAG CAG CAG CAG AAG; CTA AGG GTC AAC TTG GAG AC), Tap1 (GCT GGA GTT TGC AAG TGA TG; CTG CTG GGT TCT TCA GGA AA), Btnl1 (GGA CCT GAG AAT GAT GGG AT; CAA CTC AGA GGA GGA CAG TA), Ly6g6e (TGA GCA GGA CCT ATG CAA TG; GGC TAG AGG AAG TCA TGT AC), Ltb (GGC TCA GAA AAG ACT GGA TG; GAA GCA TTG GAT CTC TGA GG), Ppp1r18 (ATC GCT TGT CCC AGA TGC CA; CGA TTC TGA TGT ACT GGT CC), H2-T3 (TCT CAC ACC ATC CAG GTG ATG; TGC TGC TGT CCA CGT TTT CAG), Tbc1d5 (TGT TCA ACT GTA CCG GCA TGC; AAG GCA TCA TTT GCT GCA GC), Sgo1 (CAC AAA ATT CTC TTA CTG GG; TTC AAG ATA CCC TTG AAG AC).
In vivo MCMV Infections.
All mice were infected intraperitoneally with 2×10⁵ PFU, except for the specifically labeled Ultra-High Dose “UHD” mice in Figure 4, which received 6.5×10⁵ PFU. Smith strain MCMV was purchased from ATCC and passaged through Balb/c weanlings 4–5 times for salivary gland preparations used in experiments. Viral titers were determined using M2–10B4 cells.
Figure 4. Increased Viral Replication is Insufficient to Cause Cmv5s-like Tissue Damage and NK Cell Activation in MA/My Mice.
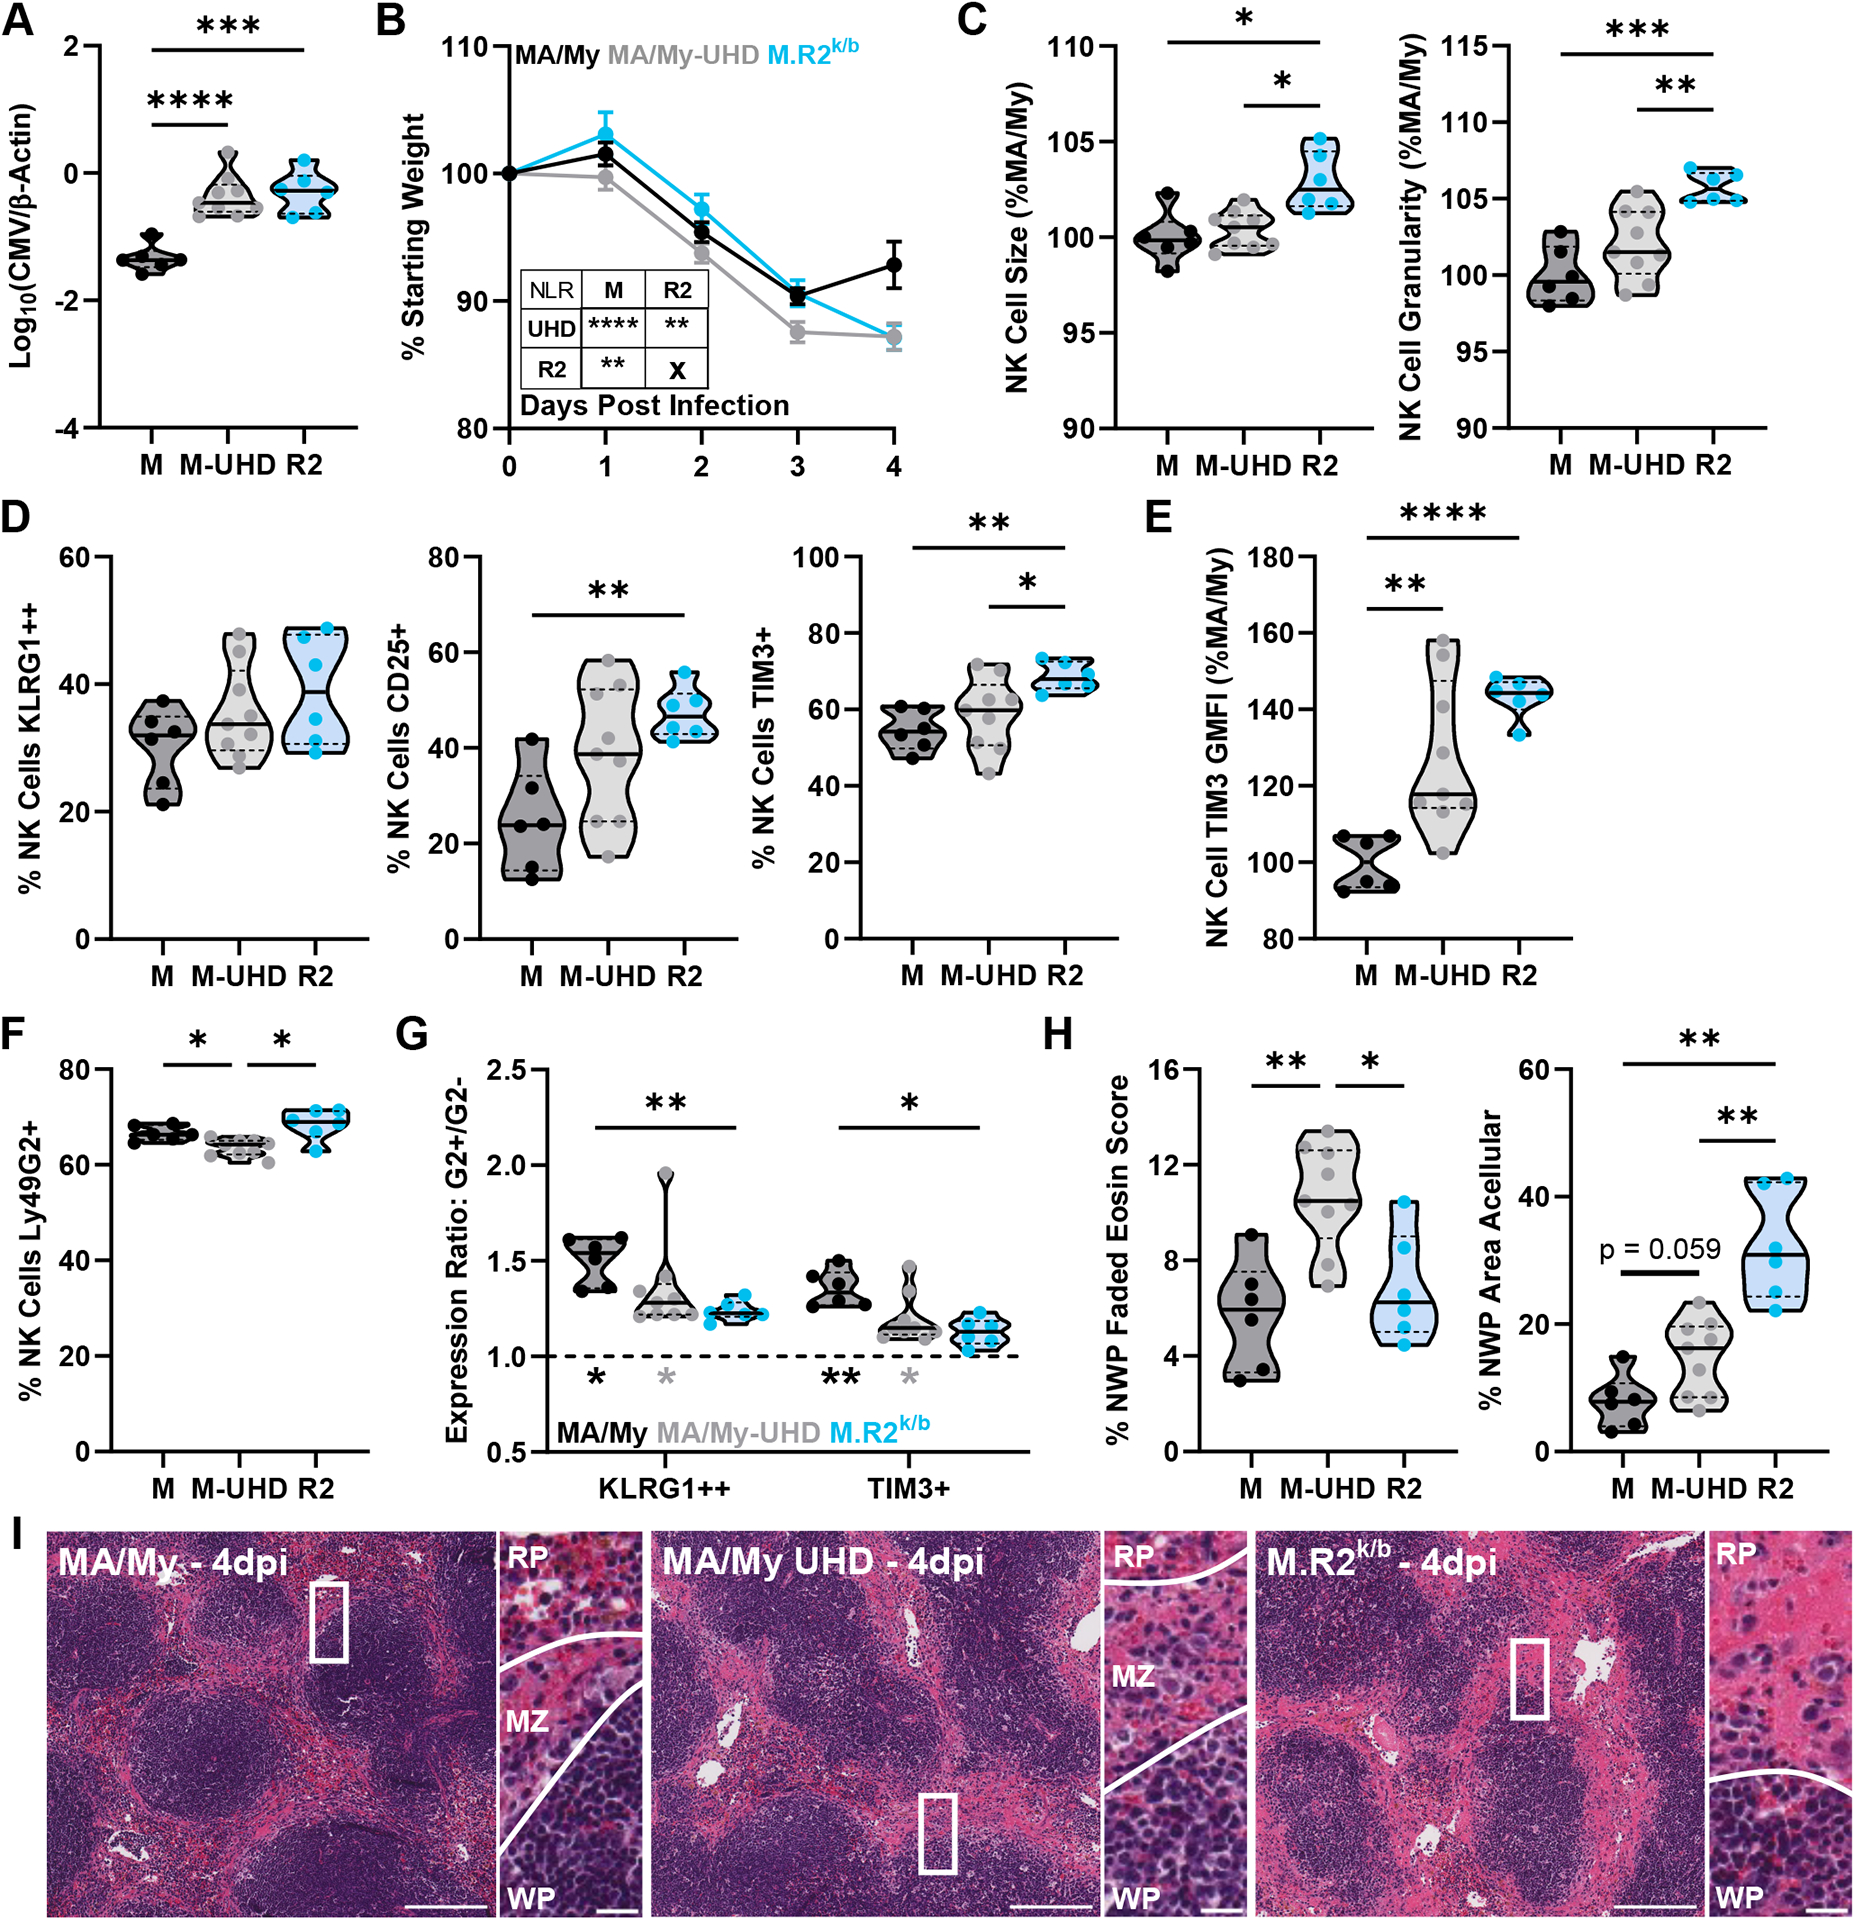
(A) Viral load by quantitative PCR from 4dpi spleen DNA. (B) Mouse weight loss during infection as % of starting weight, Error bars represent SEM. (C-G) Flow cytometry data from splenocytes harvested at 4dpi. (G) G2+/G2− expression ratio, top statistics indicate differences in ratios between groups, bottom statistics indicate differences between ratio and y = 1 (statistical differences between G2+ and G2− values). (H) Quantification of histology sections, NWP = non-white pulp. (I) Representative images of H&E-stained spleen sections at 4dpi with zoomed insert and lines highlighting borders between white pulp (WP)/marginal zone (MZ)/red pulp (RP) regions. Full image scale bar at 200 microns, insert scale bar at 20 microns. Violin plots depict median (solid line) and quartile (dashed line) values. Results are pooled from 2 individual experiments with total 6–9 mice per group (2–4 males, 3–5 females). See Figure S3 for details of data pooling and presentation. Statistical comparisons made using Brown-Forsythe and Welch ANOVA with Dunnett’s T3 multiple comparisons test (A, C-F, H), Ordinary 2-way ANOVA with Tukey’s multiple comparisons test (G), or non-linear (cubic) regression (NLR) with extra sum-of-squares F test (inset) (B). * p < 0.05, ** p < 0.01, *** p < 0.001, **** p < 0.0001.
Determination of Viral Load by qPCR.
Viral load was determined by spleen DNA qPCR from infected mice at indicated timepoints, normalized to control plasmids as described (23). PCR was run using the Promega GoTaq® kit (Cat. M3008) reagents, dNTPs purchased from Genesee Scientific (Cat. 42–410), SYBR® Green dye purchased from Invitrogen (Cat. S7563), Fluorescein purchased from BioRad (Cat. 1708780), and primers from IDT Technologies.
Flow Cytometry.
Antibodies and Reagents: CD19 (6D5), CD3 (17A2), CD8a (53-6.7), H-2Dk (15-5-5), H-2Kk (36-7-5), CD69 (H1.2F3), IFNγ (XMG1.2), KLRG1 (2F1), CD11b (M1/70), CD25 (PC61), TIGIT (1G9), LAG-3 (C9B7W), and Eomes (W17001A) were purchased from Biolegend; TIM-3 (5D12), CD3e (145-2C11), CD107a (1D4B), and Ly49G2 (4D11) were purchased from BD Biosciences; CD49b (DX5), NK1.1 (PK136), and CD11b (M1/70) were purchased from Invitrogen; CD25 (PC61.5) was purchased from eBioscience. Intracellular staining was performed using BD Biosciences Cytofix/CytoPerm™ kit (Cat. 554714). Cytometer: Samples were run on an Invitrogen Attune™ NxT flow cytometer with the Blue/Red/Violet6/Yellow configuration (Cat. A29004). Gating: pre-gating for all flow cytometry experiments is as follows: Singlets (FSC-H × FSC-A), Cells (FSC-A × SSC-A, debris exclusion), Live and Dump Negative (fixable viability dye negative, CD19-, exclusion of high SSC granulocytes). Cell types were defined after this base gating strategy: NK cells are CD3- and defined as positive for either NK1.1 or CD49b. In some experiments NK cells were further separated by their expression of Ly49G2. Due to the nature of pooled data, all Geometric Mean Fluorescent Intensity (GMFI) values were normalized to the mean of the MA/My population in that experiment prior to pooling. For splenocyte composition, data were gated on appropriate cells as described above and reported as % of the “Cells” gate.
In vitro NK Cell Stimulations.
NK cells were isolated from mechanically dissociated splenocyte suspensions using Miltenyi magnetic NK Cell Isolation Kit (Cat. 130-115-818). NK cells were stimulated for 4 hours at 37°C using plate-bound αNK1.1 (PK136, 10μg/mL), recombinant IL-12p70 (purchased from Peprotech - Cat. 210–12, 5ng/mL) with IL-18 (purchased from Biolegend - Cat. 767002, 50ng/mL), or PMA (purchased from Sigma Cat. 79346, 50ng/mL) and Ionomycin (purchased from Thermo Fisher - Cat. 124222, 1μg/mL). αNK1.1 (PK136, a gift from W. Yokoyama) was produced from hybridoma in-house.
Histology Tissue Preparation and Section Quantification.
Spleen sections were fixed at 4°C in 10% methanol-free formaldehyde prior to dehydration, paraffin embedding, slicing, and H&E staining by the UVA Research Histology Core. Stained slides were scanned using an Aperio ScanScope, and individual images were taken at 10x using Aperio ImageScope software version 12.4.3.5008. Images were analyzed using (Fiji Is Just) ImageJ 2.3.0. Details regarding the analysis of histology sections can be found at https://github.com/BrownLabCode/SpleenHistQuant.
Statistical Analysis.
Tests used to make statistical comparisons are noted in the figure legends. All statistical analysis was performed using GraphPad Prism software version 10.0.0/10.0.2.
Results.
M.H2k/b-R2 (M.R2k/b) Mice Bear Cmv5s MCMV Susceptibility and Spleen Tissue Damage.
Using data from our previously published full exome sequencing (22), we designed a panel of primers to distinguish between MA/My and C57L alleles for polymorphic genes throughout the Cmv5 interval. To hone in on the location of Cmv5s effectors, we further backcrossed M.H2k/b congenic mice to MA/My parent strain and screened offspring for Cmv5-region recombination events (Table S1). Using this method, we identified Cmv5-recombianant M.H2k/b-R2 mice, hereafter referred to as M.R2k/b, which are heterozygous for a 5.58-Mb C57L-derived region surrounding the MHC (Fig. 1A). In vivo screening for MCMV susceptibility identified these M.R2k/b mice as Cmv5s, displaying increased viral load (Fig. 1B) and weight loss (Fig. 1C) over MA/My counterparts by 4 days post infection (dpi). In addition to the increased weight loss seen at the 4dpi timepoint, M.R2k/b mice continued to lose weight after 3dpi, while the MA/My mice began to recover (Fig. 1C).
Figure 1. M.R2k/b Mice Bear Cmv5s MCMV Susceptibility and Spleen Tissue Damage.
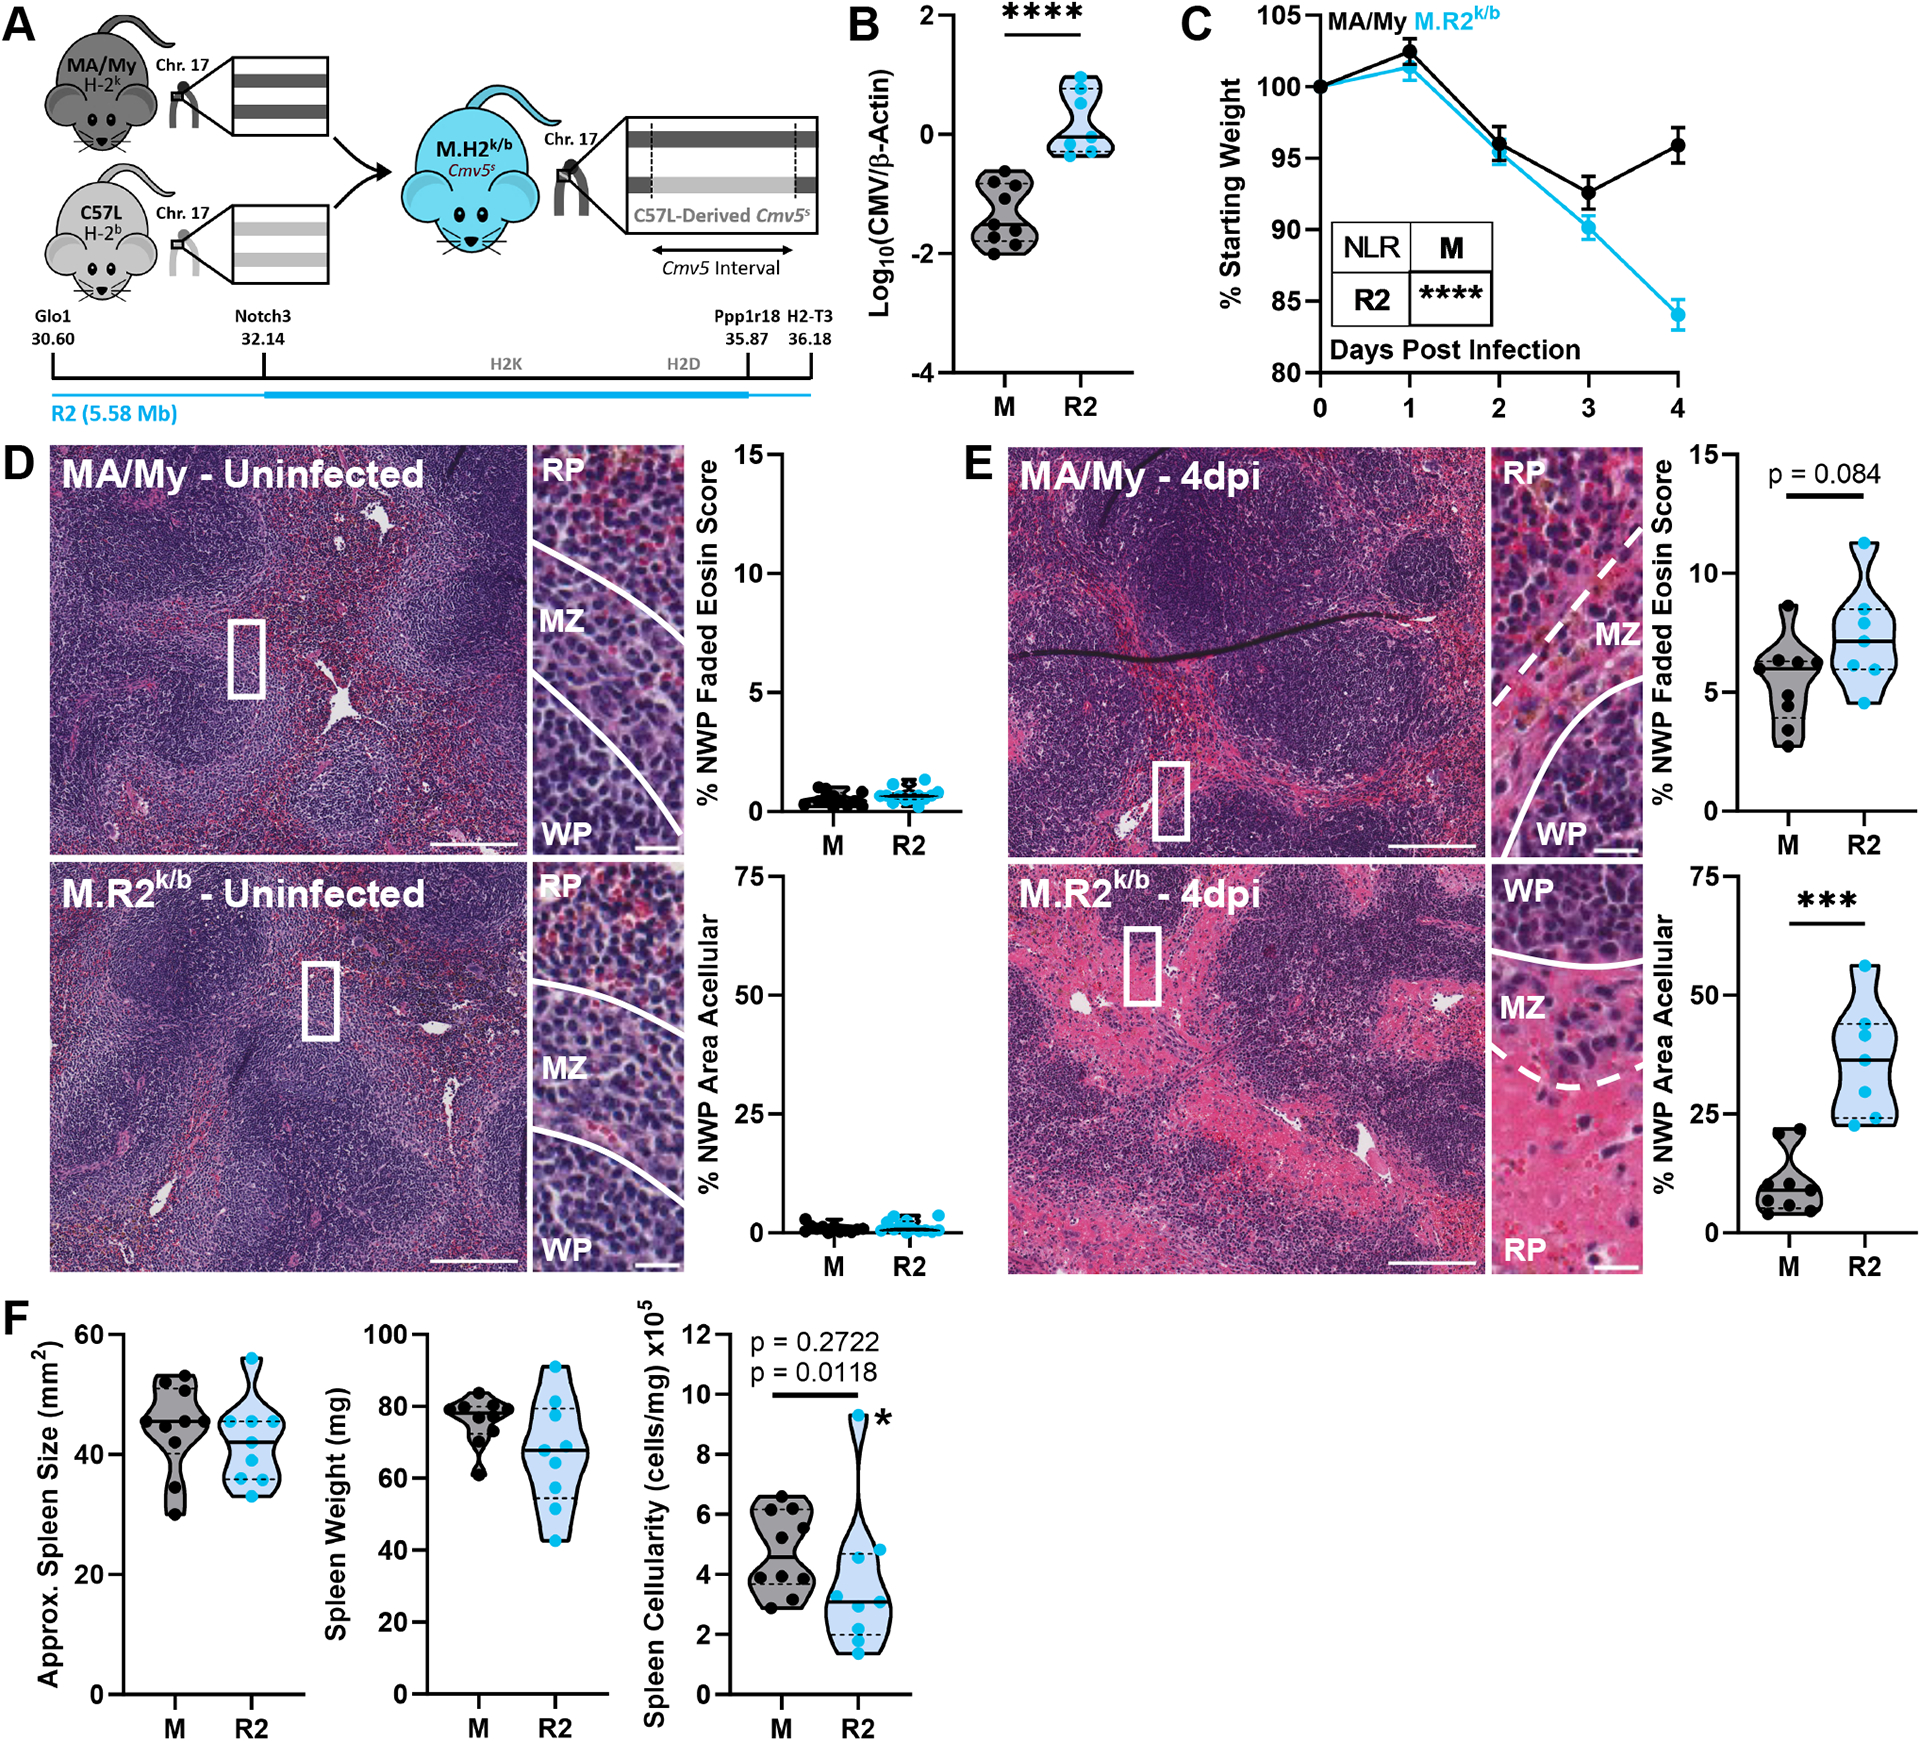
(A) Schematic depicting the genetic origins of the Cmv5 recombinant MA/My-congenic mouse with inside and outside border locations for the M.R2k/b (R2) recombinant interval (also see Table S1). (B) Viral load by quantitative PCR from 4dpi spleen DNA. (C) Mouse weight loss during infection as % of starting weight, Error bars represent SEM. Representative images of H&E-stained spleen sections with quantification (NWP = non-white pulp) from uninfected (D) or 4dpi (E) mice of indicated strains. Zoomed insert contains lines highlighting borders between white pulp (WP)/marginal zone (MZ)/red pulp (RP) regions. Full image scale bar at 200 microns, insert scale bar at 20 microns. (F) 4dpi approximate spleen size (area, trapezoid), weight, and cellularity as splenocytes/mg tissue. Datapoint marked by asterisk identified as outlier by Grubb’s outlier test with alpha < 0.05, top p-value listed includes this outlier while bottom p-value omits it. Violin plots depict median (solid line) and quartile (dashed line) values. (B, C, E) pooled from 2 independent experiments with total 7–9 mice per group (2–5 males, 4–5 females), (D) pooled from 4 independent experiments with total 12–13 mice per group (3 males, 9–10 females), (F) pooled from 2 independent experiments with total 9–10 mice per group (4–5 males, 5 females). Statistical comparisons made using unpaired Welch’s t-test (B, D-F). Weight loss curves (C) are assessed by non-linear (cubic) regression (NLR) with an extra sum of squares F-test (inset table). * p < 0.05, ** p < 0.01, *** p < 0.001, **** p < 0.0001.
M.H2k/b mice were additionally found to display a substantial level of tissue damage in the spleen by 4dpi (20). While uninfected spleens from Cmv5-disparate mice showed clear and cellular white pulp, marginal zone, and red pulp regions (Fig. 1D), infected spleens had less cellular marginal zones with abnormal cell morphology and ill-defined boundaries (Fig. 1E). In depth assessment of marginal zone histopathology revealed signs of necrosis (24) in both strains, including loss of cellular definition, nuclear swelling, and pale cytoplasmic eosin staining. Additional destruction of the red pulp in M.R2k/b mice was visually apparent by a striking loss of cellularity compared to MA/My (Fig. 1E). To better describe splenic damage in Cmv5s mice, we quantified the two most apparent aspects of the tissue disruption: marginal zone histopathology consistent with necrosis was quantified by using a faded eosin score (Fig. S1A), and red pulp destruction was quantified by acellular area. Using this analysis, we found no evidence of histopathology in Cmv5-disparate spleens prior to infection (Fig. 1D). However, by 4dpi both strains showed significant tissue remodeling, with increased red pulp acellularity evident in the M.R2k/b spleens (Fig. 1E). We did not see any differences in histology sections of other major organs at this timepoint (Fig. S1B). In line with evidence of increased histopathology in the spleen, we found no difference in approximate spleen area or weight, but a measurable loss of cellularity in the M.R2k/b spleens (Fig. 1F). Together this data identifies M.R2k/b mice as Cmv5s, displaying characteristic MCMV susceptibility and splenic damage, which is dissected and quantified in terms of marginal zone necrosis and red pulp cell loss.
Cmv5s NK Cells Upregulate Activation Markers and Checkpoint Receptors at 4 Days Post Infection.
As the importance of NK cells in early MCMV control has been established (9–11), we sought to assess NK cell populations in Cmv5-disparate spleens at 4dpi. While the percentage of NK cells in the splenocyte population was the same between strains (Fig. 2A), the loss of cellularity in M.R2k/b spleens resulted in an overall loss in NK cell numbers (Fig. 2B). Interestingly, the remaining NK cells were larger and more granular (Fig. 2C), consistent with increased activation (25). To better assess the state of NK cells, we employed the use of three activation markers: CD25, a component of the high-affinity IL-2 receptor used for NK cell expansion (26); KLRG1, a maturation marker that is further upregulated in NK cells upon activation during MCMV infection (27, 28); and Tim-3, an activation-induced checkpoint receptor (29). We found that at 4dpi, M.R2k/b NK cells had significantly increased expression of all three markers compared to their MA/My counterparts (Fig. 2D), demonstrating an increased state of activation.
Figure 2. Cmv5s NK Cells Upregulate Activation Markers and Checkpoint Receptors at 4dpi but are not Dysfunctional.
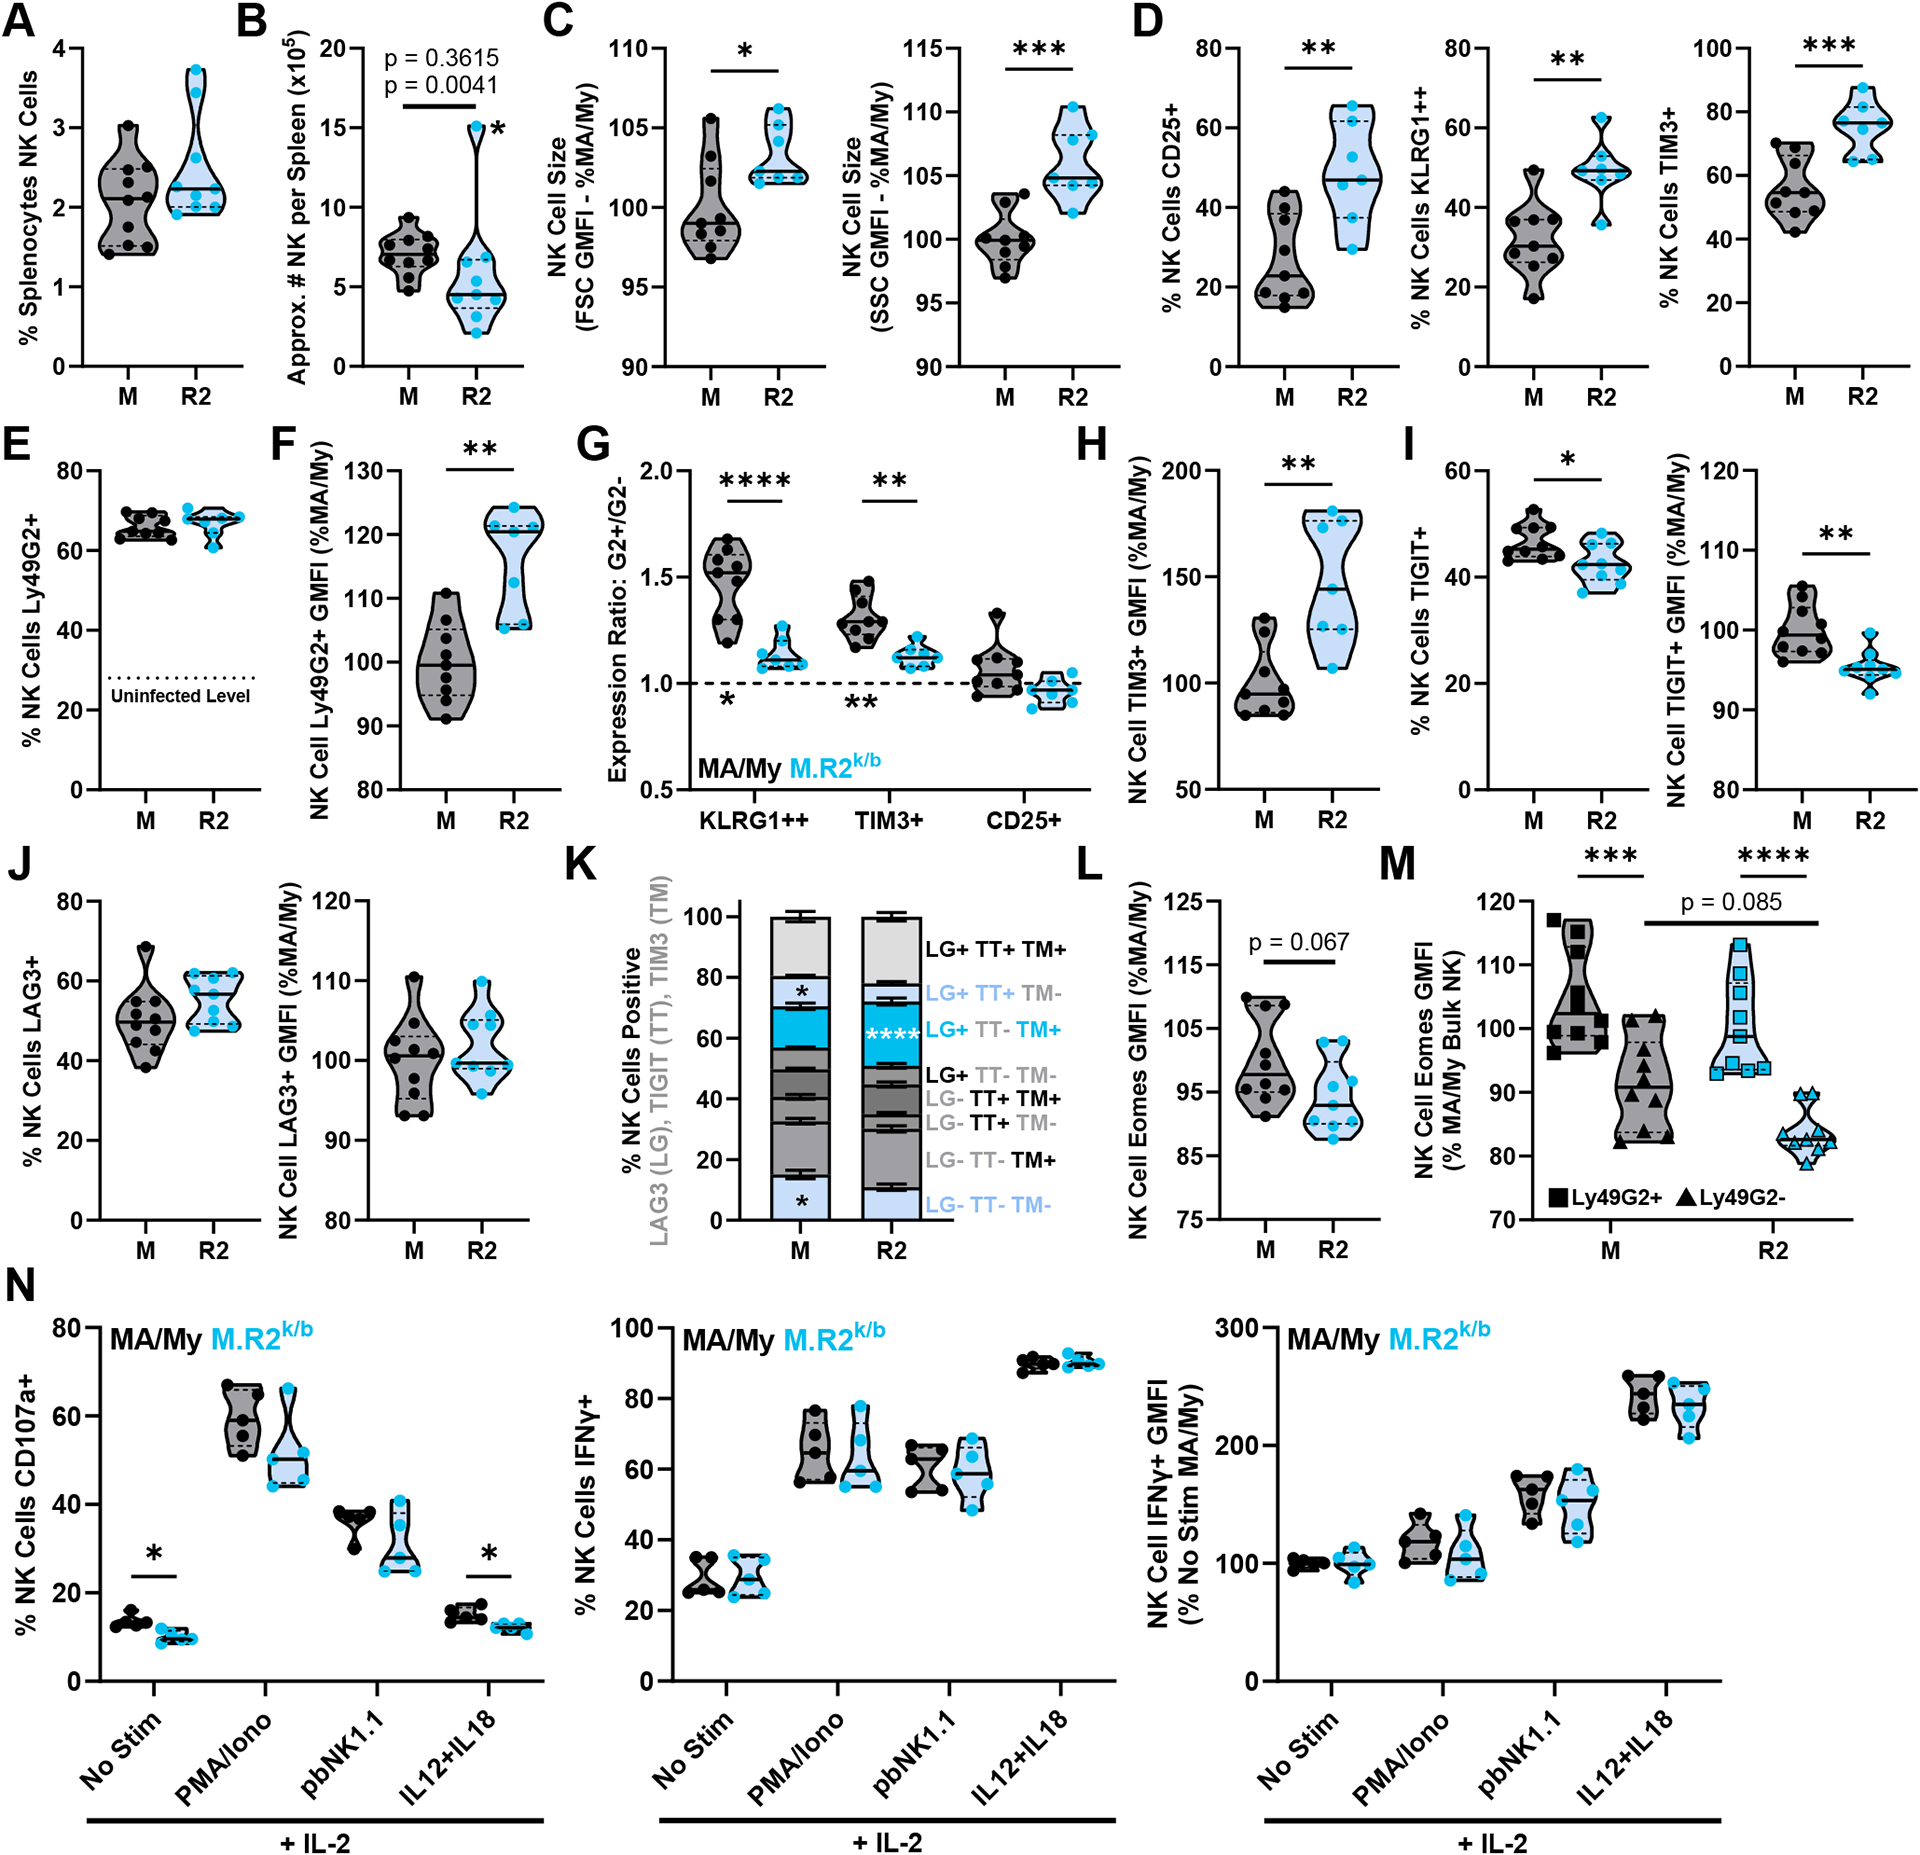
(A, C-M) Flow cytometry data from splenocytes harvested at 4dpi, pre-gated as described in methods on NK cells or NK cells further segmented by expression of Ly49G2. (B) Approximate number of NK cells per spleen was calculated using flow cytometry, cell count, and spleen weight data. Datapoint marked by asterisk identified as outlier by Grubb’s outlier test with alpha < 0.05, top p-value listed includes this outlier while bottom p-value omits it. (G) G2+/G2− expression ratio, top statistics indicate differences in ratios between groups, bottom statistics indicate differences between ratio and y = 1 (statistical differences between G2+ and G2− values). (K) Total NK cells divided by their expression of 3 assessed checkpoint molecules: LG = LAG-3, TT = TIGIT, TM = TIM-3. (N) NK cells isolated from 4dpi spleens were stimulated in vitro and assessed by flow cytometry for CD107a expression (degranulation) and production of IFNγ. Violin plots depict median (solid line) and quartile (dashed line) values. (A, C-H) pooled from 2 independent experiments with total 7–9 mice per group (2–5 males, 4–5 females). (B, I-M) pooled from 2 independent experiments with total 9–10 mice per group (4–5 males, 5 females). (N) representative experiment shown from a total of 2 independent experiments (5 females). Statistical comparisons made using unpaired Welch’s t-test (A-F, H-J, L), 2-way ANOVAs with Sidak’s multiple comparisons test (G, K, M), or multiple unpaired Welch’s t-tests with Holm-Sidak corrections for multiple comparisons (N). * p < 0.05, ** p < 0.01, *** p < 0.001, **** p < 0.0001.
H-2Dk confers MCMV resistance through licensed Ly49G2+ NK cells, which demonstrate increased proliferation and activation over Ly49G2− NK cells in the same animal (6, 15). While both MA/My and M.R2k/b mice express H-2Dk, M.R2k/b mice are heterozygous, which led us to hypothesize that Cmv5s might convey susceptibility to MCMV infection by interfering with the function of Ly49G2+ licensed NK cells. At 4dpi, both strains showed a robust and equivalent expansion of Ly49G2+ NK cells, composing significantly more of the NK cell pool compared to baseline (Fig. 2E). Ly49G2+ NK cells from M.R2k/b mice had higher Ly49G2 GMFI compared to MA/My NK cells (Fig. 2F), likely due to H-2Dk heterozygosity, in line with data for other Ly49/MHC-I pairs (30). Consistent with what we have seen in other models of H-2Dk-driven resistance (6), MA/My mice showed increased expression of activation markers in Ly49G2+ NK cells compared to their Ly49G2− counterparts, showing higher Ly49G2+/Ly49G2− expression ratios for KLRG1high and Tim-3 (Fig. 2G). Interestingly, these ratios were significantly diminished in M.R2k/b NK cells (Fig. 2G). These data suggest that Cmv5s may impede the ability of licensed Ly49G2+ NK cells to become activated to mediate antiviral immunity during MCMV infection.
Prior work has shown that Tim-3 is upregulated acutely on activated NK cells, functioning in an inhibitory manner designed to tamper potentially damaging immune activation (29), but build-up of high Tim-3 expression can be associated with dysfunctional NK cells (31). Not only did M.R2k/b mice have a higher frequency of NK cells expressing Tim-3 (Fig. 2D), they also had higher levels of Tim-3 expression (Fig. 2H). To better assess if M.R2k/b NK cells may be exhibiting a phenotype consistent with dysfunction in vivo, we looked at additional checkpoint receptors, Lag-3 and Tigit (32). We found that M.R2k/b NK cells showed decreased expression of Tigit (Fig. 2I), and comparable expression of Lag-3 to MA/My mice (Fig. 2J). Interestingly, M.R2k/b NK cells showed increased co-expression of Tim-3 and Lag-3, as well as an associated decrease in NK cells expressing none of the three assessed checkpoint markers (Fig. 2K). To better understand if these M.R2k/b NK cells may differ functionally, we assessed intracellular expression of Eomes, an important transcription factor for NK cell development and function whose downregulation has been associated with dysfunctional NK cells (33, 34). We found that Eomes expression in M.R2k/b NK cells trended lower than that seen in MA/My NK cells (Fig. 2L), and this reduced expression seemed to be driven almost entirely by the Ly49G2− NK cell population (Fig. 2M). This data showing increased upregulation of checkpoint receptors and downregulation of Eomes may suggest that M.R2k/b NK cells are dysfunctional (31–34). To test this, we isolated NK cells from 4dpi spleens and stimulated them in vitro. This assay revealed no differences in NK cell degranulation or IFN-γ production under basic stimulatory conditions (Fig. 2N). While CD107a values for the no stimulation and IL-12/IL-18 stimulation conditions did technically reach significance, the difference was minute (~3%) and inconsistent. M.R2k/b NK cells thus are not inherently dysfunctional at 4dpi, but the upregulation of checkpoint receptors suggests they may be more sensitive to inhibition by the in vivo environment.
MA/My and M.R2k/b NK Cells are Similar in Phenotype and Function at Baseline.
To determine if M.R2k/b NK cells display any intrinsic differences in phenotype or function when compared to MA/My, we assessed NK cells from uninfected mice. We found no differences in spleen size, weight, or cellularity prior to MCMV infection (Fig. 3A, 3B), nor were there any differences in the quantity of NK cells, NK cell morphology, or percent Ly49G2+ NK cells (Fig. 3C, 3D). Additionally, we saw no appreciable differences between strains in assessed markers of NK cell maturation (Fig. 3E). While NK cells from uninfected animals had minimal expression of activation markers and checkpoint receptors, there was a baseline expression of Tim-3 on ~6% of total NK cells (Fig. 3F), which was almost entirely localized to the Ly49G2− NK cell population (Fig. 3G). We additionally found that M.R2k/b NK cells may have lower expression of Eomes at baseline, and that expression of Eomes was higher in the Ly49G2+ NK cells (Fig. 3H, 3I). To test if the reduced expression of Eomes in M.R2k/b NK cells was associated with a reduced ability to exert effector functions, we stimulated NK cells from uninfected mice in vitro, finding no differences in degranulation or IFN-γ production between strains (Fig. 3J). Overall, these results show only minor differences in NK cell phenotype, and no differences in basic NK cell function, between MA/My and M.R2k/b mice at baseline.
Figure 3. MA/My and M.R2k/b NK Cells are Similar in Phenotype and Function at Baseline.
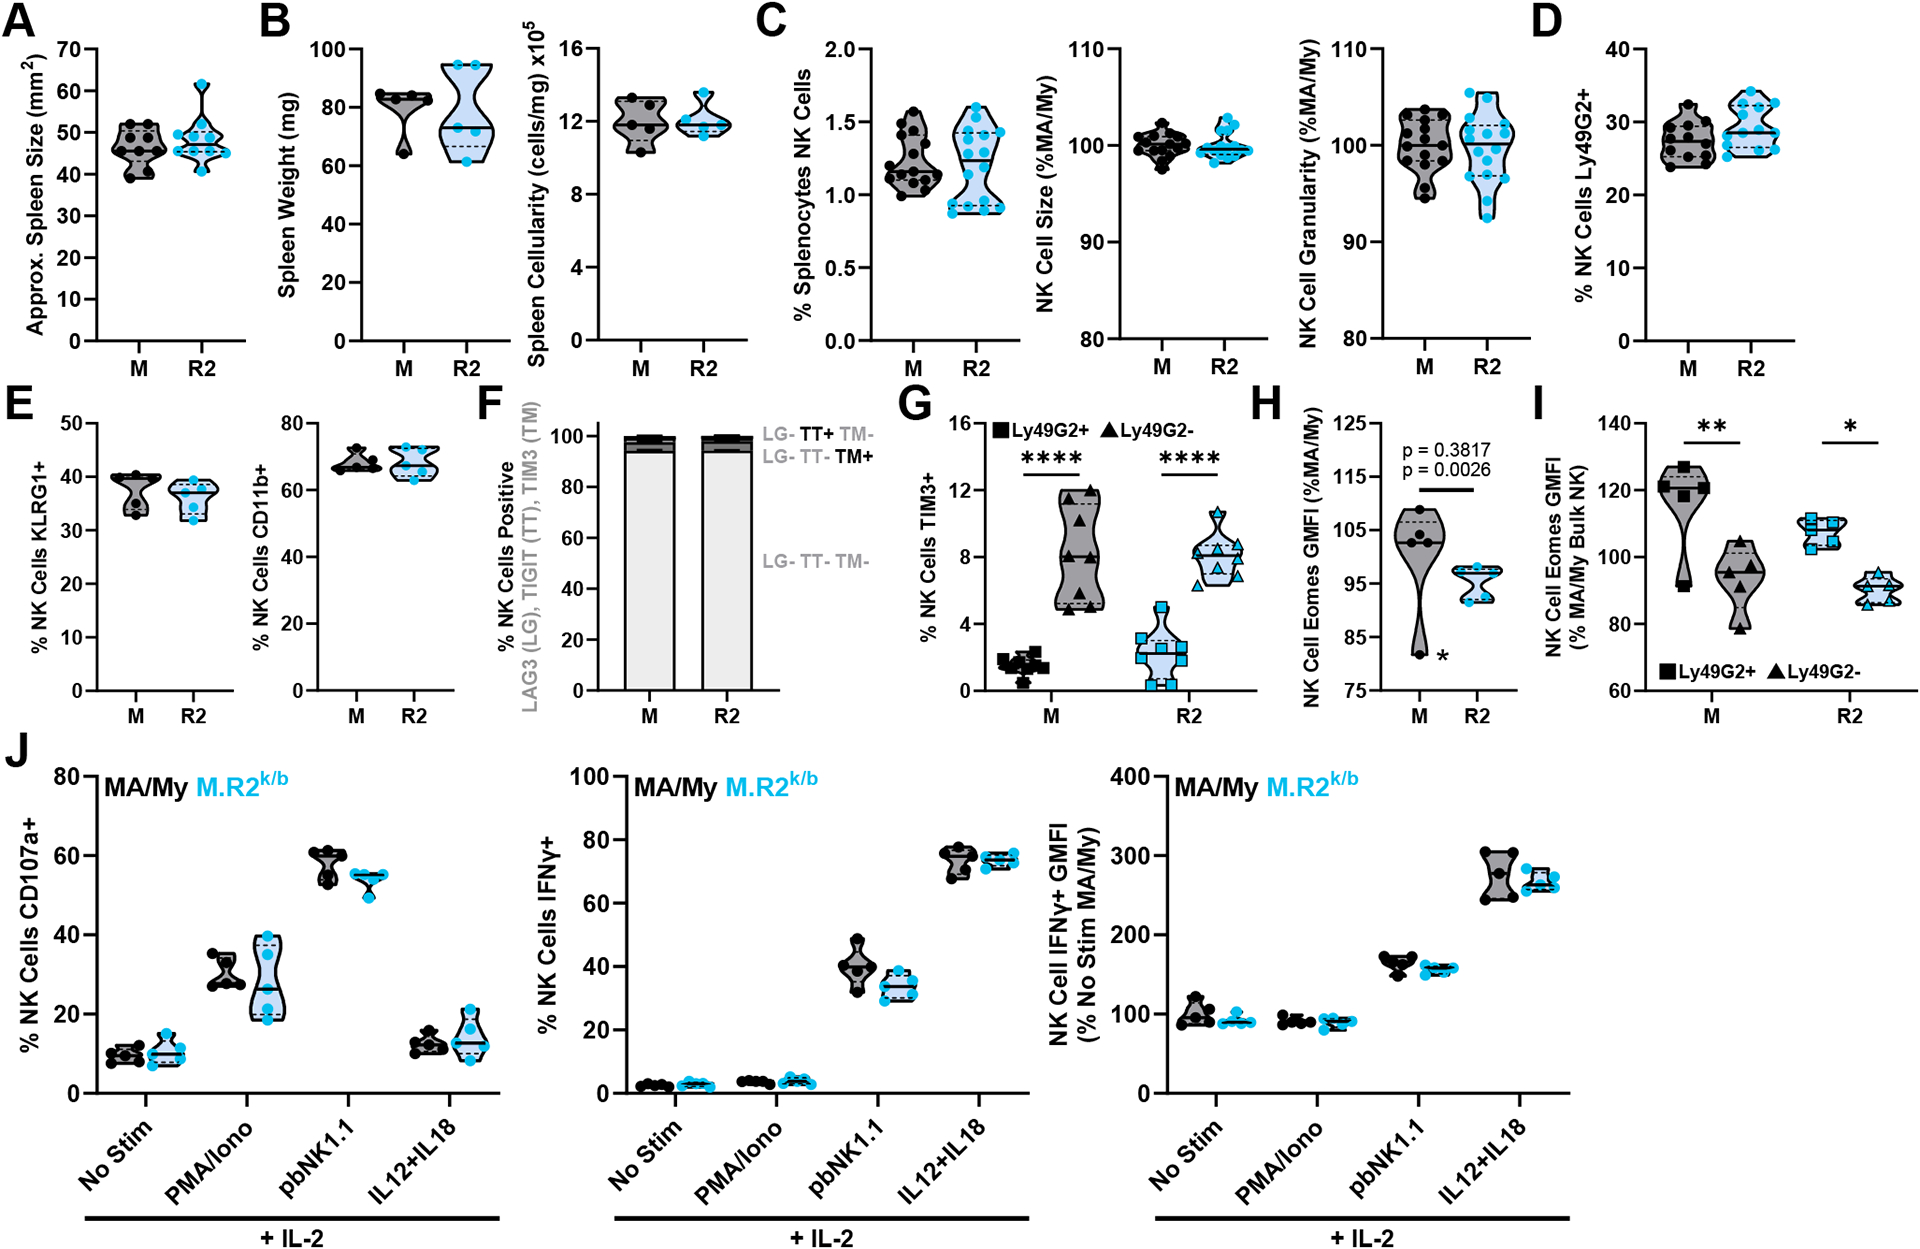
(A) Approximate spleen size (area, trapezoid), (B) weight and cellularity as splenocytes/mg tissue in uninfected mice of indicated strain. (C-I) Flow cytometry data of splenocytes harvested from uninfected mice. (H) Datapoint marked by asterisk identified as outlier by Grubb’s outlier test with alpha < 0.05, top p-value listed includes this outlier while bottom p-value omits it. (J) NK cells isolated from uninfected spleens were stimulated in vitro and assessed by flow cytometry for CD107a expression (degranulation) and production of IFNγ. Violin plots depict median (solid line) and quartile (dashed line) values. (A) pooled from 2 independent experiments with total 9–10 mice per group (9–10 females), (B, E, F, H, I, J) data from 1 independent experiment with 5 mice per group (5 females). (C) pooled from 4 independent experiments with total 15–16 mice per group (3 males, 12–13 females). (D) pooled from 3 independent experiments with total 12–13 mice per group (3 males, 9–10 females). (G) pooled from 2 independent experiments with total 8 mice per group (3 males, 5 females). Statistical comparisons are made using an unpaired Welch’s t-test (A-E, H), an ordinary 2-way ANOVA with Tukey’s (G, I) or Sidak’s (F) multiple comparisons test. (J) was assessed by multiple unpaired Welch’s t-tests with Holm-Sidak correction for multiple comparisons. * p < 0.05, ** p < 0.01, *** p < 0.001, **** p < 0.0001.
Increased Viral Replication is Insufficient to Cause Cmv5s-like Tissue Damage and NK Cell Activation in MA/My Mice.
MCMV enters the spleen at the marginal zone approximately 6–8 hours after systemic infection and progresses rapidly through the red pulp using stromal and myeloid populations as host cells (35–37). With this information we hypothesized that the Cmv5s-driven increase in viral load could be responsible for marginal zone and downstream red pulp tissue damage, as well as the increased NK cell activation phenotype. To test this, we increased the viral dose given to the MA/My mice (MA/My - Ultra High Dose (UHD)) to match the 4dpi viral load seen in the M.R2k/b counterparts given the standard dose (Fig. 4A). MA/My-UHD mice showed increased weight loss over both standard dose infected MA/My and M.R2k/b mice at 3dpi but did not continue to lose weight after 3dpi like the M.R2k/b animals. Non-linear regression confirmed unique fitted curves for each group (Fig. 4B). Thus, even with the increased viral load, MA/My weights began stabilizing by 4dpi. While MA/My-UHD NK cells appeared more activated than their standard dose-infected MA/My counterparts, they did not reach the levels of the M.R2k/b NK cells in morphology (Fig. 4C) or any of the assessed surface markers, with the possible exception of KLRG1high (Fig. 4D, 4E). Here our data suggests that the increased expression of NK cell activation markers CD25 and Tim-3 in M.R2k/b mice is at least in part due to a difference in the infected Cmv5s immune environment. While a slightly smaller population of MA/My-UHD NK cells displayed Ly49G2 in comparison to either strain given the standard dose-infection (Fig. 4F), Ly49G2+ NK cells were still selectively activated in the UHD setting (Fig. 4G). Turning to the spleen histology sections, we saw that MA/My-UHD mice displayed increased evidence of marginal zone necrosis over both standard dose-infected groups. However, this did not translate into the substantial cell loss seen at the marginal zone and throughout the red pulp in the standard dose-infected M.R2k/b spleens (Fig. 4H, 4I). This data suggests that the necrotic histopathology at the marginal zone may be driven by increased viral load, while Cmv5s-mediated cell loss occurs via a separate mechanism in the M.R2k/b spleen. Interestingly, necrosis at the marginal zone in MA/My-UHD spleen tissue was associated with inflammatory infiltrates, while the M.R2k/b mice showed a more progressed dissolution of the marginal zone structure. These results demonstrate that the increased viral load and marginal zone necrosis in MA/My-UHD mice is insufficient to drive the dramatic cell loss seen in M.R2k/b spleens.
Cmv5s Histopathology at the Marginal Zone Precedes Divergence in Viral Load and NK Cell Phenotype.
To better explore the idea of a temporal difference in the response to MCMV between Cmv5-disparate mice, and as a way to reveal the phenotypes more likely to be a direct result of the genetic mechanism of action, we assessed Cmv5s phenotypes at 2dpi, just prior to any evidence of divergence in weight loss (Fig. 1C). At this timepoint we found no discernable differences in spleen size, cellularity, or viral load between the strains (Fig. 5A, 5B). While we found a significant loss in the NK cell population from baseline (Fig. 5C; compare to Fig. 3C), an increase in the proportion of NK cells expressing Ly49G2 (Fig. 5D), and evidence of early NK cell activation (Fig. 5F, 5G); there was no difference between MA/My and M.R2k/b in any of the assessed metrics (Fig. 5E–5G). While there were no differences between strains, Ly49G2+ NK cells had surpassed Ly49G2− counterparts in expression of Tim-3 (Fig. 5H), providing evidence of specific activation. This data suggests that the initial process of NK cell activation and Ly49G2+ population expansion is separate from the differences in NK cell phenotype seen later during infection.
Figure 5. Cmv5s Histopathology at the Marginal Zone Precedes Divergence in Viral Load and NK Cell Activation.
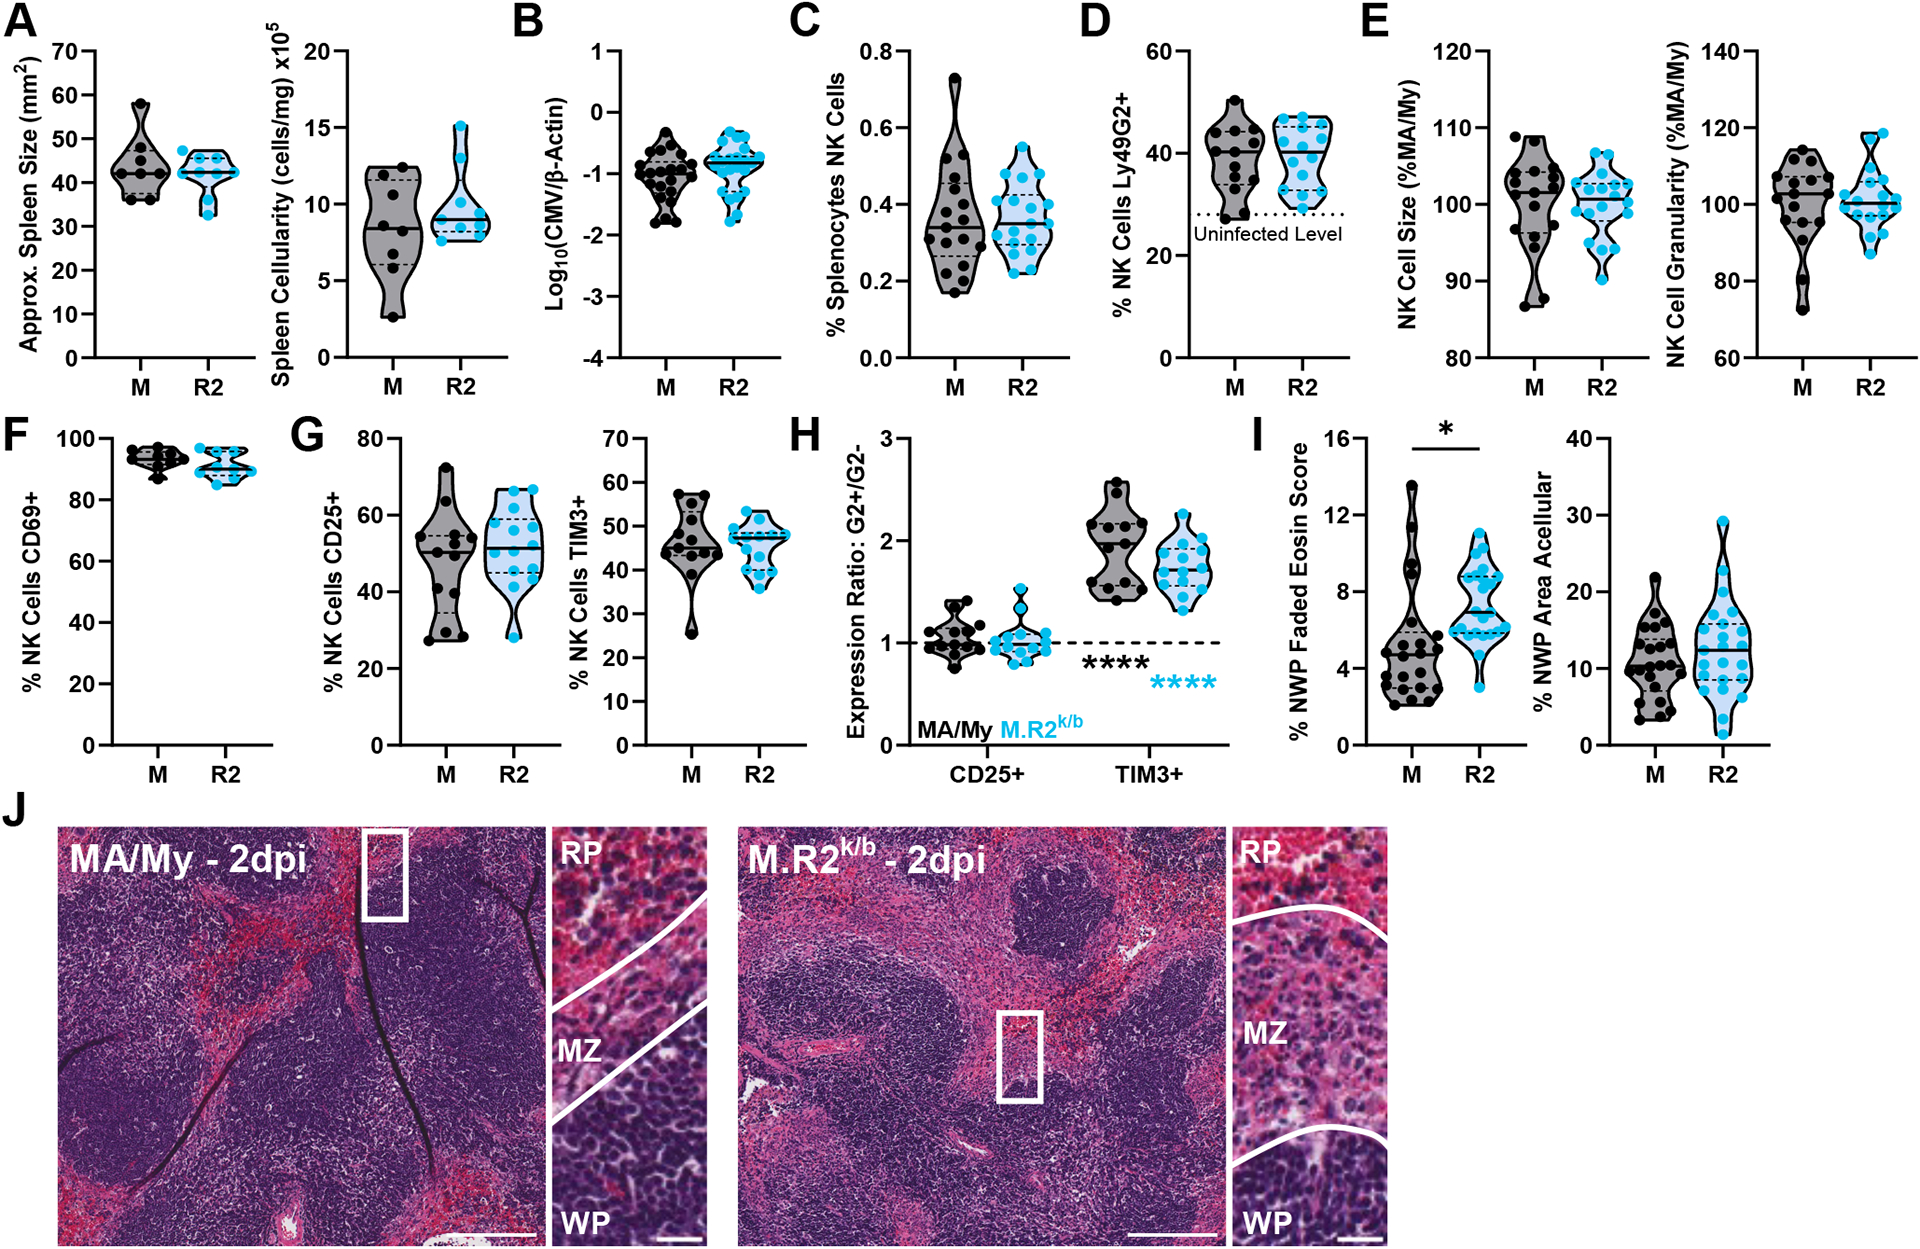
(A) Approximate spleen size (area, trapezoid) and cellularity represented as cells/mg spleen. (B) Viral load by quantitative PCR from 2dpi spleen DNA (C-H) Flow cytometry data from splenocytes harvested at 2dpi. (H) G2+/G2− expression ratio, bottom statistics indicate differences between ratio and y = 1 (statistical differences between G2+ and G2− values). (I) Quantification of histology sections, NWP = non-white pulp, (J) Representative images of H&E-stained spleen sections from different strains at 2dpi with zoomed insert and lines highlighting borders between white pulp (WP)/marginal zone (MZ)/red pulp (RP) regions. Full image scale bar at 200 microns, insert scale bar at 20 microns. Violin plots depict median (solid line) and quartile (dashed line) values. (A) Data pooled from 2 independent experiments with total 9–10 mice per group (9–10 males), (B, I) pooled from 5 independent experiments with total 22–23 mice per group (17–18 males, 5 females), (C, E) pooled from 4 independent experiments with total 17–18 mice per group (17–18 males), (F) pooled from 2 independent experiments with total 9 mice per group (9 males), (D, G, H) pooled from 3 independent experiments with total 13–14 mice per group (13–14 males). Statistical comparisons made using an unpaired Welch’s t-test (A-G, I), or an ordinary 2-way ANOVA with Sidak’s multiple comparisons test (H). * p < 0.05, ** p < 0.01, *** p < 0.001, **** p < 0.0001.
Interestingly, histology sections from 2dpi spleens showed significant disruption at the marginal zone in both strains (Fig. 5I, 5J), which is consistent with early MCMV entry and replication in marginal zone cells (35). However, the MA/My marginal zone had seemingly collapsed from its uninfected state, appearing thinner and less organized, while the M.R2k/b marginal zones were bloated and showed significant signs of necrosis, displaying a loss of cellular definition, and faded cytoplasmic staining alongside evidence of cellular infiltrates (Fig. 5J; compare to Fig. 1D). Here we identify marginal zone necrotic histopathology as the first apparent Cmv5s phenotype during MCMV infection, and further assert that differences between Cmv5-disparate mice cannot be solely traced back to increased viral replication. Our data additionally suggest that initial NK cell recognition and activation during MCMV infection is not diminished in Cmv5s mice.
H2K/Mhc-II Region Cmv5 Recombinants Display Splenic Marginal Zone Damage.
In seeking to further narrow the genetic underpinnings of Cmv5s-mediated MCMV susceptibility and tissue damage, we generated additional Cmv5-recombinant congenic mice: M.R4 k/b (R4), which contain a 3.78Mb C57L-derived region, and M.R5k/b (R5) which contain a 1.44-Mb C57L-derived region. Both M.R5k/b and M.R4k/b intervals encompass the H2K/Mhc-II region (Fig. 6A). While these M.R5k/b and M.R4k/b intervals do not contain H2D, we continued using heterozygous mice for the sake of consistency. Neither M.R5k/b nor M.R4k/b mice showed increased viral load or weight loss compared to MA/My counterparts (Fig. 6B, 6C; Fig. S2A, S2B). Additionally, M.R5k/b and M.R4k/b mice showed NK cell morphology and activation marker expression in line with the MA/My group (Fig. 6D, 6E; Fig. S2C, S2D). Tim-3 expression on the M.R5k/b and M.R4k/b NK cells was higher than MA/My mice, as indicated by the Tim-3 GMFI (Fig. 6F, Fig. S2E), however it did not reach the level of expression seen in the M.R2k/b NK cells. Like MA/My NK cells, M.R5k/b and M.R4k/b NK cells maintained the increased Ly49G2+ activation marker expression ratio (Fig. 6G, Fig. S2F). Interestingly, histopathology in the spleen was apparent, showing evidence of necrosis and acellularity, however this damage was highly localized to the marginal zone area without apparent spread into the red pulp (Fig. 6H, 6I; Fig. S2G, S2H). While quantification of histology sections identified higher acellular area in M.R5k/b and M.R4k/b spleens, confinement to the marginal zone regions significantly reduced the overall area affected when compared to that seen in M.R2k/b mice (Fig. 6H, Fig. S2G). Here we identified a similar partial phenotype in two different Cmv5-recombinant strains overlapping the same H2K/Mhc-II genomic region. Data from these mice suggest that tissue damage at the marginal zone may be separate from the appearance of acellularity in the red pulp and independent of increased viral load. Additionally, the identification of a partial phenotype in the M.R5k/b mice asserts that a locus in this R5 interval, along with at least one other currently unknown locus, contributes to the Cmv5s MCMV susceptibility and tissue damage phenotype seen in the M.R2k/b mice.
Figure 6. H2K/Mhc-II Region Cmv5 Recombinants Display Splenic Marginal Zone Damage.
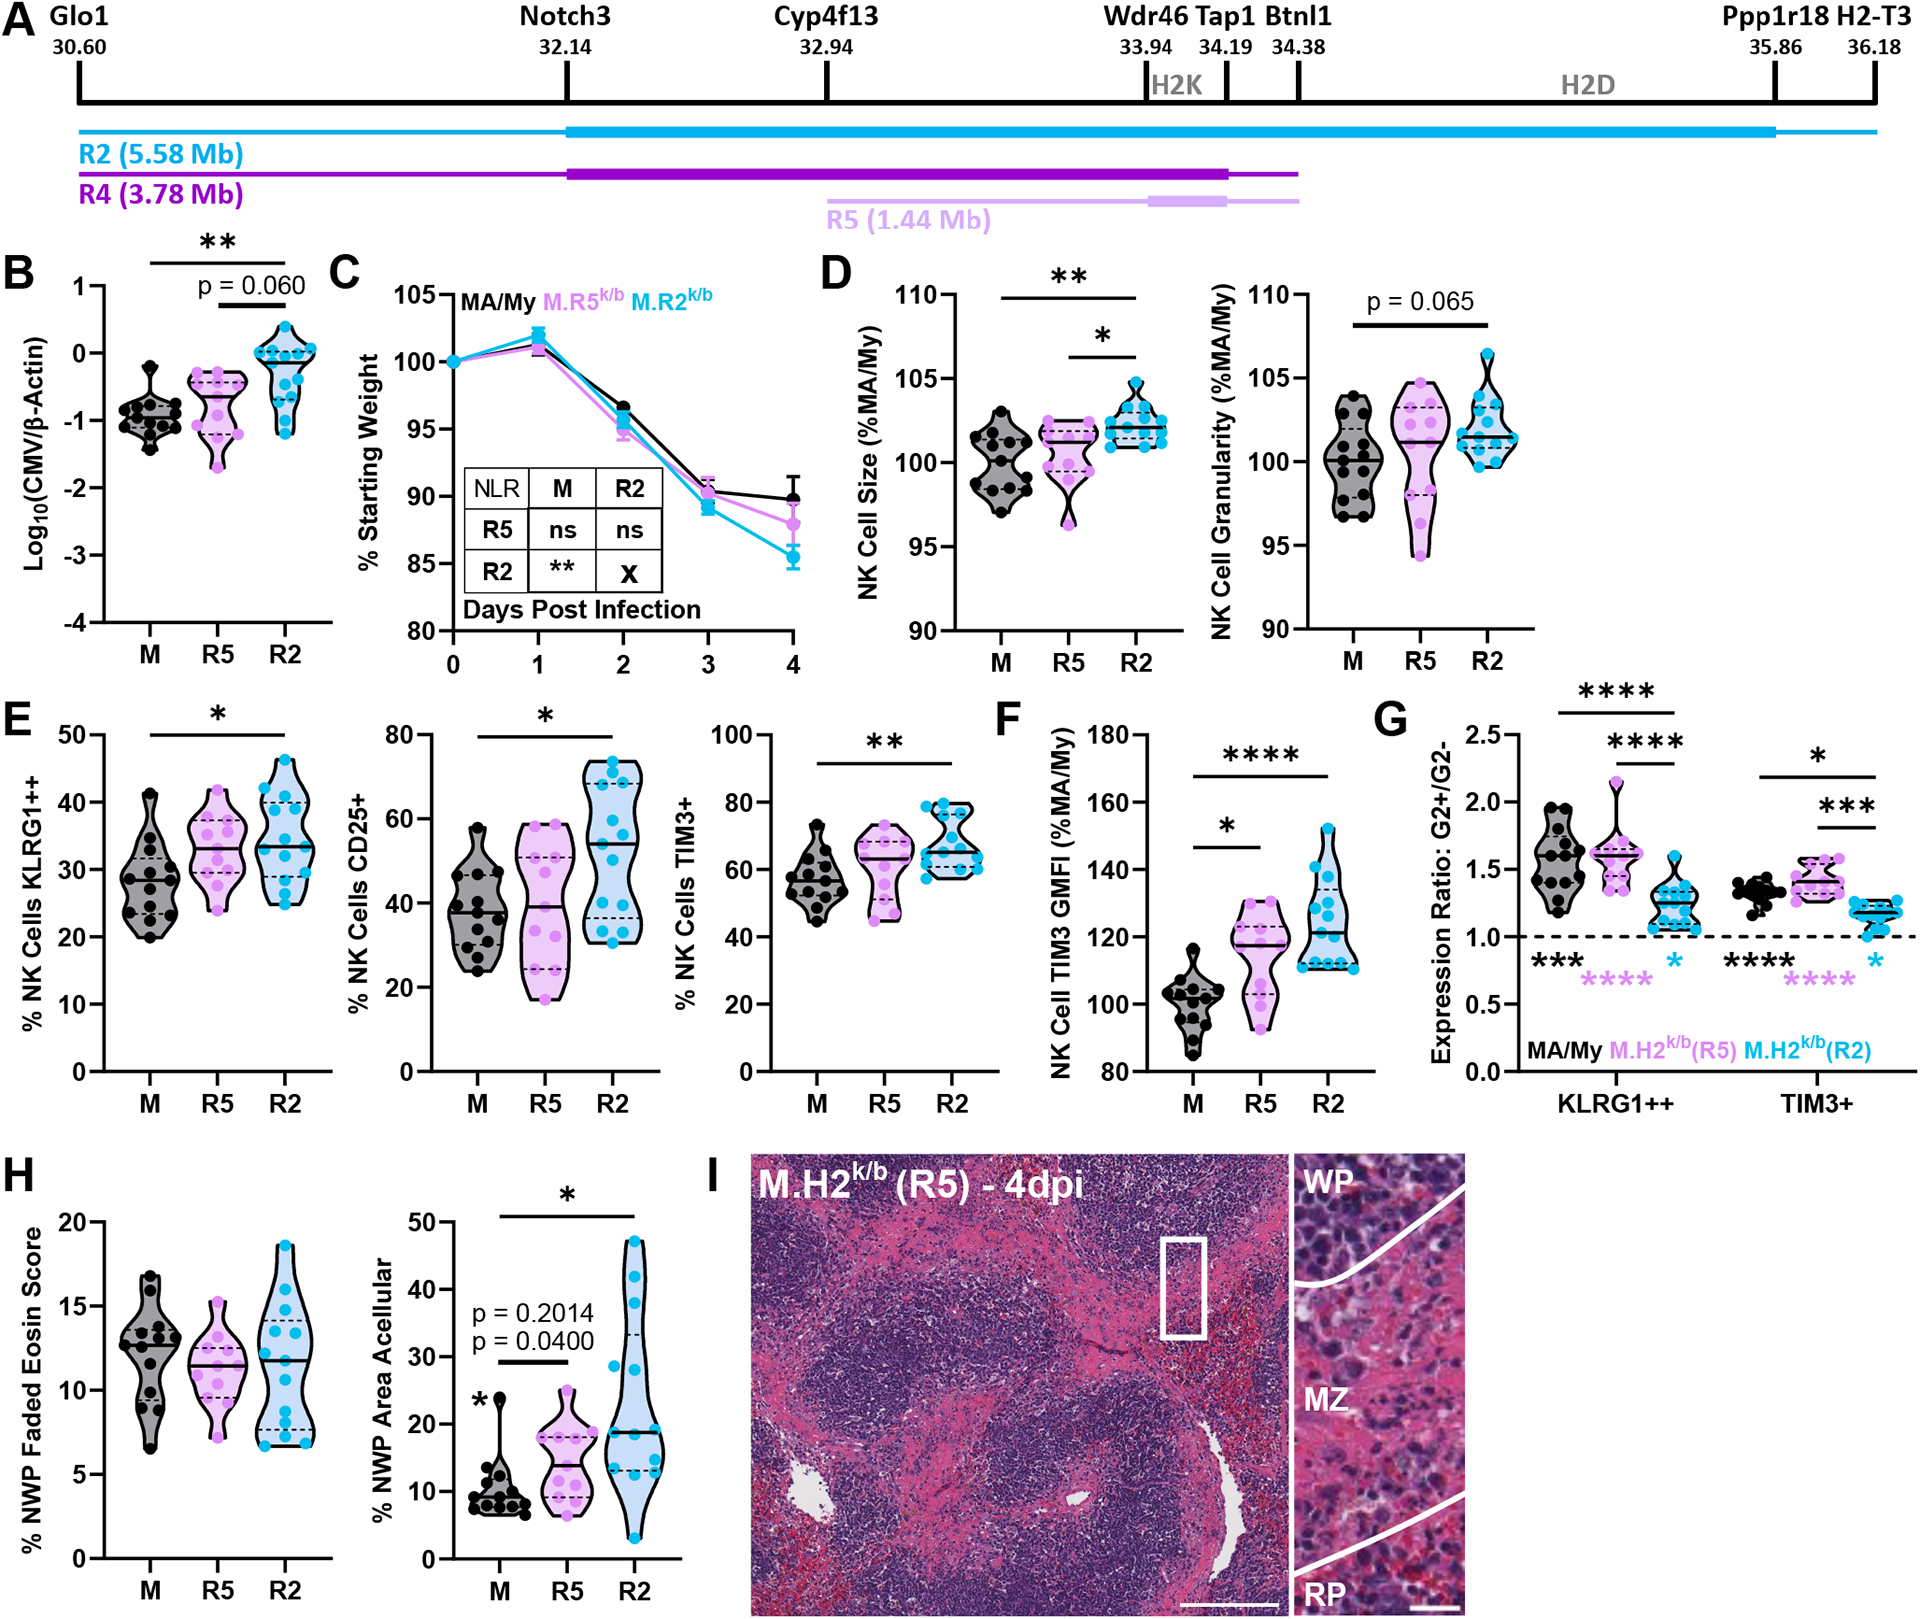
(A) Schematic depicting the M.R4k/b (R4) (see Fig. S2) and M.R5k/b (R5) C57L-derived interval locations. (B) Viral load by quantitative PCR from 4dpi spleen DNA. (C) Mouse weight loss during infection as % of starting weight, Error bars represent SEM. NLR = non-linear regression. (D-G) Flow cytometry data from splenocytes harvested at 4dpi. (G) G2+/G2− expression ratio, top statistics indicate differences in ratios between groups, bottom statistics indicate differences between ratio and y = 1 (statistical differences between G2+ and G2− values). (H) Quantification of histology sections, NWP = non-white pulp. Datapoint marked by asterisk identified as outlier by Grubb’s outlier test with alpha < 0.05, top p-value listed includes this outlier while bottom p-value omits it. (I) Representative image of H&E-stained spleen sections at 4dpi with zoomed insert and lines highlighting borders between white pulp (WP)/marginal zone (MZ)/red pulp (RP) regions. Full image scale bar at 200 microns, insert scale bar at 20 microns. Violin plots depict median (solid line) and quartile (dashed line) values. Data pooled from 3 independent experiments with total 11–13 mice per group (4–5 males, 7–9 females). See Figure S3 for details of data pooling and presentation. Statistical comparisons are made using Brown-Forsythe and Welch ANOVA with Dunnett’s T3 multiple comparisons test (B, D-F, H), ordinary 2-way ANOVA with Tukey’s multiple comparisons test (G), or non-linear (cubic) regression (NLR) with extra sum-of-squares F test (inset) (C). * p < 0.05, ** p < 0.01, *** p < 0.001, **** p < 0.0001.
C57L-Derived H2D Locus is Insufficient to Convey MCMV Susceptibility or Tissue Damage.
We additionally generated two Cmv5-recombinant strains encompassing the H2D locus: M.R6k/b (R6) mice, which bear a 1.11Mb C57L-derived interval; and M.R8k/b (R8) mice, which bear a 3.82 Mb interval encompassing H2D and the H2K/Mhc-II region (Fig. 7A). Considering the importance of H-2Dk as a resistance factor for MCMV in this model, we were surprised to find no difference between MA/My and M.R6k/b viral loads. However, higher viral loads in M.R8k/b mice were on par with M.R2k/b mice (Fig. 7B). Similar to the pattern seen in the MA/My-UHD mice (Fig. 4B), the M.R6k/b mice lost more weight than the MA/My mice but began to stabilize between 3–4dpi while both the M.R2k/b and M.R8k/b mice continued to lose weight (Fig. 7C). Non-linear regression analysis identified three unique weight loss curves from the four strains: a shared curve for both M.R2k/b and M.R8k/b mice, and distinct curves for both MA/My and M.R6k/b mice. Both M.R6k/b and M.R8k/b mice displayed increased NK cell size and KLRG1-high expression, while only M.R8k/b matched the M.R2k/b NK cell granularity and expression of CD25 and Tim-3 (Fig. 7D–7F). Interestingly, all the Cmv5-recombinant mice heterozygous at H2D showed a reduction in selective activation of Ly49G2+ NK cells (Fig. 7G) and increased Ly49G2 GMFI (Fig 7H), suggesting these features are unlikely to be causative in Cmv5s reduced MCMV control.
Figure 7. C57L-Derived H2D Locus is Not Sufficient to Convey MCMV Susceptibility or Tissue Damage.
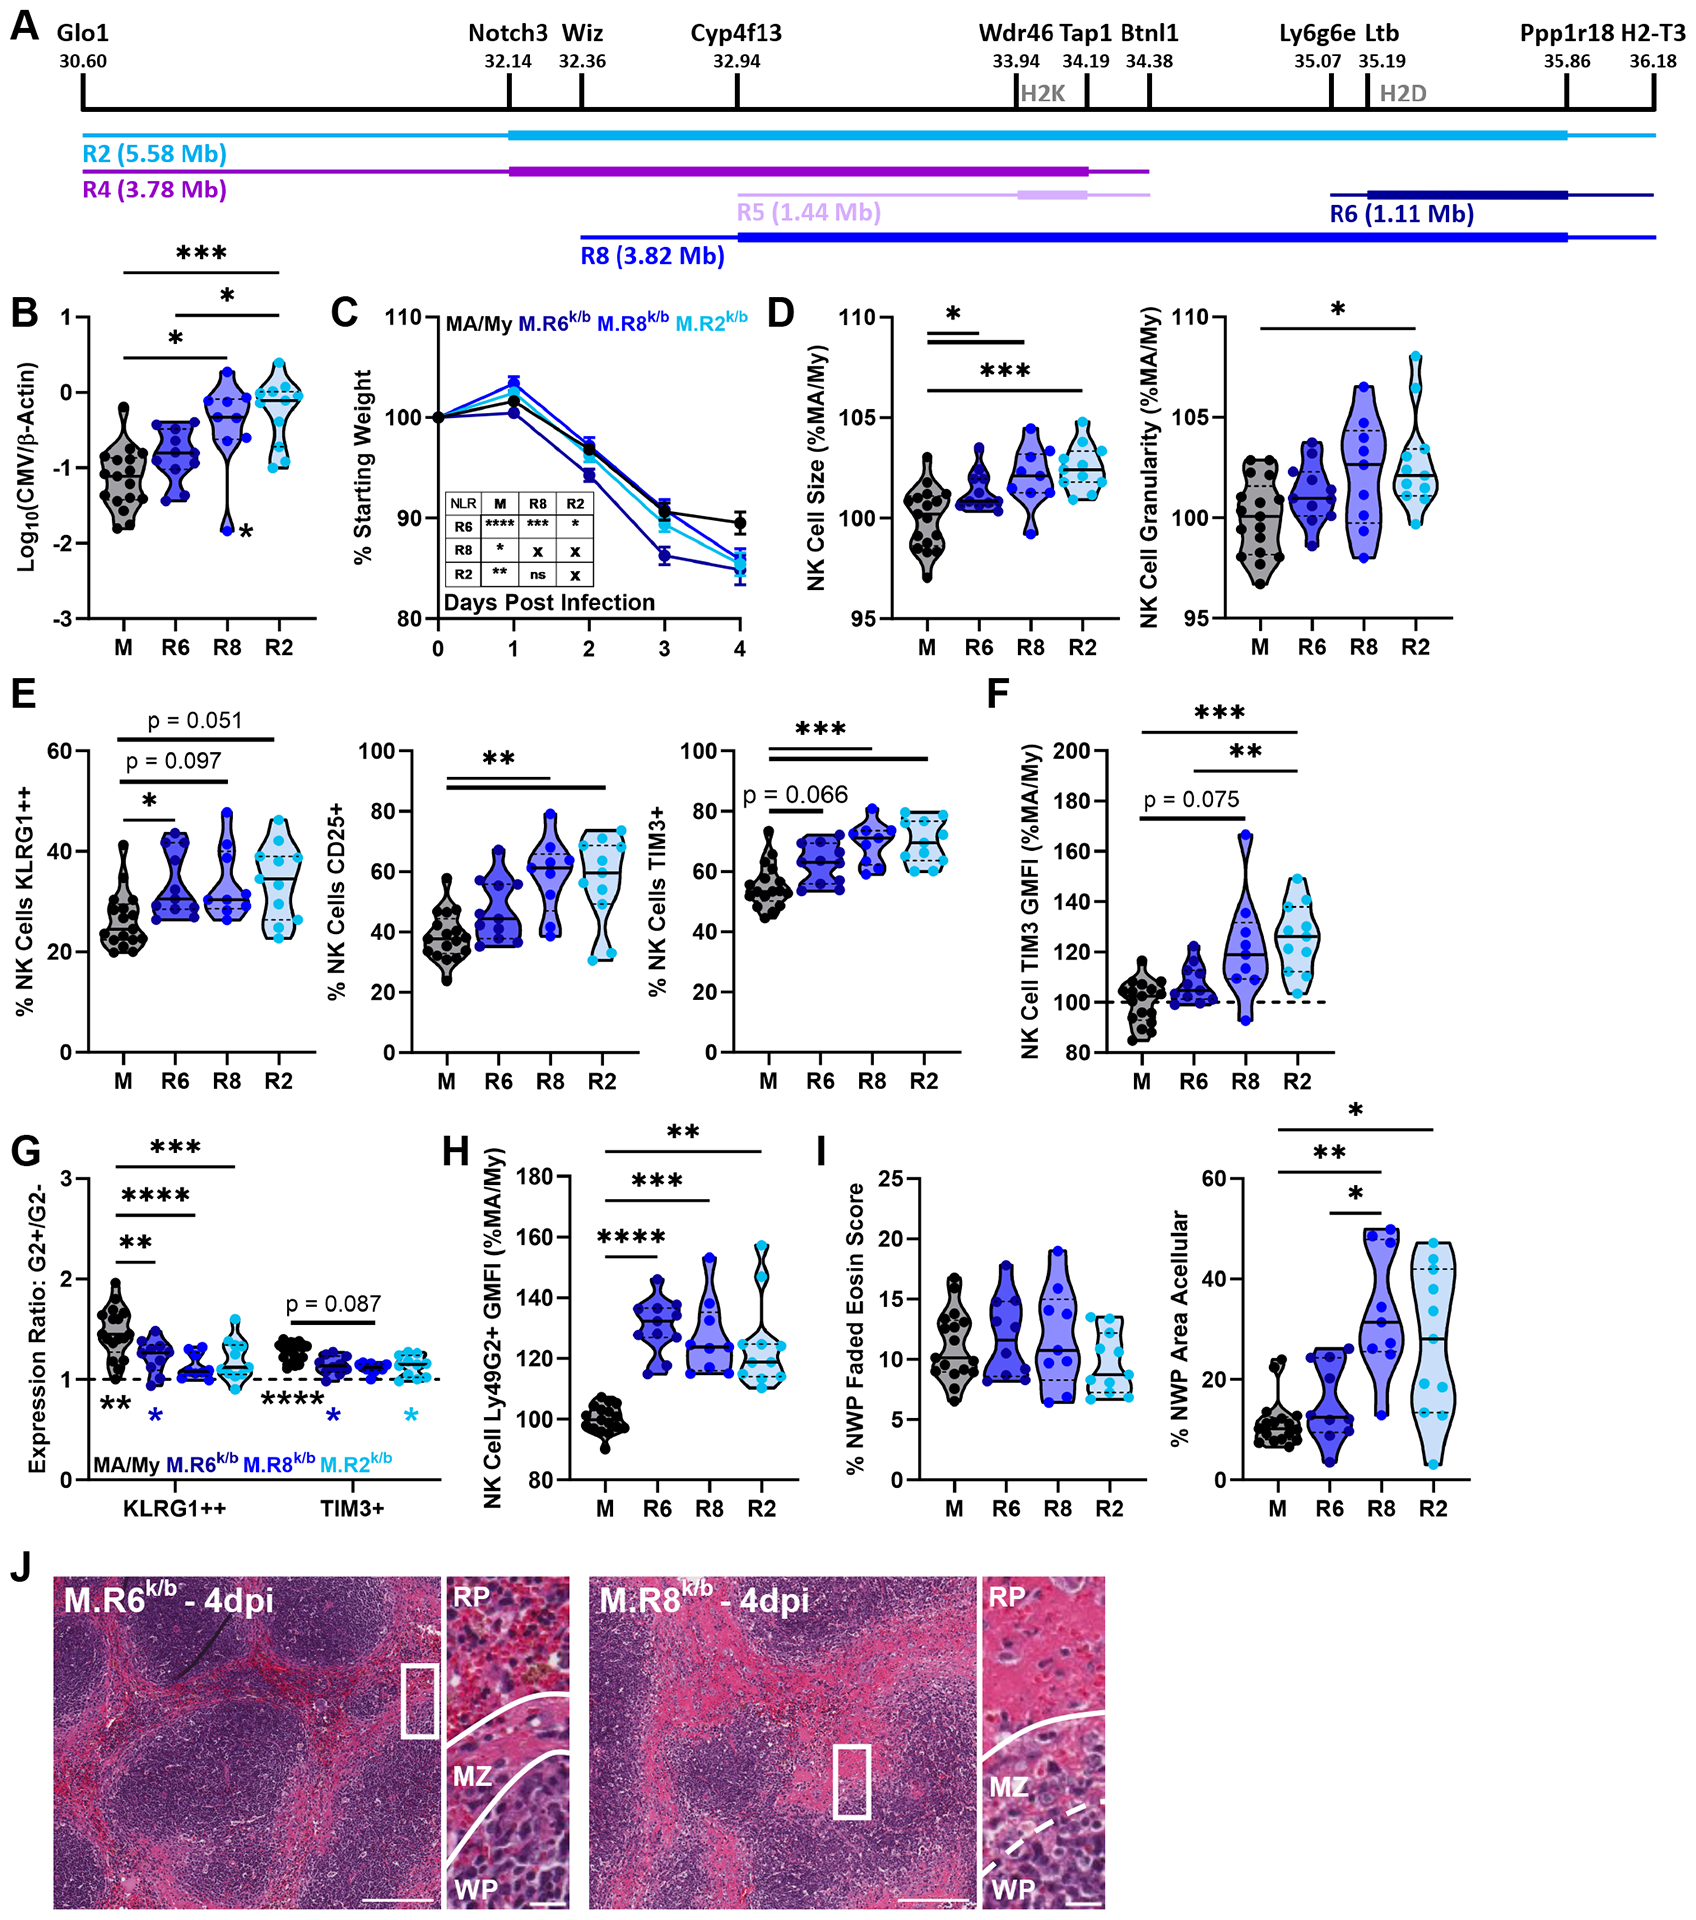
(A) Schematic depicting the M.R6k/b (R6) and M.R8k/b (R8) C57L-derived interval locations. (B) Viral load by quantitative PCR from 4dpi spleen DNA. Datapoint marked by asterisk identified as outlier by Grubb’s outlier test with alpha < 0.05, p-value reaches significance with the outlier so an additional p-value omitting the value is not listed. (C) Mouse weight loss during infection as % of starting weight, Error bars represent SEM. (D-H) Flow cytometry data from splenocytes harvested at 4dpi. (G) G2+/G2− expression ratio, top statistics indicate differences in ratios between groups, bottom statistics indicate differences between ratio and y = 1 (statistical differences between G2+ and G2− values). (I) Quantification of histology sections, NWP = non-white pulp. (J) Representative images of H&E-stained spleen sections at 4dpi with zoomed insert and lines highlighting borders between white pulp (WP)/marginal zone (MZ)/red pulp (RP) regions. Full image scale bar at 200 microns, insert scale bar at 20 microns. Violin plots depict median (solid line) and quartile (dashed line) values. Data pooled from 3 independent experiments with total 9–17 mice per group (6–12 males, 3–5 females). See Figure S3 for details of data pooling and presentation. Statistical comparisons are made using Brown-Forsythe and Welch ANOVA with Dunnett’s T3 multiple comparisons test (B, D-F, H, I), ordinary 2-way ANOVA with Tukey’s multiple comparisons test (G), or non-linear (cubic) regression (NLR) with extra sum-of-squares F test (inset) (C). * p < 0.05, ** p < 0.01, *** p < 0.001, **** p < 0.0001.
In line with M.R8k/b mice displaying a full Cmv5s phenotype on par with the M.R2k/b mice, M.R8k/b spleens showed significant spleen histopathology marked by a loss of organized marginal zone, evidence of marginal zone necrosis, and widespread acellularity (Fig. 7I, 7J). The identification of M.R8k/b mice as bearing Cmv5s reduces the phenotype-associated genetic interval from ~23-Mb to 3.82-Mb. Additionally, the minimal phenotype in M.R6k/b mice excludes the H2D locus as being solely responsible for Cmv5s MCMV susceptibility and tissue damage.
Discussion.
Genetic mechanisms surrounding morbidity and mortality during acute viral infection are largely unknown, with current information unable to account for most of the variability in outcome among patients (1, 19). In seeking to better understand the relationship between genetics and viral control, our lab previously identified MHC-linked Cmv5s, which conveys susceptibility to acute MCMV infection and severe splenic tissue damage despite a protective MHC-I/Ly49 pair and the presence of effector NK cells (20, 21).
When initially described, the Cmv5 QTL interval spanned more than 23-Mb, including the entire MHC region and over 400 genes (21) (Table S1). In this work, we expanded our genotyping coverage of the Cmv5 interval, which allowed the identification and testing of several novel Cmv5-recombinant congenic lines. Using these recombinant strains, we defined Cmv5s traits starting with necrotic pathology at the marginal zone, loss of cellularity throughout the red pulp, and increased NK cell expression of activation and checkpoint markers at 4dpi. From these definitions we further assessed the temporal and genetic mapping of Cmv5s. We identified marginal zone destruction as the first apparent Cmv5s phenotype at 2dpi and linked its appearance to the R5 genetic interval. Interestingly, R5 spleen marginal zone necrosis was separated from the loss of red pulp cellularity and increased viral susceptibility observed in R2 and R8 mice with regions overlapping R5. Evidence of a partial phenotype controlled by the R5 interval cements the contribution of at least two distinct loci within the MHC region to Cmv5s susceptibility and tissue damage during MCMV infection. Analysis of the H2D-bearing interval in R6 mice demonstrated that polymorphism of known MCMV resistance locus H2D is not sufficient to induce Cmv5s pathology. While we cannot rule out the potential that R5 and R6 intervals work together in a synergistic manner to disrupt viral control and tissue tolerance in the red pulp, it is likely that a non-MHC-I/II locus residing in the region between the R5 and R6 intervals plays a role in recapitulating the R2/R8 Cmv5s pathology.
On top of the interactions between loci within the MHC region, Cmv5 relies on additional interaction with the MA/My background, as the allele is not pathogenic in MA/MyxC57L F1 hybrid mice or H-2Dk transgenic C57L mice (16, 20). This contribution of multiple loci within the MHC to antiviral immunity with a consideration for genetic background mirrors previously reported observations in MCMV (12) and other viruses (38, 39). These reports suggest that further exploration of and intra- and extra- MHC interactions is relevant not only to MCMV in MA/My background mice, but in other models of viral pathology in various genetic backgrounds.
Understanding how the genetic makeup influences the progression of host tissue damage during acute viral infection is of high clinical significance. MCMV can be found at the spleen marginal zone as early as 6 hours post infection, progressing to widespread prevalence throughout the red pulp by 2dpi (35). In line with the idea that tissue damage in Cmv5s spleens follows the spread of the virus, we see necrotic marginal zone histopathology as the first apparent Cmv5s phenotype by 2dpi, and histopathology at the marginal zone is apparent in MA/My mice given an increased viral dose by 4 dpi. Of note, M.R4k/b/ M.R5k/b mice show significant marginal zone pathology without an associated increase in viral load. However, there are several differences between M.R4k/b/ M.R5k/b splenic pathology compared to that seen in MA/My-UHD mice, most apparent were the cellular infiltrates and high faded eosin score in the MA/My-UHD mice that was not observed in the M.R4k/b/ M.R5k/b spleens. Instead, M.R4k/b/ M.R5k/b marginal zone damage consisted of strikingly localized acellularity. The marginal zones of 2dpi M.R2k/b spleens more closely mirrored the MA/My-UHD pathology, but like the M.R4k/b/ M.R5k/b spleens, it was not associated with increased viral load. Additionally, marginal zone disruption in the 2dpi M.R2k/b spleens gave way to widespread red pulp acellularity that was not matched in M.R4k/b/ M.R5k/b or MA/My-UHD mice. Cmv5s pathology therefore is distinct from that observed in MA/My-UHD; and the genetic separation of phenotype by region further demonstrates Cmv5s comprises multiple loci acting together.
In an assessment of Cmv5 from an immunological standpoint, we provide evidence that the failure of Cmv5s NK cells to control MCMV infection is not due to an inherent defect in the ability of the NK cell to become activated and exert effector functions, but rather the establishment of a tissue environment not conducive to effective antiviral NK cell function. Interestingly, our data shows that Cmv5s NK cells upregulate non-classical checkpoint receptors Tim-3 and Lag-3 to a greater extent than their MA/My counterparts. In an MCMV infected spleen environment marked by tissue damage starting as early as 2dpi, inhibitory receptors with ligands including Damage-Associated Molecular Patterns (DAMPs) and MHC-II (32) could drastically alter the way Cmv5s NK cells respond. Whether this contributes to, or is a symptom of, the inability to control viral infection is unclear and will require further exploration.
While we ruled out the reduced Ly49G2+/Ly49G2− NK cell activation ratio in the M.R2k/b mice as a cause of reduced viral control, we did note interesting stratifications in phenotypes between Ly49G2+ and Ly49G2− NK cells in both strains. In particular, the finding that Ly49G2+ NK cells have higher expression of Eomes than Ly49G2− counterparts may suggest a role for Eomes in Ly49G2-mediated NK cell licensing, in line with previous data associating reduced Eomes in NK cells with reduced ability to kill MHC-I deficient targets (34). This is an intriguing finding that may provide additional insight into protective H-2Dk-Ly49G2 NK cell licensing with further study and verification.
Overall, these data explore the immunological and genetic underpinnings of a system where polymorphism in the MHC region and host genetic background promotes the formation of acute viral infection-induced tissue damage and corrupts an otherwise protective antiviral NK cell response. Ongoing work will further delineate the genetic and downstream immunological mechanisms contributing to host susceptibility and tissue damage in this model, advancing our understanding of genetically driven variation in infection outcomes.
Supplementary Material
Key Points.
Cmv5s, comprising multiple MHC loci, dominantly impedes NK cell MCMV control.
Cmv5s NK cells selectively display high Tim-3 and Lag-3 during MCMV infection.
Cmv5s splenic tissue damage precedes divergence in viral load and NK cell phenotype.
Acknowledgements.
The authors acknowledge the resources and services provided by Sheri VanHoose and Lisa Vohwinkel at the University of Virginia School of Medicine Research Histology Core. We additionally thank Shreya Jetty for her administrative and technical assistance.
This work was funded by the National Institute of Allergy and Infectious Diseases (NIAID) R01 AI050072 (M.G.B.), the Department of Medicine, Division of Nephrology in the University of Virginia Department of Medicine, and the Beirne B. Carter Center for Immunology Research. JLA received support on PHS Training Grant T32 AI007496.
Footnotes
Abbreviations: dpi, Days Post Infection; HD, High Dose; MCMV, Murine CMV; MHC-I, MHC Class I; MHC-II, MHC Class II; NKC, NK gene complex; NWP, Non-White Pulp; UHD, Ultra-High Dose.
References.
- 1.Kenney AD, Dowdle JA, Bozzacco L, McMichael TM, St Gelais C, Panfil AR, Sun Y, Schlesinger LS, Anderson MZ, Green PL, Lopez CB, Rosenberg BR, Wu L, Yount JS. 2017. Human Genetic Determinants of Viral Diseases. Annu Rev Genet. 51:241–263. [DOI] [PMC free article] [PubMed] [Google Scholar]
- 2.Lanier LL 2005. NK Cell Recognition. Annu Rev Immunol. 23:225–274. [DOI] [PubMed] [Google Scholar]
- 3.Long EO, Kim HS, Liu D, Peterson ME, Rajagopalan S. 2013. Controlling natural killer cell responses: integration of signals for activation and inhibition. Annu Rev Immunol. 31:227–258. [DOI] [PMC free article] [PubMed] [Google Scholar]
- 4.Kim S, Poursine-Laurent J, Truscott SM, Lybarger L, Song Y, Yang L, French AR, Sunwoo JB, Lemieux S, Hansen TH, Yokoyama WM. 2005. Licensing of natural killer cells by host major histocompatibility complex class I molecules. Nature. 436:709–713. [DOI] [PubMed] [Google Scholar]
- 5.Boudreau JE, Hsu KC. 2018. Natural Killer Cell Education and the Response to Infection and Cancer Therapy: Stay Tuned. Trends Immunol. 39:222–239. [DOI] [PMC free article] [PubMed] [Google Scholar]
- 6.Gamache A, Cronk JM, Nash WT, Puchalski P, Gillespie A, Wei H, Gray L, Hammarskjold ML, Xu W, Brown MG. 2019. Ly49R activation receptor drives self-MHC-educated NK cell immunity against cytomegalovirus infection. Proc Natl Acad Sci U S A. 116:26768–26778. [DOI] [PMC free article] [PubMed] [Google Scholar]
- 7.Parikh BA, Bern MD, Piersma SJ, Yang L, Beckman DL, Poursine-Laurent J, Plougastel-Douglas B, Yokoyama WM. 2020. Control of Viral Infection by Natural Killer Cell Inhibitory Receptors. Cell Rep. 32:107969. [DOI] [PMC free article] [PubMed] [Google Scholar]
- 8.Brodin P, Karre K, Hoglund P. 2009. NK cell education: not an on-off switch but a tunable rheostat. Trends in immunology. 30:143–149. [DOI] [PubMed] [Google Scholar]
- 9.Bukowski JF, Woda BA, Habu S, Okumura K, Welsh RM. 1983. Natural killer cell depletion enhances virus synthesis and virus- induced hepatitis in vivo. J Immunol. 131:1531–1538. [PubMed] [Google Scholar]
- 10.Scalzo AA, Fitzgerald NA, Wallace CR, Gibbons AE, Smart YC, Burton RC, Shellam GR. 1992. The effect of the Cmv-1 resistance gene, which is linked to the natural killer cell gene complex, is mediated by natural killer cells. J Immunol. 149:581–589. [PubMed] [Google Scholar]
- 11.Scalzo AA, Lyons PA, Fitzgerald NA, Forbes CA, Yokoyama WM, Shellam GR. 1995. Genetic mapping of Cmv1 in the region of mouse chromosome 6 encoding the NK gene complex-associated loci Ly49 and musNKR-P1. Genomics. 27:435–441. [DOI] [PubMed] [Google Scholar]
- 12.Grundy JE, Mackenzie JS, Stanley NF. 1981. Influence of H-2 and non-H-2 genes on resistance to murine cytomegalovirus infection. Infect Immun. 32:277–286. [DOI] [PMC free article] [PubMed] [Google Scholar]
- 13.Scalzo AA, Corbett AJ, Rawlinson WD, Scott GM, Degli-Esposti MA. 2007. The interplay between host and viral factors in shaping the outcome of cytomegalovirus infection. Immunol Cell Biol. 85:46–54. [DOI] [PubMed] [Google Scholar]
- 14.Brown MG, Scalzo AA, Stone LR, Clark PY, Du Y, Palanca B, Yokoyama WM. 2001. Natural killer gene complex (Nkc) allelic variability in inbred mice: evidence for Nkc haplotypes. Immunogenetics. 53:584–591. [DOI] [PubMed] [Google Scholar]
- 15.Xie X, Stadnisky MD, Brown MG. 2009. MHC class I Dk locus and Ly49G2+ NK cells confer H-2k resistance to murine cytomegalovirus. J Immunol. 182:7163–7171. [DOI] [PMC free article] [PubMed] [Google Scholar]
- 16.Xie X, Stadnisky MD, Coats ER, Ahmed Rahim MM, Lundgren A, Xu W, Makrigiannis AP, Brown MG. 2010. MHC class I D(k) expression in hematopoietic and nonhematopoietic cells confers natural killer cell resistance to murine cytomegalovirus. Proc Natl Acad Sci U S A. 107:8754–8759. [DOI] [PMC free article] [PubMed] [Google Scholar]
- 17.Kumanovics A, Takada T, Lindahl KF. 2003. Genomic organization of the mammalian MHC. Annu Rev Immunol. 21:629–657. [DOI] [PubMed] [Google Scholar]
- 18.Mouse Genome Sequencing Consortium, Waterston RH, Lindblad-Toh K, Birney E, Rogers J, Abril JF, Agarwal P, Agarwala R, Ainscough R, Alexandersson M, An P, Antonarakis SE, Attwood J, Baertsch R, Bailey J, Barlow K, Beck S, Berry E, Birren B, Bloom T, Bork P, Botcherby M, Bray N, Brent MR, Brown DG, Brown SD, Bult C, Burton J, Butler J, Campbell RD, Carninci P, Cawley S, Chiaromonte F, Chinwalla AT, Church DM, Clamp M, Clee C, Collins FS, Cook LL, Copley RR, Coulson A, Couronne O, Cuff J, Curwen V, Cutts T, Daly M, David R, Davies J, Delehaunty KD, Deri J, Dermitzakis ET, Dewey C, Dickens NJ, Diekhans M, Dodge S, Dubchak I, Dunn DM, Eddy SR, Elnitski L, Emes RD, Eswara P, Eyras E, Felsenfeld A, Fewell GA, Flicek P, Foley K, Frankel WN, Fulton LA, Fulton RS, Furey TS, Gage D, Gibbs RA, Glusman G, Gnerre S, Goldman N, Goodstadt L, Grafham D, Graves TA, Green ED, Gregory S, Guigo R, Guyer M, Hardison RC, Haussler D, Hayashizaki Y, Hillier LW, Hinrichs A, Hlavina W, Holzer T, Hsu F, Hua A, Hubbard T, Hunt A, Jackson I, Jaffe DB, Johnson LS, Jones M, Jones TA, Joy A, Kamal M, Karlsson EK, Karolchik D, Kasprzyk A, Kawai J, Keibler E, Kells C, Kent WJ, Kirby A, Kolbe DL, Korf I, Kucherlapati RS, Kulbokas EJ, Kulp D, Landers T, Leger JP, Leonard S, Letunic I, Levine R, Li J, Li M, Lloyd C, Lucas S, Ma B, Maglott DR, Mardis ER, Matthews L, Mauceli E, Mayer JH, McCarthy M, McCombie WR, McLaren S, McLay K, McPherson JD, Meldrim J, Meredith B, Mesirov JP, Miller W, Miner TL, Mongin E, Montgomery KT, Morgan M, Mott R, Mullikin JC, Muzny DM, Nash WE, Nelson JO, Nhan MN, Nicol R, Ning Z, Nusbaum C, O’Connor MJ, Okazaki Y, Oliver K, Overton-Larty E, Pachter L, Parra G, Pepin KH, Peterson J, Pevzner P, Plumb R, Pohl CS, Poliakov A, Ponce TC, Ponting CP, Potter S, Quail M, Reymond A, Roe BA, Roskin KM, Rubin EM, Rust AG, Santos R, Sapojnikov V, Schultz B, Schultz J, Schwartz MS, Schwartz S, Scott C, Seaman S, Searle S, Sharpe T, Sheridan A, Shownkeen R, Sims S, Singer JB, Slater G, Smit A, Smith DR, Spencer B, Stabenau A, Stange-Thomann N, Sugnet C, Suyama M, Tesler G, Thompson J, Torrents D, Trevaskis E, Tromp J, Ucla C, Ureta-Vidal A, Vinson JP, Von Niederhausern AC, Wade CM, Wall M, Weber RJ, Weiss RB, Wendl MC, West AP, Wetterstrand K, Wheeler R, Whelan S, Wierzbowski J, Willey D, Williams S, Wilson RK, Winter E, Worley KC, Wyman D, Yang S, Yang SP, Zdobnov EM, Zody MC, Lander ES. 2002. Initial sequencing and comparative analysis of the mouse genome. Nature. 420:520–562. [DOI] [PubMed] [Google Scholar]
- 19.Kennedy AE, Ozbek U, Dorak MT. 2017. What has GWAS done for HLA and disease associations? Int J Immunogenet. 44:195–211. [DOI] [PubMed] [Google Scholar]
- 20.Xie X, Dighe A, Clark P, Sabastian P, Buss S, Brown MG. 2007. Deficient major histocompatibility complex-linked innate murine cytomegalovirus immunity in MA/My.L-H2b mice and viral downregulation of H-2k class I proteins. J Virol. 81:229–236. [DOI] [PMC free article] [PubMed] [Google Scholar]
- 21.Gillespie AL, Teoh J, Lee H, Prince J, Stadnisky MD, Anderson M, Nash W, Rival C, Wei H, Gamache A, Farber CR, Tung K, Brown MG. 2016. Genomic Modifiers of Natural Killer Cells, Immune Responsiveness and Lymphoid Tissue Remodeling Together Increase Host Resistance to Viral Infection. PLoS Pathog. 12:e1005419. [DOI] [PMC free article] [PubMed] [Google Scholar]
- 22.Gillespie A, Lee H, Robertson C, Cabot M, Brown MG. 2017. Genome-Wide Exome Analysis of Cmv5-Disparate Mouse Strains That Differ in Host Resistance to Murine Cytomegalovirus Infection. G3. [DOI] [PMC free article] [PubMed] [Google Scholar]
- 23.Wheat RL, Clark PY, Brown MG. 2003. Quantitative measurement of infectious murine cytomegalovirus genomes in real-time PCR. J Virol Meth. 112:107–113. [DOI] [PubMed] [Google Scholar]
- 24.Elmore SA, Dixon D, Hailey JR, Harada T, Herbert RA, Maronpot RR, Nolte T, Rehg JE, Rittinghausen S, Rosol TJ, Satoh H, Vidal JD, Willard-Mack CL, Creasy DM. 2016. Recommendations from the INHAND Apoptosis/Necrosis Working Group. Toxicol Pathol. 44:173–188. [DOI] [PMC free article] [PubMed] [Google Scholar]
- 25.Zarcone D, Prasthofer EF, Malavasi F, Pistoia V, LoBuglio AF, Grossi CE. 1987. Ultrastructural analysis of human natural killer cell activation. Blood. 69:1725–1736. [PubMed] [Google Scholar]
- 26.Lee SH, Fragoso MF, Biron CA. 2012. Cutting edge: a novel mechanism bridging innate and adaptive immunity: IL-12 induction of CD25 to form high-affinity IL-2 receptors on NK cells. J Immunol. 189:2712–2716. [DOI] [PMC free article] [PubMed] [Google Scholar]
- 27.Robbins SH, Tessmer MS, Mikayama T, Brossay L. 2004. Expansion and contraction of the NK cell compartment in response to murine cytomegalovirus infection. J Immunol. 173:259–266. [DOI] [PubMed] [Google Scholar]
- 28.Nabekura T, Lanier LL. 2016. Tracking the fate of antigen-specific versus cytokine-activated natural killer cells after cytomegalovirus infection. J Exp Med. 213:2745–2758. [DOI] [PMC free article] [PubMed] [Google Scholar]
- 29.Ndhlovu LC, Lopez-Verges S, Barbour JD, Jones RB, Jha AR, Long BR, Schoeffler EC, Fujita T, Nixon DF, Lanier LL. 2012. Tim-3 marks human natural killer cell maturation and suppresses cell-mediated cytotoxicity. Blood. 119:3734–3743. [DOI] [PMC free article] [PubMed] [Google Scholar]
- 30.Kåse A, Johansson MH, Olsson-Alheim MY, Kärre K, Höglund P. 1998. External and internal calibration of the MHC class I-specific receptor Ly49A on murine natural killer cells. J Immunol. 161:6133–6138. [PubMed] [Google Scholar]
- 31.da Silva IP, Gallois A, Jimenez-Baranda S, Khan S, Anderson AC, Kuchroo VK, Osman I, Bhardwaj N. 2014. Reversal of NK-cell exhaustion in advanced melanoma by Tim-3 blockade. Cancer Immunol Res. 2:410–422. [DOI] [PMC free article] [PubMed] [Google Scholar]
- 32.Kim N, Kim HS. 2018. Targeting Checkpoint Receptors and Molecules for Therapeutic Modulation of Natural Killer Cells. Front Immunol. 9:2041. [DOI] [PMC free article] [PubMed] [Google Scholar]
- 33.Gill S, Vasey AE, De Souza A, Baker J, Smith AT, Kohrt HE, Florek M, Gibbs KD Jr., Tate K, Ritchie DS, Negrin RS. 2012. Rapid development of exhaustion and down-regulation of eomesodermin limit the antitumor activity of adoptively transferred murine natural killer cells. Blood. 119:5758–5768. [DOI] [PMC free article] [PubMed] [Google Scholar]
- 34.Wagner JA, Wong P, Schappe T, Berrien-Elliott MM, Cubitt C, Jaeger N, Lee M, Keppel CR, Marin ND, Foltz JA, Marsala L, Neal CC, Sullivan RP, Schneider SE, Keppel MP, Saucier N, Cooper MA, Fehniger TA. 2020. Stage-Specific Requirement for Eomes in Mature NK Cell Homeostasis and Cytotoxicity. Cell Rep. 31:107720. [DOI] [PMC free article] [PubMed] [Google Scholar]
- 35.Hsu KM, Pratt JR, Akers WJ, Achilefu SI, Yokoyama WM. 2009. Murine cytomegalovirus displays selective infection of cells within hours after systemic administration. J Gen Virol. 90:33–43. [DOI] [PMC free article] [PubMed] [Google Scholar]
- 36.Katzenstein DA, Yu GS, Jordan MC. 1983. Lethal infection with murine cytomegalovirus after early viral replication in the spleen. J Infect Dis. 148:406–411. [DOI] [PubMed] [Google Scholar]
- 37.Hanson LK, Slater JS, Karabekian Z, Virgin H.W.t., Biron CA, Ruzek MC, van Rooijen N, Ciavarra RP, Stenberg RM, Campbell AE. 1999. Replication of murine cytomegalovirus in differentiated macrophages as a determinant of viral pathogenesis. J Virol. 73:5970–5980. [DOI] [PMC free article] [PubMed] [Google Scholar]
- 38.Oth D, Lussier G, Cainelli-Gebara VC, Dupuy JM. 1991. Susceptibility to murine hepatitis virus (type 3)-induced paralysis is influenced by class I genes of the MHC. European journal of immunogenetics : official journal of the British Society for Histocompatibility and Immunogenetics. 18:405–410. [DOI] [PubMed] [Google Scholar]
- 39.Makino M, Morse HC 3rd, Fredrickson TN, Hartley JW. 1990. H-2-associated and background genes influence the development of a murine retrovirus-induced immunodeficiency syndrome. J Immunol. 144:4347–4355. [PubMed] [Google Scholar]
Associated Data
This section collects any data citations, data availability statements, or supplementary materials included in this article.