

Abstract
Epigenetic regulation of chromatin states is crucial for proper gene expression programs and progression during development, but precise mechanisms by which epigenetic factors influence differentiation remain poorly understood. Here we find that the histone variant H2A.Z accumulates at Sox motif-containing promoters during zebrafish gastrulation while neighboring genes become transcriptionally active. These changes coincide with reduced expression of anp32e, the H2A.Z histone removal chaperone, suggesting that loss of Anp32e may lead to increases in H2A.Z binding during differentiation. Remarkably, genetic removal of Anp32e in embryos leads to H2A.Z accumulation prior to gastrulation and developmental genes become precociously active. Accordingly, H2A.Z accumulation occurs most extensively at Sox motif-associated genes, including many which are normally activated following gastrulation. Altogether, our results provide compelling evidence for a mechanism in which Anp32e preferentially restricts H2A.Z accumulation at Sox motifs to regulate the initial phases of developmental differentiation in zebrafish.
Keywords: H2A.Z, Anp32e, chromatin accessibility, Sox, neural crest, embryonic development
Introduction
Epigenetic marks on chromatin, including post-translational modifications to canonical histones and the incorporation of histone variants, can play a key role in regulating gene expression and transcription factor (TF) function (Gibney and Nolan, 2010). Previous studies have shown that cell state transitions during development are often accompanied by major epigenetic changes (Cusanovich et al., 2018; Pálfy et al., 2020; Pijuan-Sala et al., 2020), but the means by which these changes influence discrete biological pathways remain only partially understood.
The histone variant H2A.Z is highly conserved across organisms and is essential for early embryogenesis in numerous animals (Dijkwel and Tremethick, 2022; Giaimo et al., 2019). H2A.Z histones are deposited primarily at gene regulatory regions within the genome, including at promoters surrounding the transcription start site (TSS) and enhancers (Brunelle et al., 2015; Wang et al., 2018). Nucleosomes containing H2A.Z have been described to be more labile than canonical nucleosomes (Henikoff, 2008; Henikoff and Smith, 2015), potentially influencing how transcription factors gain access to DNA binding sites or the transcription levels that occurs for a given gene (Subramanian et al., 2015). Several studies, including ours, have shown that depletion of the H2A.Z removal chaperone, ANP32E, leads to H2A.Z accumulation at promoters, which is accompanied by increased chromatin accessibility and amplified gene expression levels (Mao et al., 2014; Murphy et al., 2020; Obri et al., 2014). While these studies provide molecular mechanisms by which precise control of H2A.Z could regulate cellular gene expression, it remains unknown whether this mode of regulation contributes to specific processes involved in embryonic development.
In zebrafish, inheritance of H2A.Z-containing placeholder nucleosomes prepares the embryo for zygotic genome activation (Murphy et al., 2018), but the function of these nucleosomes following the initial cleavage phase has not been explored. Interestingly, separate studies have implicated H2A.Z to be particularly important for the development of neural crest derived tissues (Greenberg et al., 2019; Raja et al., 2020), but considering the ubiquitous nature of H2A.Z in animals, and its necessity during early development (Giaimo et al., 2019), it remains poorly understood how tissue-level specificity is attained. In prior studies, we identified human ANP32E expression patterns to be anti-correlated with breast cancer disease progression, and we found H2A.Z localization to be correlated with high levels of chromatin accessibility at several TF binding sites, including motifs for SOX factor and FOX factor binding (G. L. Ruff et al., 2021). One compelling possibility is that the function of these types of TFs is particularly impacted by H2A.Z localization, and in this manner, changes in H2A.Z localization could specifically influence the expression of genes regulated by these factors. Numerous SOX and FOX family TFs are known to regulate specific aspects of development, including the formation of multiple adult stem cell populations and neural crest cells (Sarkar and Hochedlinger, 2013; Schock and LaBonne, 2020). Whether these factors are influenced by ANP32E or H2A.Z in the context of development remains unknown.
Here, we used zebrafish embryos to investigate the role of H2A.Z during the developmental transition from pluripotency through gastrulation and early differentiation. We integrated and reanalyzed a time course of publicly available chromatin accessibly (ATAC-seq), RNA-Seq, and ChIP-Seq datasets (Lukoseviciute et al., 2018; Pálfy et al., 2020), along with our newly acquired genomic CUT&Tag profiles for H2A.Z and Anp32e. We find that Anp32e resides primarily at Sox motif containing gene promoters in early embryos and Anp32e binding decreases as embryos transition through gastrulation. We also find that H2A.Z enrichment increases at these loci during this same developmental period. Through subsequent measurements of H2A.Z localization and gene expression changes in embryos lacking Anp32e, we formulate a model in which Anp32e binding protects Sox motif containing promoters against accumulation of H2A.Z at the early stages of zebrafish development.
Results
H2A.Z accumulates at putative regulatory elements during early differentiation
To investigate epigenetic patterning during the initial phase of zebrafish differentiation, we analyzed enrichment for histone modifications H3K4me1, H3K4me3, and H3K27ac using publicly available datasets (Bogdanovic et al., 2012). Datasets for each histone modification were collected in blastula embryos (dome stage) and gastrula embryos (80% epiboly) (Kimmel et al., 1995). We then defined genomic locations where enrichment was strongest, termed ‘peaks’ (see methods), and further identified developmental stage-specific enrichment, based on whether peaks overlapped across timepoints (Fig.1A & 1B). This strategy enables us to identify loci in which levels of H3K4me1 and H3K4me3 increased during differentiation (Fig. S1A), referred to as ‘gastrula-specific’. A reciprocal approach enabled us to identify ‘blastula-specific’ H3K4me1 and H3K4me3 enriched regions (Fig. S1A). As anticipated, developmental accumulation of either H3K4me1 or H3K4me3 associated with increased levels of H2A.Z, H3K27ac, and chromatin accessibility (ATAC-seq) (Fig. 1 C-D, Fig. S1B-C), and analogous increases did not occur for regions which experienced a developmental loss, with the exception of H2A.Z (Fig. S1D-F). Gene ontology analysis revealed that genes located in proximity to gastrula-specific sites tended to be involved in embryonic development and metabolism (Fig. S1G-H), and interestingly, binding motifs for several transcription factors involved in neural crest development were found to be enriched (Fig. 1E), including Sox family, Fox family, and Dlx factors. These results are consistent with our hypothesis that accumulation of H2A.Z may contribute to developmental epigenetic regulation at the onset of differentiation.
Figure 1: H2A.Z accumulates at gastrulation-specific putative regulatory elements.

A. H3K4me1 and H3K4me3 peaks (ChIP-seq) are partitioned into stage-specific classes. Venn diagram depicts the number of peaks that are blastula-specific (purple), gastrula-specific (pink), or maintained in transition (blend of colors).
B. Heatmaps H3K4me3 and H3K4me1 at blastula-specific, gastrula-specific, and shared peaks. In either H3K4me1 or H3K4me3, Blastula-specific regions decrease, gastrula-specific regions increase, and shared regions maintain.
C. Genomic averages of H3K27ac (ChIP-seq), chromatin accessibility (ATAC-seq), and H2A.Z (CUT&Tag) at H3K4me1 gastrula-specific regions.
D. Analogous to panel C at H3K4me3 gastrula-specific regions.
E. Selection of transcription factor motifs enriched in gastrula-specific H3K4me1 and H3K4me3 regions. Enrichment is found for TCF, Twist, Dlx, Fox, and Sox factors between categories.
Increases in chromatin accessibility occur during gastrulation over Sox motif containing promoters.
We next assessed whether developmental chromatin changes coincide with epigenetic changes, and utilized a series of published datasets to survey a developmental window spanning zebrafish gastrulation (utilizing publicly available ATAC-Seq data (Pálfy et al., 2020)). For comparison, we also included ATAC-seq datasets acquired from purified neural crest cells (Lukoseviciute et al., 2018). Published pre-processed early embryonic RNA-seq data were also collected (White et al., 2017), allowing us to compare chromatin changes with transcriptional impacts. After rank-normalization, we performed UMAP analysis, and the resulting profiles parallel the developmental progression (Fig. 2A – green arrow). We observed a clear separation of datasets between UMAP dimensions 1 and 2, revealing there to be a distinction in chromatin states for undifferentiated and differentiated embryos (Fig. 2A – red line). Samples from later developmental stages (including shield, epiboly, and somitogenesis) were clustered together near the bottom left side of the UMAP plot, whereas earlier stages (including high, oblong, sphere, and dome) were clustered on top right side. In agreement with our UMAP analysis, K-means clustering of rank-normalized chromatin accessibility scores also revealed there to be a clear separation between samples from differentiated and undifferentiated embryos (Fig. S2A).
Figure 2: Changes of chromatin accessibility across developmental stages.
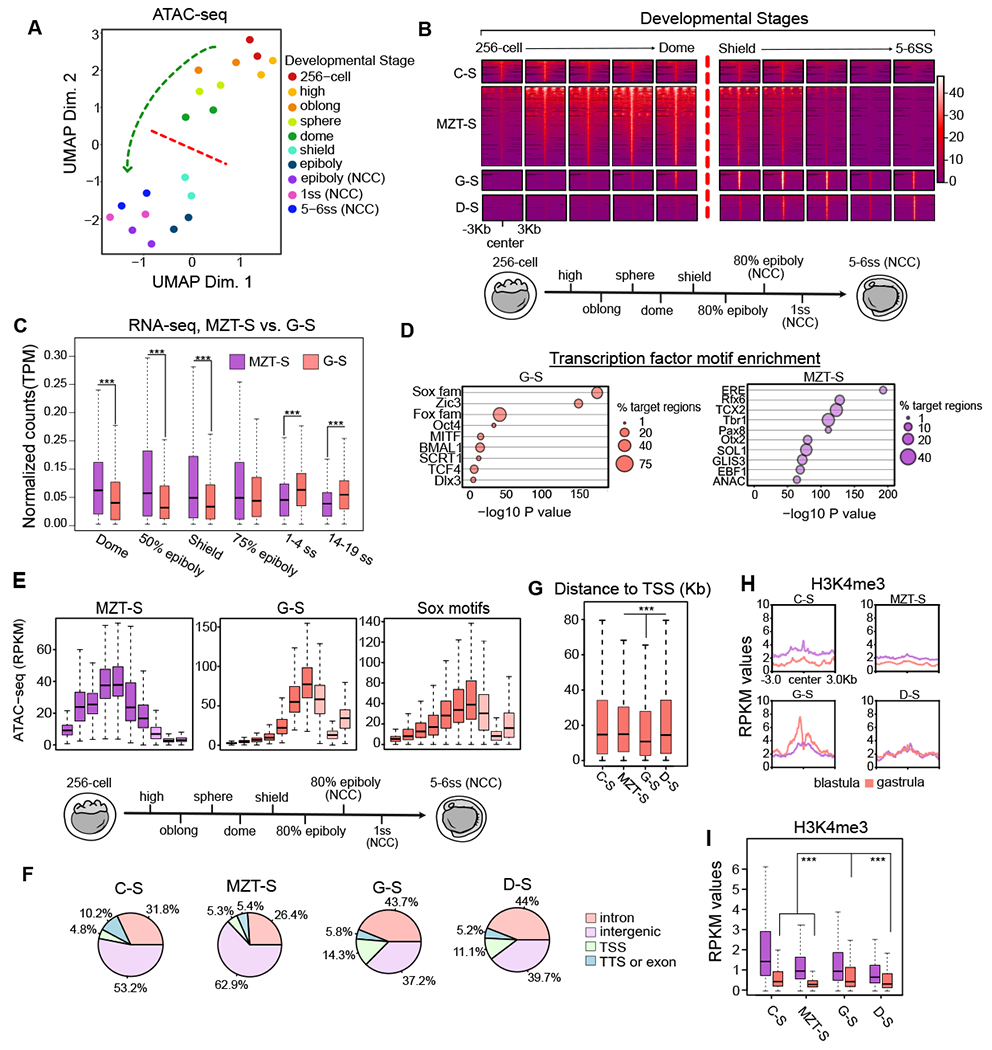
A. UMAP projection of a rank-normalized chromatin accessibility (ATAC-seq) profile recovers developmental stage of inputted samples. A genome-wide restructuring of chromatin state (motion of the green-arrow) distinguishes cleavage and blastula periods (above the red-line) from gastrulation and early differentiation periods (beneath the red-line). Datasets including and following epiboly are from purified Neural Crest Cell (NCC). Others are whole-embryo.
B. Feature-to-feature visualization of read-count normalized accessibility data underlying UMAP analysis, classified by accessibility signature. Cleavage-Specific (C-S, n=1,105), MZT-Specific (MZT-S, n=3,873), Gastrulation Specific (G-S, n=969), and Differentiation-Specific (D-S, n=1,247) classes synchronize with different developmental periods.
C. TPM-normalized gene-expression (RNA-seq) at genes nearest G-S and MZT-S loci. MZT-S-associated transcription is higher during MZT. G-S-associated gene transcription is increasing from shield stage (gastrulation) and overtakes MZT-S transcription by 1-4SS (neurula). (p< 0.001 for each).
D. Transcription factor motif enrichment is displayed for G-S (left) and MZT-S (right). Motif and motif families are sorted by −log10 P-value measuring statistical significance. Motif% enrichment in target regions is visualized.
E. Accessibility (ATAC-seq) patterns at Sox family motifs parallel patterns at G-S regions. This trend is contrasted by MZT-S regions.
F. Breakdown of cluster gene annotation frequencies, where colors indicate annotation type. C-S and MZT-S regions are dominated by intergenic sequences. G-S and D-S regions are dominated by genic sequences. Of any class, G-S regions have the highest proportion of TSS.
G. Absolute distance to TSS (base-pairs) for each cluster is also displayed. G-S regions are closest to TSS (p <0.001).
H. Blastula and gastrula H3K4me3 enrichment in each accessibility class. Genomic averages suggest that H3K4me3 increases only at G-S regions.
I. Boxplots analogous to profile plots in H. G-S regions have the highest H3K4me3 at gastrula.
We then classified genomic loci based on the developmental stage in which chromatin accessibility reached its maxima. Loci were classified as either cleavage stage specific (most accessible shortly after fertilization), maternal zygotic transition (MZT) specific (most accessible prior to gastrulation), gastrula-specific (most accessible around shield and epiboly stages), or differentiation-specific (most accessible during somite stages or in differentiation cells) (Fig. 2B). As anticipated, chromatin changes during the transition from MZT to gastrulation were associated with likewise developmental changes in gene expression (Fig. 2C). For example, genes nearby MZT-specific loci were more highly expressed during MZT. As gastrulation proceeds, MZT-specific transcription diminishes while gastrula-specific transcription intensifies (Fig. 2C). Comparisons between gene ontology terms (from genes proximal to accessibility sites) indicated that developmental changes in chromatin state might be particularly important for gene pathways associated with neural development, cell migration, and morphogenesis (Fig. S2B). Gastrula-specific accessible sites were also strongly enriched for SOX family transcription factor binding motifs (Fig. 2D), similar to our prior measurements of loci which gain H3K4me3 during gastrulation (Fig. 1E). Although patterning of the 435,567 total Sox motifs across the zebrafish genome approaches a random distribution (Fig. S2C), we found that a relatively large number of motifs were present within active/accessible chromatin regions during gastrulation (Fig. S2D), including 26% of gastrula specific accessible regions and 22% of H3K4me3 marked loci.
Having found that Sox motifs were enriched within gastrula-specific accessible sites, we next investigated whether chromatin accessibly changes occurred across all Sox motifs throughout the genome during early development. Remarkably, changes in chromatin accessibility at Sox motifs were reflective of the developmental changes we observed at gastrula-specific loci (Fig. 2E), with accessibility being low during cleavage phase and then increasing dramatically during gastrulation (in shield and epiboly stage embryos). We also found that gastrula-specific accessible regions contained more genic loci (including TSS and intronic sequences) than MZT-specific regions contained (Fig. 2F), and gastrula-specific regions were in closer proximity to transcription start sites as compared with other classes of accessible loci (Fig. 2G), suggesting that chromatin reprogramming may occur to a greater extent over gene promoters during gastrulation than during other developmental periods. As further support for promoter-specific impacts, we found that levels of H3K4me3 (which predominantly marks promoters (Bannister and Kouzarides, 2011)) were higher in gastrula stage embryos at gastrula-specific accessible loci, as compared with MZT-specific or differentiation-specific regions (Fig. 2H & 2I). Taken together, these data suggest that chromatin becomes more accessible over gene promoters during zebrafish gastrulation, SOX motifs tend to be enriched at these loci, and up-regulation of proximal gene expressions occurs in association with increased accessibility.
Loss of Anp32e over Sox motif containing promoters leads to H2A.Z accumulation
Having identified genomic loci possessing clear indicators of chromatin reprogramming during gastrulation (increased accessibility, H3K4me3 enrichment, and increased neighboring gene activation), we then returned to our initial hypothesis, that H2A.Z accumulation during early development helps to support gene activation. In agreement with this hypothesis, we found that developmental accumulation of H2A.Z occurred over a majority of gene promoters during gastrulation (Fig. S3A), and similar patterns were observed for gastrula-specific accessible regions located within promoters, but not for regions located outside of promoters (Figs. 3A & 3B). Additionally, H2A.Z levels were significantly higher over promoters containing at least one Sox factor binding motif, compared with those lacking a motif (Fig. 3C & 3D).
Figure 3: Anp32e loss leads to H2A.Z accumulation at Sox motif containing promoters.
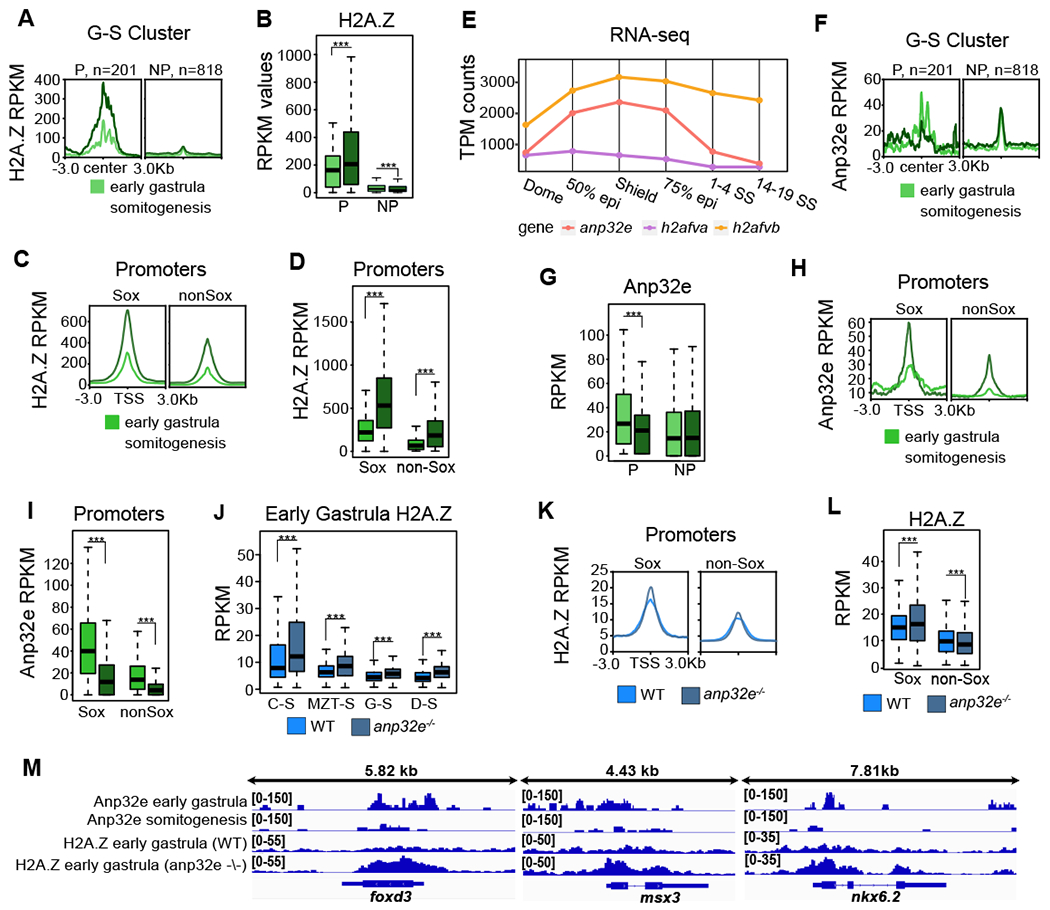
A. H2A.Z enrichment averages (CUT&Tag) for early (6hpf) and late (12hpf) gastrula stage embryos is displayed at G-S regions partitioned into promoters (P, n=201) and non-promoters (NP, n=818).
B. Boxplots of H2A.Z levels in early and late stage gastrula embryos demonstrate increases at G-S promoters and decreases at G-S non-promoters during gastrulation (p<0.001).
C. H2A.Z enrichment averages in early and late stage gastrula embryos at promoters containing Sox motifs (n=6,968, Sox) and promoters not containing Sox motifs (n=25,058, nonSox).
D. Boxplots of H2A.Z levels in early and late gastrula embryos demonstrate that H2A.Z is more highly enriched at Sox promoters (p<0.001).
E. Gene expression levels (RNA-seq) of anp32e, h2afva, and h2afvb from Dome (blastula) to 14-19SS (neurula). h2afva and h2afvb are increasing from dome (blastula) and are stably expressed after 75% epiboly (gastrulation). Expression of anp32e is reduced after 75% epiboly.
F. ANP32E enrichment averages in early and late gastrula embryos at G-S regions partitioned into promoters (P) and non-promoters (NP).
G. Boxplots of Anp32e levels in early and late gastrula embryos demonstrate decreases at G-S promoters (p<0.001). Anp32e stays the same at G-S non-promoters.
H. Early and late gastrula average Anp32e enrichment at Sox and non-Sox promoters.
I. Boxplots of early and late gastrula Anp32e levels show higher levels at Sox promoters than non-Sox promoters for each sample (p<0.001).
J. Boxplots of H2A.Z levels in WT and anp32e−/− embryos at 6hpf (ChIP-seq). H2A.Z is measured at each of our previously identified accessibility clusters. H2A.Z increases at all regions in anp32e−/− embryos (p<0.001).
K. Average enrichment of H2A.Z at Sox and non-Sox promoters in WT and anp32e−/−.
L. Boxplots of H2A.Z levels at Sox and non-Sox promoters in WT and anp32e−/− embryos. Sox promoters increase in H2A.Z in KO embryos compared to WT at early gastrula. Non-Sox promoters decrease.
M. Genome browser screenshots of Anp32e and H2A.Z enrichment in WT and anp32e−/− embryos at early gastrula. Sox promoter genes foxd3, msx3, and nkx6.2 are displayed. At these sites, Anp32e decreases over gastrulation, and excess H2A.Z accumulates in anp32e−/− embryos.
In prior studies, we and others demonstrated that H2A.Z accumulation is restricted by the histone chaperone Anp32e in vertebrates (Mao et al., 2014; Murphy et al., 2020; Obri et al., 2014). Genetic removal of Anp32e caused a variety of phenotypic defects in zebrafish embryos, including lethality at several developmental timepoints and ~30% of null embryos survived to adulthood (Murphy et al., 2018). In Anp32e deficient embryos, H2A.Z localization expanded surrounding promoters leading to epigenetic defects during zygotic genome activation (Murphy et al., 2018). We therefore speculated that the observed H2A.Z accumulation during gastrulation might have been the result of normal Anp32e loss during embryonic differentiation. Along these lines, we found that anp32e gene expression levels decreased nearing the end of gastrulation, unlike expression of h2afva or h2afvb (Fig. 3E). Furthermore, CUT&Tag measurements revealed that high levels of Anp32e occurred over the majority of promoters during early gastrulation (shield stage), but levels were reduced by somitogenesis (5-6SS), encompassing the end of gastrulation (Fig. S3B). As anticipated, similar changes in Anp32e levels were observed for gastrula-specific regions classified as promoters, but not for regions classified as non-promoters, which maintained low levels of Anp32e (Figs. 3F & 3G). We also found that Anp32e levels were significantly higher over promoters containing a Sox motif, compared with promoters lacking a motif, and Anp32e levels decreased over these promoters during gastrulation (Fig. 3H & 3I). To investigate the extent to which Anp32e might restrict H2A.Z accumulation, we next analyzed H2A.Z enrichment in embryos lacking Anp32e (at shield stage). Loss of Anp32e led to an overall increase in H2A.Z levels over promoters (Fig. S3C), as well as across all previously defined classes of chromatin accessibility (Fig. 3J). Despite only a modest change in average levels (Fig. 3K), overall distribution measurements indicated that H2A.Z levels increased specifically for promoters containing a Sox motif (Fig. 3L). Taken together, these results suggest that Anp32e functions to restrict H2A.Z accumulation during the earliest stages of zebrafish development, spanning cleavage stage, MZT, and blastula, and then, during subsequent stages of gastrulation, decreases in Anp32e levels allow H2A.Z to accumulate over gene promoters, with sites containing Sox motifs being most affected.
Anp32e loss leads to precocious developmental transcription of Sox-motif associated genes
To assess which Sox factors might be impacted by developmental accumulation of H2A.Z, we next investigated the expression patterns for a series of genes encoding Sox factors, with the expectation that particular factors might be coincidently upregulated during gastrulation. Indeed, analysis of publicly available datasets (White et al., 2017) revealed there to be two separate patterns of sox gene expression, one in which expression was strongest at gastrulation (max RPKM > 100), referred to as “early expressed” and another in which expression was strongest during somitogenesis, referred to as “late expressed” (Fig. S4A). Early expressed factors included sox2, sox3, sox19a, and sox19b, whereas late expressed factors included sox9b, sox10, sox21a, and sox21b. We next examined genomic binding patterns for a subset of these factors, (Sox2, Sox3, and Sox10) using publicly available ChIP-Seq datasets (Kaufman et al., 2016; Leichsenring et al., 2013; Santos-Pereira et al., 2019). As anticipated, enrichment for Sox2, Sox3, and Sox10 was stronger over promoters containing a Sox motif compared with promoters lacking a Sox motif (Fig. S4B & S4C), and binding patterns for Sox3 were particularly noteworthy. Much like H2A.Z binding patterns, Sox3 enrichment increased significantly between gastrulation and somitogenesis (Fig. S4C, 3C, 3D), with the highest enrichment occurring over Sox motif containing promoters. The degree to which H2A.Z and/or Anp32e influence these patterns thus warrants further investigation.
Prior studies have reported that increases in H2A.Z levels over promoters corresponds with increased gene expression (Giaimo et al., 2019; Subramanian et al., 2015), leading us to speculate that presence of Anp32e may help to dampen transcription by restricting H2A.Z accumulation (Mao et al., 2014; Murphy et al., 2020; Obri et al., 2014). Based on the observed enrichment for Sox motifs at H2A.Z bound regions, and the noted correlation with Sox factor binding patterns, we next speculated that transcription at Sox motif containing promoters may be particularly sensitive to changes in Anp32e levels. To investigate this possibility, we reanalyzed published RNA-Seq data and compared expression patterns from anp32e null embryos with expression patterns at other developmental timepoints, both before and after the transition from blastula to gastrula. To minimize expression differences caused by batch-to-batch variation, we rank normalized gene expression levels and performed Principal Components (PC) Analysis. Strikingly, most identified sample-to-sample variation occurred along PC2, as compared with PC1 (Fig. 4A), and datasets aligned vertically along PC2 according to developmental stage (y-axis in Fig. 4A). Samples from embryos prior to MZT had the highest PC2 scores whereas samples from gastrula embryos had the lowest PC2 scores. Interestingly, samples from blastula stage embryos lacking Anp32e (shield anp32e−/−) were positioned lower along PC2 (y-axis in Fig. 4A) relative to control samples, and closer to 5-6SS samples, indicative of a modest developmental advancement in transcriptional patterns.
Figure 4: Anp32e loss leads to precocious developmental transcription of Sox-motif associated genes.

A. PCA of a time course of rank normalized WT RNA-seq data for 1-cell, 256-cell, Shield, and 5-6SS, as well as anp32e−/− at shield stage (Shield anp32e−/− ).
B. Heatmap of data underlying PCA analysis (k-means=10). Columns are grouped by sample. Rows are grouped by k-means clustering. Shield anp32e−/− for C1 and C6 show the clearest differences in expression.
C. Boxplots of rank normalized RNA-seq of identified clusters. C6 Shield anp32e−/− increase slightly to approach the expression levels of 5-6SS embryos, and C1 Shield anp32e−/− decrease. One-tailed t-tests were used to establish that Shield anp32e−/− expression levels increase or decrease compared to Shield (p<0.001).
D. RPKM of genes within C1 or C6. Trends identified in clusters are maintained in the absence of rank-normalization (p<0.001).
E. A list of C6 GO terms. Redundant GO terms were removed and a cutoff of >=5 was set for −log10(p-value).
F. Fraction of promoters containing one or more Sox motif in C6 versus all other genes. Fischer’s exact test and odds-ratio quantify difference of Sox and non-Sox fractions across gene set promoters.
G. A selection of C6 genes. Fold-change of H2A.Z (12hpf/6hpf), Anp32e (12hpf/6hpf), and H2A.Z anp32e−/− /WT) are quantified at corresponding promoters. Promoters are marked for the presence of an embedded or adjacent Sox motif.
H. A model for Sox-specific developmental regulation of H2A.Z by Anp32e is depicted. High Anp32e levels at the beginning of gastrulation prevent H2A.Z accumulation, thus maintaining transcriptional silencing at sox-motif-containing promoters, and developmental downregulation of Anp32e leads to H2A.Z accumulation, and neighboring gene upregulation.
We next performed unbiased K-means clustering analysis in order to parse genes into clusters based on differences in expression patterns. Similar to our PC analysis, samples organized according to their developmental stage, and several discrete clusters of expression changes emerged (Fig. 4B). Initial comparison of early gastrula stage (6 hours post fertilization) WT and Anp32e deficient embryos revealed there to be little differences between sample types, aligning with prior reports of modest phenotypic differences at this timepoint (Murphy et al., 2018). We did, however, detect differences in expression within two clusters — including C1, which exhibited reduced expression as compared with WT, and C6, which exhibited increased expression (Fig. 4C & 4D). GO analysis revealed there to be no significant ontology terms for genes within C1, but for C6, several developmentally important ontology terms emerged, including Anatomical Structure Development, Nervous System Development, and Cell Differentiation (Fig. 4E). Based on the observed specificity for H2A.Z accumulation at Sox-motif-containing regions noted previously (Figs 2 and 3), we next assessed enrichment for Sox motifs. Analogous to our H2A.Z measurements, Sox motifs were found to be enriched within cluster C6 gene promoters (p<10−16, odds ratio = 2.2), but not within C1 gene promoters (Fig. 4F). Further comparison of selected genes indicated that numerous Sox motif containing genes within C6 gained H2A.Z and lost Anp32e during gastrulation, and these same genes precociously gain H2A.Z in blastula stage embryos lacking Anp32e (Fig. 4G).
Genome-wide analyses of epigenetic and transcription outcomes revealed analogous changes in H2A.Z occurred broadly across all Sox motif containing promoters within anp32e mutant embryos. For example, the majority of promoters which contained a Sox motif and acquired H2A.Z during gastrulation (log2FC > 0.5) (1297 loci) also acquired H2A.Z in the absence of Anp32e (858 loci). This was not the case for promoters lacking a Sox motif (Fig. S4D & S4E). Likewise, among promoters which lost Anp32e during gastrulation (log2FC < −0.5), those containing a Sox motif (1018 loci) tended to acquire H2A.Z in absence of Anp32e (650 loci), a trend not detected for promoters lacking a sox motif (Fig. S4E & S4F). Similar analyses of RNA-Seq data indicated that gene expression changes were more broad, and not specific to Sox motif containing promoters. Regardless of Sox motif presence, changes in gene expression in Anp32e deficient embryos were moderately correlated with the expression patterns which normally occur during gastrulation (Fig. S4G), indicative of a modest acceleration in developmental progression, mirroring our PCA analysis (Fig. 4A). Taken together, these data provide compelling evidence for a common regulatory mechanism in which Anp32e binding at the promoters of Sox motif containing genes protects against H2A.Z accumulation in blastula stage embryos, and subsequent developmental loss of Anp32e (during gastrulation) leads to a buildup of H2A.Z and transcriptional upregulation (Fig. 4H).
Discussion
Proper control of chromatin state is crucial for regulation of gene expression programs, which is essential for embryonic development and subsequent lineage diversification. In this work, we demonstrate that Anp32e binding at Sox motif containing promoters prevents H2A.Z accumulation at blastula stage. We find that anp32e expression decreases as embryos further develop into gastrula stage, concurrent with H2A.Z accumulation at promoters, increases in chromatin accessibility, and activation of genes associated with early development. Strikingly, Anp32e loss leads to H2A.Z accumulation and precocious developmental transcription of Sox-motif associated genes, further highlighting the importance of Anp32e and H2A.Z in regulating developmental gene expression programs. Thus, precise control of level and localization of Anp32e and H2A.Z offer an intriguing mode for the governance of developmental programs in early embryos.
Here we show that Sox motifs are enriched within the genomic loci where chromatin accessibility and H2A.Z enrichment changes occur, suggesting that H2A.Z localization may be particularly important for the function of certain transcription factors or the development of certain cell types. It was previously shown that H2A.Z is a central component in regulation of zygotic genome activation, both in zebrafish and Drosophila embryos (Ibarra-Morales et al., 2021; Murphy et al., 2018). Interestingly, the Sox family transcription factor Sox19b, along with Nanog and Pou5f1, is also critical for zygotic gene activation in zebrafish (Lee et al., 2013; Leichsenring et al., 2013). One noteworthy possibility is that H2A.Z patterning might help to support Sox19b binding during zygotic genome activation, much like the mechanism we propose here. Recent studies also indicate that mammalian SOX9 alters chromatin landscape by binding to regions containing H2A.Z, potentially facilitating chromatin accessibility and activating histone modifications during development (Fuglerud et al., 2022). Thus, it would be interesting in future studies to examine whether similar mechanisms contribute to Sox factor function during developmental progression, as well as in the context of Anp32e dynamics.
Interestingly, Sox factors are well established to be key players in the speciation and differentiation of a highly specialize vertebrate cell type, termed neural crest cells (NCCs). These cells acquire multipotency after gastrulation during development, allowing them to differentiate into a wide range of embryonic cell types, including cardiomyocytes, cartilages, melanocytes, and neurons (Martik and Bronner, 2017). In the context of our study, one interesting possibility is that NCC development might be particularly sensitive to H2A.Z changes, potentially via disruption of Sox factors. Indeed, H2A.Z has been previously shown to be important for the development of NC-derived melanocytes in zebrafish (Raja et al., 2020), and mutations in the H2A.Z installation machinery (Greenberg et al., 2019), or disruption of H2A.Z interacting factors PWWP2A and HMG20A (Herchenröther et al., 2023; Pünzeler et al., 2017), leads to impairment of in NCC-derived tissues, including craniofacial cartilages in Xenopus Leavis. In the context of our study, these results suggest that specific transcription factors are critically important for NCC development, and H2A.Z enrichment might be particularly important for the function of these factors. Additionally, it is quite possible that acquisition of multipotency in NCCs requires extensive chromatin remodeling and this process depends on extensive H2A.Z changes. Evidently, future studies are necessary to examine the genomic dynamics of H2A.Z during NCC development, and its function with respect to Sox factors.
Often times, developmentally important molecular and genetic mechanisms can become reactivated or dysregulated during disease formation. For example, Sox factors, which have been found to be key regulators of adult stem cell populations, can be hijacked to promote tumor formation during carcinogenesis (Sarkar and Hochedlinger, 2013). Interestingly, recent studies have implicated a role for Anp32e and H2A.Z in multiple types of cancer, including uterine leiomyoma and breast cancer (Berta et al., 2021; G. Ruff et al., 2021). In this context, the model that we propose here, whereby Anp32e and H2A.Z impact transcription factor activity and cell state transition during embryogenesis, may also influence these cancers. Indeed, we previously demonstrated that chromatin accessibility at FOX motifs is associated with breast cancer progression, and is negatively associated with ANP32E expression levels, suggesting that ANP32E might restrict chromatin changes during breast tumorigenesis (G. Ruff et al., 2021) – perhaps in a manner similar to the mechanism we describe here. In this light, the outcomes of this current study may provide novel insights into mechanisms controlling cellular programming during disease onset and/or progression.
Methods
Zebrafish husbandry:
Adult wild type Tübingen zebrafish were maintained on a 14h:10h light:dark cycle. Zebrafish husbandry and care were conducted in full accordance with animal care and use guidelines with ethical approval by the University Committee on Animal Resources at the University of Rochester Medical Center. Experimental samples were early zebrafish embryos ranged from 0hpf to 12hpf.
Genomic profiling by CUT&Tag:
6hpf and 12hpf H2A.Z and Anp32e genomic localization data were collected using Epicypher CUT&Tag protocol and library generation followed by Illumina paired-end sequencing. Briefly, embryos were collected and manually dechorionated, dissociated by pipetting and nuclei were extracted and collected. Around 100,000 nuclei were used for each replicate, Polyclonal H2A.Z antibody (Active motif, Cat. No 39113, 1:50 dilution) and Anp32e antibody (ThermoFisher Scientific Cat. No PA5-42860, 1:50 dilution) were used for CUT&Tag.
Alignment, normalization, and peak-calling:
For ChIP-seq, CUT&Tag, and ATAC-seq, fastq files were aligned to Zv11 using Bowtie2 (v2.2.5). Aligned .sam files were converted to .bam files using Picard sortsam. PCR duplicates were removed upon read count (RPKM) normalization and conversion to bigwig. This was done in one step using the deeptools application, bamCoverage. Peaks were called using MACS2 (v2.1.4) bdgpeakcall (-c 20 -g 100 -l 100) for ChIP-seq and ATAC-seq. All peak and promoter annotation set manipulations were performed using the bedtools (v2.30) suite. Bedtools intersect was used, where intersecting peaks are called with any amount of overlap. The ‘-v’ flag was used to derive non-intersecting intervals. For analyses in figure 3, Sox promoters were generated by intersecting a Zv11 promoter table with Sox motifs. Overlapping intervals from resultant Sox and nonSox promoter sets were merged using bedtools merge to ensure non-redundant promoter sets.
Gene Ontologies (GO):
GO analyses were performed using g:Profiler using default significance threshold. Bed files of any given feature set were inputted and associated with TSS of the nearest gene, matching genomic intervals to gene sets. Subsequently, functional enrichment analysis was performed.
Accessibility analyses:
Peaks were called on each individual ATAC-seq replicate before concatenating and merging any overlapping intervals between replicates. These peaks were first rank-normalized by sample and then variance sorted across genomic features, where features with the greatest variance in rank-normalized accessibility were selected. Upon clustering by accessibility trends across time, further analysis of these peaks was carried out in the absence of rank-normalization.
Motif analyses:
All motif analysis was performed using HOMER (v4.10). findMotifs.pl was used to identify enriched motifs within provided genomic features. Motifs identified in epiboly-specific putative CREs were defined against a background of dome-specific putative CREs. Motifs were defined against a union of all accessible regions comprising the timecourse. scanMotifGenomeWide.pl was used to query Zv11 for genomic intervals matching our selected Sox motif file (http://homer.ucsd.edu/homer/motif/HomerMotifDB/homerResults/motif335.motif). For Sox motif scan in figure S2C and S2D, log-odds detection threshold was retained at the default setting, but for motif scan in figure 2E, log-odds detection threshold was increased to 10 to generate a high confidence motif set. Identified Sox motifs were intersected with a union of all accessible regions before further analysis.
Transcriptomic analyses:
All RNA-seq data were aligned and directly converted to duplicate-removed, RPKM-normalized .bam files using rnaSTAR (v2.7.8). Except where indicated, data were rank-normalized within samples to account for batch-to-batch variation and enable comparison across developmental time between studies. For RNA-seq scatterplots, samples were rank-normalized and compared using a rank-change (X/Y) metric. Rank-change (X/Y) was calculated by subtracting each index in vector X (1,2…N) from the corresponding index in vector Y, where each index contains a gene-expression value. Correlation values were generated using base R statistical software.
CUT&Tag Fold-change and Thresholding:
Fold-change values were calculated using a pseudocount of 1. Fold-change cut-off values were set at ±0.5 for Sox and nonSox CUT&Tag scatterplots. For boxplots, Sox and nonSox promoters were considered only if their H2A.Z 2LFC values exceeded 1 or if their Anp32e 2LFC values fell below −1.
Plotting:
Heatmaps and genomic averages were generated using deeptools (v3.5.1) plotHeatmap and plotProfile. All plots of promoters include promoter direction oriented left to right. R packages used for data parsing and visualization include dplyr, pheatmap, UMAP, and ggplot2. Boxplots were generated using standard R (v4.2.2). All figures were adjusted and polished in Affinity Designer.
Statistical Methods:
One-sided students t-tests with R statistical software were used to determine statistical significance between boxplot means with a cutoff of p<=0.05 for all normally distributed data. Wilcoxon rank tests (non-parametric) were used for distributions that were non-normal. Data normality was evaluated using the Shapiro-Wilk test. Coding p-values for boxplot comparisons: *; **; *** for p<=0.05; p<=0.01; p<0.001.
Data Availability:
All sequencing datasets generated in this study were deposited to GEO data repository (GSE237444) with reviewer token as upcvuasebbizvev.
Supplementary Material
Key Resources Table
Highlights.
An early-developmental time course of zebrafish chromatin accessibility is achieved using an integrated UMAP analysis of datasets from two separate published studies.
CUT&Tag sequencing is used to characterize the genomic localization for the histone chaperone Anp32e.
Changes in Anp32e enrichment coincide with opposing changes in H2A.Z enrichment during zebrafish gastrulation.
Precocious transcription occurs in embryos lacking Anp32e, including many genes which possess Sox factor motifs and acquire H2A.Z, indicative of an H2A.Z-mediated developmental acceleration.
Acknowledgements
We would like to thank everyone in the Murphy lab for helpful discussions. This work was supported by the NIH (R35GM137833 and R01HD105489 to P.J.M) and University of Rochester De Kiewet fellowship (to F.N.H).
Footnotes
Publisher's Disclaimer: This is a PDF file of an unedited manuscript that has been accepted for publication. As a service to our customers we are providing this early version of the manuscript. The manuscript will undergo copyediting, typesetting, and review of the resulting proof before it is published in its final form. Please note that during the production process errors may be discovered which could affect the content, and all legal disclaimers that apply to the journal pertain.
Declarations of interest
None.
References
- Akdogan-Ozdilek B, Duval KL, Meng FW, Murphy PJ, Goll MG, 2022. Identification of chromatin states during zebrafish gastrulation using CUT&RUN and CUT&Tag. Developmental Dynamics 251, 729–742. 10.1002/dvdy.430 [DOI] [PMC free article] [PubMed] [Google Scholar]
- Bannister AJ, Kouzarides T, 2011. Regulation of chromatin by histone modifications. Cell Res 21, 381–395. 10.1038/cr.2011.22 [DOI] [PMC free article] [PubMed] [Google Scholar]
- Berta D, Kuisma H, Välimäki N, Räisänen M, Jäntti M, Pasanen A, Karhu A, Kaukomaa J, Taira A, Cajuso T, Nieminen S, Penttinen R-M, Ahonen S, Lehtonen R, Mehine M, Vahteristo P, Jalkanen J, Sahu B, Ravantti J, Mäkinen N, Rajamäki K, Palin K, Taipale J, Heikinheimo O, Butzow R, Kaasinen E, Aaltonen L, 2021. Deficient H2A.Z deposition is assoicated with genesis of uterine leiomyona. Nature 596, 398–403. [DOI] [PubMed] [Google Scholar]
- Bogdanovic O, Fernandez-Miñán A, Tena JJ, de la Calle-Mustienes E, Hidalgo C, van Kruysbergen I, van Heeringen SJ, Veenstra GJC, Gómez-Skarmeta JL, 2012. Dynamics of enhancer chromatin signatures mark the transition from pluripotency to cell specification during embryogenesis. Genome Res 22, 2043–2053. 10.1101/gr.134833.111 [DOI] [PMC free article] [PubMed] [Google Scholar]
- Brunelle M, Nordell Markovits A, Rodrigue S, Lupien M, Jacques P-É, Gévry N, 2015. The histone variant H2A.Z is an important regulator of enhancer activity. Nucleic Acids Res 43, 9742–9756. 10.1093/nar/gkv825 [DOI] [PMC free article] [PubMed] [Google Scholar]
- Cusanovich DA, Reddington JP, Garfield DA, Daza RM, Aghamirzaie D, Marco-Ferreres R, Pliner HA, Christiansen L, Qiu X, Steemers FJ, Trapnell C, Shendure J, Furlong EEM, 2018. The cis-regulatory dynamics of embryonic development at single-cell resolution. Nature 555, 538–542. 10.1038/nature25981 [DOI] [PMC free article] [PubMed] [Google Scholar]
- Dijkwel Y, Tremethick DJ, 2022. The Role of the Histone Variant H2A.Z in Metazoan Development. J Dev Biol 10, 28. 10.3390/jdb10030028 [DOI] [PMC free article] [PubMed] [Google Scholar]
- Dobin A, Davis CA, Schlesinger F, Drenkow J, Zaleski C, Jha S, Batut P, Chaisson M, Gingeras TR, 2013. STAR: ultrafast universal RNA-seq aligner. Bioinformatics 29, 15–21. 10.1093/bioinformatics/bts635 [DOI] [PMC free article] [PubMed] [Google Scholar]
- Fuglerud BM, Drissler S, Lotto J, Stephan TL, Thakur A, Cullum R, Hoodless PA, 2022. SOX9 reprograms endothelial cells by altering the chromatin landscape. Nucleic Acids Research 50, 8547–8565. 10.1093/nar/gkac652 [DOI] [PMC free article] [PubMed] [Google Scholar]
- Giaimo BD, Ferrante F, Herchenröther A, Hake SB, Borggrefe T, 2019. The histone variant H2A.Z in gene regulation. Epigenetics & Chromatin 12, 37. 10.1186/s13072-019-0274-9 [DOI] [PMC free article] [PubMed] [Google Scholar]
- Gibney ER, Nolan CM, 2010. Epigenetics and gene expression. Heredity 105, 4–13. 10.1038/hdy.2010.54 [DOI] [PubMed] [Google Scholar]
- Greenberg RS, Long HK, Swigut T, Wysocka J, 2019. Single Amino Acid Change Underlies Distinct Roles of H2A.Z Subtypes in Human Syndrome. Cell 178, 1421–1436.e24. 10.1016/j.cell.2019.08.002 [DOI] [PMC free article] [PubMed] [Google Scholar]
- Heinz S, Benner C, Spann N, Bertolino E, Lin YC, Laslo P, Cheng JX, Murre C, Singh H, Glass CK, 2010. Simple combinations of lineage-determining transcription factors prime cis-regulatory elements required for macrophage and B cell identities. Mol Cell 38, 576–589. 10.1016/j.molcel.2010.05.004 [DOI] [PMC free article] [PubMed] [Google Scholar]
- Henikoff S, 2008. Nucleosome destabilization in the epigenetic regulation of gene expression. Nat Rev Genet 9, 15–26. 10.1038/nrg2206 [DOI] [PubMed] [Google Scholar]
- Henikoff S, Smith MM, 2015. Histone Variants and Epigenetics. Cold Spring Harb Perspect Biol 7, a019364. 10.1101/cshperspect.a019364 [DOI] [PMC free article] [PubMed] [Google Scholar]
- Herchenröther A, Gossen S, Friedrich T, Reim A, Daus N, Diegmüller F, Leers J, Sani HM, Gerstner S, Schwarz L, Stellmacher I, Szymkowiak LV, Nist A, Stiewe T, Borggrefe T, Mann M, Mackay JP, Bartkuhn M, Borchers A, Lan J, Hake SB, 2023. The H2A.Z and NuRD associated protein HMG20A controls early head and heart developmental transcription programs. Nat Commun 14, 472. 10.1038/s41467-023-36114-x [DOI] [PMC free article] [PubMed] [Google Scholar]
- Ibarra-Morales D, Rauer M, Quarato P, Rabbani L, Zenk F, Schulte-Sasse M, Cardamone F, Gomez-Auli A, Cecere G, Iovino N, 2021. Histone variant H2A.Z regulates zygotic genome activation. Nat Commun 12, 7002. 10.1038/s41467-021-27125-7 [DOI] [PMC free article] [PubMed] [Google Scholar]
- Kaufman CK, Mosimann C, Fan ZP, Yang S, Thomas AJ, Ablain J, Tan JL, Fogley RD, van Rooijen E, Hagedorn EJ, Ciarlo C, White RM, Matos DA, Puller A-C, Santoriello C, Liao EC, Young RA, Zon LI, 2016. A zebrafish melanoma model reveals emergence of neural crest identity during melanoma initiation. Science 351, aad2197. 10.1126/science.aad2197 [DOI] [PMC free article] [PubMed] [Google Scholar]
- Kimmel CB, Ballard WW, Kimmel SR, Ullmann B, Schilling TF, 1995. Stages of embryonic development of the zebrafish. Developmental Dynamics 203, 253–310. 10.1002/aja.1002030302 [DOI] [PubMed] [Google Scholar]
- Kolde R, 2019. pheatmap: Pretty Heatmaps.
- Langmead B, Salzberg SL, 2012. Fast gapped-read alignment with Bowtie 2. Nat Methods 9, 357–359. 10.1038/nmeth.1923 [DOI] [PMC free article] [PubMed] [Google Scholar]
- Lee MT, Bonneau AR, Takacs CM, Bazzini AA, DiVito KR, Fleming ES, Giraldez AJ, 2013. Nanog, Pou5f1 and SoxB1 activate zygotic gene expression during the maternal-to-zygotic transition. Nature 503, 360–4. 10.1038/nature12632 [DOI] [PMC free article] [PubMed] [Google Scholar]
- Leichsenring M, Maes J, Mössner R, Driever W, Onichtchouk D, 2013. Pou5f1 Transcription Factor Controls Zygotic Gene Activation In Vertebrates. Science 341, 1005–1009. 10.1126/science.1242527 [DOI] [PubMed] [Google Scholar]
- Li H, Handsaker B, Wysoker A, Fennell T, Ruan J, Homer N, Marth G, Abecasis G, Durbin R, 1000 Genome Project Data Processing Subgroup, 2009. The Sequence Alignment/Map format and SAMtools. Bioinformatics 25, 2078–2079. 10.1093/bioinformatics/btp352 [DOI] [PMC free article] [PubMed] [Google Scholar]
- Lukoseviciute M, Gavriouchkina D, Williams RM, Hochgreb-Hagele T, Senanayake U, Chong-Morrison V, Thongjuea S, Repapi E, Mead A, Sauka-Spengler T, 2018. From Pioneer to Repressor: Bimodal foxd3 Activity Dynamically Remodels Neural Crest Regulatory Landscape In Vivo. Developmental Cell 47, 608–628.e6. 10.1016/j.devcel.2018.11.009 [DOI] [PMC free article] [PubMed] [Google Scholar]
- Mao Z, Pan L, Wang W, Sun J, Shan S, Dong Q, Liang X, Dai L, Ding X, Chen S, Zhang Z, Zhu B, Zhou Z, 2014. Anp32e, a higher eukaryotic histone chaperone directs preferential recognition for H2A.Z. Cell Res 24, 389–399. 10.1038/cr.2014.30 [DOI] [PMC free article] [PubMed] [Google Scholar]
- Martik M, Bronner M, 2017. Regulatory Logic Underlying Diversification of the Neural Crest. Trends Genet. 33, 715–727. [DOI] [PMC free article] [PubMed] [Google Scholar]
- McInnes L, Healy J, Saul N, Großberger L, 2018. UMAP: Uniform Manifold Approximation and Projection. Journal of Open Source Software 3, 861. 10.21105/joss.00861 [DOI] [Google Scholar]
- Meng FW, Murphy KE, Makowski CE, Delatte B, Murphy PJ, 2023. Competition for H2A.Z underlies the developmental impacts of repetitive element de-repression. Development 150, dev202338. 10.1242/dev.202338 [DOI] [PMC free article] [PubMed] [Google Scholar]
- Murphy KE, Meng FW, Makowski CE, Murphy PJ, 2020. Genome-wide chromatin accessibility is restricted by ANP32E. Nat Commun 11, 5063. 10.1038/s41467-020-18821-x [DOI] [PMC free article] [PubMed] [Google Scholar]
- Murphy PJ, Wu SF, James CR, Wike CL, Cairns BR, 2018. Placeholder Nucleosomes Underlie Germline-to-Embryo DNA Methylation Reprogramming. Cell 172, 993–1006.e13. 10.1016/j.cell.2018.01.022 [DOI] [PubMed] [Google Scholar]
- Obri A, Ouararhni K, Papin C, Diebold M-L, Padmanabhan K, Marek M, Stoll I, Roy L, Reilly PT, Mak TW, Dimitrov S, Romier C, Hamiche A, 2014. ANP32E is a histone chaperone that removes H2A.Z from chromatin. Nature 505, 648–653. 10.1038/nature12922 [DOI] [PubMed] [Google Scholar]
- Pálfy M, Schulze G, Valen E, Vastenhouw NL, 2020. Chromatin accessibility established by Pou5f3, Sox19b and Nanog primes genes for activity during zebrafish genome activation. PLOS Genetics 16, e1008546. 10.1371/journal.pgen.1008546 [DOI] [PMC free article] [PubMed] [Google Scholar]
- Pijuan-Sala B, Wilson NK, Xia J, Hou X, Hannah RL, Kinston S, Calero-Nieto FJ, Poirion O, Preissl S, Liu F, Göttgens B, 2020. Single-cell chromatin accessibility maps reveal regulatory programs driving early mouse organogenesis. Nat Cell Biol 22, 487–497. 10.1038/s41556-020-0489-9 [DOI] [PMC free article] [PubMed] [Google Scholar]
- Pünzeler S, Link S, Wagner G, Keilhauer E, Kronbeck N, Spitzer R, Leidescher S, Markaki Y, Mentele E, Regnard C, Schneider K, Takahashi D, Kusakabe M, Vardabasso C, Zink L, Straub T, Bernstein E, Harata M, Leonhardt H, Mann M, Rupp R, Hake S, 2017. Mutivalent binding of PWWP2A to H2A.Z regulates mitosis and neural crest differntiation. EMBO 36, 2263–2279. [DOI] [PMC free article] [PubMed] [Google Scholar]
- Quinlan AR, Hall IM, 2010. BEDTools: a flexible suite of utilities for comparing genomic features. Bioinformatics 26, 841–842. 10.1093/bioinformatics/btq033 [DOI] [PMC free article] [PubMed] [Google Scholar]
- Raja DA, Subramaniam Y, Aggarwal A, Gotherwal V, Babu A, Tanwar J, Motiani RK, Sivasubbu S, Gokhale RS, Natarajan VT, 2020. Histone variant dictates fate biasing of neural crest cells to melanocyte lineage. Development 147, dev182576. 10.1242/dev.182576 [DOI] [PubMed] [Google Scholar]
- Ramírez F, Dündar F, Diehl S, Grüning BA, Manke T, 2014. deepTools: a flexible platform for exploring deep-sequencing data. Nucleic Acids Research 42, W187–W191. 10.1093/nar/gku365 [DOI] [PMC free article] [PubMed] [Google Scholar]
- Raudvere U, Kolberg L, Kuzmin I, Arak T, Adler P, Peterson H, Vilo J, 2019. g:Profiler: a web server for functional enrichment analysis and conversions of gene lists (2019 update). Nucleic Acids Research 47, W191–W198. 10.1093/nar/gkz369 [DOI] [PMC free article] [PubMed] [Google Scholar]
- Robinson JT, Thorvaldsdóttir H, Winckler W, Guttman M, Lander ES, Getz G, Mesirov JP, 2011. Integrative Genomics Viewer. Nat Biotechnol 29, 24–26. 10.1038/nbt.1754 [DOI] [PMC free article] [PubMed] [Google Scholar]
- Rougeot J, Chrispijn ND, Aben M, Elurbe DM, Andralojc KM, Murphy PJ, Jansen PWTC, Vermeulen M, Cairns BR, Kamminga LM, 2019. Maintenance of spatial gene expression by Polycomb-mediated repression after formation of a vertebrate body plan. Development 146, dev178590. 10.1242/dev.178590 [DOI] [PMC free article] [PubMed] [Google Scholar]
- Ruff GL, Murphy KE, Smith ZR, Vertino PM, Murphy PJ, 2021. Subtype-Independent ANP32E Reduction During Breast Cancer Progression in Accordance with Chromatin Relaxation. BMC Cancer 21, 1342. 10.1186/s12885-021-09077-9 [DOI] [PMC free article] [PubMed] [Google Scholar]
- Santos-Pereira JM, Gallardo-Fuentes L, Neto A, Acemel RD, Tena JJ, 2019. Pioneer and repressive functions of p63 during zebrafish embryonic ectoderm specification. Nat Commun 10, 3049. 10.1038/s41467-019-11121-z [DOI] [PMC free article] [PubMed] [Google Scholar]
- Sarkar A, Hochedlinger K, 2013. The Sox Family of Transcription Factors: Versatile Regulators of Stem and Progenitor Cell Fate. Cell Stem Cell 12, 15–30. 10.1016/j.stem.2012.12.007 [DOI] [PMC free article] [PubMed] [Google Scholar]
- Schock EN, LaBonne C, 2020. Sorting Sox: Diverse Roles for Sox Transcription Factors During Neural Crest and Craniofacial Development. Frontiers in Physiology 11. [DOI] [PMC free article] [PubMed] [Google Scholar]
- Subramanian V, Fields PA, Boyer LA, 2015. H2A.Z: a molecular rheostat for transcriptional control. F1000Prime Rep 7. 10.12703/P7-01 [DOI] [PMC free article] [PubMed] [Google Scholar]
- Wang Y, Long H, Yu J, Dong L, Wassef M, Zhuo B, Li X, Zhao J, Wang M, Liu C, Wen Z, Chang L, Chen P, Wang Q, Xu X, Margueron R, Li G, 2018. Histone variants H2A.Z and H3.3 coordinately regulate PRC2-dependent H3K27me3 deposition and gene expression regulation in mES cells. BMC Biology 16, 107. 10.1186/s12915-018-0568-6 [DOI] [PMC free article] [PubMed] [Google Scholar]
- White RJ, Collins JE, Sealy IM, Wali N, Dooley CM, Digby Z, Stemple DL, Murphy DN, Billis K, Hourlier T, Füllgrabe A, Davis MP, Enright AJ, Busch-Nentwich EM, 2017. A high-resolution mRNA expression time course of embryonic development in zebrafish. eLife 6, e30860. 10.7554/eLife.30860 [DOI] [PMC free article] [PubMed] [Google Scholar]
- Wickham H, 2016. ggplot2, Use R! Springer International Publishing, Cham. 10.1007/978-3-319-24277-4 [DOI] [Google Scholar]
- Wickham H, François R, Henry L, Müller K, Vaughan D, Software P, PBC, 2023. dplyr: A Grammar of Data Manipulation. [Google Scholar]
- Zhang Y, Liu T, Meyer CA, Eeckhoute J, Johnson DS, Bernstein BE, Nusbaum C, Myers RM, Brown M, Li W, Liu XS, 2008. Model-based Analysis of ChIP-Seq (MACS). Genome Biology 9, R137. 10.1186/gb-2008-9-9-r137 [DOI] [PMC free article] [PubMed] [Google Scholar]
Associated Data
This section collects any data citations, data availability statements, or supplementary materials included in this article.
Supplementary Materials
Data Availability Statement
All sequencing datasets generated in this study were deposited to GEO data repository (GSE237444) with reviewer token as upcvuasebbizvev.