

Summary
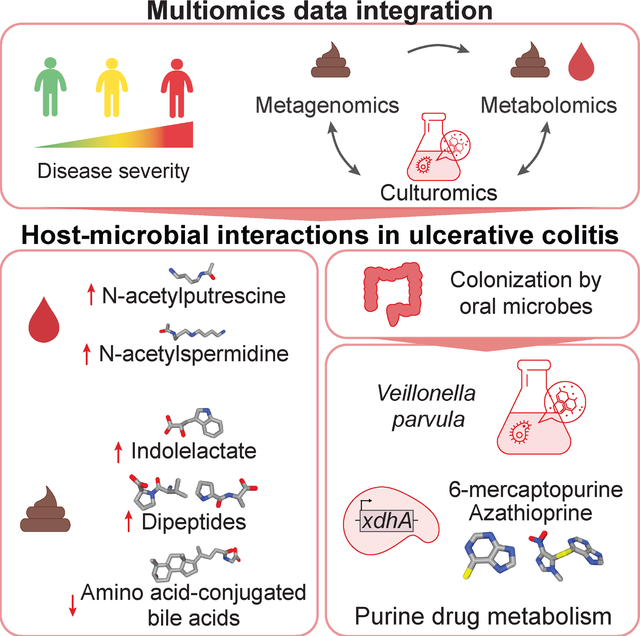
Understanding the role of the microbiome in inflammatory diseases requires identification of microbial effector molecules. We established an approach to link disease-associated microbes to microbial metabolites by integrating paired metagenomics, stool and plasma metabolomics and culturomics. We identified host-microbial interactions correlated with disease activity, inflammation and the clinical course of ulcerative colitis (UC) in the PROTECT pediatric inception cohort. In severe disease, metabolite changes included increased dipeptides and tauro-conjugated bile acids and decreased amino-acid conjugated bile acids in stool, while in plasma polyamines N-acetylputrescine and N1-acetylspermidine increased. Using patient samples and Veillonella parvula as a model, we uncovered nitrate- and lactate-dependent metabolism, experimentally linking V. parvula expansion to immunomodulatory tryptophan metabolite production. Additionally, V. parvula metabolizes immunosuppressive thiopurine drugs through xdhA xanthine dehydrogenase, potentially impairing the therapeutic response. Our findings demonstrate that the microbiome contributes to disease-associated metabolite changes, underscoring the importance of these interactions in disease pathology and treatment.
eTOC Blurb
Schirmer et al. use integrated analyses of metagenomics, metabolomics and culturomics data to identify microbial metabolites and host-microbial interactions implicated in the disease course of pediatric ulcerative colitis. Changes in gut microbial abundances were linked to the production of immunoregulatory metabolites and microbe-drug interactions, potentially impacting therapeutic efficacy.
Graphical Abstract:
Introduction
Microbiota changes are implicated in inflammatory and autoimmune diseases. Metabolites mediate host-microbiota communication, but linking microbes to disease-associated molecules and host health remains a major challenge. To establish mechanistic connections between microbiome-derived molecular effectors and disease, we need to (1) identify disease-associated microbes and strains, (2) link them to metabolite disruptions in the patient and (3) determine how they mediate host pathology at different disease stages.
A number of studies have investigated the interplay between microbes, metabolites, and host biology. Genetic risk loci for inflammatory bowel disease (IBD), characterized by chronic intermittent gastrointestinal inflammation, contribute to microbiome disruptions and immune infiltration prior to symptom onset1. Bacteria, their enzymes and metabolites impact immune system development, host nutrition, disease progression and drug metabolism2–4. For example, indoleacrylic acid (IA) and indole-3-propionic acid (IPA) enhance goblet cell function, modulate inflammatory responses5, and impact intestinal permeability6. Furthermore, bacterial threonyl-tRNA synthetases impact in vitro IL-10 production to suppress NF-κB activation7 and bacteria modulate epithelial homeostasis through a retinoic acid-eosinophil-interferon-γ-dependent circuit in mouse duodenal intestinal epithelial cells8. Other examples include induction of human IFNγ+ Th17 differentiation by the pathobiont Enterococcus gallinarum9, immunogenic activity of a diacyl phosphatidylethanolamine from Akkermansia muciniphila in cell-based assays10 and in vitro production of genotoxic indolimines by Morganella morganii11. Serum bacterial metabolites and their effects on intestinal permeability and systemic immunity can be modulated through bacterial genetic manipulation6 and diet12,13.
Microbial secondary metabolism produces many uncharacterized compounds with potential drug-like effects14, but microbial metabolite identification in human samples remains challenging. A resource of metabolic culture profiles spanning 833 annotated compounds from 178 gut microbes15 demonstrated that microbial metabolites produced in standard rich media are detected in the murine gut. The untapped wealth of microbial metabolites in patient profiles emphasizes the need to extend this approach to link microbes to metabolites as inflammation transitions from mild to severe disease. Mapping of stool and circulating plasma metabolites and their connection with gut microbial changes in disease progression is also lacking.
Multiomics profiling can elucidate mechanisms underlying microbiome-related diseases like IBD. Shotgun metagenomics provides insights into gene- and strain-specific microbiome alterations and their functional implications. The integrative Human Microbiome Project (iHMP) identified increases in facultative anaerobes at the expense of obligate anaerobes16. Blooms of species like Ruminococcus gnavus are associated with active disease, and specific R. gnavus strains in IBD17 promote TNFα-inducing polysaccharide production18. Integrated analysis of paired untargeted LC-MS stool metabolomic and microbial gene profiles from PRISM (the Prospective Registry in IBD Study at MGH) implicated 122 species with increased sphingolipids and bile acids (BAs) and depleted triacylglycerols and tetrapyrroles19. Colonizing germ-free mice with Bacteroides thetaiotaomicron strains deficient in a single sphingolipid gene resulted in intestinal inflammation20. Integration of microbial strain and metabolite profiles with clinical data is a promising approach to identify host-microbial interactions associated with new-onset disease21, classify clinical remission22, predict therapy response23 and stratify IBD patients24.
Few studies have focused on the microbiome in ulcerative colitis (UC), one of two major types of IBD, along with Crohn’s disease (CD). UC and CD are distinct in location and pathology with potentially different underlying mechanisms and microbial signatures. We previously used 16S rRNA profiling from the PROTECT (Predicting Response to Standardized Colitis Therapy) cohort to show that expansion of bacteria typical for the oral cavities and Clostridiales depletion are linked to UC disease course and implicate increased temporal gut microbiome variability in therapy efficacy25. In metagenomic IBD studies such as PRISM, UC patients displayed higher heterogeneity with Bifidobacterium breve and Clostridium symbiosum enrichment19. Links between UC patient-derived microbes and host immunity include murine Th1 cell induction and gut inflammation driven by oral Klebsiella strains26 and induction of murine Th17 cells by adhesion to epithelial cells27. However, differences in microbial signatures between cohorts and across disease duration, as well as differences in treatment history, complicate the identification of disease mechanisms.
We developed a framework to identify disease-associated bacterial species and their corresponding metabolites by integrating paired metagenomics and metabolomics with culturomics data. Using samples from PROTECT to investigate the clinical course of UC in newly diagnosed patients and disease activity following firstline therapy, we identified metabolite classes associated with refractory disease and inflammation, including amino acid dipeptides, acetylated polyamines and conjugated BAs. We used Veillonella parvula as an example to illustrate how our approach can identify host-microbial interactions in disease, including inflammation-associated degradation of purine drugs and production of immunoregulatory tryptophan metabolites. Alterations in predicted circulating fatty acid amides identified through molecular networking were associated with V.p. expansion.
Results
The PROTECT cohort captures the microbiome in treatment-naive pediatric patients across the UC disease severity spectrum
Our approach identifies disease-associated metabolites in patient samples and links them to their microbial producers through the analysis of paired multiomics data (Fig. 1A). First, we identify disease-associated microbes, microbial genes and metabolites from paired metagenomics and untargeted metabolomics from patient samples and identify overlapping metabolites in paired plasma and stool samples. Untargeted metabolomics data was generated using hydrophilic interaction liquid chromatography (HILIC) and lipid profiling (C8, C18) columns in positive and negative ionization mode, respectively. Next, we generate metabolite profiles from culturomics of a disease-associated species grown in conditions to recapitulate the metabolomic context of the inflamed gut. The addition of pooled stool samples subsequently allows us to align metabolites from the species’ supernatant to metabolites in patient samples.
Figure 1: PROTECT cohort overview and longitudinal microbiome-associations with disease progression.

A. Our approach uses paired multiomics to identify microbes, microbial genes and metabolites associated with disease. Subsequent integration with culture metabolomics directly links previously undescribed and annotated metabolites in patients to disease-associated microbes. B. Patients were grouped into inactive, mild and moderate/severe disease based on their PUCAI; those receiving colectomy as surgical intervention represent the most severe disease, where all other treatment options have failed. C. Disease progression and treatment response for 95 patients with mild or moderate/severe disease at week 0. While disease severity often improved, only 48% achieved remission by week 52. D. Eight assembled MSPs encoded the complete narGHJI operon. Patients were stratified by level of inflammation (as measured by fecal calprotectin: low (<100 mcg/g), increased (100–200 mcg/g), high (200–3,000 mcg/g) or very high (>3,000 mcg/g)), showing that the median abundance of the narGHJI genes for each MSP increases with inflammation. E. Viral MSPs that significantly changed with disease severity or colectomy (LME, Storey’s q < 0.05, samples from all time points). Depletion of 10 of these viral MSP was further associated with increased fecal calprotectin levels (marked by red #, Wilcoxon, p<0.05). Colors indicate mean abundance for each MSP stratified by patient group and stars indicate significant changes compared to inactive disease and no colectomy requirement, respectively. For each MSP, the numbers following the taxonomic name specify the number of core genes supporting the taxonomic assignment followed by the total number of annotated core genes.
To investigate the microbiome in treatment-naive pediatric UC patients with a defined disease duration, we generated metagenomics (n=241) (Fig. S1A) and paired stool (n=91) and plasma (n=85) metabolomics (Fig. S1B) for samples from the PROTECT prospective cohort study. Newly diagnosed children aged 4–17 years were recruited and received standardized initial therapy. Patients were followed for one year during which clinical data and biological samples were collected. At time of recruitment (baseline sample) all patients were treatment-naive with active disease and subsequently showed a differential treatment response. This unique cohort captures the UC severity spectrum, from inactive (Pediatric Ulcerative Colitis Activity Index [PUCAI] <10) to mild (PUCAI 10–30) and moderate/severe disease (PUCAI >30) to the most severe refractory disease leading to colectomy (Fig. 1B). In addition, fecal calprotectin was measured as a marker of inflammation with levels ranging from 16 to 7839 mcg/g across patients. Using 16S rRNA amplicon profiles, we previously identified compositional and temporal changes of the gut microbiome associated with UC disease course. In particular, we found an enrichment of bacteria typical of the oral cavity in severe disease and species-specific temporal changes associated with remission and refractory disease. To identify potential disease mechanisms and expand on these findings25, we focused on 95 patients, with up to 4 time points per patient. These patients presented with mild or moderate/severe disease at diagnosis and exhibited opposing disease progression and treatment response trajectories (Fig. 1C). Patients showed high levels of inflammation (measured by fecal calprotectin, Fig. S1C) which correlated with substantially increased gut microbial dysbiosis (Fig. S1D). PROTECT patients’ fecal calprotectin levels were on average 10x higher than in other large-scale multiomics studies, such as iHMP (iHMP UC mediancalp=103, PROTECT mediancalp=1002; Fig. S1E), and the average dysbiosis score was 5x higher (Fig. S1D). Among patients starting with moderate/severe disease, only 14% were in remission at all time points; 49% failed to achieve remission at any follow-up time point (Fig. 1C). For patients with initially mild disease, 7% had refractory disease (no remission at any follow-up time points); 37% were in remission during the 12-month follow-up period.
Expansion of species typical for the oral cavity accompanies bacteriophage depletion in exacerbated disease
Among the most significant changes in moderate/severe disease was a depletion of Bifidobacteria, including B. longum, B. adolescentis and B. bifidum. Concurrent to this gut commensal depletion, species typical for the oral cavity increased in moderate/severe disease, including three Veillonella species (V. dispar, V. atypica and V. parvula), Haemophilus parainfluenzae and Klebsiella pneumoniae (Fig. S1F). We recently reported that Veillonella ectopically colonizes the gut during inflammation using nitrate through the narGHJI operon boosting their growth and modulating their metabolic repertoire28. As a considerable share of associations may reflect adaptation to the inflamed environment, we performed functional analysis of growth and energy generation strategies29. Inflammation-associated metagenomes were enriched for utilization of threonine and lysine as carbon sources, and anaerobic respiration through sulfate or nitrate as electron acceptors (Table S1). To determine how common this mechanism is among UC-enriched bacteria, we generated metagenomic assemblies and searched for narGHJI homologs in Metagenomic Species Pangenomes (MSPs). We identified eight microbes encoding this operon (Fig. 1D). V. parvula showed the highest NAR-operon abundance in severe inflammation, followed by Escherichia coli and Veillonella atypica. The operon was also detected in K. pneumoniae, a viral Myoviridae MSP, Klebsiella oxytoca, Escherichia marmotae and Citrobacter freundii. Many of these species are part of the resident oral microflora.
Virome changes in IBD patients have been recently reported30,31 and gut virome diversity may promote a healthy lifespan32. While reference-based profiling is more sensitive, it predominantly captures bacterial signals. We repeated the taxonomic analysis using assembly profiles to look for virome changes. Core genes for 21 of the disease- and inflammation-associated MSPs mapped to viral reference genomes (Fig. 1E), including bacteria- and archaea-targeting Siphoviridae, bacteriophages Myoviridae, Inoviridae and Podoviridae, and unknown species. While it is difficult to bioinformatically predict their bacterial host, depletion of these bacteriophages in severe disease was associated with an increase of several bacteria, including E. coli and V. parvula (Fig. S1G+H), suggesting that this depletion potentially contributes to disease-associated microbe expansion.
Of the 95 patients in the cohort, PROTECT includes longitudinal samples from 15 patients that subsequently required a colectomy (nsamples=25). Among these patients, we identified 23 differentially abundant bacterial species (Fig. S1F, based on sample time points prior to surgery). Twenty of these positively correlated with colectomy, suggesting that refractory disease is predominantly associated with enrichment of bacteria typical for the oral cavity, including V. parvula (Fig. S1I), H. parainfluenzae, Streptococcus salivarius and Streptococcus parasanguinis. Nine of the identified species were uniquely associated with colectomy (Fig. S1F) and were not previously implicated in IBD by other metagenomic studies lacking patients with this most severe form of UC (PRISM19, LSS17, Lewis17,33, NLIBD34, iHMP216). These species include: Aggregatibacter segnis, Aggregatibacter sp., Clostridium innocuum, Clostridium ramosum, Erysipelotrichaceae bacterium 2 2 44A, Haemophilus haemolyticus, Streptococcus constellatus, Streptococcus intermedius and Turicibacter sp.. Viral MSPs (n=14) associated with colectomy were significantly depleted in these patients (Fig. 1E) from early time points, in particular at baseline prior to therapy initiation (Fig. S1J).
Stool and plasma metabolite depletion occurs during severe inflammation in moderate/severe disease
To pinpoint potential aberrant host-microbial communication in disease, we identified inflammation- and disease-associated metabolite changes in stool and plasma. Metabolite diversity was significantly reduced in moderate/severe compared to inactive disease in both stool and plasma (Fig. 2A, based on all samples). Variation in stool metabolite profiles strongly correlated with gut microbial diversity, while variation in plasma metabolites showed clustering by disease severity (Fig. 2B).
Figure 2: Metabolic disruptions associated with moderate/severe disease in stool and plasma.

A. Metabolite diversity significantly decreased in moderate/severe disease. Stool Wilcoxon: inactive vs. mild, p=0.2; inactive vs. mod./severe, p=10−4; mild vs. mod./severe p=10−5. Plasma Wilcoxon: inactive vs mild, p=10−4; mild vs mod./severe p=0.007. B. Variation in stool metabolites was significantly associated with species diversity (Chao1, metagenomic species profiles). Spearman correlation with first principal coordinate (PC) of PCoA for stool and plasma metabolite profiles, respectively. Linear model with 95% confidence interval. C-F. Overview of differentially abundant stool (left) and plasma (right) metabolites in moderate/severe and mild versus inactive disease (linear mixed effects model [LME], Storey’s q<0.05, * indicates q<0.2, based on all samples). X-axis of volcano plots indicates LME coefficient and y-axis significance of the association (Storey q-value). Dots and annotation color indicate Pearson correlation of the respective metabolite intensities with fecal calprotectin levels (blue - negative, red - positive, gray/black - not significant). G. Differential abundances of N4-acetylcytidine (plasma), cytidine (stool) and N1-acetylspermidine (plasma).
In stool, 72% of detected metabolites were differentially abundant in moderate/severe compared to inactive disease, including 1,024 annotated metabolites (nsig=23,042; FDR<0.05, Fig. 2C). Of these, 6,042 were significantly correlated with fecal calprotectin levels (Pearson, FDR<0.05, Fig. 2D, Table S2) and 65% of all stool metabolites were depleted in patients with moderate/severe disease (nsig_depl=14,916; FDR<0.05, Fig. 2C–D), including nicotinuric acid, 1-methylurate and serotonin and secondary BAs isolithocholate (isoLCA) and isoallolithocholate (isoalloLCA) (Fig. S2A–E). IsoLCA and isoalloLCA are bacterially produced metabolites with antimicrobial effects against gram-positive pathogens. Metabolite depletion was reversed when comparing mild to inactive disease, where 57% (nsig_enr=1,238) of the differentially abundant metabolites (nsig=2,173) were enriched in mild disease (Fig. 2C), including phosphatidylcholines and sphingomyelins (Fig. S2F). Sphingomyelins of varying chain-length, a feature which influences their signaling and biochemical properties, showed high correlations with fecal calprotectin, including C16:1 SM (r=0.75, q=10−12), C24:1 SM (r=0.74, q=10−12), C22:0 SM (r=0.72, q=10−11), C20:0 SM (r=0.71, q=10−11) and C16:0 SM (r=0.71, q=10−11). Among the most significantly depleted metabolites in mild versus inactive disease were N–acetyl–5–Aminosalicylic acid (N-acetyl-5-ASA) and urocanic acid. 5-ASA is a common IBD medication which can be metabolized and inactivated by microbes through thiolases and acyl-CoA N-acyltransferases into N-acetyl-5-ASA through gut commensal acetyltransferases35. Derivatives of urocanic acid, a L-histidine intermediate, possess anti-inflammatory properties in murine models of IBD36. In colectomy patients, 2,174 stool metabolites were differentially abundant (FDR<0.2, Fig. S2G). These features suggest initial enrichment of specific fecal metabolites when disease progression begins followed by a pronounced depletion of metabolites as inflammation worsens, including microbially produced secondary BAs (Fig. 2D+S2F).
In plasma, 41% of detected metabolites were significantly altered in moderate/severe disease (n=6,655, nannotated=668, Table S2) with 74% (n=4,895) being depleted (Fig. 2E+F). We observed the same trend in mild disease (n=932, nannotated=44), with the majority of differentially abundant plasma metabolites (63%, n=585) depleted in mild compared to inactive disease (Fig. S2H). All stages of disease severity showed a pronounced depletion of triacylglycerols (TAGs), most of which were long-chain TAGs, e.g. C48:4 TAG and C44:2 TAG. C14:0 sphingomyelin (SM) was among the most significantly depleted plasma metabolites in moderate/severe disease but was increased in stool where intensities were 7x higher compared to patients with inactive disease (Fig. S2I). Another bacterial molecule implicated in inflammation is the long-chain fatty acid elaidate, recently linked to impaired gut integrity promoting metabolic endotoxemia37. The corresponding fatty acid metabolism regulator fadR was highly enriched in PROTECT patients with high or very high levels of calprotectin (very high >3000 mcg/g, high 200–3000 mcg/g, increased 100–200 mcg/g, low <100 mcg/g, Fig. S2J) while plasma levels of elaidate (matched by mz=281.2485 and RT=15.14min, disease coeff=−0.07, q=0.16) significantly increased in mild and moderate/severe disease. Plasma N4-acetylcytidine (ac4C), a post-translational chemical modification occurring across all domains of life, increased in moderate/severe patients while stool cytidine decreased (Fig. 2G). Other acetylation-related metabolites enriched in moderate/severe disease included N-acetylputrescine (Table S2), N1-acetylspermidine (Fig. 2G) and diacetylspermine (Fig. 2F).
Levels of dipeptides and microbiome-mediated BA modifications changed significantly in moderate/severe disease
Several classes of metabolites were differentially abundant in stool in moderate/severe disease, including dipeptides and conjugated BAs. We used a comprehensive library of amino-acid dipeptide standards (n=105) to identify systematic increases in dipeptides in moderate/severe disease, including Pro-Ala/Ala-Pro, Val-Pro and Pro-Gly (Fig. 3A and Fig. S3A). Of the significantly altered dipeptides, 93% were enriched in moderate/severe disease and 85% positively correlated with fecal calprotectin (nsig=72, nenriched=67, ncalpro=61, Fig. 3A). The severity-enriched amino acid dipeptides involved 19 amino acids; 7 of these accounted for 58% of all combinations, including valine (Val), phenylalanine (Phe), tryptophan (Trp), threonine (Thr), isoleucine (Ile), serine (Ser) and alanine (Ala), with valine being the most frequent (involved in 17 dipeptides). Peptides have diverse bioactivities including antioxidant, antimicrobial, and anticancer activity38 and structures formed by peptide self-assembly play a role in innate immune activity39 and NOD2 sensing40. In some dipeptides, the shortest self-assembling peptide motif can exhibit potent effects, such as bacterial growth inhibition, upregulation of stress-response regulons and disruption of bacterial morphology41. Our findings suggest that changes in dipeptide levels may play an important role in UC progression.
Figure 3: Levels of dipeptide, conjugated bile acids and metabolites involved in tryptophan metabolism changed in moderate/severe disease.

A. Dipeptides (red) were systematically enriched in moderate/severe disease (LME, Storey’s q<0.05). B. Bile acids (BA) were differentially abundant, depending on conjugation type, with tauro-conjugated BA increased and amino acid conjugated BA decreased in moderate/severe disease. C, D. Differentially abundant metabolites from the serotonin, indole and kynurenine pathway in stool and plasma. E, F. Overview of tryptophan pathways highlighting metabolites that are decreased (blue) or increased (orange) in moderate/severe disease compared to inactive disease in stool and plasma, respectively. For each reaction, arrow color indicates bacterial and/or host origin (based on KEGG, for indole pathway85).
Levels of conjugated BAs changed significantly in moderate/severe disease (Fig. 3B). Amino acid-conjugated BAs (aa-BAs) were depleted while tauro-conjugated BAs were enriched in moderate/severe disease. We detected 23 different aa-BAs, of which 19 were differentially abundant and significantly decreased in moderate/severe disease. Nine of these involved amino acid conjugations of deoxycholic acid (DCA), where Asp-DCA (Fig. S3B), Gly-DCA and Thr-DCA showed the largest decrease. An additional five involved chenodeoxycholic acid, four involved cholic acid and one ursoDCA/hyoDCA. Meanwhile, the tauro-conjugated BAs taurocholate (Fig. S3B) and taurochenodeoxycholate were enriched in patients with moderate/severe disease. Taurocholate increases inducible nitric oxide synthase (iNOS) expression, NO production, ROS production, and epithelial permeability42, while taurochenodeoxycholate decreases cell viability of biliary epithelial cells and induces apoptosis at high concentrations43. Concurrently, we saw a significant decrease in the cumulative abundance of bacterially-encoded bile salt hydrolase (BSH) homologs (Fig. S3C+D). While microbes can deconjugate tauro- and glyco-BAs44, this is not the case for amino acid conjugated BAs45. Overall, the microbiome likely contributes to the observed changes of dipeptide and BA levels and their modifications.
Depletion of tryptophan metabolites in stool is linked to moderate/severe disease
Among the most significant shifts in moderate/severe disease were tryptophan-related metabolites from the serotonin, indole and kynurenine pathway (Fig. 3C–F), many of which are involved in the regulation of immunity, neuronal function and intestinal homeostasis. Tryptophan metabolic products were mostly decreased in the stool of patients with moderate/severe disease (Fig. 3C+E). In the serotonin pathway, host-produced 5-hydroxy-tryptophan was increased, while serotonin and N-methylserotonin, which can also be contributed by gut bacteria, were depleted. In the kynurenine pathway, 3-hydroxykynurenate was among the most significantly depleted stool metabolites (Fig. 3C) along with other downstream metabolites nicotinic acid, nicotinuric acid, kynurenic acid and xanthurenic acid. Anthranilic acid was increased in disease in both plasma and stool.
In plasma, indole lactate, indole acetate and indole-3-propionic acid (IPA) were depleted in moderate/severe disease (Fig. 3D+F). Furthermore, IPA levels correlated between stool and plasma (Pearson r=0.61, padj=3.91E-06). This is corroborated with increased encoding potential of aromatic amino acids (AAAs) to arylpropionates pathway, characteristic in mild/inactive disease metagenomes (Table S1) and also one of the few annotated microbial pathways whose abundance correlated with plasma levels in previous work29. Many indole metabolites are aryl hydrocarbon receptor (AhR) agonists contributed by bacteria, highlighting that gut microbial disruptions likely impact metabolite levels and host responses in circulation46. Microbial tryptophan metabolites such as IPA and indolelactate5,6 suppress inflammation and loss of these metabolites and their protective effects may contribute to immune system overactivation in UC.
Single-species culturomics profiles corroborate microbe-metabolite associations in stool and reflect metabolic changes in moderate/severe disease
As a proof-of-concept for using culturomics to link disease-associated microbes with metabolites, we focused on V. parvula (V.p.), which was among the microbes that most significantly increased in the inflamed gut (Fig. S1F), and whose abundance has shown most remarkable correspondence with disease-enriched metabolites (Fig. 4A, Fig. S3E, V.p. p=1.21e-13, Chi-square test).
Figure 4: V. parvula culture metabolomic profiles recapitulate microbe-metabolite associations.

A, B. Comparison between stool and culture metabolomics (N=104 matched metabolites). Veillonella has highest correspondence between metabolites enriched in moderate/severe disease and correlation with taxonomic abundance (A, V. p., p=1.21e-13, ChiSquare test; red = increased in disease/pos. correlation with V.p., yellow = decreased in disease/neg. correlation with V.p.) or fold change in supernatants vs unspent medium (B, Veillonella HPA003715, p=2.64e-02; red = increased in both disease and culture, blue = increased in disease and decreased in culture, yellow = decreased in both disease and culture). C. PROTECT stool and V. parvula culture profiles significantly correlated in all conditions (Spearman, all p<0.05, median pinactive=10−8, median pmild=10−13, median pmod/sev=10−20). Metabolite profiles were restricted to compounds detected in both stool and culture (n=1,427). D. PCoA with euclidean distance of stool and culture metabolite intensity profiles. Color indicates V.p. abundance in the paired metagenomic profile. The density plot shows disease severity distribution along the first principal coordinate (x-axis). Percentage of total variance explained by each axis is indicated in brackets. E. Lactate intensity in stool across disease severity. F. Excerpt of tryptophan metabolism pathway producing end products indolelactate, indoleacetate, indole propionate and indole-3-ethanol. Arrows show predicted reactions in V.p. HPA0037 and SKV38 genome, using provided gene annotations, GapSeq and BLASTp. G. Total ion chromatograms (TIC) used to determine reference retention time and m/z for each reference standard. H. Extracted ion chromatograms (EIC) from targeted LC-MS on spent media upon V.p. exposure, using reference standards for tryptophan and indole metabolites, within acquisition time window +/− 0.5 min. Black chromatograms show levels in a representative replicate after exposure to V.p. in late exponential phase; gray lines show unspent media. I. Intensity estimates for three replicate estimates as area under the EIC curve for unspent media (UM), mid-exponential (ME) and late-exponential growth phase.
To further support our selection of V. parvula for culturomics experiments, we analyzed metabolite profiles from a publicly available bacterial isolate resource containing genus-level representatives of three species enriched in moderate/severe disease (B. fragilis, S. parasanguinis, V. parvula)15. Among culture data from these representatives, metabolite profiles from Veillonella sp. HPA0037 BEI (an isolate from a biopsy of ileal-anal pouch mucosa) showed the strongest correspondence with disease-enriched metabolites (Fig. 4B, Fig. S3F, p=2.64e-2).
Alignment between core genes of HPA0037 BEI and our V.p. MSP was notable (90 of 358 core genes matched with 80% identity and 80% coverage). We also considered V.p. SKV38, an i oral cavity isolate47, and found it to be a closer genetic match to the V.p. MSP (353 of 358 retained core genes). Therefore, for additional mechanistic investigation of our MSP, we cultured SKV38 in rich, defined media (SK media) with lactate, nitrate or both to reflect the inflamed gut environment28.
Using untargeted LC-MS/MS (HILIC-pos and C8-pos), we aligned compounds in patient samples to V.p. cultures. Overall, 1,427 metabolites overlapped between culture and patient samples (Table S3). Of these metabolites, 12% were annotated (aligned to reference standards); this increased to 34% when including predicted class-level annotations. The most prevalent predicted class was carboxylic acids (n=381) followed by benzene derivatives (n=93), organo-oxygen compounds (n=86) and fatty acyls (n=83). Overlapping metabolites showed highly significant correlations between culture and patient sample intensities, with increasing correlation coefficients in mild and moderate/severe disease (Fig. 4C+D). Nitrate supplementation further increased the correlation coefficient, likely reflecting changes in the metabolic program of V.p. in inflammatory conditions. Changes in V.p.-associated metabolites in patient stool (nmetabolites=1,427) led to clustering by disease severity and reflected a gradient of increasing V.p. abundance (Fig. 4C). Integrating in vitro microbial culture data with patient cohort data facilitates the identification of unannotated bacterial metabolites in patient samples.
Particularly in the presence of nitrate, several disease-enriched metabolites were increased in culture (Table S3), suggesting that V.p.-metabolized compounds are abundant in moderate/severe disease, potentially allowing V.p. to bloom in the inflamed gut. Among compounds with ≥3-fold change in all culture conditions was V.p.-produced putrescine and V.p.-metabolized 6,8-dihydroxypurine, both increased in moderate/severe disease. Putrescine, a component of V.p. peptidoglycans, covalently links to the alpha-carboxyl group of the D-glutamic acid residue of peptidoglycan48, and is potentially involved in host-microbial interactions. V.p. isolates (SKV38) encode the complete citrulline-ornithine-putrescine pathway (speC, ornithine decarboxylase; arcC carbamate kinase; arcB ornithine carbamoyltransferase), in addition to putrescine-ornithine antiporter (gene: WP_021147865.1). The enzyme speC is also found in pathobionts, such as E. coli, E. cancerogenous and Citrobacter15. Putrescine increased more than 10-fold in our V.p. culture data and associated with moderate/severe UC (FDR=0.01). The putrescine derivative N-acetylputrescine also significantly increased in plasma in moderate/severe disease.
We used culturomics to investigate potential connections of V.p. with other disease-associated metabolite classes, including dipeptides and compounds involved in tryptophan metabolism. Dipeptides are sensed through Calcium-Sensing Receptors49, which regulate tissue inflammation and immune stimulation50. The majority of dipeptides detected in patient samples showed strong and highly significant correlations with stool lactate levels (66 of 67 dipeptides, Pearson, p<0.05, pmedian=10−6, rmedian=0.48). Increased dipeptides in IBD resulting from bacterial protease enrichment51 may thus act as a growth substrate during nitrate respiration. Indeed, genome-scale metabolic models based on representative Veillonella genomes predict its metabolic capabilities to consume alanine-containing dipeptides (Ala-Asp, Ala-Glu, Ala-His) and disease-enriched proline dipeptides (Pro-Ala/Ala-Pro, Val-Pro, Pro-Gly, Fig. S3G). Dipeptide depletion was strongest in nitrate-supplemented culture conditions, confirming increases of dipeptides utilization in the absence of lactate, Veillonella’s preferred carbon source (Fig. S3H).
To interrogate whether V.p. SKV38 contributes to disease-associated alterations in tryptophan metabolism, we targeted known, microbially-derived indole derivatives (Fig. 3E–F). V.p. SKV38 was grown in rich (mega) medium, supplemented with lactate, nitrate or both to facilitate comparison with public Veillonella sp. HPA0037 BEI experiments. These revealed increases in indolelactate (ILA, fold change in supernatant at late exponential phase vs. unspent media >3x), which modulates host immune response through AhR with varying efficiency52–55. Both the alternative product, indoleacetate, or terminal indolepropionate (IPA) were not detected in cultures, in accordance with the absence of 3-(aryl)acrylate reductase (required to produce IPA6) in the SKV38 genome (best blastp match to UniProt J7TF92: 23.9% identity at 41.1% coverage). Indolelactate production by Veillonella increased with lactate supplementation, mimicking the gut environment of increasing UC severity (Fig. 4E–I). Similar trends were observed in HPA0037 BEI, where indolelactate accumulates at high intensities only after lactate supplementation (Fig. 4B). These observations position Veillonella as a contributor to elevated stool levels of ILA in moderate/severe disease.
Comparison of genome-scale metabolic models for V.p. SKV38 and Veillonella sp. HPA0037 BEI strains with Bifidobacterium breve, a prominent ILA producer55 enriched in UC19, shows that Veillonella are specific in their ability to utilize nitrate and several dipeptides, as well as to metabolize purines and spermidine metabolites (Fig. S3G), which aligned with metabolomes in severe UC. While lactate is an abundant byproduct of Bifidobacteria56, it is a preferred carbon source for Veillonella. A protein sequence similarity search revealed lactate dehydrogenase (ldh) homologs to the type IV lactate- and indolelactate-producing enzymes from B. breve (SKV38: WP_156696956.1, query coverage 97.8 %, percent identity 32.8 %, e-value 2.84e-65; HPA0037: query coverage 98.4 %, percent identity 33.2 %, e-value 4.83e-68), along with candidate enzymes to produce intermediates indole-3-ethanol and indolepyruvate (Fig. 4F).
Through integration of stool metabolomes, bacterial culturomics and genomics (Fig. 1A), we showcase how metabolites characteristic of an inflamed gut may select for Veillonella species, which can contribute to depletion of purines and elevated levels of polyamines and tryptophan metabolites that interact with the host.
Fragmentation spectra of disease-enriched lipids reveals fatty acid amides enriched in patients and V.p. cultures
To identify V.p.-derived bioactive compounds that may contribute to inflammation severity, we investigated compounds detected both in stool and culture (n=1,469). Numerous lipids altered in V.p. supernatants also significantly correlated with moderate/severe disease. Specifically, 24 of 27 peaks that decreased in V.p. also decreased with moderate/severe disease, while 36 of 46 peaks that increased in Veillonella culture showed a corresponding increase in disease (Fig. 5A; >2x increase/decrease in spent vs. unspent medium, p<3.1e−11, Chi-square test). These data suggest that V.p. may elevate disease-enriched compounds, potentially altering host lipid levels.
Figure 5: Fragmentation of disease-enriched lipids reveals multiple fatty acid amides derived from V. parvula cultures.

A. Distribution of lipids, measured as LC-MS peaks, significant in mild or moderate/severe UC (q<0.05) and detected in V.p. cultures. Lipids which significantly decrease or increase in spent media (FC<0.5 or FC>2) are marked “down” and “up”, respectively. B. The largest connected component (enlarged from circled region at bottom left) in molecular networking of lipids using MS/MS spectra and GNPS. Node shapes and colors represent significant changes in disease and V.p. culture, respectively. Molecule names represent spectra confirmed by internal standards and CPs_QI20648 was predicted as linoleamide. C,D. Distribution of intensities for selected predicted fatty amides conditioned on patient disease severity (C) or V.p. cultures (D) supplemented with lactate (L), nitrate (N) or both (L+N). Asterisks indicate fold change (FC) in intensities comparing spent media to unspent media: *: FC>2, **: FC>4, ***: FC>8.
Since most of the altered lipids were not annotated in MS1 phase, we obtained fragmentation of precursor ions (MS/MS) for 443 lipids, including 34 out of 36 lipids enriched in V.p. and disease (Table S3). Molecular networking, which included spectra for internal reference lipid standards, produced 49 non-singleton components (cosine similarity >0.5), revealing groups of structural features present in more than one precursor ion. The largest connected component contained a subnetwork of five spectra aligned with disease progression and increased in Veillonella cultures with both lactate and nitrate supplementation (Fig. 5B–D). These were consistently predicted to be fatty acid amides (SIRIUS/CSI:FingerID, spectrum to structure prediction, CANOPUS, molecular class prediction), including oleamide (CPs_QI20269), 20-hydroxyicosanamide (CPs_QI6282), (13Z,16Z)-docosa-13,16-dienamide (CPs_QI6445), (E)-tetracos-15-enamide (CPs_QI18537) and erucamide (CPs_QI6870) as top-ranked candidates (Fig. S4A). The subnetwork was indirectly connected to other predicted fatty amides (CPs_QI5601: octadecanamide, CPs_QI20648: linoleamide) and annotated diacylglycerols (DGs), potential sources of free fatty acids, which decreased in disease (Fig. 5B).
Another connected component showed the same enrichment pattern, contained fatty amides and oxygenated hydrocarbons, and was connected to reference standards for octadecanamide and lauroyl diethanolamide (Fig. S4B–D). Furthermore, predicted oleamide increased in spent media (7.3-fold) and moderate/severe UC (Fig. 5C+D, q=8.7e−05). Oleamide is a CB1 receptor ligand produced from oleate in the presence of ammonia via amidohydrolase enzymes57,58. Predicted fatty acid amides in V.p. cultures, including predicted docosanamide (Pearson r=0.69, padj=10−9, Table S3), erucamide (r=0.67, padj=10−8), erucic acid (r=0.67, padj=10−8), (E)-tetracos-15enamide (r=0.65, padj=10−8) and (Z)-icos-11-en-2-one (r=0.52, padj=10−7), positively correlated in stool and plasma suggesting that disease-associated increases in the gut may result in increased levels in systemic circulation. Another indication for relevance of CB1 activity was the remarkable correlation between fecal calprotectin and arachidonic acid, a precursor to CB1 agonist anandamide (Pearson r=0.76, Table S2). Ten predicted fatty acid amides were aligned to the adult cohort16, where most showed a positive trend in UC only (Fig. S4E), with predicted oleamide showing most prominent enrichment (282.2790/5.23 min, P < 0.028). While the exact identity of predicted fatty acid amides remains to be confirmed, their intensity profiles, consistent structural annotations, detection in V.p. culture and detection in an independent adult cohort support their role in inflammatory disease.
Veillonella encodes potential adhesion and virulence genes
To further evaluate the metabolic capacity of Veillonella, we investigated the gene repertoire of patient V.p. strains. Many encoded genes linked to adhesion and virulence in pathogens, such as fibronectin, Hep/Hag repeat proteins and the adhesion protein YadA (Fig. S5A+B). Fibronectin, a large multidomain glycoprotein that links cells and their extracellular matrices (ECM), is the target for many bacterial adhesion proteins, potentially playing a role in virulence, bacteria–host interactions and colonization59. Several fibronectin-binding proteins were present in V. parvula and V. dispar patient strains (Fig. S5A+B). All V. dispar and 85% of V. parvula strains had at least one Hep/Hag repeat protein and YadA domain proteins were detected in 85% and 54% of all V. parvula and V. dispar strains, respectively. YadA-related genes were upregulated in V.p. culture when grown in SK medium containing lactate (SKL) as the carbon source or nitrate (SKN) as the electron acceptor, compared to media with both (SKLN) media (FNLLGLLA_RS00165:-:YadA-like_family_protein28), suggesting potential gene induction in more restrictive growth conditions. The RS00165:-:YadA gene was significantly induced 13-fold in SKL compared to SKLN (p=10−57, q=10−5) and 8-fold in SKN compared to SKLN (p=2*10−10, q=10−8). The overall abundance of Hep/Hag homologs (but not YadA) in the metagenomic data significantly increased in moderate/severe disease (Fig. S5C). Hep/Hag repeats form the head of Bartonella adhesin A (BadA), a trimeric autotransporter adhesin family member essential for adherence of the pathogen Bartonella henselae to host cells and the ECM59. In the YadA homologue of the pathogen Yersinia enterocolitica, this head region is implicated in colonization60. Annotated genes encoding OmpA, which binds fibronectin and facilitates invasion of intestinal epithelial cells61, were also detected in both Veillonella species. Genes encoding for OppA, a fibronectin-binding cell surface protein, were present in all but one V. parvula strain and some V. dispar strains. Several genes related to multidrug efflux pumps and transporters were common across all Veillonella strains. These analyses highlight the genetic repertoire that may contribute to disease as a result of V.p. increases in moderate/severe disease.
Veillonella metabolizes purines and immunomodulatory thiopurines during inflammatory conditions
The Veillonella strain analysis further identified potential purine metabolism capabilities (Fig. 6A, Fig. S5D), suggesting a potential link between Veillonella increase and purine metabolite depletion in disease. These genes included xanthine dehydrogenase and purine permeases, which co-occurred with nitrate reductase genes. Purines are degraded through xanthine dehydrogenases, utilizing either hypoxanthine and xanthine (Fig. S5E). In moderate/severe disease, purines depleted in stool included xanthine and hypoxanthine (HNs QI11 hypoxanthine not HPs QI16712 hypoxanthine), guanine (HNs TF37 guanine but not HPs TF9 guanine), 1-methylguanine, 7-methylguanine and adenine.
Figure 6: V. parvula culture metabolomic profiles confirm nitrate-dependent capabilities to metabolize purines and thiopurines.

A. Pangenome analysis of V.p. genes related to purine metabolism and nitrate reductase. Columns indicate presence/absence of each gene in each sample. B. In vitro consumption of hypoxanthine, xanthine, adenine and guanine in mid-exponential phase of V.p.. SK +/− nitrate as terminal electron acceptor and lactate as carbon source. Purines were determined by LC-MS. Experiments were performed in triplicate. Uninoc = uninoculated media, Spent M = spent media/supernatant. One-way ANOVA and Tukey, *p<0.05, **p<0.01. C. In vitro consumption of hypoxanthine, xanthine, urate, adenine and guanine in V.p. WT, xdh (xdh::cm), and pucD (pucD::cm) mutant cells. First column shows metabolite concentrations in sterile media. Guanine was not detected in WT or mutant experiments. Cells were collected from SKN medium at mid-exponential phase. Experiments were performed in triplicate. T-test, ns=not significant, ***p<0.001, ****p<0.0001. D. xdhA and pucD gene abundance across PROTECT samples stratified by disease severity. Representative gene sequences were mapped against the PROTECT gene catalogue with >60% identity and >70% coverage. Plot indicates cumulative abundance of all mapped gene families. Wilcoxon, FC = fold change comparing gene abundance in mod./severe vs. inactive patients. E. Structures of purine analog IBD drugs 6-mercaptopurine (6-MP) and azathioprine, with hypoxanthine for comparison. F. Degradation of 6-MP and azathioprine by V.p. is reduced by xdhA deletion. Drugs were added to SKN medium at a final concentration of 20 μM (nreplication=4) and degradation was monitored during the mid-exponential phase. Experiments performed in triplicate. T-test, ns=not significant, ***p<0.001, ****p<0.0001.
To experimentally validate the link between Veillonella genes and purine metabolite depletion, we measured V.p. consumption of purines (hypoxanthine, xanthine, adenine and guanine) and urate in SKN, SKL, or SKLN medium28. Nitrate enables Veillonella during inflammation to use amino acids and peptides as carbon and energy sources28. Our experiments show that V.p. is capable of metabolizing purines (Fig. 6B). While resting cells of Veillonella were shown to metabolize hypoxanthine and xanthine62, we showed that this pathway takes place in growing cells and requires nitrate respiration. We generated a V.p. mutant strain lacking putative xanthine dehydrogenase genes xdhA and pucD, involved in oxidative purine metabolism (Fig. 6C) and also found that the metagenomic abundance of both genes significantly increased in moderate/severe vs. inactive disease (Fig. 6D). xdhA deletion largely abolished hypoxanthine and xanthine degradation, whereas mutants lacking pucD had increased xanthine and urate. xdhA thus appears to act as a xanthine dehydrogenase and pucD as an urate oxidase. Guanine and adenine were also depleted, but no major differences were observed between wild type (WT) and mutant strains, suggesting the involvement of other pathways. Inosine levels increased in the presence of WT and mutants, suggesting it is synthesized byt V.p. (Fig. S5F). Plasma and stool inosine levels also significantly increased in moderate/severe patients (Fig. S5G). Reported effects of inosine on T cells and enhancement of checkpoint blockade immunotherapy63 indicate complex interactions with the immune system. These results confirm that V.p. metabolizes xanthine and hypoxanthine through xdhA xanthine dehydrogenase, likely as a carbon or energy source, when coupled with nitrate respiration.
The structure of thiopurines, used as oral immunomodulatory IBD drugs, is remarkably similar to hypoxanthine (Fig. 6E). Therefore, we tested for their metabolism by V.p. in SKN medium with and without 20 μM 6-mercaptopurine (6-MP) or 20 μM azathioprine (Az). V.p. significantly reduced the levels of both thiopurines (Fig. 6F); 6-MP degradation was xdhA-dependent and resembled hypoxanthine degradation. This implicates Veillonella in treatment response by confirming its capacity to metabolize the IBD drug 6-MP as a carbon or energy source at least partially through xdhA xanthine dehydrogenase. High abundances of Veillonella in moderate/severe disease and during inflammation may therefore impair therapeutic efficacy of thiopurines.
Discussion
In this study we integrated culture-independent multiomics profiles with culture-dependent approaches to facilitate identification and prioritization of bacteria and bacterial products that are associated with intestinal inflammation and disease pathologies. We investigated UC as a model disease to interrogate the microbiome in inflammation using samples from PROTECT, a unique cohort that captures the spectrum of UC disease transitions starting with treatment-naive pediatric patients. We tracked disease severity, inflammation status and disease resolution in these patients and directly linked them to the production of disease-associated unannotated microbial molecules and host-microbial interactions.
Taxonomic changes associated with UC disease progression included depletion of B. longum, B. adolescentis and B. bifidum in moderate/severe disease. Bifidobacteria possess immunoregulatory properties, such as inhibition of LPS-induced NF-κB activation64 and B. infantis-derived indole-3-lactic acid upregulates immunoregulatory galectin-1 in Th2 and Th17 cells during polarization65. Bacteria that increased in abundance in moderate/severe disease included species typically found in the oral cavity that encoded shared pathways associated with anaerobic respiration through sulfate or nitrate as electron acceptors. We showed that nitrate reductase (narGHJI), which facilitates inflammation-associated ectopic gut colonization of V. parvula66, was also present in E. coli and K. pneumoniae. Bacteriophage depletion was present at early time points and also associated with UC severity. A recent study showed that phage therapy suppresses human IBD-associated K. pneumoniae and attenuates inflammation and disease severity in colitis-prone mice67, suggesting that augmenting specific phages may constitute promising new therapeutic avenues for IBD.
Disease-associated metabolite changes included increased tauro-conjugated BAs (typically deconjugated by microbes) and decreased amino acid-conjugated BAs. Recently, three microbe-mediated amino acid conjugations of cholic acid were discovered (Phe-CA, Tyr-CA and Leu-CA) that impact farnesoid X receptor host-signaling45. In moderate/severe disease, 19 aa-BAs significantly decreased, with Asp-DCA, Gly-DCA and Thr-DCA showing the largest decrease. Among other depleted BAs were isoLCA and isoalloLCA, both involved in the regulation of cytokine production. These two BAs were first discovered and linked to specific gut microbes in centenarians68 and isoLCA levels were subsequently associated with CD, potentially impacting disease pathophysiology through inhibition of TH17 cell differentiation69. Further metabolic disruptions in moderate/severe UC included increased amino acid dipeptides Pro-Ala/Ala-Pro, Val-Pro and Pro-Gly. Reduced intracolonic pH in active UC70 may also impair peptide transporter activity, as microbial71 and host dipeptide absorption relies on pH-sensitive proton-dependent oligopeptide transporters (POTs)72–74. The abundance of methylated and acetylated molecules was altered in systemic circulation, including increased ac4C, N2,N2-dimethylguanosine, 7-methylguanine, N1-acetylspermidine, N-acetylputrescine and diacetylspermine. N-acetylputrescine is a microbial putrescine-derivative75 and elevated levels are associated with worse clinical outcome of gram-negative bloodstream infections76. Blocking activity of SpeG, the bacterial enzyme that acetylates putrescine, reduces bacterial proliferation and slows pathogenesis. Endogenous polyamines like spermine and spermidine attenuate innate immune responses and cGAS binding to dsDNA. Spermidine/spermine N1-acetyltransferase 1 (SAT1) catabolizes these polyamines, decreasing their cellular concentrations and enhancing cGAS activity77. In cancer cells, SAT1 up-regulation under acidic pH results in N1-acetylspermidine accumulation, which stimulates protumorigenic neutrophil infiltration. Elevated plasma ac4C was observed in other diseases, including multiple sclerosis78 and neuroinflammation79, and could serve as a potential marker for severe UC. RNA modifications regulate development, differentiation, activation, migration, and polarization of immune cells; however, the function and regulation of Ac4C modifications are poorly understood.
Using V.p. as a representative severe disease-associated species, we demonstrated that culturomics can be used to investigate microbially-mediated metabolic changes in disease. Untargeted metabolomics of V.p. cultures and stool samples from patients revealed preferential carbon and nitrogen sources (lactate, dipeptides), and V.p.-produced compounds with neurosensory and immunomodulatory roles. Lactate induced activity on the indole branch of tryptophan metabolism, accumulating indolelactate (ILA). Recent work identified ILA as a key agonist in AhR-mediated immunosuppression of CD4+ response80,81, though only in the infant gut80. Moreover, ILA is also precursor to the circulating AhR ligand indolepropionate (IPA), whose systemic effects include promoting nerve regeneration82, suppression of fatal CD8+ T cell-mediated viral infections83, alleviation of osteoarthritis53 and prevention of Type-I interferon-mediated autoimmunity in the CNS54. IPA is produced by a select group of low-abundance commensals6 and shows concordance in fecal and circulating levels as well as association with metagenomic pathway abundance and inactive disease. Here, culturomics and genomic analysis support accumulation of ILA and deficit of IPA in Veillonella cultures, a composition of Trp metabolites which may lack protective effects in pediatric UC.
Fragmentation spectra of lipids in bacterial cultures revealed numerous increased fatty acid amides, which also increased in moderate/severe disease and include endocannabinoid system agonists. In direct relevance to microbiome-drug interactions and immunosuppression, we showed that V.p. ectopic gut colonization may affect thiopurine metabolism, potentially leading to loss of treatment response in patients harboring V.p. and other xdhA-encoding bacteria. Our findings highlight the importance of ecological changes as microbes are highly sensitive to their environment and suggest that adverse host-microbial interactions in disease may be a result of ectopic gut colonization by oral microbes and the microbial response to inflammation.
Limitations of the study
As we focused on treatment-naive patients and followed standard of care guidelines, our results are broadly relevant to UC patient care. However, the effect of specific treatments over time on the microbiome cannot be delineated as subsequent treatments were decided by the provider, not the protocol84. We accounted for this by including patient ID as a covariate in longitudinal analyses. Also, all patients initially presented with active disease, and inactive disease was a result of treatment response. Furthermore, minority groups are likely underrepresented. While we identified and linked previously unknown molecules to specific microbes, many unannotated compounds remain to be characterized. Importantly, while reductionist approaches such as single bacterial culture experiments are essential for study and validation of specific host-microbial interactions, additional gut environmental factors may further impact these interactions.
STAR METHODS
RESOURCE AVAILABILITY
Lead contact
Further information and requests for resources should be directed to and will be fulfilled by the Lead Contact, Ramnik J. Xavier (xavier@molbio.mgh.harvard.edu).
Materials Availability
Strains generated in this study are available from the lead contact upon request.
Data and code availability
All data used for the analysis is publicly available. The metagenomic sequencing data is available on the Sequence Read Archive (BioProject: PRJNA436359). The metabolomics data is available at the NIH Common Fund’s National Metabolomics Data Repository (NMDR) website, the Metabolomics Workbench, https://www.metabolomicsworkbench.org (Study IDs: ST002473, ST002472, ST002471, ST002470) and can be accessed directly via its project DOI: PR001596 (http://dx.doi.org/10.21228/M8D701). The processed taxonomic data, metabolomic data (plasma & stool) and associated metadata is available in the supplementary material (Table S4).
This paper does not report original code.
Any additional information required to reanalyze the data reported in this paper is available from the lead contact upon request.
EXPERIMENTAL MODEL AND SUBJECT DETAILS
Among the 95 participants, 43 were female and 52 male covering an age range of 4 to 17 years (median: 13 years). At baseline there was no significant difference in age (Wilcoxon, two-sided) and gender (Fisher’s exact test, two-sided) between patients with mild or moderate/severe disease. Eighty-five of the participants identified as white, one as Asian, three as Black, one as native American and four as more than one race (for one patient the race is unknown). Information on sex, ancestry, ethnicity and socioeconomic status was not recorded. Information related to age, gender and race are shown in Table S4.
Cohort description and sample collection
PROTECT is a prospective cohort study consisting of pediatric UC patients with new-onset disease, who were treatment-naive at recruitment. Sample collection was also previously described25,86. Briefly, pediatric UC patients (4–17 years of age) were recruited between July 2012 and April 2015 from 29 centers in the USA and Canada and monitored over the course of one year. Patients were treatment-naive at week 0 and received either 5-aminosalicylic acid (mesalamine) or oral/intravenous corticosteroids followed by mesalamine. Up to 4 samples were collected from each patient (week 0, 4, 12 and 52). In addition, metadata and clinical data were collected, including age, gender, ethnicity, treatment, Pediatric Ulcerative Colitis Activity Index (PUCAI), disease progression (colectomy and remission status) and fecal calprotectin (ELISA). Patients were grouped into three disease severity categories based on their PUCAI score, including inactive (PUCAI <10), mild (PUCAI 10–30) and moderate/severe (PUCAI >30) disease (scores are increments of 5). Remission criteria were as follows: remission at week 4 required a PUCAI score <10 with no prior rescue therapy or colectomy; for remission at week 12 and 52, patients were also required to be corticosteroid-free for a minimum of 14 days (at week 12) and 28 days (at week 52). Rescue therapy included immunomodulators, calcineurin inhibitors and TNF inhibitors. UC was diagnosed based on clinical, endoscopic, and histological diagnosis using previously established criteria87. Patients were required to have no change of UC diagnosis within the one-year follow-up period. Eligibility criteria included disease extent beyond the rectum, a baseline PUCAI score >10, no previous therapy for colitis, and stool culture negative for enteric bacterial pathogens. Blood samples were collected Monday-Thursday and shipped on the same day (via FedEx overnight) at room temperature for next day delivery and processing by the biorepository. If samples were collected on Friday, blood tubes were stored at the collection site at 4 degrees and then shipped at room temperature on Monday (via FedEx overnight) for next day delivery and processing. Stool samples were frozen at −20 degrees at time of collection by study participants and transported back to the site via freezer gel packs and shipping containers to keep samples frozen during transport. Once at the site, samples were frozen at −80 degrees and batched-shipped with dry ice overnight to the biorepository. Once samples were received by the Emory Biorepository, blood samples were immediately processed using the corresponding blood tube centrifugation guidelines, aliquoted, and stored at −80 degrees. Stool samples were stored at −80 degrees. Two types of blood tubes (Becton-Dickinson) were used for collection. One tube was coated with K2EDTA anticoagulant and proprietary protease inhibitor cocktail for stabilization of human plasma proteins at the point of collection. The second tube was also coated with K2EDTA anticoagulant. Patient clinical data and metadata was collected. Samples were randomized throughout the study, but researchers were not blinded with regards to phenotype. No technical replicates were obtained as metagenomics and metabolomics data have been shown to be highly reproducible within protocol16,88,89. Here, we focused on a subset of 95 patients with up to 4 time-points per patient that presented initially with mild or moderate/severe disease and exhibited opposing trajectories in disease progression and treatment response.
Ethics statement
The PROTECT study was approved by the local investigational review boards (IRBs) at each site. Inclusion of volunteers and experiments were conducted according to the principles expressed in the Declaration of Helsinki. In all cases, informed parent/guardian consent and patient assent was obtained. This study was registered with clinicaltrials.gov (NCT01536535).
METHOD DETAILS
Stool metagenomic sequencing
The metagenomic sequencing was done at the Broad Microbiome Sequencing Platform. The total genomic DNA content was extracted from fecal sample using QIAGEN AllPrep DNA/RNA extraction kit and DNA samples were quantified by Quant-iT PicoGreen dsDNA Assay (Life Technologies) and normalized to a concentration of 50 pg/mL. Illumina sequencing libraries were prepared from 100–250 pg of DNA using the Nextera XT DNA Library Preparation kit (Illumina) according to the manufacturer’s recommended protocol, with reaction volumes scaled accordingly. During library preparation, we used DNA extracted from dog stool as a positive control, enabling comparisons with previous successful metagenomic libraries to ensure that library preparation was consistent between batches; we did not use negative controls for sample collection or metagenomics library preparation. Prior to sequencing, libraries were pooled by collecting equal volumes (200 nL) of each library from batches of 96 random samples. Pooled libraries were sequenced on an Illumina HiSeq2500 in paired-end mode (2 × 101 bp). Sequencing yielded on average 44,383,068 ± 77,505,576 reads (mean ± s.d.) before quality filtering and 18,498,567 ± 16,653,208 reads after quality filtering. At least 4 million reads were required for samples to be included in the analysis.
Metabolomics data
Plasma and stool metabolites were profiled at the Broad Institute of MIT and Harvard (Cambridge, MA) using liquid chromatography tandem mass spectrometry (LC/MS). Four different liquid chromatography tandem platforms were used for identification of metabolites16,90,91. Frozen stool samples were homogenized in 10 μl of water per milligram of stool sample weight using a bead mill (TissueLyser II; Qiagen) for 4 minutes and the aqueous homogenates were aliquoted for metabolite profiling analyses. HILIC-pos: hydrophilic interaction liquid chromatography (HILIC) analyses of water soluble metabolites in the positive ionization mode were conducted using an LC-MS system comprised of a Shimadzu Nexera X2 U-HPLC (Shimadzu Corp.; Marlborough, MA) coupled to a Q Exactive mass spectrometer (Thermo Fisher Scientific; Waltham, MA). Metabolites were extracted from plasma or stool (10 μL) using 90 μL of acetonitrile/methanol/formic acid (74.9:24.9:0.2 v/v/v) containing stable isotope-labeled internal standards (valine-d8, Sigma-Aldrich; St. Louis, MO; and phenylalanine-d8, Cambridge Isotope Laboratories; Andover, MA). The samples were centrifuged (10 min, 9,000 × g, 4°C), and the supernatants were injected directly onto a 150 × 2 mm, 3 μm Atlantis HILIC column (Waters; Milford, MA). HILIC-neg: HILIC analyses of water soluble metabolites in the negative ionization mode were conducted using an Shimadzu Nexera X2 U-HPLC (Shimadzu Corp.; Marlborough, MA) coupled to a Q Exactive Plus mass spectrometer (Thermo Fisher Scientific; Waltham, MA). Metabolites were extracted from plasma or stool (30 μL) using 120 μL of 80% methanol containing inosine-15N4, thymine-d4 and glycocholate-d4 internal standards (Cambridge Isotope Laboratories; Andover, MA). The samples were centrifuged (10 min, 9,000 × g, 4°C), and the supernatants were injected directly onto a 150 × 2.0 mm Luna NH2 column (Phenomenex; Torrance, CA). C8-pos: Lipids were profiled using a Shimadzu Nexera X2 U-HPLC (Shimadzu Corp.; Marlborough, MA). Lipids were extracted from plasma or stool (10 μL) using 190 μL of isopropanol containing 1,2-didodecanoyl-sn-glycero-3-phosphocholine (Avanti Polar Lipids; Alabaster, AL). After centrifugation, supernatants were injected directly onto a 100 × 2.1 mm, 1.7 μm ACQUITY BEH C8 column (Waters; Milford, MA). Lipid identities were denoted by total acyl carbon number and total number of double bonds. C18-neg: Metabolites of intermediate polarity, including free fatty acids and bile acids, were profiled using a Shimadzu Nexera X2 U-HPLC (Shimadzu Corp.; Marlborough, MA) coupled to a Q Exactive (Thermo Fisher Scientific; Waltham, MA). Plasma and stool samples (30 μL) were extracted using 90 μL of methanol containing PGE2-d4 as an internal standard (Cayman Chemical Co.; Ann Arbor, MI) and centrifuged (10 min, 9,000 × g, 4°C). The supernatants (10 μL) were injected onto a 150 × 2.1 mm ACQUITY BEH C18 column (Waters; Milford, MA). The column was eluted isocratically at a flow rate of 450 μL/min with 20% mobile phase A (0.01% formic acid in water) for 3 minutes followed by a linear gradient to 100% mobile phase B (0.01% acetic acid in acetonitrile) over 12 minutes.
Bacterial metabolites were profiled using the HILIC-pos and C8-pos methods for mapping Veillonella metabolites present in human stool (see section on Veillonella culture experiments), or using HILIC-pos and HILIC-neg (media) in order to estimate purines and thiopurines metabolism (see section on Veillonella metabolism experiments). Bacterial samples were prepared as follows: mid-exponential Veillonella cultures (OD600 = 0.3–0.4) were harvested by centrifugation at 20,000g at 4°C for 1 minute, supernatants (spent media) were aliquoted, while cell pellets were resuspended in ice-cold PBS. Cells were then spun twice at 20,000g for 1 minute and all PBS supernatant removed and discarded. Cell pellet weights were estimated and all the samples harvested were stored at −80°C until metabolite profiling was conducted. Metabolite extraction was done as described above for media samples. For cells profiled with C8-pos, cell pellets were resuspended in 20 μL of H2O and metabolites extracted using 380 μL of isopropanol containing internal standards and incubated at room temperature in the dark before centrifugation. For cells profiled with HILIC-pos, cell pellets were resuspended in 20 μL of H2O and metabolites extracted using 180 μL HILIC extraction solution described above.
Raw data were processed using TraceFinder 3.3 software (Thermo Fisher Scientific; Waltham, MA) and Progenesis QI (Nonlinear Dynamics; Newcastle upon Tyne, UK). For each method, metabolite identities were confirmed using authentic reference standards or reference samples and the dipeptide library AS-65126–336 (AnaSpec, Fremont, CA, USA). Since bacterial metabolites were profiled after the stool and plasma metabolomic data had been generated, we relied on the use of stool reference quality control pools analyzed with stool and plasma reanalyzed with the bacterial samples in order to adjust m/z and retention time deviations and map features shared between stool and bacteria. In order to remove background signals we titrated cell and media extracts and removed features whose abundances were poorly correlated to the titration (Pearson < 0.8).
Metabolomic features were aligned to the adult ulcerative colitis and Crohn’s disease cohort16 using Eclipse (https://github.com/broadinstitute/bmxp).
Veillonella parvula SKV38 metabolism experiments
Strains and growth conditions: For these experiments we utilized the following strains of Veillonella for growth and metabolic analysis; Veillonella parvula SKV38 [DR071], Veillonella parvula SKV38 xdh::cat* [DR214], Veillonella parvula SKV38 pucD::cat* [DR213]. The original reference strain Veillonella parvula SKV38 was previously isolated from the oral cavity47 and was kindly shared by Prof. Justin Merritt at Oregon Health and Science University, USA. We used SKV38 for our experiments as this strain is naturally competent to take up DNA from the environment allowing us to generate the required SKV38 mutants for our experiments. All strains were first streaked on an agar plate with SK media (composition: yeast extract 10 gL−1, casitone 10 gL−1, NaCl 2 gL−1, K2HPO4 0.4 gL−1) supplemented with 50 mM lactate and 40 mM KNO3 (SKLN medium) and antibiotics if required. SK is a rich and defined culture medium that by itself does not support the growth of Veillonella species, unless either a carbon source (such as lactate, pyruvate or malate) or the electron acceptor nitrate is added to the medium28,47.
Construction of V. parvula knockout mutants:
The construction of the strains V. parvula SKV38 pucD::cat* [DR213] and xdh::cat* [DR214] was performed using the protocols described by Rojas-Tapias et al.{36138166}. To perform gene knockout, we amplified by PCR the flanking regions of the target genes along with the chloramphenicol resistance gene (cat*) using as templates the genomic DNA of SKV38 and the plasmid pDRT004 + atpDC(cat), respectively. For the pucD gene flanking regions, we used primer pairs P467/P468 and P469/P470, resulting in DNA fragments of 725 bp and 721 bp, respectively. For xdh, primer pairs P471/P472 and P473/P474 produced fragments of 700 bp and 814 bp, respectively. The cat* gene, a variant lacking its terminator, was amplified using primers P96 and P382. These amplified fragments were subsequently cloned into the plasmid pDRT004, yielding pDRT004 + pucD(cat*) and pDRT004 + xdh(cat*). These constructs were then introduced into E. coli and colonies were selected on LB agar with ampicillin and X-gal. The plasmids were extracted, confirmed via PCR and Sanger sequencing, and used for the natural transformation of V. parvula SKV38. Mutants of SKV38 were selected on SKLN plates supplemented with chloramphenicol and the mutations were confirmed through PCR and sequencing.
| Primers | DNA Sequence |
|---|---|
| P467 | 5’-atcgggtctcaggaggaaggcgtagatgaagttctacg-3’ |
| P468 | 5’-atcaggtctctgagtagctcgcaagaaatcaattaaacg-3’ |
| P469 | 5’-atcaggtctctgccgccaaaaaatcacgttgcctatgg-3’ |
| P470 | 5’-atcgggtctcaatggaattggcaaatgcatagcttgtg-3’ |
| P471 | 5’-atcgggtctcaggagtgatgagatgttgctagatacattgc-3’ |
| P472 | 5’-atcaggtctctgagtgaactacagggtccaaaataagcg-3’ |
| P473 | 5’-atcaggtctctgccggatatcgtaccattcgatccagg-3’ |
| P474 | 5’-atcgggtctcaatgggctgaatcaatcgattccaatagg-3’ |
| P96 | 5’-atcaggtctcgactcagtaaaatgcaggcgagtgaag-3’ |
| P382 | 5’-atcaggtctcgcggccattaactatttatcaattcctgcaattcg-3’ |
Metabolism of IBD drugs:
From an overnight SKLN agar plate, a single colony was selected and inoculated in 5 mL SKLN media and grown for 24 hours. Next, overnight cells from this inoculum were grown using a 1/50 inoculum of the overnight culture, on either SK, SK + 50 mM lactate (SKL), SK + 40 mM nitrate (SKN), and SKLN. Supernatants were collected at the mid-exponential phase (OD600~0.4) and collected for metabolomic analyses (HILIC-pos metabolite profiling method described above). For analysis of the metabolism of the IBD drugs, cells were prepared as described above, and mid-exponential phase cells were collected, washed twice with sterile SK, and resuspended in 100 μl of SK. A volume of 6 ml of SKN was then inoculated using 90 μl of the bacterial suspension. Those 6 ml were split in three parts: a) 1.5 ml SK, b) 1.5 ml SK + 20 μM 6-mercaptopurine, and c) 1.5 ml SK + 20 μM 6-azathioprine. Additionally, sterile SK was prepared in an identical fashion to serve as a control for the experiment. Cells were incubated in a plate reader (4 wells/treatment) with low shaking and 37°C for about ~5 h, and when the OD600 reached 0.4 cells were collected. For collection, 700 μl of the suspensions were centrifuged at 21,000 g for 2 min, and 400 μl of the supernatant harvested and stored at −20 °C for analysis.
Preparation of thiopurine drugs:
20 μM solutions were prepared using 4.25 mg of 6-mercaptopurine (Sigma 852678) or 6.9 mg of azathioprine (Sigma A4638) dissolved in 1 ml of DMSO. The drugs were prepared and used the same day.
Veillonella parvula SKV38 culture experiments for untargeted LC-MS
For the preparation of supernatant, we utilized identical growth and media conditions as described above and the strain Veillonella parvula SKV38. Briefly, V. parvula was grown on SK agar supplemented with either DL-lactate, potassium nitrate, or both, incubated under anaerobic conditions at 37°C overnight and then inoculated into the respective liquid media in biological triplicates. Cells and supernatants were harvested at mid-exponential phase (OD600=0.3), after centrifugation at 10,000g for 5 min. Resulting supernatants were immediately processed for metabolite extraction and metabolomic analysis using un-inoculated media as a control.
Metabolite classes related to each mass were approximated by matching adduct-adjusted masses to molecular candidates in HMDB v5 (2022) within 5 ppm difference. A nominal majority class was selected from all possible compound annotations related to each mass.
Veillonella parvula SKV38 culture experiments for LC-MS targeted to tryptophan derivatives
V. parvula SKV38 was grown in mega media15 supplemented with either DL-lactate, potassium nitrate or a combination of both, incubated under anaerobic conditions at 37°C overnight and then inoculated into the respective liquid media in biological triplicate. Cells and supernatants were harvested at mid- and late-exponential phases, after centrifugation at 10,000 × g for 5 min. Bacterial culture supernatants were processed for metabolite extraction and metabolomic analysis using un-inoculated media as a control.
Detection of polar metabolites was performed with an Agilent Technologies 6545 Quadrupole Time-of-Flight Liquid Chromatography/Mass Spectrometry (Q-TOF LC/MS) system coupled to an Agilent Infinity 1260 LC system using electrospray ionization operated in negative mode. The gradient elution with water and acetonitrile, both containing 0.1% formic acid, was used to separate the analytes on a Luna C18 column having 30 × 2.1 mm ID and 5 μm particle size. The column was eluted at a flow rate of 450 μL/min with 20% mobile phase A (0.01% formic acid in water) for 3 minutes followed by a linear gradient to 100% mobile phase B (0.01% acetic acid in acetonitrile) over 12 minutes. Mass spectra were analyzed using Agilent MassHunter Qualitative Analysis 10.0.0. Briefly, total ion chromatograms in samples for reference standards (tryptophan, indoleacetic acid, indolepropionic acid and indolelactic acid) were used to determine reference retention times (Find by Formula) and m/z values (peak integration in retention time range) corresponding to deprotonated masses. The resulting m/z and retention time values were used to define extracted ion chromatograms (EIC) in culturomics samples. The abundance was estimated as read under the ion count curve (intensity) within retention time −/+ 0.5 min relative to reference values.
Analysis of untargeted MS/MS lipid spectra in Veillonella parvula SKV38
Fragmentation libraries for lipids detected in Veillonella parvula SKV38 cultures and media controls were generated using tandem mass spectrometry and the C8-pos profiling method described above. MS/MS data generation was carried out on a Thermo IDX mass spectrometer (Thermo Fisher Scientific; Waltham, MA) with electrospray ionization in the positive ion mode using full scan analysis over 70–800 m/z at 120,000 resolution. Precursor ion and MS/MS-containing raw files were converted to *.mzML format files using MSConvert92). A total of 443 precursor ion LC-MS peaks in bacterial cultures were successfully matched to stool samples based on maximal absolute retention time difference of 0.5 min and maximum absolute difference in m/z of 5 ppm. Ions were associated with the closest formula match in HMDB version 5 (downloaded on 6. 10. 2022), requiring a maximal difference in mass ppm < 5 by considering common adducts: [M+H]+,[M+NH4]+, [M+Na]+ and [M - H2O + H]+ to select the assumed most likely ionization. Tandem MS/MS spectra were used in SIRIUS v5.6.3 software to predict the most likely fragmentation tree (SIRIUS), compound identities in Pubchem/HMDB (CSI:Finger ID93) and molecular class (CANOPUS94). In total, tandem MS/MS spectra were augmented with the internal library of 336 reference lipid standards. Network visualization was prepared using feature-based molecular workflow95 on GNPS (https://ccms-ucsd.github.io/GNPSDocumentation/featurebasedmolecularnetworking) with cosine distance threshold of 0.5 and visualized using Cytoscape96). Each node represents a †precursor ion, integrated with measurements of relevant changes in Veillonella parvula SKV38 cultures and stool samples stratified by disease severity.
Veillonella sp. HPA0037 BEI HM-850 culture metabolomics profiles
Untargeted LC-MS metabolomics of bacterial strains were downloaded from the public resource Metabolomics Data Explorer15, Supplementary tables 1, 6 and 7. Samples pertaining to Veillonella sp. HPA0037 BEI HM-850 identifiers s103, s393, s394, s395, s432, s433, s434, s462, s463, s464, s477, s607, s1000, s1001, s1002 were analyzed. Supernatant samples were matched with unspent media controls in matching experiments (identifiers: 20180728, 20200208 (mega medium), 20190228 (mega medium with lactate), 20180720 (reinforced clostridial medium with lactate)).
Genome scale metabolic models
Genome-scale metabolic models for Veillonella parvula SKV38, Veillonella sp. HPA0037 BEI HM-850 and Bifidobacterium breve DSMZ 20213 were created using the respective protein coding sequences using GapSeq v1.297 (https://github.com/jotech/gapseq/tags), which infers reaction potential based on predicted enzyme encoding via sequence homology. Bacterial metabolic reactions were predicted based on a manually curated reaction database for LB media without glucose. The default parameters were kept for all the three pipeline steps, including gapseq find (-b 200), gapseq draft (-u 200 -l 100) and gapseq fill (-b 100). Intra- and extracellular metabolites were extracted from predicted reactions and compartments comprising each metabolic model.
Quantification and statistical analysis
Metagenomics: Preprocessing and quality filtering
First adapters were trimmed with TrimGalore (v0.4.4, --paired --phred33 --quality 0 --stringency 5 --length 10). Raw reads were then processed with the KneadData v0.7.2 (http://huttenhower.sph.harvard.edu/kneaddata), which removes low-quality read bases and human reads (Trimmomatic and BMTagger). Trimmomatic was run with parameters “HEADCROP:15 SLIDINGWINDOW:4:15 MINLEN:50”. Reads shorter than 50 bp were subsequently discarded. Potential human contamination was filtered by removing reads that aligned to the human genome (reference genome hg19).
Metagenomics: Taxonomic profiling
Taxonomic profiles were obtained with the MetaPhlAn2 classifier98, which unambiguously classifies metagenomic reads to taxonomies based on a database of clade-specific marker genes (v20). Options were set to “-t rel_ab --bt2_ps “very-sensitive” --ignore_viruses”. In total, 439 species were identified. After prevalence filtering (min_prevalance≦10), 232 species were kept for the statistical analysis.
Metagenomic assembly
Each sample was de novo assembled using MEGAHIT with default parameters99 and protein coding genes were predicted using Prodigal with the “-p meta” flag100,101. After filtering incomplete genes (“partial==00”), cd-hit-est102 was used to merge from different samples and clustered them into a gene catalog (sequence identity >95%, coverage >90%; parameters “-aS 0.9 -aL 0.9 -c 0.95”). Taxonomy annotations for gene families were inferred for each representative sequence by mapping against the NCBI nt database using MegaBLAST103. Hits with >95% sequence identity and >90% coverage were used for species-level annotation. For each sample, reads were then mapped against the gene catalog to obtain abundance profiles. MSPminer with its default parameters104 was used to generate metagenomic assembled pangenomes (MSPs). Taxonomy annotation for each MSP was predicted based on species annotation of the core genes and the abundance of each MSP was profiled by the median abundance of its core genes in each sample.
Comparison of HMP2 and PROTECT metagenomic profiles
The same sample handling and extraction protocols were used for both cohorts. HMP2 collected samples from a subset of the PROTECT sites (Emory and Cincinnati) and targeted a wider range of patients including CD, adult UC and non-IBD control patients. HMP2 MetaPhlAn2 taxonomic profiles were downloaded from www.ibdmdb.org and the same prevalence filter was applied. The dysbiosis score was calculated as previously defined16 based on the species level profiles. For each sample the dysbiosis score represents the median of the Bray-Curtis distance between that sample and each of the HMP2 non-IBD control samples.
Multivariate models (MaAsLin2) for taxonomic analysis
For the association analysis we used a multivariable model (MaAsLin2)105 accounting for multiple samples from the same patient (random effects) and corrected for effects due to age, gender, race and antibiotics usage (covariates). Model parameter for species associations:
Disease severity associations: Subject ID as a random effect; age, gender, race and antibiotics usage as additional covariates
Disease severity progression in initially severe patients: Subject ID as a random effect; age, gender, race and antibiotics usage as additional covariates
Disease severity progression in initially mild patients: Subject ID as a random effect; age, gender, race and antibiotics usage as additional covariates
Colectomy associations: Subject ID as a random effect; age, gender, race and antibiotics usage as additional covariates
Instead of Maaslin’s default correction for multiple testing we corrected over p values across all associations for our outcome variable of interest using Storey q-value (FDR threshold <0.2).
Metagenomics: Strain profiling
We used a pangenome-based approach to characterize strain level difference (PanPhlAn106, version 1.2.1.3). Briefly, the quality controlled reads were aligned against the pangenome of the species of interest to generate strain-specific gene family presence/absence profiles for all samples where the species was present with sufficient coverage. Default parameters were used for panphlan_map.py and panphlan_profile.py was run with --min_coverage 1 --left_max 1.70 --right_min 0.30. Gene families that were present in <3% of the samples, where the species was detected, were filtered out. Uniref90 gene annotations were obtained with the biobakery uniref annotator using for the centroid sequence of each gene family from the panphlan database (https://github.com/biobakery/uniref_annotator/blob/master/uniref_annotator.py). Briefly, the script performs a DIAMOND search against the HUMAnN2-formatted UniRef90 database using UniRef’s clustering criteria on the mapping results to annotate the input sequences (i.e., >=90% alignment identify and >=80% mutual coverage of the centroid).
Profiling specific gene abundances
For each gene, we first identified representative bacterial gene sequences from the UniProt database. These queries were then aligned (tblastn) against the PROTECT gene catalogue. All alignment hits were further filtered based on percentage identity and coverage (>70% coverage or as indicated) of the alignment and the cumulative abundance of the resulting gene families was computed for each sample. For the nar operon, hits with at least 30% identity were required for all 4 genes within an MSP. The abundance of each gene was calculated as the cumulative abundance of all hits and the operon abundance was calculated as the median across all four genes. For xdhA and pucD, 60% sequence identity was required.
Veillonella core gene analysis
We took the core genes (annotated by mspminer) from the V. parvula MSP and mapped them against known V. parvula reference genomes using blastn. The results were then filtered requiring at least 80% coverage and 80% sequence identity. The number of matched genes were then counted for each reference genome and used to compare the V.p. strains recovered in the PROTECT metagenomic data to the two reference strains Veillonella parvula SKV38 and Veillonella sp. HPA0037 BEI HM-850.
Analysis of bacterial primary metabolism gene clusters
We obtained the bacterial primary metabolism cluster databases from the recent standalone edition of gutSMASH 1.029. Both core and accessory gene sequences from each MSP bin were aligned towards the cluster database using diamond blastx, utilizing settings (--more-sensitive, --outfmt 6). Only significant hits were retained, which met the criteria: e-value < 0.01, sequence identity above 30%, and a cohort prevalence exceeding 20%. Utilizing the Boruta feature selection algorithm (version 8.0.0 in R with p<0.05 and mcAdj set to TRUE), we analyzed the RPKM-normalized gene abundance table of genes associated with primary metabolism (gutSMASH). The goal was to evaluate each input feature’s significance using a random forest model, contrasting their importance with shadow attributes to predict disease state (as indicated by the PUCAI score). This method was designed to separate disease-relevant feature groups (gene clusters) from those whose correlation with the response variable might be attributable to random variance. Features deemed “Rejected,” or those with importance significantly lower than the best performing shadow attribute, were discounted as irrelevant for the predictive model. Following this, the Boruta-approved features were used to conduct hierarchical clustering of subjects and gene dimensions with Euclidean distances and minimum variance method (Ward.D2) for linkage, resulting in three clusters in each dimension.
Metabolomics: Filtering
Metabolites that were not detected (NA) in ≥60 samples were filtered. For the remaining metabolites NAs were replaced with half of the minimum intensity value encountered for this metabolite.
Metabolomics: Differential abundance analysis
For the association analysis we log-transformed the metabolite intensities and used a linear mixed-effects model (R, nlme package, lme function). Formula: log(metabolite) ~ my_outcome_variable + age + antibiotics, with random= ~ 1 | SubjectID to account for multiple samples from the same individual and na.action was set to na.omit. Storey q-value was used to correct for multiple testing. Thresholds are indicated for each analysis.
Supplementary Material
Table S1: Median abundance of differential species stratified by disease severity, related to Fig. 1 and S1.
Table S3: Intensities of V.p. culture metabolites, including estimated fold changes between spent and unspent media, predicted lipid features, predicted identity based on tandem MS/MS spectrum and fold change between spent and unspent medium in lactate + nitrate and disease association, related to Figs. 4, 5, S3 and S4.
Table S4: PROTECT cohort microbiome, metabolomes and metadata, related to STAR Methods.
KEY RESOURCES TABLE.
| REAGENT or RESOURCE | SOURCE | IDENTIFIER |
|---|---|---|
| Bacterial and Virus Strains | ||
| Veillonella parvula SKV38 | Shared by Prof. Justin Merritt from Oregon Health and Science University, USA | N/A |
| Veillonella parvula SKV38 xdh::cat* [DR214] | This study | N/A |
| Veillonella parvula SKV38 pucD::cat* [DR213] | This study | N/A |
| Biological Samples | ||
| Stool samples | PROTECT study | |
| Plasma samples | PROTECT study | |
| Chemicals, Peptides, and Recombinant Proteins | ||
| 6-mercaptopurine | Sigma | 852678 |
| Azathioprine | Sigma | A4638 |
| Hypoxanthine | Fluka | H9377 |
| Xanthine | Fluka | X0626 |
| Adenine | Fluka | 1830 |
| Guanine | Fluka | G11950 |
| Urate | Fluka | U2625 |
| L-Tryptophan | Sigma | 93659–10G |
| Indolelactic acid | Sigma | I5508–250MG-A |
| Indoleacetic acid | Sigma | I5508–250MG-A |
| Indole-3-propionic acid | Sigma | 57400–5G-F |
| Deposited Data | ||
| Stool metagenomic sequencing | Sequence Read Archive | PRJNA436359 |
| Stool and plasma metabolomics | National Metabolomics Data Repository | Project DOI: PR001596 |
| Oligonucleotides | ||
| P4675’-atcgggtctcaggaggaaggcgtagatgaagttctacg-3’ | This paper | N/A |
| P4685’-atcaggtctctgagtagctcgcaagaaatcaattaaacg-3’ | This paper | N/A |
| P4695’-atcaggtctctgccgccaaaaaatcacgttgcctatgg-3’ | This paper | N/A |
| P4705’-atcgggtctcaatggaattggcaaatgcatagcttgtg-3’ | This paper | N/A |
| P4715’-atcgggtctcaggagtgatgagatgttgctagatacattgc-3’ | This paper | N/A |
| P4725’-atcaggtctctgagtgaactacagggtccaaaataagcg-3’ | This paper | N/A |
| P4735’-atcaggtctctgccggatatcgtaccattcgatccagg-3’ | This paper | N/A |
| P4745’-atcgggtctcaatgggctgaatcaatcgattccaatagg-3’ | This paper | N/A |
| P965’-atcaggtctcgactcagtaaaatgcaggcgagtgaag-3’ | This paper | N/A |
| P3825’-atcaggtctcgcggccattaactatttatcaattcctgcaattcg-3’ | This paper | N/A |
| Recombinant DNA | ||
| pDRT004 | Rojas-Tapias et al., 2022 | N/A |
| pDRT004 + pucD(cat*) | This paper | N/A |
| pDRT004 + xdh(cat*) | This paper | N/A |
| Software and Algorithms | ||
| KneadData v0.7.2 | http://huttenhower.sph.harvard.edu/kneaddata | |
| MetaPhlAn2 | Segata et al., 201298 | https://huttenhower.sph.harvard.edu/metaphlan/ |
| MEGAHIT | Li et al., 201599 | https://github.com/voutcn/megahit |
| MegaBLAST | Morgulis et al., 2008103 | https://blast.ncbi.nlm.nih.gov/Blast.cgi??DATABASE=nr&PAGE=MegaBlast&FILTER=L&QUERY=AL954329 |
| MSPminer | Plaza Oñate et al., 2019104 | |
| MaAsLin2 | Mallick et al., 2021105 | https://huttenhower.sph.harvard.edu/maaslin/ |
| PanPhlAn | Scholz et al., 2016106 | http://segatalab.cibio.unitn.it/tools/panphlan/ |
| gutSMASH | Pascal Andreu et al., 202329 | https://gutsmash.bioinformatics.nl/ |
| GapSeq v1.2 | Zimmermann et al., 202197 | https://github.com/jotech/gapseq |
| SIRIUS v5.6.3 | Dührkop et al., 201993 | https://bio.informatik.uni-jena.de/software/sirius/ |
| Prodigal | Hyatt et al., 2010101 | https://github.com/hyattpd/Prodigal |
Highlights:
Host-microbial interactions are linked with pediatric UC disease course
Integrating multiomics and culturomics uncovers microbial metabolites
Immunomodulatory metabolites associate with disease severity and therapeutic responses
UC-associated Veillonella parvula metabolizes immunosuppressive thiopurine drugs
Acknowledgements
We would like to thank the PROTECT cohort patients for their participation and the PROTECT consortium investigators (Paul Ruffo, Susan Baker, Cary Sauer, James Markowitz, Marian Pfefferkorn, David Ziring, Maria Oliva-Hemker, Joel Rosh, Anthony Otley, Robert Baldassano, David Keljo, Neal Leleiko, Mel Heyman and Joshua Noe) for their contributions. This study was supported by grants from the National Institutes of Health (R01 AT009708-04 to R.J.X. and U01 DK095745 to J.H. and L.D.), Center for the Study of Inflammatory Bowel Disease (NIH DK43351 to R.J.X.), the Crohn’s and Colitis Foundation, and the Center for Microbiome Informatics and Therapeutics. Me.S. is funded by an Emmy Noether Award from the Deutsche Forschungsgemeinschaft (DFG, German Research Foundation, project number 426120468). D.R.M. is partially supported by the Distinguished Clinical Research Chair Program at the University of Ottawa. We also thank Heather Kang for invaluable editorial help.
Footnotes
Declaration of interests
R.J.X. is a co-founder of Celsius Therapeutics and Jnana Therapeutics, board director at MoonLake Immunotherapeutics, and consultant to Nestlé. D.R.M is co-founder of MedBiome Inc.
Publisher's Disclaimer: This is a PDF file of an unedited manuscript that has been accepted for publication. As a service to our customers we are providing this early version of the manuscript. The manuscript will undergo copyediting, typesetting, and review of the resulting proof before it is published in its final form. Please note that during the production process errors may be discovered which could affect the content, and all legal disclaimers that apply to the journal pertain.
References
- 1.Lavoie S, Conway KL, Lassen KG, Jijon HB, Pan H, Chun E, Michaud M, Lang JK, Gallini Comeau CA, Dreyfuss JM, et al. (2019). The Crohn’s disease polymorphism, ATG16L1 T300A, alters the gut microbiota and enhances the local Th1/Th17 response. Elife 8. 10.7554/eLife.39982. [DOI] [PMC free article] [PubMed] [Google Scholar]
- 2.Krautkramer KA, Fan J, and Bäckhed F (2021). Gut microbial metabolites as multi-kingdom intermediates. Nat. Rev. Microbiol. 19, 77–94. [DOI] [PubMed] [Google Scholar]
- 3.Ansaldo E, Farley TK, and Belkaid Y (2021). Control of Immunity by the Microbiota. Annu. Rev. Immunol. 39, 449–479. [DOI] [PubMed] [Google Scholar]
- 4.Brown EM, Clardy J, and Xavier RJ (2023). Gut microbiome lipid metabolism and its impact on host physiology. Cell Host Microbe 31, 173–186. [DOI] [PMC free article] [PubMed] [Google Scholar]
- 5.Wlodarska M, Luo C, Kolde R, d’Hennezel E, Annand JW, Heim CE, Krastel P, Schmitt EK, Omar AS, Creasey EA, et al. (2017). Indoleacrylic Acid Produced by Commensal Peptostreptococcus Species Suppresses Inflammation. Cell Host Microbe 22, 25–37.e6. [DOI] [PMC free article] [PubMed] [Google Scholar]
- 6.Dodd D, Spitzer MH, Van Treuren W, Merrill BD, Hryckowian AJ, Higginbottom SK, Le A, Cowan TM, Nolan GP, Fischbach MA, et al. (2017). A gut bacterial pathway metabolizes aromatic amino acids into nine circulating metabolites. Nature 551, 648–652. [DOI] [PMC free article] [PubMed] [Google Scholar]
- 7.Kim S-M, Park S, Hwang S-H, Lee E-Y, Kim J-H, Lee GS, Lee G, Chang D-H, Lee J-G, Hwang J, et al. (2023). Secreted Akkermansia muciniphila threonyl-tRNA synthetase functions to monitor and modulate immune homeostasis. Cell Host Microbe 31, 1021–1037.e10. [DOI] [PubMed] [Google Scholar]
- 8.Cao YG, Bae S, Villarreal J, Moy M, Chun E, Michaud M, Lang JK, Glickman JN, Lobel L, and Garrett WS (2022). Faecalibaculum rodentium remodels retinoic acid signaling to govern eosinophil-dependent intestinal epithelial homeostasis. Cell Host Microbe 30, 1295–1310.e8. [DOI] [PMC free article] [PubMed] [Google Scholar]
- 9.Gronke K, Nguyen M, Santamaria N, Schumacher J, Yang Y, Sonnert N, Leopold S, Martin AL, Hallet R, Richter K, et al. (2023). Human Th17- and IgG3-associated autoimmunity induced by a translocating gut pathobiont. bioRxiv. 10.1101/2023.06.29.546430. [DOI] [Google Scholar]
- 10.Bae M, Cassilly CD, Liu X, Park S-M, Tusi BK, Chen X, Kwon J, Filipčík P, Bolze AS, Liu Z, et al. (2022). Akkermansia muciniphila phospholipid induces homeostatic immune responses. Nature 608, 168–173. [DOI] [PMC free article] [PubMed] [Google Scholar]
- 11.Cao Y, Oh J, Xue M, Huh WJ, Wang J, Gonzalez-Hernandez JA, Rice TA, Martin AL, Song D, Crawford JM, et al. (2022). Commensal microbiota from patients with inflammatory bowel disease produce genotoxic metabolites. Science 378, eabm3233. [DOI] [PMC free article] [PubMed] [Google Scholar]
- 12.Tanes C, Bittinger K, Gao Y, Friedman ES, Nessel L, Paladhi UR, Chau L, Panfen E, Fischbach MA, Braun J, et al. (2021). Role of dietary fiber in the recovery of the human gut microbiome and its metabolome. Cell Host Microbe. 10.1016/j.chom.2020.12.012. [DOI] [PMC free article] [PubMed] [Google Scholar]
- 13.Ceglia S, Berthelette A, Howley K, Li Y, Mortzfeld B, Bhattarai SK, Yiew NKH, Xu Y, Brink R, Cyster JG, et al. (2023). An epithelial cell-derived metabolite tunes immunoglobulin A secretion by gut-resident plasma cells. Nat. Immunol. 24, 531–544. [DOI] [PMC free article] [PubMed] [Google Scholar]
- 14.Skinnider MA, Johnston CW, Gunabalasingam M, Merwin NJ, Kieliszek AM, MacLellan RJ, Li H, Ranieri MRM, Webster ALH, Cao MPT, et al. (2020). Comprehensive prediction of secondary metabolite structure and biological activity from microbial genome sequences. Nat. Commun. 11, 6058. [DOI] [PMC free article] [PubMed] [Google Scholar]
- 15.Han S, Van Treuren W, Fischer CR, Merrill BD, DeFelice BC, Sanchez JM, Higginbottom SK, Guthrie L, Fall LA, Dodd D, et al. (2021). A metabolomics pipeline for the mechanistic interrogation of the gut microbiome. Nature 595, 415–420. [DOI] [PMC free article] [PubMed] [Google Scholar]
- 16.Lloyd-Price J, Arze C, Ananthakrishnan AN, Schirmer M, Avila-Pacheco J, Poon TW, Andrews E, Ajami NJ, Bonham KS, Brislawn CJ, et al. (2019). Multi-omics of the gut microbial ecosystem in inflammatory bowel diseases. Nature 569, 655–662. [DOI] [PMC free article] [PubMed] [Google Scholar]
- 17.Hall AB, Yassour M, Sauk J, Garner A, Jiang X, Arthur T, Lagoudas GK, Vatanen T, Fornelos N, Wilson R, et al. (2017). A novel Ruminococcus gnavus clade enriched in inflammatory bowel disease patients. Genome Med. 9, 103. [DOI] [PMC free article] [PubMed] [Google Scholar]
- 18.Henke MT, Kenny DJ, Cassilly CD, Vlamakis H, Xavier RJ, and Clardy J (2019). Ruminococcus gnavus, a member of the human gut microbiome associated with Crohn’s disease, produces an inflammatory polysaccharide. Proc. Natl. Acad. Sci. U. S. A. 116, 12672–12677. [DOI] [PMC free article] [PubMed] [Google Scholar]
- 19.Franzosa EA, Sirota-Madi A, Avila-Pacheco J, Fornelos N, Haiser HJ, Reinker S, Vatanen T, Hall AB, Mallick H, McIver LJ, et al. (2019). Gut microbiome structure and metabolic activity in inflammatory bowel disease. Nat Microbiol 4, 293–305. [DOI] [PMC free article] [PubMed] [Google Scholar]
- 20.Brown EM, Ke X, Hitchcock D, Jeanfavre S, Avila-Pacheco J, Nakata T, Arthur TD, Fornelos N, Heim C, Franzosa EA, et al. (2019). Bacteroides-Derived Sphingolipids Are Critical for Maintaining Intestinal Homeostasis and Symbiosis. Cell Host Microbe 25, 668–680.e7. [DOI] [PMC free article] [PubMed] [Google Scholar]
- 21.Gevers D, Kugathasan S, Denson LA, Vázquez-Baeza Y, Van Treuren W, Ren B, Schwager E, Knights D, Song SJ, Yassour M, et al. (2014). The treatment-naive microbiome in new-onset Crohn’s disease. Cell Host Microbe 15, 382–392. [DOI] [PMC free article] [PubMed] [Google Scholar]
- 22.Ananthakrishnan AN, Luo C, Yajnik V, Khalili H, Garber JJ, Stevens BW, Cleland T, and Xavier RJ (2017). Gut Microbiome Function Predicts Response to Anti-integrin Biologic Therapy in Inflammatory Bowel Diseases. Cell Host Microbe 21, 603–610.e3. [DOI] [PMC free article] [PubMed] [Google Scholar]
- 23.Lee JWJ, Plichta D, Hogstrom L, Borren NZ, Lau H, Gregory SM, Tan W, Khalili H, Clish C, Vlamakis H, et al. (2021). Multi-omics reveal microbial determinants impacting responses to biologic therapies in inflammatory bowel disease. Cell Host Microbe 29, 1294–1304.e4. [DOI] [PMC free article] [PubMed] [Google Scholar]
- 24.Ryan FJ, Ahern AM, Fitzgerald RS, Laserna-Mendieta EJ, Power EM, Clooney AG, O’Donoghue KW, McMurdie PJ, Iwai S, Crits-Christoph A, et al. (2020). Colonic microbiota is associated with inflammation and host epigenomic alterations in inflammatory bowel disease. Nat. Commun. 11, 1512. [DOI] [PMC free article] [PubMed] [Google Scholar]
- 25.Schirmer M, Denson L, Vlamakis H, Franzosa EA, Thomas S, Gotman NM, Rufo P, Baker SS, Sauer C, Markowitz J, et al. (2018). Compositional and Temporal Changes in the Gut Microbiome of Pediatric Ulcerative Colitis Patients Are Linked to Disease Course. Cell Host Microbe 24, 600–610.e4. [DOI] [PMC free article] [PubMed] [Google Scholar]
- 26.Atarashi K, Suda W, Luo C, Kawaguchi T, Motoo I, Narushima S, Kiguchi Y, Yasuma K, Watanabe E, Tanoue T, et al. (2017). Ectopic colonization of oral bacteria in the intestine drives TH1 cell induction and inflammation. Science 358, 359–365. [DOI] [PMC free article] [PubMed] [Google Scholar]
- 27.Atarashi K, Tanoue T, Ando M, Kamada N, Nagano Y, Narushima S, Suda W, Imaoka A, Setoyama H, Nagamori T, et al. (2015). Th17 Cell Induction by Adhesion of Microbes to Intestinal Epithelial Cells. Cell 163, 367–380. [DOI] [PMC free article] [PubMed] [Google Scholar]
- 28.Rojas-Tapias DF, Brown EM, Temple ER, Onyekaba MA, Mohamed AMT, Duncan K, Schirmer M, Walker RL, Mayassi T, Pierce KA, et al. (2022). Inflammation-associated nitrate facilitates ectopic colonization of oral bacterium Veillonella parvula in the intestine. Nat Microbiol 7, 1673–1685. [DOI] [PMC free article] [PubMed] [Google Scholar]
- 29.Pascal Andreu V, Augustijn HE, Chen L, Zhernakova A, Fu J, Fischbach MA, Dodd D, and Medema MH (2023). gutSMASH predicts specialized primary metabolic pathways from the human gut microbiota. Nat. Biotechnol. 10.1038/s41587-023-01675-1. [DOI] [PMC free article] [PubMed] [Google Scholar]
- 30.Norman JM, Handley SA, Baldridge MT, Droit L, Liu CY, Keller BC, Kambal A, Monaco CL, Zhao G, Fleshner P, et al. (2015). Disease-specific alterations in the enteric virome in inflammatory bowel disease. Cell 160, 447–460. [DOI] [PMC free article] [PubMed] [Google Scholar]
- 31.Clooney AG, Sutton TDS, Shkoporov AN, Holohan RK, Daly KM, O’Regan O, Ryan FJ, Draper LA, Plevy SE, Ross RP, et al. (2019). Whole-Virome Analysis Sheds Light on Viral Dark Matter in Inflammatory Bowel Disease. Cell Host Microbe 26, 764–778.e5. [DOI] [PubMed] [Google Scholar]
- 32.Johansen J, Atarashi K, Arai Y, Hirose N, Sørensen SJ, Vatanen T, Knip M, Honda K, Xavier RJ, Rasmussen S, et al. (2023). Centenarians have a diverse gut virome with the potential to modulate metabolism and promote healthy lifespan. Nat Microbiol 8, 1064–1078. [DOI] [PubMed] [Google Scholar]
- 33.Lewis JD, Chen EZ, Baldassano RN, Otley AR, Griffiths AM, Lee D, Bittinger K, Bailey A, Friedman ES, Hoffmann C, et al. (2015). Inflammation, Antibiotics, and Diet as Environmental Stressors of the Gut Microbiome in Pediatric Crohn’s Disease. Cell Host Microbe 18, 489–500. [DOI] [PMC free article] [PubMed] [Google Scholar]
- 34.Vich Vila A, Imhann F, Collij V, Jankipersadsing SA, Gurry T, Mujagic Z, Kurilshikov A, Bonder MJ, Jiang X, Tigchelaar EF, et al. (2018). Gut microbiota composition and functional changes in inflammatory bowel disease and irritable bowel syndrome. Sci. Transl. Med. 10. 10.1126/scitranslmed.aap8914. [DOI] [PubMed] [Google Scholar]
- 35.Mehta RS, Mayers JR, Zhang Y, Bhosle A, Glasser NR, Nguyen LH, Ma W, Bae S, Branck T, Song K, et al. (2023). Gut microbial metabolism of 5-ASA diminishes its clinical efficacy in inflammatory bowel disease. Nat. Med. 10.1038/s41591-023-02217-7. [DOI] [PMC free article] [PubMed] [Google Scholar]
- 36.Kammeyer A, Peters CP, Meijer SL, and Te Velde AA (2012). Anti-inflammatory effects of urocanic Acid derivatives in models ex vivo and in vivo of inflammatory bowel disease. ISRN Inflamm 2012, 898153. [DOI] [PMC free article] [PubMed] [Google Scholar]
- 37.Takeuchi T, Kameyama K, Miyauchi E, Nakanishi Y, Kanaya T, Fujii T, Kato T, Sasaki T, Tachibana N, Negishi H, et al. (2023). Fatty acid overproduction by gut commensal microbiota exacerbates obesity. Cell Metab. 35, 361–375.e9. [DOI] [PubMed] [Google Scholar]
- 38.Petit N, Dyer JM, Clerens S, Gerrard JA, and Domigan LJ (2020). Oral delivery of self-assembling bioactive peptides to target gastrointestinal tract disease. Food Funct. 11, 9468–9488. [DOI] [PubMed] [Google Scholar]
- 39.Tayeb-Fligelman E, Tabachnikov O, Moshe A, Goldshmidt-Tran O, Sawaya MR, Coquelle N, Colletier J-P, and Landau M (2017). The cytotoxic Staphylococcus aureus PSMα3 reveals a cross-α amyloid-like fibril. Science 355, 831–833. [DOI] [PMC free article] [PubMed] [Google Scholar]
- 40.Gao J, Zhao X, Hu S, Huang Z, Hu M, Jin S, Lu B, Sun K, Wang Z, Fu J, et al. (2022). Gut microbial DL-endopeptidase alleviates Crohn’s disease via the NOD2 pathway. Cell Host Microbe 30, 1435–1449.e9. [DOI] [PubMed] [Google Scholar]
- 41.Schnaider L, Brahmachari S, Schmidt NW, Mensa B, Shaham-Niv S, Bychenko D, Adler-Abramovich L, Shimon LJW, Kolusheva S, DeGrado WF, et al. (2017). Self-assembling dipeptide antibacterial nanostructures with membrane disrupting activity. Nat. Commun. 8, 1365. [DOI] [PMC free article] [PubMed] [Google Scholar]
- 42.Mustonen H, Kiviluoto T, Puolakkainen P, Paimela H, Mentula P, Kemppainen E, and Kivilaakso E (2008). Taurocholate-induced nitric oxide signaling and the ensuing production of reactive oxygen species lead to an increase in epithelial permeability in cultivated mouse gastric epithelium. Dig. Dis. Sci. 53, 3119–3127. [DOI] [PubMed] [Google Scholar]
- 43.Lamireau T, Zoltowska M, Levy E, Yousef I, Rosenbaum J, Tuchweber B, and Desmoulière A (2003). Effects of bile acids on biliary epithelial cells: proliferation, cytotoxicity, and cytokine secretion. Life Sci. 72, 1401–1411. [DOI] [PubMed] [Google Scholar]
- 44.Wahlström A, Sayin SI, Marschall H-U, and Bäckhed F (2016). Intestinal Crosstalk between Bile Acids and Microbiota and Its Impact on Host Metabolism. Cell Metab. 24, 41–50. [DOI] [PubMed] [Google Scholar]
- 45.Quinn RA, Melnik AV, Vrbanac A, Fu T, Patras KA, Christy MP, Bodai Z, Belda-Ferre P, Tripathi A, Chung LK, et al. (2020). Global chemical effects of the microbiome include new bile-acid conjugations. Nature 579, 123–129. [DOI] [PMC free article] [PubMed] [Google Scholar]
- 46.Benech N, Rolhion N, and Sokol H (2021). Tryptophan metabolites get the gut moving. Cell Host Microbe 29, 145–147. [DOI] [PubMed] [Google Scholar]
- 47.Knapp S, Brodal C, Peterson J, Qi F, Kreth J, and Merritt J (2017). Natural Competence Is Common among Clinical Isolates of Veillonella parvula and Is Useful for Genetic Manipulation of This Key Member of the Oral Microbiome. Front. Cell. Infect. Microbiol. 7, 139. [DOI] [PMC free article] [PubMed] [Google Scholar]
- 48.Kamio Y, and Nakamura K (1987). Putrescine and cadaverine are constituents of peptidoglycan in Veillonella alcalescens and Veillonella parvula. J. Bacteriol. 169, 2881–2884. [DOI] [PMC free article] [PubMed] [Google Scholar]
- 49.Xu J, Zeug A, Riederer B, Yeruva S, Griesbeck O, Daniel H, Tuo B, Ponimaskin E, Dong H, and Seidler U (2020). Calcium-sensing receptor regulates intestinal dipeptide absorption via Ca2+ signaling and IKCa activation. Physiol Rep 8, e14337. [DOI] [PMC free article] [PubMed] [Google Scholar]
- 50.Iamartino L, and Brandi ML (2022). The calcium-sensing receptor in inflammation: Recent updates. Front. Physiol. 13, 1059369. [DOI] [PMC free article] [PubMed] [Google Scholar]
- 51.Mills RH, Dulai PS, Vázquez-Baeza Y, Sauceda C, Daniel N, Gerner RR, Batachari LE, Malfavon M, Zhu Q, Weldon K, et al. (2022). Multi-omics analyses of the ulcerative colitis gut microbiome link Bacteroides vulgatus proteases with disease severity. Nat Microbiol 7, 262–276. [DOI] [PMC free article] [PubMed] [Google Scholar]
- 52.Zelante T, Iannitti RG, Cunha C, De Luca A, Giovannini G, Pieraccini G, Zecchi R, D’Angelo C, Massi-Benedetti C, Fallarino F, et al. (2013). Tryptophan catabolites from microbiota engage aryl hydrocarbon receptor and balance mucosal reactivity via interleukin-22. Immunity 39, 372–385. [DOI] [PubMed] [Google Scholar]
- 53.Zhuang H, Ren X, Jiang F, and Zhou P (2023). Indole-3-propionic acid alleviates chondrocytes inflammation and osteoarthritis via the AhR/NF-κB axis. Mol. Med. 29, 17. [DOI] [PMC free article] [PubMed] [Google Scholar]
- 54.Rothhammer V, Mascanfroni ID, Bunse L, Takenaka MC, Kenison JE, Mayo L, Chao C-C, Patel B, Yan R, Blain M, et al. (2016). Type I interferons and microbial metabolites of tryptophan modulate astrocyte activity and central nervous system inflammation via the aryl hydrocarbon receptor. Nat. Med. 22, 586–597. [DOI] [PMC free article] [PubMed] [Google Scholar]
- 55.Laursen MF, Sakanaka M, von Burg N, Mörbe U, Andersen D, Moll JM, Pekmez CT, Rivollier A, Michaelsen KF, Mølgaard C, et al. (2021). Bifidobacterium species associated with breastfeeding produce aromatic lactic acids in the infant gut. Nat Microbiol 6, 1367–1382. [DOI] [PMC free article] [PubMed] [Google Scholar]
- 56.Alcon-Giner C, Dalby MJ, Caim S, Ketskemety J, Shaw A, Sim K, Lawson MAE, Kiu R, Leclaire C, Chalklen L, et al. (2020). Microbiota Supplementation with Bifidobacterium and Lactobacillus Modifies the Preterm Infant Gut Microbiota and Metabolome: An Observational Study. Cell Rep Med 1, 100077. [DOI] [PMC free article] [PubMed] [Google Scholar]
- 57.Farrell EK, and Merkler DJ (2008). Biosynthesis, degradation and pharmacological importance of the fatty acid amides. Drug Discov. Today 13, 558–568. [DOI] [PMC free article] [PubMed] [Google Scholar]
- 58.Sugiura T, Kondo S, Kodaka T, Tonegawa T, Nakane S, Yamashita A, Ishima Y, and Waku K (1996). Enzymatic synthesis of oleamide (cis-9, 10-octadecenoamide), an endogenous sleep-inducing lipid, by rat brain microsomes. Biochem. Mol. Biol. Int. 40, 931–938. [DOI] [PubMed] [Google Scholar]
- 59.Henderson B, Nair S, Pallas J, and Williams MA (2011). Fibronectin: a multidomain host adhesin targeted by bacterial fibronectin-binding proteins. FEMS Microbiol. Rev. 35, 147–200. [DOI] [PubMed] [Google Scholar]
- 60.Uliczka F, Pisano F, Schaake J, Stolz T, Rohde M, Fruth A, Strauch E, Skurnik M, Batzilla J, Rakin A, et al. (2011). Unique cell adhesion and invasion properties of Yersinia enterocolitica O:3, the most frequent cause of human Yersiniosis. PLoS Pathog. 7, e1002117. [DOI] [PMC free article] [PubMed] [Google Scholar]
- 61.Mohan Nair MK, and Venkitanarayanan K (2007). Role of bacterial OmpA and host cytoskeleton in the invasion of human intestinal epithelial cells by Enterobacter sakazakii. Pediatr. Res. 62, 664–669. [DOI] [PubMed] [Google Scholar]
- 62.Whiteley HR, and Douglas HC (1951). The fermentation of purines by Micrococcus lactilyticus. J. Bacteriol. 61, 605–616. [DOI] [PMC free article] [PubMed] [Google Scholar]
- 63.Mager LF, Burkhard R, Pett N, Cooke NCA, Brown K, Ramay H, Paik S, Stagg J, Groves RA, Gallo M, et al. (2020). Microbiome-derived inosine modulates response to checkpoint inhibitor immunotherapy. Science 369, 1481–1489. [DOI] [PubMed] [Google Scholar]
- 64.Riedel C-U, Foata F, Philippe D, Adolfsson O, Eikmanns B-J, and Blum S (2006). Anti-inflammatory effects of bifidobacteria by inhibition of LPS-induced NF-kappaB activation. World J. Gastroenterol. 12, 3729–3735. [DOI] [PMC free article] [PubMed] [Google Scholar]
- 65.Henrick BM, Rodriguez L, Lakshmikanth T, Pou C, Henckel E, Arzoomand A, Olin A, Wang J, Mikes J, Tan Z, et al. (2021). Bifidobacteria-mediated immune system imprinting early in life. Cell 184, 3884–3898.e11. [DOI] [PubMed] [Google Scholar]
- 66.Winter SE, Winter MG, Xavier MN, Thiennimitr P, Poon V, Keestra AM, Laughlin RC, Gomez G, Wu J, Lawhon SD, et al. (2013). Host-derived nitrate boosts growth of E. coli in the inflamed gut. Science 339, 708–711. [DOI] [PMC free article] [PubMed] [Google Scholar]
- 67.Federici S, Kredo-Russo S, Valdés-Mas R, Kviatcovsky D, Weinstock E, Matiuhin Y, Silberberg Y, Atarashi K, Furuichi M, Oka A, et al. (2022). Targeted suppression of human IBD-associated gut microbiota commensals by phage consortia for treatment of intestinal inflammation. Cell 185, 2879–2898.e24. [DOI] [PubMed] [Google Scholar]
- 68.Sato Y, Atarashi K, Plichta DR, Arai Y, Sasajima S, Kearney SM, Suda W, Takeshita K, Sasaki T, Okamoto S, et al. (2021). Novel bile acid biosynthetic pathways are enriched in the microbiome of centenarians. Nature. 10.1038/s41586-021-03832-5. [DOI] [PubMed] [Google Scholar]
- 69.Paik D, Yao L, Zhang Y, Bae S, D’Agostino GD, Zhang M, Kim E, Franzosa EA, Avila-Pacheco J, Bisanz JE, et al. (2022). Human gut bacteria produce ΤΗ17-modulating bile acid metabolites. Nature 603, 907–912. [DOI] [PMC free article] [PubMed] [Google Scholar]
- 70.Nugent SG, Kumar D, Rampton DS, and Evans DF (2001). Intestinal luminal pH in inflammatory bowel disease: possible determinants and implications for therapy with aminosalicylates and other drugs. Gut 48, 571–577. [DOI] [PMC free article] [PubMed] [Google Scholar]
- 71.Yu D-H, Gadkari M, Zhou Q, Yu S, Gao N, Guan Y, Schady D, Roshan TN, Chen M-H, Laritsky E, et al. (2015). Postnatal epigenetic regulation of intestinal stem cells requires DNA methylation and is guided by the microbiome. Genome Biol. 16, 211. [DOI] [PMC free article] [PubMed] [Google Scholar]
- 72.Solcan N, Kwok J, Fowler PW, Cameron AD, Drew D, Iwata S, and Newstead S (2012). Alternating access mechanism in the POT family of oligopeptide transporters. EMBO J. 31, 3411–3421. [DOI] [PMC free article] [PubMed] [Google Scholar]
- 73.Thwaites DT, Kennedy DJ, Raldua D, Anderson CMH, Mendoza ME, Bladen CL, and Simmons NL (2002). H/dipeptide absorption across the human intestinal epithelium is controlled indirectly via a functional Na/H exchanger. Gastroenterology 122, 1322–1333. [DOI] [PubMed] [Google Scholar]
- 74.Doki S, Kato HE, Solcan N, Iwaki M, Koyama M, Hattori M, Iwase N, Tsukazaki T, Sugita Y, Kandori H, et al. (2013). Structural basis for dynamic mechanism of proton-coupled symport by the peptide transporter POT. Proc. Natl. Acad. Sci. U. S. A. 110, 11343–11348. [DOI] [PMC free article] [PubMed] [Google Scholar]
- 75.Rojo D, Gosalbes MJ, Ferrari R, Pérez-Cobas AE, Hernández E, Oltra R, Buesa J, Latorre A, Barbas C, Ferrer M, et al. (2015). Clostridium difficile heterogeneously impacts intestinal community architecture but drives stable metabolome responses. ISME J. 9, 2206–2220. [DOI] [PMC free article] [PubMed] [Google Scholar]
- 76.Mayers JR, Varon J, Zhou RR, Daniel-Ivad M, Beaulieu C, Bholse A, Glasser NR, Lichtenauer FM, Ng J, Vera MP, et al. (2023). Identification and targeting of microbial putrescine acetylation in bloodstream infections. bioRxiv. 10.1101/2023.09.21.558834. [DOI] [Google Scholar]
- 77.Zhao C, Ma Y, Zhang M, Gao X, Liang W, Qin Y, Fu Y, Jia M, Song H, Gao C, et al. (2023). Polyamine metabolism controls B-to-Z DNA transition to orchestrate DNA sensor cGAS activity. Immunity. 10.1016/j.immuni.2023.09.012. [DOI] [PubMed] [Google Scholar]
- 78.Bhargava P, Fitzgerald KC, Venkata SLV, Smith MD, Kornberg MD, Mowry EM, Haughey NJ, and Calabresi PA (2019). Dimethyl fumarate treatment induces lipid metabolism alterations that are linked to immunological changes. Ann Clin Transl Neurol 6, 33–45. [DOI] [PMC free article] [PubMed] [Google Scholar]
- 79.Duan J, Zhang Q, Hu X, Lu D, Yu W, and Bai H (2019). N4-acetylcytidine is required for sustained NLRP3 inflammasome activation via HMGB1 pathway in microglia. Cell. Signal. 58, 44–52. [DOI] [PubMed] [Google Scholar]
- 80.Meng D, Sommella E, Salviati E, Campiglia P, Ganguli K, Djebali K, Zhu W, and Walker WA (2020). Indole-3-lactic acid, a metabolite of tryptophan, secreted by Bifidobacterium longum subspecies infantis is anti-inflammatory in the immature intestine. Pediatr. Res. 88, 209–217. [DOI] [PMC free article] [PubMed] [Google Scholar]
- 81.Cervantes-Barragan L, Chai JN, Tianero MD, Di Luccia B, Ahern PP, Merriman J, Cortez VS, Caparon MG, Donia MS, Gilfillan S, et al. (2017). Lactobacillus reuteri induces gut intraepithelial CD4+CD8αα+ T cells. Science 357, 806–810. [DOI] [PMC free article] [PubMed] [Google Scholar]
- 82.Serger E, Luengo-Gutierrez L, Chadwick JS, Kong G, Zhou L, Crawford G, Danzi MC, Myridakis A, Brandis A, Bello AT, et al. (2022). The gut metabolite indole-3 propionate promotes nerve regeneration and repair. Nature 607, 585–592. [DOI] [PubMed] [Google Scholar]
- 83.Guijas C, Horton LE, Hoang L, Domingo-Almenara X, Billings EM, Ware BC, Sullivan B, and Siuzdak G (2022). Microbial Metabolite 3-Indolepropionic Acid Mediates Immunosuppression. Metabolites 12. 10.3390/metabo12070645. [DOI] [PMC free article] [PubMed] [Google Scholar]
- 84.Hyams JS, Davis Thomas S, Gotman N, Haberman Y, Karns R, Schirmer M, Mo A, Mack DR, Boyle B, Griffiths AM, et al. (2019). Clinical and biological predictors of response to standardised paediatric colitis therapy (PROTECT): a multicentre inception cohort study. Lancet 393, 1708–1720. [DOI] [PMC free article] [PubMed] [Google Scholar]
- 85.Roager HM, and Licht TR (2018). Microbial tryptophan catabolites in health and disease. Nat. Commun. 9, 3294. [DOI] [PMC free article] [PubMed] [Google Scholar]
- 86.Hyams JS, Davis S, Mack DR, Boyle B, Griffiths AM, LeLeiko NS, Sauer CG, Keljo DJ, Markowitz J, Baker SS, et al. (2017). Factors associated with early outcomes following standardised therapy in children with ulcerative colitis (PROTECT): a multicentre inception cohort study. Lancet Gastroenterol Hepatol 2, 855–868. [DOI] [PMC free article] [PubMed] [Google Scholar]
- 87.North American Society for Pediatric Gastroenterology, Hepatology, and Nutrition, Colitis Foundation of America, Bousvaros A, Antonioli DA, Colletti RB, Dubinsky MC, Glickman JN, Gold BD, Griffiths AM, Jevon GP, et al. (2007). Differentiating ulcerative colitis from Crohn disease in children and young adults: report of a working group of the North American Society for Pediatric Gastroenterology, Hepatology, and Nutrition and the Crohn’s and Colitis Foundation of America. J. Pediatr. Gastroenterol. Nutr. 44, 653–674. [DOI] [PubMed] [Google Scholar]
- 88.Franzosa EA, Morgan XC, Segata N, Waldron L, Reyes J, Earl AM, Giannoukos G, Boylan MR, Ciulla D, Gevers D, et al. (2014). Relating the metatranscriptome and metagenome of the human gut. Proc. Natl. Acad. Sci. U. S. A. 111, E2329–E2338. [DOI] [PMC free article] [PubMed] [Google Scholar]
- 89.Townsend MK, Clish CB, Kraft P, Wu C, Souza AL, Deik AA, Tworoger SS, and Wolpin BM (2013). Reproducibility of metabolomic profiles among men and women in 2 large cohort studies. Clin. Chem. 59, 1657–1667. [DOI] [PMC free article] [PubMed] [Google Scholar]
- 90.Mascanfroni ID, Takenaka MC, Yeste A, Patel B, Wu Y, Kenison JE, Siddiqui S, Basso AS, Otterbein LE, Pardoll DM, et al. (2015). Metabolic control of type 1 regulatory T cell differentiation by AHR and HIF1-α. Nat. Med. 21, 638–646. [DOI] [PMC free article] [PubMed] [Google Scholar]
- 91.O’Sullivan JF, Morningstar JE, Yang Q, Zheng B, Gao Y, Jeanfavre S, Scott J, Fernandez C, Zheng H, O’Connor S, et al. (2017). Dimethylguanidino valeric acid is a marker of liver fat and predicts diabetes. J. Clin. Invest. 127, 4394–4402. [DOI] [PMC free article] [PubMed] [Google Scholar]
- 92.Chambers MC, Maclean B, Burke R, Amodei D, Ruderman DL, Neumann S, Gatto L, Fischer B, Pratt B, Egertson J, et al. (2012). A cross-platform toolkit for mass spectrometry and proteomics. Nat. Biotechnol. 30, 918–920. [DOI] [PMC free article] [PubMed] [Google Scholar]
- 93.Dührkop K, Fleischauer M, Ludwig M, Aksenov AA, Melnik AV, Meusel M, Dorrestein PC, Rousu J, and Böcker S (2019). SIRIUS 4: a rapid tool for turning tandem mass spectra into metabolite structure information. Nat. Methods 16, 299–302. [DOI] [PubMed] [Google Scholar]
- 94.Dührkop K, Nothias L-F, Fleischauer M, Reher R, Ludwig M, Hoffmann MA, Petras D, Gerwick WH, Rousu J, Dorrestein PC, et al. (2021). Systematic classification of unknown metabolites using high-resolution fragmentation mass spectra. Nat. Biotechnol. 39, 462–471. [DOI] [PubMed] [Google Scholar]
- 95.Wang M, Carver JJ, Phelan VV, Sanchez LM, Garg N, Peng Y, Nguyen DD, Watrous J, Kapono CA, Luzzatto-Knaan T, et al. (2016). Sharing and community curation of mass spectrometry data with Global Natural Products Social Molecular Networking. Nat. Biotechnol. 34, 828–837. [DOI] [PMC free article] [PubMed] [Google Scholar]
- 96.Otasek D, Morris JH, Bouças J, Pico AR, and Demchak B (2019). Cytoscape Automation: empowering workflow-based network analysis. Genome Biol. 20, 185. [DOI] [PMC free article] [PubMed] [Google Scholar]
- 97.Zimmermann J, Kaleta C, and Waschina S (2021). gapseq: informed prediction of bacterial metabolic pathways and reconstruction of accurate metabolic models. Genome Biol. 22, 81. [DOI] [PMC free article] [PubMed] [Google Scholar]
- 98.Segata N, Waldron L, Ballarini A, Narasimhan V, Jousson O, and Huttenhower C (2012). Metagenomic microbial community profiling using unique clade-specific marker genes. Nat. Methods 9, 811–814. [DOI] [PMC free article] [PubMed] [Google Scholar]
- 99.Li D, Liu C-M, Luo R, Sadakane K, and Lam T-W (2015). MEGAHIT: an ultra-fast single-node solution for large and complex metagenomics assembly via succinct de Bruijn graph. Bioinformatics 31, 1674–1676. [DOI] [PubMed] [Google Scholar]
- 100.Hyatt D, LoCascio PF, Hauser LJ, and Uberbacher EC (2012). Gene and translation initiation site prediction in metagenomic sequences. Bioinformatics 28, 2223–2230. [DOI] [PubMed] [Google Scholar]
- 101.Hyatt D, Chen G-L, Locascio PF, Land ML, Larimer FW, and Hauser LJ (2010). Prodigal: prokaryotic gene recognition and translation initiation site identification. BMC Bioinformatics 11, 119. [DOI] [PMC free article] [PubMed] [Google Scholar]
- 102.Li W, and Godzik A (2006). Cd-hit: a fast program for clustering and comparing large sets of protein or nucleotide sequences. Bioinformatics 22, 1658–1659. [DOI] [PubMed] [Google Scholar]
- 103.Morgulis A, Coulouris G, Raytselis Y, Madden TL, Agarwala R, and Schäffer AA (2008). Database indexing for production MegaBLAST searches. Bioinformatics 24, 1757–1764. [DOI] [PMC free article] [PubMed] [Google Scholar]
- 104.Plaza Oñate F, Le Chatelier E, Almeida M, Cervino ACL, Gauthier F, Magoulès F, Ehrlich SD, and Pichaud M (2019). MSPminer: abundance-based reconstitution of microbial pan-genomes from shotgun metagenomic data. Bioinformatics 35, 1544–1552. [DOI] [PMC free article] [PubMed] [Google Scholar]
- 105.Mallick H, Rahnavard A, McIver LJ, Ma S, Zhang Y, Nguyen LH, Tickle TL, Weingart G, Ren B, Schwager EH, et al. (2021). Multivariable association discovery in population-scale meta-omics studies. PLoS Comput. Biol. 17, e1009442. [DOI] [PMC free article] [PubMed] [Google Scholar]
- 106.Scholz M, Ward DV, Pasolli E, Tolio T, Zolfo M, Asnicar F, Truong DT, Tett A, Morrow AL, and Segata N (2016). Strain-level microbial epidemiology and population genomics from shotgun metagenomics. Nat. Methods 13, 435–438. [DOI] [PubMed] [Google Scholar]
- 107.Song Z, Cai Y, Lao X, Wang X, Lin X, Cui Y, Kalavagunta PK, Liao J, Jin L, Shang J, et al. (2019). Taxonomic profiling and populational patterns of bacterial bile salt hydrolase (BSH) genes based on worldwide human gut microbiome. Microbiome 7, 9. [DOI] [PMC free article] [PubMed] [Google Scholar]
Associated Data
This section collects any data citations, data availability statements, or supplementary materials included in this article.
Supplementary Materials
Table S1: Median abundance of differential species stratified by disease severity, related to Fig. 1 and S1.
Table S3: Intensities of V.p. culture metabolites, including estimated fold changes between spent and unspent media, predicted lipid features, predicted identity based on tandem MS/MS spectrum and fold change between spent and unspent medium in lactate + nitrate and disease association, related to Figs. 4, 5, S3 and S4.
Table S4: PROTECT cohort microbiome, metabolomes and metadata, related to STAR Methods.
Data Availability Statement
All data used for the analysis is publicly available. The metagenomic sequencing data is available on the Sequence Read Archive (BioProject: PRJNA436359). The metabolomics data is available at the NIH Common Fund’s National Metabolomics Data Repository (NMDR) website, the Metabolomics Workbench, https://www.metabolomicsworkbench.org (Study IDs: ST002473, ST002472, ST002471, ST002470) and can be accessed directly via its project DOI: PR001596 (http://dx.doi.org/10.21228/M8D701). The processed taxonomic data, metabolomic data (plasma & stool) and associated metadata is available in the supplementary material (Table S4).
This paper does not report original code.
Any additional information required to reanalyze the data reported in this paper is available from the lead contact upon request.