

Summary
The gut and liver are recognized to mutually communicate through the biliary tract, portal vein and systemic circulation. However, it remains unclear how this gut-liver axis regulates intestinal physiology. Through hepatectomy, transcriptomic and proteomic profiling, we identified pigment epithelium-derived factor (PEDF), a liver-derived soluble Wnt inhibitor, that restrains intestinal stem cell (ISC) hyperproliferation to maintain gut homeostasis by suppressing the Wnt/β-catenin signaling pathway. Further, we found that microbial danger signals resulting from intestinal inflammation can be sensed by the liver, leading to the repression of PEDF production through peroxisome proliferator-activated receptor-α (PPARα). This repression liberates ISC proliferation to accelerate tissue repair in the gut. Additionally, treating mice with fenofibrate, a clinical PPARα agonist used for hypolipidemia, enhances colitis susceptibility due to PEDF activity. Therefore, we have identified a distinct role for PEDF in calibrating ISC expansion for intestinal homeostasis through reciprocal interactions between the gut and liver.
eTOC blurb:
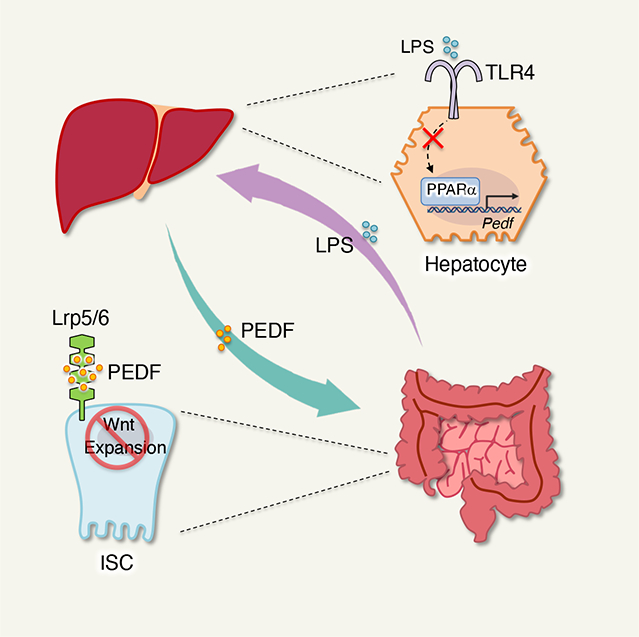
The gut and liver reciprocally communicate to control gut homeostasis and tissue repair during health and diseases. Kim et al. demonstrate that liver-derived soluble factor pigment epithelium-derived factor (PEDF) restrains intestinal stem cell (ISC) expansion, suggesting that the gut-liver axis calibrates ISC fitness for intestinal homeostasis.
Graphical Abstract
Introduction
The liver transports bile acids and other bioactive substrates to the intestine via the biliary tract.1 In turn, intestinal micro- and macromolecules can influence liver physiology and pathophysiology through the portal vein.2 For decades, clinical reports have indicated a putative role of the gut-liver axis in the progression of inflammatory bowel disease (IBD),3–5 a strong association between IBD and chronic liver disease (CLD) has been observed.3,5–10
IBD, prevalent throughout the western world, is characterized by chronic inflammation of the gastrointestinal tract. This chronic inflammation leads to compromised barrier integrity and a subsequent increase in microbial translocation into the bloodstream which is sensed by the liver via portal circulation.11,12 Excessive microbial-associated molecular pattern (MAMP)-triggered hepatic inflammation partially explains how the intestinal factors, especially microbiota, affect the progression of CLD.3,6,11,13 Moreover, previous studies have demonstrated that bile acids can promote the progression and malignancy of colorectal cancer, emphasizing the critical role of the liver in intestinal inflammation.14–17 Despite this knowledge, the underlying mechanism by which the gut and liver reciprocally communicate to regulate intestinal homeostasis and inflammation remains poorly understood.
The intestinal epithelium undergoes constant self-renewal with a 4–5-day turnover time to maintain gut barrier integrity. This renewal process involves active proliferation of intestinal epithelial cells (IECs) in the crypt base, which are characterized as Lgr5+ intestinal stem cells (ISCs).18,19 The proliferation and maintenance of Lgr5+ ISCs are controlled by different niche factors, including Wnt, epidermal growth factor (EGF), and bone morphogenetic protein (BMP).20–22 One pivotal driver of ISC stemness is the canonical Wnt/β-catenin signaling pathway,23,24 in which Wnt ligands bind to a transmembrane coreceptor complex of the Frizzled receptor and lipoprotein receptor-related protein 5 (LRP5) or LRP6, resulting in the stabilization and accumulation of β-catenin in the cytoplasm.25 However, the rapid proliferative kinetics of ISCs could potentially lead to hyperproliferation and tumorigenesis.26 Thus, precise calibration of Wnt signaling in ISCs is essential for maintaining intestinal physiology.27
Hepatocytes are known to actively excrete diverse forms of soluble factors, including metabolites, enzymes and hepatokines, in response to changing nutritional states.28–31 Given that ~40% of liver proteins are secreted into blood circulation,32 the liver secretome is of particular interest in plasma proteomics as a biomarker and potential therapeutic target for metabolic diseases.29–31,33–35 Notably, certain hepatokines directly function on adipose tissue, the central nervous system and skeletal muscle in the development of obesity, insulin resistance, and fatty liver disease, allowing inter-organ crosstalk with the liver.36–40
Here we show that pigment-epithelium-derived factor (PEDF), a hepatokine, plays a key role in calibrating ISC expansion via gut-liver communication, restraining epithelial hyperproliferation for intestinal homeostasis. Hepatectomy, transcriptomics and proteomics screening revealed that PEDF repressed ISC proliferation by limiting the availability of Wnt receptors Lrp5/6 on ISC, subsequently inhibiting Wnt/β-catenin signaling. Genetic deletion or antibody neutralization of PEDF enhanced ISC expansion, promoting tissue repair during intestinal epithelium damage in colitis. Additionally, we found that intestinal inflammation-mediated bacterial LPS burden in the liver inhibits PEDF production via the peroxisome proliferator-activated receptor α (PPARα) signaling pathway. This, in turn, frees ISC proliferation for tissue repair. Impaired LPS sensing in hepatocyte resulted in elevated intestinal tissue damage during inflammation. Moreover, we revealed that fenofibrate (FB), a clinically active PPARα agonist for hypolipidemia, enhances the susceptibility of colitis via PEDF. PEDF antibody blockade eliminated the potential side effect of FB on colitis. Thus, our data demonstrate that the gut-liver axis controls intestinal epithelial proliferation and tissue repair for gut physiology via PEDF, providing potential molecular targets for therapeutic intervention in intestinal inflammation.
Results
Liver-derived PEDF restrains ISC proliferation.
To examine the impact of the liver on intestinal homeostasis, we performed hepatectomies on WT C57BL/6 mice. After 3 days, we found significant elevated epithelial proliferation in both small intestine (SI) and colon crypts in mice with a hepatectomy (Figures 1A and 1B). WT mice with a splenectomy exhibited no difference in cell proliferation in the gut compared to the laparotomized (sham) mice (Figures S1A and S1B). We also excluded that hepatectomy-mediated ISC expansion was due to gut microbiota (Figure S1C). These data indicate that liver-derived factors could repress ISC proliferation. Next, we isolated IECs from crypt or none-crypt sites in SI of either sham or hepatectomy mice and subjected them to mRNA sequencing (Figure S1D). We noticed that a divergence of gene profiles related to both IECs location and surgical conditions, suggesting that hepatokines may influence ISCs development (Figure 1C). Gene ontology (GO) analysis further highlighted that hepatectomy upregulated the genes mediating ISC proliferation, such as the Wnt signaling pathway (Figures 1D and 1E). This upregulation of genes was not observed in non-crypt IECs (Figure 1E). We verified that the expression of Wnt target genes was indeed elevated in the crypts isolated from both the SI and colon of hepatectomized mice compared to sham mice (Figure 1F).
Figure 1. Liver-derived PEDF restrains ISC proliferation.

(A-B) 3 days after hepatectomy on WT C57BL/6 mice, BrdU was injected into either sham or surgery mice 6 hours before tissue collection. (A) Representative images and (B) quantification of BrdU+ cells per crypt of SI and colons from sham and hepatectomy mice. Scale bar, 50 μm. (n=5 per group, representative data of three experiments).
(C) Principal coordinate analysis (PCoA) of transcriptome from IECs and crypt cells from sham and hepatectomy WT mice. (n=2 per group, representative data of two experiments).
(D) GO analysis of hepatectomy-derived upregulated signaling pathway in intestinal crypt cells from WT mice.
(E) GO analysis of Wnt signaling pathway in IECs and intestinal crypt cells from WT mice.
(F) mRNA levels of indicated genes in intestinal crypt cells from sham and hepatectomy mice. (n=3 per group, representative data of three experiments).
(G) Proteomic analysis on the plasma samples from either sham or hepatectomy mice overlap with proteomic analysis of hepatocytes in vitro secretome and known Wnt ligands, which identified Pedf, as one commonly expressed Wnt ligand in all datasets.
(H) PEDF level from plasma of sham and hepatectomy WT mice were assessed. (n=5 per group, representative data of three experiments).
NS, not significant; *p<0.05, **p<0.01, (B, F, H, Unpaired Student’s t-test, error bars represent SEM).
To identify specific liver-derived factors that could inhibit ISC expansion, we performed proteomic analysis of plasma samples from either sham or hepatectomized mice and found a clear segregation between the two conditions (Figure S1E). Furthermore, a comparison of our proteomics data with published secretomic results from hepatocytes35 revealed genes that encoded 12 secretory proteins. Among these proteins, we identified that only serpinf1 (termed ‘Pedf’ hereafter), encoding PEDF as a known Wnt repressor41,42 (Figures S1F and 1G). Indeed, hepatectomy resulted in reduced PEDF in the peripheral circulation (Figure 1H), indicating that liver-derived PEDF may repress ISC proliferation.
PEDF represses ISC expansion.
To investigate the role of PEDF in modulating ISC expansion, we first confirmed higher PEDF expression in the liver compared to other organs (Figures 2A, S2A–S2D). Further, immunofluorescence staining revealed PEDF signals at the crypt base columnar of both SI and colon (Figure 2B), while Lgr5+ ISCs did not produce PEDF per se (Figure S2E). Hepatectomy diminished PEDF signals in the intestine, associated with enhanced epithelial expansion (Figure S2F). Pedf−/− mice displayed enhanced crypt cell expansion under steady state compared to WT mice (Figures 2C and 2D), and loss of PEDF abolished the difference of ISCs proliferation between the sham and hepatectomy mice (Figure S2G). Together, these results support the hypothesis that PEDF circulating from the liver binds to the ISCs, repressing their proliferation.
Figure 2. PEDF regulates expansion of the intestinal stem cell niche.

(A) Representative immunoblot of PEDF protein in indicated tissues from WT mice. (n=3 per group, representative data of three experiments).
(B) Representative images of intestinal tissues stained for PEDF were taken from WT and Pedf−/− mice. Scale bar, 50 μm. (n=3 per group, representative data of three experiments).
(C-D) BrdU was injected into WT and Pedf−/− mice 6 hours before tissue collection. (C) Representative images and (D) quantification of BrdU+ cells per crypt of SI and colons. Scale bar, 50 μm. (n=5 per group, representative data of three experiments).
(E-F) (E) Representative images and (F) quantification of longitudinal sections of intestinal crypts with Lgr5EGFP mice. Scale bar, 20 μm. (n=5 per group, representative data of three experiments).
(G-H) Tamoxifen was intraperitoneally 4 days before tissue collection. (G) Representative images and (H) quantification of lineage tracing reporter mice Lgr5creERRosa26td-Tomato with WT or Pedf−/− background. Scale bar, 50 μm. (n=3 per group, representative data of three experiments).
(I) Representative images of intestinal tissues stained for PEDF were taken from sgNTC and sgPedf mice. Scale bar, 50 μm. (n=3 per group, representative data of three experiments).
(J-K) BrdU was injected into sgNTC and sgPedf mice 6 hours before tissue collection. (J) Representative images and (K) quantification of BrdU+ cells per crypt of SI and colons. Scale bar, 50 μm. (n=5 per group, representative data of three experiments).
*p<0.05, **p<0.01, (D, F, H, K, Unpaired Student’s t-test, error bars represent SEM).
Given that the Lgr5+ ISCs are the main proliferative population for epithelium replenishment,18 we utilized Lgr5EGFP reporter mice and found an increase of ISCs in the absence of PEDF (Figures 2E and 2F). Considering the increase in Lgr5+ ISC numbers, we next asked whether Paneth cell numbers could also be affected by PEDF.43 Indeed, we observed elevated Paneth cells in the SI in the absence of PEDF (Figures S2H and S2I), while other IEC subsets were not affected by PEDF (Figure S2J). Additionally, by employing the Lgr5creERRosa26LSL-td-Tomato (termed ‘Lgr5creERR26RtdT’ hereafter) fate mapping mice, more td-Tomato-positive cells extended towards the villus in Pedf−/− mice compared to control mice (Figures 2G and 2H). Notably, Pedf−/− mice still exhibited enhanced ISC expansion compared to WT mice under cohousing condition (Figure S2K). Pedf−/− mice also exhibited similar gut microbiota compared to WT mice, suggesting that the effect of PEDF on ISCs was not mediated via the gut microbiota (Figure S2M). Collectively, these results demonstrate that loss of PEDF resulted in the expansion of Lgr5+ ISCs.
Lastly, to further understand the role of liver-derived PEDF in controlling ISC homeostasis, we generated hepatic PEDF deficient mice by injecting AAV carrying either non-targeting control (NTC) single-guide RNA (sgNTC) or Pedf-specific sgRNA (sgPedf) (Figure S3A) into liver specific Cas9 knockin (AlbcreRosa26LSL-Cas9, called ‘AlbcreR26RCas9’) mice (Figure S3A). We verified specific loss of PEDF in the liver while other organ compartments remain intact PEDF expression (Figures S3B–S3D). Thus, we generated a liver specific PEDF deficient mice (called ‘sgPedf mice’). Importantly, sgPedf mice exhibited reduction of circulating PEDF compared with control sgNTC mice (Figure S3E). Given the potential impact of PEDF in hepatocellular carcinoma (HCC) development44, we re-analyzed published expression-profiling data of Pedf−/− liver (GSE63643)45 and performed immunofluorescence staining. We found hepatic PEDF has no significant impact on proliferation and angiogenesis in the liver under steady state (Figure S3F–S3I). Consistent with Pedf−/− mice, the loss of hepatic PEDF diminished binding PEDF signals at the intestinal crypt base columnar (Figure 2I), associated with enhanced ISC proliferation (Figures 2J and 2K). Furthermore, we found no obvious difference in angiogenesis46 in the intestinal tissues between WT and Pedf−/− mice (Figures S3J–S3L). Together, these results suggest that liver-derived PEDF is critical for constraining ISC expansion.
PEDF represses the Wnt/β-catenin signaling pathway on ISCs via LRP5/6.
PEDF is a suppressor of the canonical Wnt/β-catenin signaling pathway.41 We found elevated expression of Wnt/β-catenin target genes in crypt cells in the absence of hepatic PEDF (Figures S4A and 3A). Activation of the canonical Wnt pathway stabilizes the active non-phosphorylated form of β-catenin, promoting its nuclear translocation to transactivate the target genes.47 Indeed, we observed higher levels of active β-catenin in crypt cells nuclear from sgPedf mice compared to sgNTC mice (Figures S4B–S4E, 3B and 3C). PEDF treatment resulted in repressed Wnt/β-catenin target gene expression, and reduced levels of active β-catenin in crypt cells (Figures S4F–S4I). We next examined the effects of PEDF treatment on the growth of intestinal organoids. Both SI and colon crypts cultured with PEDF yielded smaller organoids (Figures 3D and 3E), associated with a reduction in Ki67+ cells in the buds compared to the controls (Figure S4J). Moreover, PEDF treatment repressed the expression of Wnt/β-catenin target genes in the organoids (Figure S4K). These results indicate that PEDF suppressed Wnt signaling thereby inhibiting ISC expansion.
Figure 3. PEDF represses the Wnt/β-catenin signaling pathway on ISCs via LRP5/6.

(A) mRNA levels of indicated genes in intestinal crypt cells from sgNTC and sgPedf mice. (n=3 per group, representative data of three experiments).
(B) Representative images of intestinal tissues stained for active β-catenin were taken from sgNTC and sgPedf mice. Bottom row is magnified from dot line square in upper row. Red arrow, nuclear β-catenin. Scale bar, upper row, 40 μm; lower row, 20 μm. (n=3 per group, representative data of three experiments).
(C) Representative immunoblot of β-catenin in intestinal tissues from sgNTC and sgPedf mice. (n=3 per group, representative data of two experiments).
(D-E) (D) Representative images and (E) quantification of surface areas of intestinal organoids were taken from WT and Pedf−/− mice with or without PEDF treatment. Scale bar, 100 μm. (n=3 per group, pooled data of two experiments).
(F) Representative images of intestinal tissues stained for PEDF from indicated mice. Scale bar, 50 μm. (n=3 per group, representative data of three experiments).
(G-H) Representative immunoblot of active β-catenin in intestinal crypt cells with or without PEDF treatment from Lgr5creERLrp5fl/flLrp6fl/fl mice pretreated (G) with or (H) without tamoxifen. (n=3 per group, representative data of three experiments).
(I-J) Immunofluorescence staining in intestinal crypt cells with or without PEDF treatment from Lgr5creERLrp5fl/flLrp6fl/fl mice pretreated with or without tamoxifen. (I) Representative images and (J) quantification of BrdU+ cells in intestinal tissues. Scale bar, 50 μm.
*p<0.05, **p<0.01, ***p<0.001, (A, One-way ANOVA with Tukey’s multiple comparison test; E, J, Two-way ANOVA with Tukey’s multiple comparison test, error bars represent SEM).
LRP5 and LRP6 are coreceptors of Wnt ligands and have been shown to interact with PEDF.41,48 To investigate whether PEDF-mediated Wnt signaling inhibition on ISCs is mediated by LRP5 and LRP6, we employed Lgr5creERLrp5fl/flLrp6fl/fl mice (Figures S4L and S4M). The loss of both LRP5 and LRP6 substantially diminished PEDF binding at the crypt sites, while the presence of one receptor was sufficient for PEDF retention (Figure 3F). Further, through exogenous PEDF administration, Lgr5creERLrp5fl/flLrp6fl/fl mice without tamoxifen pretreatment exhibited reduced active β-catenin in crypt cells (Figures S4N, 3G and S4O). However, the reduction of active β-catenin signaling was abolished in the absence of LRP5 and LRP6 in ISCs (Figures S4P, 3H and S4Q), demonstrating that PEDF-repressed ISCs proliferation required both LRP5 and LRP6. More importantly, Lgr5creERLrp5fl/flLrp6fl/fl mice without tamoxifen pretreatment exhibited a dampened ISC proliferation response to PEDF, and this effect was diminished after LRP5 and LRP6 were deleted (Figures 3I and 3J). Considering that peripheral PEDF mainly originates from hepatocytes, we have therefore established that PEDF plays a crucial role in facilitating liver-gut communication for ISC proliferation.
PEDF deficiency protects mice from intestinal inflammation.
Considering the key role of ISC in epithelial regeneration during intestinal inflammation,49 we investigated the role of PEDF for intestinal tissue repair. Using an intestinal injury model of DSS-induced colitis, we found that both Pedf−/− and sgPedf mice displayed markedly reduced disease severity compared to their control mice (Figures S5A and 4A), accompanied by attenuated tissue damage (Figures 4B, S5B–S5D). A similar disease course and tissue pathology was also observed in sgPedf mice in response to TNBS-induced colitis (Figures S5E–S5G). Moreover, PEDF treatment led to exaggerated DSS colitis with worsened epithelial injury (Figures 4C, 4D and S5H), and impaired ISC proliferation (Figures 4E and 4F). These results provide additional in vivo evidence that PEDF suppressed ISC proliferation, consequently reducing intestinal tissue repair during inflammation.
Figure 4. PEDF deficiency protects mice from intestinal inflammation.

(A) Body weight of sgNTC and sgPedf mice during DSS-induced colitis was monitored. (n=5 per group, representative data of three experiments).
(B) Representative images of hematoxylin and eosin staining of colonic tissue were taken in sgNTC and sgPedf mice at day 10 of DSS-induced colitis. Scale bar, 50 μm. (n=5 per group, representative data of three experiments).
(C-D) Mice were treated with recombinant PEDF 4 days before DSS for total of 9 days. (C) Body weight of WT mice during DSS-induced colitis was monitored. † Mice dead. (D) Representative images of hematoxylin and eosin staining of colonic tissue were taken in WT mice at day 10 of DSS-induced colitis. Scale bar, 50 μm. (n=5 per group, representative data of three experiments).
(E-F) BrdU was injected into WT mice treated with recombinant PEDF at day 10 of DSS-induced colitis 6 hours before tissue collection. (E) Representative images and (F) quantification of BrdU+ cells in colonic tissues. Scale bar, 50 μm. (n=3 per group, representative data of three experiments).
(G) Mice were treated with 44mer peptide 4 days before DSS for total of 9 days. Body weight of WT mice during DSS-induced colitis was monitored. (n=4 per group, representative data of three experiments).
(H-I) Mice were treated with 34mer peptide 4 days before DSS for total of 9 days. (H) Body weight of WT mice during DSS-induced colitis was monitored. † Mice dead. (I) Representative images of hematoxylin and eosin staining of colonic tissue were taken in WT mice at day 10 of DSS-induced colitis. Scale bar, 50 μm. (n=5 per group, representative data of three experiments).
(J-K) Mice were treated with 34mer peptide 4 days before DSS for total of 9 days. BrdU was injected into WT mice at day 10 of DSS-induced colitis 6 hours before tissue collection. (J) Representative images and (K) quantification of BrdU+ cells in colonic tissues. Scale bar, 50 μm. (n=3 per group, representative data of three experiments).
(L-M) Mice were treated with anti-PEDF (α-PEDF) antibody on the same day as DSS for 6 days. (L) Body weight of WT mice during DSS-induced colitis was monitored. (M) Representative images of hematoxylin and eosin staining of colonic tissue were taken in WT mice at day 10 of DSS-induced colitis. Scale bar, 50 μm. (n=5 per group, representative data of three experiments).
NS: not significant, *p<0.05, **p<0.01, ***p<0.001, (A, C, G, H, L, Two-way ANOVA with ukey’s multiple comparison test; F, K, Unpaired Student’s t-test, error bars represent SEM).
Previous studies show that different polypeptides within PEDF represent distinct bioactivities. Synthetic peptides based on a 34-amino acid peptide (Asp44–Asn77, 34mer) and a 44-amino acid peptide (Val78–Thr121, 44mer) exhibit distinct anti-angiogenic and differentiating activities, respectively.50–53 While the administration of 44mer showed no impact on disease progress (Figures 4G and S5I), supplementation with 34mer enhanced colitis severity, as evidenced by increased tissue damage and pathology (Figures 4H, 4I and S5J). Additionally, we found repressed epithelial proliferation during DSS colitis with 34mer treatment (Figures 4J and 4K), suggesting that 34mer functions as the effective segment of PEDF that suppresses ISC proliferation. Finally, since PEDF can exacerbate intestinal damage during DSS colitis, we administrated a PEDF neutralizing antibody to DSS-treated mice and observed attenuated colitis severity along with reduced tissue damage, in comparison to the control IgG treatment group (Figures 4L, 4M and S5K).
The gut-liver axis calibrates PEDF production for ISC homeostasis.
We next investigated whether there is a causative link between proliferation of ISCs and PEDF derived from the liver. By monitoring the BrdU incorporation during DSS colitis, we noticed that ISCs proliferation was enhanced during the progression phase and downregulated during the recovery phase. (Figures 5A and 5B). Meanwhile, PEDF levels in both liver and circulation were inversely correlated with ISCs expansion (Figures 5C, S6A–S6C). Accordingly, a diminished PEDF signal was noticed in colonic tissue at peak stage of colitis compared to the naïve and recovery states (Figure S6D). We hypothesized that intestinal inflammation may suppress the production of liver-derived PEDF.
Figure 5. The gut-liver axis calibrates PEDF production for ISC homeostasis.

(A-B) BrdU was injected into WT mice at indicated time point of DSS-induced colitis for 6 hours before tissue collection. (A) Representative images and (B) quantification of BrdU+ cells in colonic tissues. Scale bar, 50 μm. (n=3 per group, representative data of three experiments).
(C) PEDF level was assessed in WT mice plasma collected at indicated time point of DSS-induced colitis. (n=4 per group, representative data of two experiments).
(D) PCoA of transcriptome from hepatocytes collected at indicated time point of DSS-induced colitis from WT mice. (n=3 per group, representative data of two experiments).
(E) KEGG analysis of murine IECs in TLR signaling and NFkB signaling pathways were compared between day 0 and 10 (upper row), and day 10 and 20 (lower row) of DSS-induced colitis from WT mice. NES, normalized enrichment score.
(F) Body weight of Myd88fl/fl and AlbcreMyd88fl/fl mice during DSS-induced colitis was monitored. (n=3 per group, representative data of two experiments).
(G) Representative images of hematoxylin and eosin staining of colonic tissue were taken in Myd88fl/fl and AlbcreMyd88fl/fl mice at day 10 of DSS-induced colitis. Scale bar, 50 μm. (n=3 per group, representative data of three experiments).
(H-I) BrdU was injected into Myd88fl/fl and AlbcreMyd88fl/fl mice at day 0 and 10 of DSS-induced colitis 6 hours before tissue collection. (H) Representative images and (I) quantification of BrdU+ cells in colonic tissues. Scale bar, 50 μm. (n=3 per group, representative data of three experiments).
(J) PEDF level was assessed in plasma collected at indicated time point of DSS-induced colitis from Myd88fl/fl and AlbcreMyd88fl/fl mice. (n=3 per group, representative data of three experiments).
(K-L) BrdU was injected into Tlr4fl/fl and AlbcreTlr4fl/fl mice at day 0 and 10 of DSS-induced colitis 6 hours before tissue collection. (K) Representative images and (L) quantification of BrdU+ cells in colonic tissues. Scale bar, 50 μm. n=3 per group, representative data of three experiments.
(M) PEDF level was assessed in plasma collected at indicated time point of DSS-induced colitis from Tlr4fl/fl and AlbcreTlr4fl/fl mice. n=3 per group, representative data of three experiments.
(N-O) Mice were treated with α-PEDF antibody the same day as DSS for 6 days. (N) Body weight of Tlr4fl/fl and AlbcreTlr4fl/fl mice during DSS-induced colitis was monitored. (O) Representative images of hematoxylin and eosin staining of colonic tissue were taken in Tlr4fl/fl and AlbcreTlr4fl/fl mice at day 10 of DSS-induced colitis. Scale bar, 50 μm. (n=4 per group, representative data of two experiments).
NS, not significant; *p<0.05, **p<0.01, ***p<0.001, (B, C, One-way ANOVA with Tukey’s multiple comparison test; F, H, K, J, M, N, Two-way ANOVA with Tukey’s multiple comparison test, error bars represent SEM).
Given that the gut microbiome could translocate to the liver via the portal vein,54 we asked whether microbial danger signals are sensed by the hepatocytes and influence PEDF production in the liver due to enhanced permeability of the epithelial barrier during gut inflammation. Hepatocytes transcriptomics showed a distinct mRNA landscape at different stages of DSS colitis (Figure 5D). Importantly, TLR and NFκB signaling pathways were upregulated at the peak of DSS colitis compared to the naïve and recovery phases, indicating elevated microbial danger signals in the liver during colitis (Figure 5E). We therefore examined DSS colitis in mice with a targeted deletion of MyD88 in liver cells (AlbcreMyd88fl/fl), preventing the hepatocytes from sensing microbial danger signals. These mice showed a more severe colitis (Figures 5F, 5G and S6E), associated with compromised ISC proliferation during tissue damage (Figures 5H and 5I). Further, AlbcreMyd88fl/fl mice exhibited little change in PEDF levels in both liver and circulation throughout the disease course compared to the control mice (Figures S6F–S6H and 5J), suggesting microbial sensing in the liver is critical for hepatic PEDF production. Considering that LPS is a dominant and well-studied microbial product, we investigate its role in regulating liver PEDF. Indeed, gut inflammation elevated the burden of LPS in the liver (Figure S6I). Additionally, LPS treatment repressed PEDF expression in hepatocytes (Figure S6J), indicating that the liver reduced its PEDF production by detecting elevated microbial LPS during intestinal inflammation. Mice loss the liver LPS sensing receptor (AlbcreTlr4fl/fl) exhibited more severe DSS colitis (Figures S6K–S6M). Also, we observed similar phenotypes in AlbcreTlr4fl/fl mice as in AlbcreMyd88fl/fl mice, regarding ISC proliferation and peripheral PEDF kinetics during the disease course (Figures 5K–5M, S6N–S6P). Importantly, the elimination of PEDF by a neutralizing antibody protected the animals from colitis. This abolition of PEDF also resulted in the disappearance of the difference in disease severity between AlbcreTlr4fl/fl and the control mice (Figures 5N, 5O and S6Q). Together, these data suggest that liver’s sensing of microbial LPS resulted in a repressed peripheral PEDF levels, which in turn promoted ISC proliferation for tissue repair and the resolution of intestinal inflammation.
Microbial LPS regulates PEDF production via liver-derived PPARα.
Next, we attempted to investigate the molecular mechanism by which LPS regulates hepatic PEDF. It has been reported that PPAR heterodimer transactivates Pedf.55 We found that the liver PPARα (Nr1c1, termed ‘Ppara’ hereafter) expression patterns were correlated with PEDF levels during DSS colitis (Figures 6A, S7A and S7B), and the loss of hepatic MyD88 or TLR4 abolished PPARα fluctuations during the disease (Figures S7C–S7E and 6B). Thus, we hypothesized that LPS represses PEDF by inhibiting hepatic PPARα. Indeed, LPS treatment suppressed PPARα expression in hepatocytes (Figure S7F). LPS-mediated ERK activation56 is known to inhibit the activity of hepatocyte nuclear factor 4 (HNF4) by promoting its phosphorylation.57 Given that HNF4 directly transactivates PPARα,58 we hypothesized that LPS suppresses PPARα expression by inhibiting HNF4 activity. We first confirmed that LPS promotes ERK1/2 phosphorylation in hepatocytes (Figures 6C and S7G). Subsequently, we conducted immunoprecipitation experiments on hepatocytes and observed phosphorylated serine on HNF4 upon LPS stimulation. Importantly, this modification was nullified in the presence of an ERK inhibitor, U0126 (Figures 6C and S7G). Our ChIP-PCR assay demonstrated that LPS stimulation reduces the interaction between HNF4 and the Ppara promoter (Figure 6D), leading to a decrease in Ppara expression (Figure 6E). Notably, the suppression of ERK activities effectively reversed this effect (Figures 6D and 6E). These collective findings indicate that LPS-mediated ERK activation hinders the binding of HNF4 to the Ppara promoter, thereby attenuating the expression of PPARα.
Figure 6. Microbial LPS regulates PEDF production via liver-derived PPARa.

(A) mRNA levels of Pedf and Ppara were assessed from mouse liver tissues collected at day 0 and day 10 of DSS-induced colitis. (n=3 per group, representative data of three experiments).
(B) Representative immunoblot of PPARα in liver tissues from Tlr4fl/fl and AlbcreTlr4fl/fl mice at indicated time point of DSS-induced colitis. (n=3 per group, representative data of two experiments).
(C-D) Primary murine hepatocytes were treated with indicated stimulation for 2 hours. (C) Co-immunoprecipitation (IP), with antibody to anti-pSer of proteins from lysates of hepatocytes, detected by immunoblot analysis with indicated antibodies. (n=3 per group, representative data of three experiments). (D) ChIP-PCR analysis of the abundance of HNF4 bound to the Ppara promoter in murine hepatocytes. (n=4 per group, representative data of two experiments).
(E) mRNA level of Ppara was assessed from murine primary hepatocytes treated with indicated stimulation for 12 hours. (n=4 per group, representative data of three experiments).
(F) ChIP-PCR analysis of the abundance of PPARα bound to the Pedf promoter with anti-PPARα or control antibodies in murine hepatocytes. (n=3 per group, representative data of three experiments).
(G) Luciferase activity in HEK293T cells transfected with an Pedf-promoter-driven luciferase reporter (Pedf-luc) together with a PPARα or control vector (−). (n=3 per group, representative data of three experiments).
(H) mRNA level of Pedf was assessed from murine primary hepatocytes stimulated with LPS for 12 hours. (n=4 per group, representative data of three experiments).
(I) Body weight of Pparafl/fl and AlbcrePparafl/fl mice during DSS-induced colitis. (n=5 per group, representative data of two experiments).
(J) Representative images of hematoxylin and eosin staining of colonic tissue in Pparafl/fl and AlbcrePparafl/fl mice at day 10 of DSS-induced colitis. Scale bar, 50 μm. (n=3 per group, representative data of two experiments).
(K-L) BrdU was injected into Pparafl/fl and AlbcrePparafl/fl mice at day 0 and 10 of DSS-induced colitis 6 hours before tissue collection. (K) Representative images and (L) quantification of BrdU+ cells in colonic tissues. Scale bar, 50 μm. (n=3 per group, representative data of two experiments).
(M) PEDF level was assessed in plasma collected at indicated time point of DSS-induced colitis from Pparafl/fl and AlbcrePparafl/fl mice. (n=3 per group, representative data of three experiments).
NS, not significant, **p<0.01, (A, D, E, One-way ANOVA with Tukey’s multiple comparison test; H, I, L, M, Two-way ANOVA with Tukey’s multiple comparison test; F, G, Unpaired Student’s t-test, error bars represent SEM).
Moreover, we demonstrated that PPARα directly promoted PEDF expression via its interaction with the Pedf promoter (Figures 6F and 6G). Loss of PPARα in hepatocytes led to reduced PEDF production and abolished the suppressive effect of LPS on PEDF compared to WT hepatocytes (Figure 6H). Consistent with these results, AlbcrePparafl/fl mice exhibited attenuated colitis (Figures 6I, 6J and S7H), associated with enhanced ISC proliferation during the tissue damage compared to the control animals (Figures 6K and 6L). And the loss of hepatic PPARα resulted in dampened peripheral PEDF levels and an inability to counteract the PEDF repression due to intestinal inflammation, unlike the control mice. (Figures 6M, S7I–S7K). Collectively, our data elucidated that PPARα played a key role in promoting liver PEDF production in response to microbial LPS.
Fenofibrate enhances susceptibility of intestinal inflammation via PEDF.
Fenofibrate (FB) is a PPARα agonist that is used as a hypolipidemic therapeutic agent.59,60 However, increased colitis cases were reported by patients taking FB in the clinic, and the underlying mechanisms are still unclear.61,62 We observed that FB treatment increased the severity of murine DSS colitis (Figures S8A–S8C), and promoted Pedf expression in hepatocytes (Figure S8D). Thus, we hypothesized that FB promotes liver PEDF to dampen ISC expansion, increasing the risk of gut inflammation. In support of this notion, FB failed to exacerbate intestinal inflammation in PEDF deficient mice (Figures 7A, 7B and S8E), suggesting that PEDF significantly contributed to FB-mediated colitis. Additionally, PPARα enhanced the effect of FB in promoting Pedf expression (Figure 7C). Furthermore, FB treatment elevated PEDF in WT mice but not AlbcrePparafl/fl mice (Figures S8F, S8G and 7D). This elevation consequently led to exacerbated DSS colitis in Pparafl/fl mice, whereas no such effect was observed in AlbcrePparafl/fl mice (Figures 7E, 7F and S8H). Importantly, the neutralizing PEDF treatment rescued the mice from severe DSS colitis caused by FB (Figures 7G, 7H and S8I). These data collectively demonstrate that liver-derived PPARα plays a critical role in FB-induced intestinal inflammation. Neutralizing PEDF could offer a potential solution to counteract the heightened susceptibility to intestinal inflammation during FB treatment.
Figure 7. FB enhances susceptibility of intestinal inflammation via PEDF.

(A-B) Mice were treated with FB one time at day 4 of DSS. (A) Body weight of WT and Pedf−/− mice during DSS-induced colitis was monitored. † Mice dead. (B) Representative images of hematoxylin and eosin staining of colonic tissue were taken in WT and Pedf−/− mice at day 10 of DSS-induced colitis. Scale bar, 50 μm. (n=4 per group, representative data of three experiments).
(C) Luciferase activity in HEK293T cells transfected with a Pedf-promoter-driven luciferase reporter (Pedf-luc) together with a PPARα vector and FB treatment. (n=3 per group, representative data of three experiments).
(D) PEDF levels in plasma were assessed from Pparafl/fl and AlbcrePparafl/fl mice treated with FB for 8 hours. (n≥3 per group, representative data of three experiments).
(E-F) Mice were treated with FB one time at day 4 of DSS. (E) Body weight of Pparafl/fl and AlbcrePparafl/fl mice during DSS-induced colitis was monitored. (F) Representative images of hematoxylin and eosin staining of colonic tissue were taken in Pparafl/fl and AlbcrePparafl/fl mice at day 10 of DSS-induced colitis. Scale bar, 50 μm. (n=3 per group, representative data of three experiments).
(G-H) Mice were treated with FB one time at day 4 of DSS, with or without α-PEDF antibody treatment on day 0 of DSS for total of 6 days. (G) Body weight of WT mice during DSS-induced colitis was monitored. † Mice dead. (H) Representative images of hematoxylin and eosin staining of colonic tissue were taken in WT mice at day 10 of DSS-induced colitis. Scale bar, 50 μm. (n=3 per group, representative data of three experiments).
(I) Representative immunoblot of PEDF protein in indicated human tissues. (n=2 per group, representative data of two experiments).
(J-K) (J) Representative images and (K) quantification of surface areas of human iPSC-derived intestinal organoids with or without PEDF treatment. Bottom row is magnified from dot line square in upper row. Scale bar, 100 μm. (n=5 per group, representative data of three experiments).
(L) Representative images of human iPSC-derived intestinal organoids stained for Ki67. Scale bar, 100 μm. (n=3 per group, representative data of three experiments).
(M) mRNA levels of indicated genes from human iPSC-derived intestinal organoids with or without PEDF treatment. (n=3 per group, representative data of three experiments).
(N-O) The correlation between circulating PEDF and (N) circulating LPS or (O) percentage of Ki67+ cells in the intestinal tissues in the groups of health donors (HD), Crohn’s disease (CD) patients and ulcerative colitis (UC) patients. (n≥20 per group, pooled data of two experiments).
NS, not significant, *p<0.05, **p<0.01, ***p<0.001, (C, One-way ANOVA with Tukey’s multiple comparison test; A, D, E, G, Two-way ANOVA with Tukey’s multiple comparison test; K, M, Unpaired Student’s t-test; N, O, Two-sided Pearson correlation test, error bars represent SEM).
Human PEDF is reduced during IBD development and represses ISC proliferation
Finally, we examined the human relevance of our findings. Consistent with mouse data, PEDF was predominantly generated from the liver in human (Figures 7I and S8J). We also observed PEDF signaling in both SI and colon tissues from healthy donors (Figure S8K). Using human-induced pluripotent stem cells (iPSCs), we generated human intestinal organoids. We found that the presence of PEDF reduced the size of organoids and Ki67+ cells in the buds (Figures 7J–7L), associated with repressed expression of Wnt/β-catenin target genes (Figure 7M). Furthermore, we observed that IBD patients during their acute phase exhibited higher LPS levels, increased IEC proliferation, and lower PEDF levels compared to healthy donors (Figures 7N and 7O). Notably, circulating PEDF showed an inverse correlation with peripheral LPS levels and IEC proliferation, suggesting that elevated LPS levels suppressed PEDF expression, resulting in increased proliferation of IECs in IBD (Figures 7N and 7O). These findings also highlight PEDF’s potential as a marker for diagnosing the acute phase of IBD.
Discussion
While different studies have illustrated anatomical connections between the liver and intestine,4 the cellular and molecular mechanisms of how such bidirectional communications contribute to gut health and disease remain unclear. We have demonstrated that liver-derived PEDF functions as a Wnt/β-catenin inhibitor, restricting ISC proliferation via LRP5/6. In addition, we show that intestinal inflammation enhances liver microbial LPS burden and represses circulating PEDF levels via the hepatic PPARα signaling pathway, which in turn promotes ISC expansion for tissue repair. Thus, our findings expand the current understanding of how the gut-liver axis contributes to intestinal physiology and inflammation by controlling ISC fitness.
PEDF was initially identified as a neurotrophic factor in retinal pigmented epithelium cells.63–65 Later, different organs were also shown to produce PEDF.66–68 While PEDF produced by IECs inhibits their proliferation in vitro,69 our data suggest that liver-derived PEDF is the major driver in calibrating ISC homeostasis in vivo. In fact, the constant production of PEDF from the liver under steady state implicates a physiological need of PEDF-controlled ISC expansion for intestinal homeostasis. Moreover, there appears to be an increased association between non-alcoholic fatty liver disease (NAFLD) and IBD patients.70 While both IBD and NAFLD can result from environmental and genetic factors, the precise causality and interplay between these two conditions are still under investigation. Conversely, NAFLD patients exhibit an increased level of PEDF,71–73 which may exacerbate IBD through the pathway described here.
Within the intestine, LRP5 and LRP6 are found exclusively in proliferative epithelial cells,74 indicating that the LRP5 and LRP6-mediated canonical Wnt signaling pathway dominates ISCs regulation. Our findings are in agreement with a previous study that PEDF binds to both LRP5 and LRP6.41 Additionally, PEDF acts as a ligand for several receptors with diverse functions.75,76 While some receptors utilize PEDF to repress Wnt signaling,41 others are involved in immune responses.76 For instance, PEDF promotes proinflammatory responses by activating macrophage to release TNF-α via adipose triglyceride lipase (ATGL), contributing to chronic inflammation.77 Although the role of ATGL in intestinal inflammation is unclear, PEDF presumably exacerbates the disease by activating inflammatory macrophage,78 in addition to inhibiting Wnt signaling in ISCs. Additional research is necessary to delineate the specific functions of various PEDF receptors in relation to gut well-being and pathology. In the current study, a higher dose of the 34mer was administered to achieve the same effect on DSS colitis as the PEDF protein. Compared to proteins, peptides exhibit lower affinity, rapid excretion from the body (or a shorter half-life in the body), and vulnerability to protease-mediated degradation.79 Thus, further examination is required to gain insight into the precise usage of PEDF polypeptides for different circumstances.
PEDF inhibits tumorigenesis which is attributed to its anti-angiogenic effects.75 More importantly, other than targeting tumor associated vasculature, PEDF directly represses tumor cell proliferation both in vivo and in vitro.80–82 Additionally, angiogenesis has been considered as an important feature of pathogenesis in IBD patients and experimental colitis.83 More importantly, different studies have shown that angiogenesis blockade is a potential therapeutic approach to experimental colitis.84,85 PEDF is an endogenous inhibitor of angiogenesis, effectively blocking vascular endothelial growth factor (VEGF)-driven angiogenesis and vascular permeability by regulating the proteolysis of VEGF.86 Considering that our data on PEDF and its role in promoting DSS colitis, it is likely that PEDF-mediated anti-angiogenesis does not play a major role in colitis development.
PEDF functions as a detrimental controller, effectively restraining excessive ISC growth by inhibiting the Wnt/β-catenin signaling pathway. Lgr5+ ISCs play a critical role as cancer stem cells within primary intestinal adenomas.87 The rapid proliferation of ISCs has the potential to trigger hyperproliferation and tumorigenesis.26 It is possible that the production of PEDF through communication between the liver and gut serves to curb ISC hyperproliferation, thus safeguarding the intestinal tissue against tumor formation. Furthermore, given that ISCs represent the primary cellular origin of colon cancer, this regulatory mechanism plays a critical role in tumor prevention. Therefore, PEDF could potentially function as a gatekeeper, finely calibrating intestinal homeostasis by inhibiting ISC hyperproliferation and preventing tumorigenesis, while also regulating inflammation through LPS feedback and expediting tissue repair in case of intestinal damage. Additionally, PEDF is known to function as a self-renewal factor, contributing to stem cell expansion. However, a lot of these studies focus on neural stem cells or retinal stem cells.88–90 Moreover, it has been reported that PEDF regulates the mass of the prostate and pancreas under steady state.81 Thus, it is possible that hepatic PEDF could also communicate with organ compartments other than ISCs to influence stem cell proliferation, which requires further investigation.
The role of PPARα in intestinal pathophysiology is paradoxical: it promotes intestinal inflammation in some studies,61,91 while alleviating colon carcinogenesis in others.92 These conflicting results suggest that PPARα might have distinct roles for intestinal homeostasis and inflammation, depending on the tissue or cellular context. Both intra- and extra-intestinal PPARα play distinct roles for gut inflammation. In addition, FB treatment protects mice from colon tumorigenesis by repressing cell proliferation through intestinal PPARα.92 Building upon previous studies, our findings demonstrate that PPARα regulates ISC expansion through both cell intrinsic and extrinsic mechanisms. Hence, it is essential to develop PPARα targeted treatment with greater tissue specificity.
Altogether, we have demonstrated herein that the gut-liver axis forms a negative feedback loop, contributing to the maintenance of ISC homeostasis and intestinal physiology through the modulation of hepatic PEDF production. Our study elucidates that PEDF functions as a gatekeeper to restrain Wnt/β-catenin signaling, protecting ISCs from hyperproliferation. We further demonstrate that the translocation of microbiota to the liver during intestinal inflammation represses PEDF production by hepatocytes, indicating that such gut-liver communication enables the self-calibration of PEDF production to achieve intestinal homeostasis.
Limitations of the study
We demonstrate that hepatectomy enhances ISC proliferation. While WNT signaling is a primary driver of ISC proliferation, we cannot exclude the possibility that other ligands derived from the liver contribute to ISC stemness. We can re-analyze our RNA-seq and proteomics data to investigate whether there are additional potential liver-derived ligands controlling ISC stemness. The genetic evidence suggests that dynamic regulation of Pedf expression during the course of colitis is TLR4-dependent. However, other DAMPs could also act as TLR ligands to exert the effects to regulate Pedf expression. It is possible that LPS liver burden during colitis is much greater than other TLR ligands. Alternatively, the TLR4 expression could be higher than that of other TLRs on hepatocytes. The specific effect and mechanism of LPS in repressing PEDF in vivo still need to be addressed. Additionally, although our work demonstrates that PEDF restrains ISC expansion, further investigation is required to examine whether and how PEDF regulates stem cell fitness in sites other than the intestine, such as the skin.
STAR METHODS
Resource availability
Lead contact
Further information and requests for resources and reagents should be directed to and will be fulfilled by the Lead Contact, Chuan Wu (chuan.wu@nih.gov).
Materials availability
This study did not generate any new unique reagents.
Data and code availability
Plasma proteomic data have been deposited at Dataset: MSV000091409. Bulk RNA-seq data have been deposited at GEO: GSE228829. The Plasma proteomic dataset and the GEO dataset are publicly accessible as of the date of publication.
This paper does not report original code.
Any additional information required to reanalyze the data reported in this paper is available from the lead contact upon request.
Experimental Model and Study Participant Details
Mice
C57BL/6J (WT), Lgr5creER-eGFP, Albcre, Rosa26tdTomato, Rosa26LSL-Cas9, Myd88flox, Tlr4flox mice were purchased from Jackson Laboratory; Serpinf1−/− mice were generated as previously described81; Lrp5fl/flLrp6fl/fl mice were from Dr. Bart O. Williams94; Pparαflox mice were from Dr. Frank J. Gonzalez93. Mouse lines were interbred in our facilities to obtain the final strains described in the text. Mice were maintained at the National Cancer Institute facilities under specific pathogen-free conditions. Mice were fed a standard chow diet and used at 7–12 weeks of age for most experiments. All experiments were carried out in accordance with guidelines prescribed by the Institutional Animal Care and Use Committee at the National Cancer Institute. For deletion of Lrp5 and Lrp6 in the intestinal epithelium, 1mg Tamoxifen was i.p. injected daily for 5 days or 1 day to Lgr5creERLrp5fl/flLrp6fl/fl mice before the experiments. For lineage-tracing, Lgr5creERRosa26tdTomato mice were i.p injected with 1mg Tamoxifen 1 day before the experiments.
Human samples
Human samples were collected from total 135 Chinese IBD patients and health individuals under Institutional Review Board approved protocol R2021–365R at Zhongshan Hospital, Fudan University, China. Informed consent was obtained for all subjects. Subject baseline characteristics for the samples are listed in Table S1. Human PEDF measurement was performed in plasma samples and LPS concentration was detected in serum samples. Fresh biopsy tissues from patients who received colonoscopy were fixed with 4% paraformaldehyde and embedded in paraffin.
Method details
Murine surgery
Two-thirds partial hepatectomy was largely performed according to the previous study95. Briefly, after anaesthetizing adult mice with a mixture of ketamine, xylazine and acepromazine, the peritoneal cavity was open by making an incision in abdominal skin and muscle. The left lateral lobe and median lobe were ligated with a 4–0 silk thread and cut. One drop of 0.5% bupivacaine hydrochloride solution was placed on top of the sutured peritoneum. Buprenorphine SR was subcutaneously injected at 1 mg/kg after skin closure. Mice were placed on a warming pad for recovery. Laparotomy was performed on the control group (sham). Mice were monitored every 12 hours until sacrifice.
For splenectomy, a longitudinal incision was made on the left dorsolateral side of the abdomen of anaesthetized adult mice and spleen was carefully exteriorized. The afferent and efferent vessels of the spleen were ligated with a 4–0 silk thread, and the spleen was removed. After suturing the abdominal wall and skin, mice recovered as mentioned above.
Plasma proteomics analysis
100μg plasma protein were added in 100μl of 50mM triethylammonium bicarbonate buffer, then reduced and alkylated using 5mM DTT at 65°C for 20min followed by 40mM methyl-methanethiosulfonate at room temperature for 40min. Samples were stored in 5 volumes of cold acetone at −20°C overnight, and then centrifuged at 15000g, 4°C for 30min. Supernatant was removed and, protein pellet was resuspended in equal volume of cold (−20°C) acetone and then centrifuged again to discard the supernatant. The pellets were air-dried for 5min in clean hood and 100μl of 50mM triethylammonium bicarbonate buffer was added. Protein digestion was performed by using 4μl of 1mg/ml MS-grade Trypsin Protease at 37°C overnight. The resulting peptides were labeled with TMT reagents by TMT10plex Isobaric Label Reagent Set (Thermo Scientific) according to the manufacturer’s instruction. TMT-labeled peptides were dried to half volume using a SpeedVac concentrator, and then acidified with 1% trifluoroacetic acid (TFA). TMT-labeled peptides were cleaned 3 times with washing buffer (2.5% acetonitrile in 0.1% TFA) and eluted 2 times with elution buffer (60% acetonitrile in 0.1% TFA) by using TopTip C-18 (Glygen) according to the manufacturers’ protocols. All samples were mixed into one tube and dried to 5μl using a SpeedVac concentrator.
NanoLC-MS/MS analysis was conducted by using a Thermo Scientific Fusion Lumos Tribrid mass spectrometer interfaced to a UltiMate3000 RSLCnano HPLC system. 1μg of TMT labeled peptide mixture was loaded and desalted in an Acclaim PepMap 100 trap column (75μm, 2cm) at 4μl/min for 5min. Peptides were then eluted into a 7μm× 250mm Accalaim PepMap 100 column (3μm, 100 Å) and chromatographically separated using a binary solvent system consisting of A: 0.1% formic acid and B: 0.1% formic acid and 80% acetonitrile, at a flow rate of 300nl/min. A gradient was run from 1% B to 42% B over 150min, followed by a 5-min wash step with 80% B and a 10-min equilibration at 1% B before the next sample was injected. Precursor masses were detected in the Orbitrap at R=120,000 (m/z 200). HCD fragment masses were detected in the orbitrap at R=50,000 (m/z 200). Data-dependent MS/MS was carried out with top of speed setting, cycle time 2s with dynamic exclusion of 20s.
Protein identification and relative quantification were carried out using Proteome Discoverer software package (v2.5 Thermo Scientific). Raw data was searched against a Mus musculus proteome database from Protein Center along with a contaminant protein database with Sequest HT search engine. Up to 2 missed cleavages were allowed. Precursor mass tolerance was 10ppm, fragment 0.02 Da. Carbomidomethylation on C and TMTPro on K and peptide N-terminus were set as static modifications. M oxidation and protein N-terminal acetylation were set as variable modifications. For quantification, samples were normalized based on total peptide abundance. Protein ratios were calculated based on protein abundances and hypothesis testing was ANOVA based on the abundances of individual proteins. Spectra with >50% isolation interference were excluded.
IEC and crypt isolation
The isolated small intestine and colon tissues were flushed with cold PBS, cut longitudinally into roughly 5 mm pieces, and further washed with cold PBS. The tissue fragments were incubated in 2 mM EDTA with PBS for 30 min on ice. After removal of EDTA medium, the tissue fragments were vigorously suspended by using a 10-ml pipette with cold PBS. The supernatant was collected as IEC none-crypt enriched fraction. Small intestine samples were then incubated in new 5mM EDTA-PBS at 4°C for an additional 60 min. The cold PBS/vortex was repeated 2 more times, and crypt-enriched fraction was collected by the 3rd round wash. Colon samples were washed with cold PBS twice and vigorously vortexed in RPMI media containing 1mg/ml Collagenase D, followed by 30 min incubation at 37°C. After adding 20 ml cold PBS, samples were vigorously vortexed and passed through a 70-μm cell strainer for crypt enrichment.
AAV production and delivery
The non-targeting or Pedf-specific sgRNAs were first cloned into px459 vector. The cassette containing U6 promoter, sgRNA sequence and gRNA scaffold, was inserted into pAAV vector to generate pAAV-sgNTC or pAAV-sgPedf. Recombinant AAV8 viruses were produced as previously described96. Protein gels were run to quantify virus titers97. Viruses were diluted to a concentration of approximately 2 × 10¹² gc/ml for the experiments. AlbcreR26RCas9 mice were intravenously injected with AAV at 1~2 × 10¹¹ gc in 100μl PBS. The mice were analyzed 2 weeks after the AAV injection.
Mouse intestinal organoid culture
Isolated crypts obtained as described above were suspended in cold Matrigel. Following polymerization, IntestiCult Organoid Growth Medium was added and refreshed every 3–4 days. Organoids were maintained at 37°C, 5% CO2 and propagated weekly. For mPEDF treatment, organoids in Matrigel were mechanically disrupted by pipetting with 1 ml pipette tip and cold PBS to depolymerize the Matrigel and generate organoid fragments. After washing away the old Matrigel by spinning down at 300 × g for 5 min, organoid fragments were incubated in DMEM/F12 media containing 100 ng/ml Noggin and 50 ng/ml EGF with or without 4 ug/ml mPEDF at 37°C, 5% CO2 for 1 hour. Organoid fragments were washed with cold PBS and then replated in Matrigel, followed by 3-day culture in IntestiCult Organoid Growth Medium.
Human iPSC derived intestinal organoid generation and culture
The human iPSC line ND1.4 derived from human fibroblast was got from iPSC core in National Heart, Lung, and Blood Institute (NHLBI). The iPSCs were maintained in the feeder free Essential 8™ Medium on Matrigel. The differentiation from iPSCs into intestinal organoids were performed with STEMdiff™ Intestinal Organoid Kit according to the manufacturer’s instructions. The human intestinal organoids were cultured in STEMdiff™ Intestinal Organoid Growth Medium in Matrigel. All human cell culture experiments were performed under signed consent and approved by the NIH Review Board (IRB), PRD #7169. 4 ug/ml Human PEDF was added for treatment.
Organoid measurement
For size evaluation, the surface area of organoid horizonal view was measured. If all organoids in a well could not be measured, several random non-overlapping pictures were acquired from each well using a BZ-X710 (Keyence) and then analyzed using BZ-X Analyzer software (Keyence).
Murine colitis model
DSS induced colitis was initiated by treatment of mice with 2.5% DSS (36,000–50,000 mol wt; MP Biomedicals) in drinking water for 6 days. DSS was then replaced with normal water for another 14–15 days. Body weight was monitored daily. Mouse recombinant PEDF, 34-mer and 44-mer PEDF peptide were i.p. injected at 0.05, 25 and 25 mg/kg respectively daily for 9 days, and at day 4, DSS was given in the drinking water. Anti-PEDF antibody was i.p. injected at 0.05 mg/kg daily for 6 days, simultaneously with DSS treatment. Fenofibrate were i.p. injected at 10 mg/kg once at day 4 of DSS.
TNBS induced colitis was performed by pre-sensitization of 150μl 1% 2,4,6-Trinitrobenzenesulfonic acid (TNBS) solution on the skin of the mouse back. 7 days later, the mice were given 100ul 2.5% TNBS in 50% ethanol by rectal administration with a catheter under anesthesia. Following the instillation of the catheter, the animals will be kept vertical for 30secs.
Immunofluorescence
Mouse intestine tissues were fixed in 10% formalin and preserved in 70% ethanol. Samples were then embedded in paraffin and cut into 10-μm longitudinal sections, and H&E staining for the intestinal tissues were performed by Histoserv Inc (Germantown, MD). For immunofluorescence staining, slides were deparaffinized by xylene and antigen retrieval was conducted for 20 min in a 95°C-water bath in 10 mM sodium citrate, pH 6.0 followed by a 15 min incubation at room temperature. Slides were washed, blocked in 10% normal donkey serum, and stained with the primary antibodies, anti-BrdU (1:100), anti-Ki67 (1:100), anti-PEDF (1:50), anti-Lysozyme (1:1000), anti-active β-catenin (1:400), anti-cleaved Caspase-3 (1:500) and secondary antibodies conjugated to Alexa fluor 488 or 594. Slides were mounted in Fluoromount-G with DAPI and imaged on a Nikon T2i inverted microscope. Image analysis was done using ImageJ analysis software. For quantification of BrdU and Lysozyme, marker-positive cells were counted and calculated from 10 crypts in each slide. For BrdU incorporation, BrdU was i.p. injected at 100 mg/kg 6 hours before sample collection.
For human colon tissue section, endogenous peroxidase activity was blocked by 3% hydrogen peroxide. Samples were incubated in EDTA buffer under microwaving to retrieve antigens and blocked by 5% BSA. Total cell nucleus and Ki-67 positive nucleus were counted respectively and the Ki-67 positive rate was calculated as Ki-67 positive nucleus / Total cell nucleus.
For endogenous fluorescence detection, intestine was fixed in 4% paraformaldehyde (PFA) at 4°C for 4 hours and dehydrated in 30% sucrose overnight. The tissue was embedded in O.C.T compound, frozen in liquid nitrogen, and cryosectioned at −21°C into 5 μm thickness in Leica Cryostat (Leica Microsystems). Sections were dried, mounted, imaged, and analyzed as described above.
For mouse liver tissue section, liver tissues were fixed in 4% PFA at 4°C overnight and dehydrated in 10%, 20% and 30% sucrose for 1 hour, 3 hours, and overnight, respectively. The tissues were embedded in O.C.T compound, cryosectioned into 50 μm thickness, stained with anti-CD31 antibody (1:200), and imaged as described above.
Whole-mount imaging
For whole-mount organoid staining, organoids were released from Matrigel by twice washing in cold PBS with gently pipetting. After washing, organoids were fixed with 4% paraformaldehyde, permeabilized with 2% Triton X-100, and blocked with 3% BSA, 1% Triton X-100 at room temperature (1hour for each step), followed by staining with primary antibodies at 4°C overnight and secondary antibodies for 2 hours at room temperature in the dark. The organoids were suspended on the glass slide and mounted with DAPI as described above.
Small intestinal whole-mount was performed as previously described, with minor modifications98. Briefly, after perfusion with 4% PFA via cardiac puncture, small intestines were harvested and opened longitudinally to expose the lumen. Tissue pieces were pinned on silicon plates with villi side up and fixed in 4% PFA at 4 °C overnight. After 3 rounds of 5-min wash with ice-cold PBS, tissues were dehydrated in 10% sucrose and 20% sucrose plus 10% glycerol for 2 hours and overnight at 4 °C, respectively. After cutting into 1cm pieces, tissues were blocked in 5% donkey serum, 0.3% Triton X-100 for 2 hours and stained with anti-CD31 antibody (1:400), secondary antibody (1:400), and then PE anti Ki-67 (1:200) with DAPI (1:1000) overnight at 4 °C, with 5 rounds of 1-hour wash after each staining. Then, tissues were fixed again with 4% PFA for 2 hours at room temperature and dissected into one or two villi-wide strips with micro-scissors under stereoscopic field. Strips were laid down flat on slide glass, cleared with FocusClear (CelExplorer) for 30 min, mounted in Fluoromount-G and imaged on a Nikon T2i inverted microscope.
Intestinal pathology
Pathology was scored from 0 to 5 in a blinded fashion. A score of 0 indicated no changes observed. A score of 1 indicated minimal scattered mucosal inflammatory cell infiltrates, with or without minimal epithelial hyperplasia. A score of 2 indicated mild scattered to diffuse inflammatory cell infiltrates, sometimes extending into the submucosa and associated with erosions, with minimal to mild epithelial hyperplasia and minimal to mild mucin depletion from goblet cells. A score of 3 indicated mild to moderate inflammatory cell infiltrates that were sometimes transmural, often associated with ulceration, with moderate epithelial hyperplasia and mucin depletion. A score of 4 indicated marked inflammatory cell infiltrates that were often transmural and associated with ulceration, with marked epithelial hyperplasia and mucin depletion. A score of 5 indicated marked transmural inflammation with severe ulceration and loss of intestinal glands.
Primary hepatocyte culture
Primary mouse hepatocytes were isolated by using EDTA perfusion, Liberase digestion and density gradient centrifugation according to the protocol in the previous study99. Briefly, the inferior vena cava was cannulated, and livers were perfused with calcium-free Hanks’ Balanced Salt Solution (HBSS) containing 0.5mM EDTA, 25mM HEPES and digested with HBSS containing 25 μg/ml Liberase, 25 mM HEPES. Livers were gently minced on a Petri dish and passed through a 70-μm cell strainer followed by density gradient centrifugation with Percoll. Freshly isolated cells were seeded on a collagen-coated culture plate in Dulbecco’s minimum essential medium (DMEM) containing 5% FBS and 1% Penicillin-Streptomycin at 37°C, 5% CO2. After 3 hours of plating, the medium was changed with William E media containing 1% Glutamine and 1% Penicillin-Streptomycin for maintenance. Hepatocytes were treated with 1 μg/ml LPS, 30μM fenofibrate, or 300μM fenofibrate for 12 hours after 3 hours of plating.
Mouse PEDF measurement
The mouse blood samples were collected by cardiac puncture and the plasma was isolated in K3 EDTA tube. Mouse PEDF measurement was performed using Mouse PEDF ELISA Kit (MyBioSource) according to the manufacturers’ protocols.
Liver LPS quantification
The liver tissue was homogenized in PBS with 0.5% Triton X-100. The LPS level in the supernatant was detected using Pierce Chromogenic Endotoxin Quant Kit (Thermo #A39552) according to the manufacturer’s protocol. The LPS concentration was normalized to liver tissue weight.
Western blot
The tissues or cells were lysed in whole cell extract buffer (50 mM Tris-HCl, pH 7.5, 150 mM NaCl, 1% NP-40, 0.2 mM EDTA, 10 mM Na3VO4, 10% glycerol, protease inhibitors). Proteins were separated by gel electrophoresis using 4%–12% SDSPAGE Bis-Tris gels followed by transfer to nitrocellulose membrane. Membranes were incubated with 5% milk in TBST (0.5 M NaCl, Tris-HCl, pH 7.5, 0.1% (v/v) Tween-20) for 60 min. Proteins of interest were detected by incubating membranes at 4°C overnight in blocking buffer with the indicated primary antibody, washing with TBST three times for 10 min and incubating with horseradish peroxidase-conjugated anti-rabbit or anti-mouse antibody. Blotting signaling was detected with SuperSignal West Pico PLUS Chemiluminescent Substrate.
Immunoprecipitation
Cell lysates were incubated with 2μg anti-pSer overnight at 4°C and then added with Protein A/G Dynabeads (Invitrogen). Beads were washed extensively, and proteins were eluted with loading buffer. The presence of proteins in immunocomplexes was determined by immunoblot analysis.
Quantitative RT-PCR
Total RNA was isolated from the cells using the QIAGEN miniRNA extraction kit following the manufacturer’s instructions. RNA was quantified and complementary DNA was reverse transcribed using the iScript kit. The cDNA samples were used at 20ng/well in a 384 well plate and run triplicate. PCR reactions were set up using SYBR Green PCR Master Mix (Applied Biosystems) on an ABI Prism 7500 Sequence Detection System. Quantification of relative mRNA expression was normalized to the expression of β-Actin.
Chromatin immunoprecipitation (ChIP)
Experiments were performed using SimpleChIP® Enzymatic Chromatin IP Kit according to manufacturer’s instructions. 2μg anti-PPARα or anti-HNF4α antibody was used for precipitate DNA-protein complex in each ChIP assay. QPCR was performed to quantify the protein binding on Pedf promoter or Ppara promoter region.
Luciferase reporter assay
A fragment of the Pedf promoter (−2066 to +503bp) was amplified by PCR from genome DNA purified from splenocytes and inserted between KpnI and XhoI in pGL3-Basic (Promega). HEK293T cells were transfected with the indicated PPARα expressing plasmid or empty vector control along with the promoter firefly luciferase-reporter constructs and Renilla luciferase reporter vector (Promega) using Lipofectamine 3000 (Invitrogen). 36hr after transfection luciferase expression was determined by measuring luminescence with the Dual-Luciferase Reporter Assay System (Promega). The firefly luciferase activity was normalized to renilla luciferase activity. 30μM fenofibrate was added 6hr after transfection.
Microbiota sequence and data analysis
Fecal samples were collected from live mice, snap-frozen and stored at −80°C. DNA was extracted and amplified using barcoded V4 region primers targeting bacterial 16S rRNA gene and sequenced using a Mi-Seq Illumina sequencer by National Cancer Institute Genetics and Microbiome core. The microbial community analysis was performed by using QIIME2 software (Bolyen et al., 2019).
RNA sequencing
Total RNA was used for preparing RNA-seq libraries with the Illumina TruSeq RNA Sample Preparation Kit. Libraries were sequenced with single-end 75-bp reads on an Illumina NextSeq system. All analyses were performed in Partek Flow software version 5.0 (Partek Inc.). Fastq files were uploaded into Partek Flow software for processing, aligned using the STAR aligner, and quantified to the transcriptome (Partek E/M using mm39 Ensembl Transcripts release 109 as the reference index). The raw counts were further analyzed using the R package DESeq2. Adjusted P values <0.05 were deemed significant. GO functional enrichment was performed using the online tool ToppGene (https://toppgene.cchmc.org/).
Quantification and Statistical Analysis
The data represented was mean ± SEM. Statistical analyses were performed with Graphpad Prism 5.0 (Graph Pad software, La Jolla, CA, USA) using an unpaired two-tailed Student’s t-test for two groups. ANOVA was used for more than two groups followed by the Tukey post hoc test. Statistical significance was defined as P < 0.05.
Supplementary Material
Figure S1. Liver-derived PEDF restrains ISC proliferation, related to Figure 1.
(A-B) 3 days after splenectomy on WT mice, BrdU was injected into either sham or surgery mice 6 hours before tissue collection. (A) Representative images and (B) quantification of BrdU+ cells per crypt of SI and colons from sham and splenectomy mice. Scale bar, 50 μm. (n=5 per group, representative data of two experiments).
(C) Taxonomic classifications at the phylum level for 16S rDNA of indicated bacteria in fecal samples from sham and hepatectomy mice. (n=6 per group).
(D) mRNA levels of Lgr5 in isolated IECs and intestinal crypt cells from SI and colon tissue. (n=3 per group, representative data of three experiments).
(E) Principal coordinate analysis (PCoA) of proteome from plasma samples of sham and hepatectomy mice. (n=3 per group, representative data of two experiments).
(F) Heatmap of differentially expressed genes in proteomics analysis from plasma samples of sham and hepatectomy mice. Red arrow: Pedf.
NS, not significant, **p<0.01, ***p<0.001, (B, D, Unpaired Student’s t-test, error bars represent SEM).
Figure S2. PEDF regulates expansion of the intestinal stem cell niche, related to Figure 2.
(A) mRNA levels of Pedf in indicated tissues from WT mice. (n=4 per group, representative data of three experiments).
(B) Quantification of immunoblot of PEDF protein in indicated tissues from WT mice. (n=3 per group, representative data of three experiments).
(C) Representatives immunoblot of PEDF protein in liver tissues from WT and Pedf−/− mice. (n=3 per group, representative data of two experiments).
(D) PEDF levels from plasma of WT and Pedf−/− mice were assessed. (n=3 per group, representative data of three experiments).
(E) mRNA levels of Pedf in indicated tissues from WT and Pedf−/− mice. (n=3 per group, representative data of three experiments).
(F-G) 3 days after hepatectomy on (F) WT and (G) Pedf−/− mice, BrdU was injected to either sham or surgery mice 6 hours before tissue collection. Representative images of BrdU and PEDF of SI and colons from sham and hepatectomy mice. Scale bar, 50 μm. (n=3 per group, representative data of two experiments).
(H-I) (H) Representative images and (I) quantification of SI tissues stained for PEDF from WT and Pedf−/− mice. Bottom row is magnified from dot line square in upper row. Scale bar, 50 μm. (n=3 per group, representative data of two experiments).
(J) Quantification of indicated IEC subsets in intestinal tissues from WT and Pedf−/− mice. (n=5 per group, representative data of two experiments).
(K-L) BrdU was injected into WT and Pedf−/− cohoused mice 6 hours before tissue collection. (K) Representative images and (L) quantification of BrdU+ cells per crypt of SI and colons. Scale bar, 50 μm. (n=5 per group, representative data of two experiments).
(M) Taxonomic classifications at the phylum level for 16S rDNA of indicated bacteria in fecal samples from WT and Pedf−/− mice. (n=6 per group).
NS: not significant, **p<0.01, (D, I, L, Unpaired Student’s t-test, error bars represent SEM).
Figure S3. Generation of hepatic PEDF deficient mice, related to Figure 2.
(A) Schematic illustration of sgRNA and experiment design.
(B) mRNA levels of Pedf in indicated tissues from sgNTC and sgPedf mice. (n=3 per group, representative data of three experiments).
(C-D) (C) Immunoblot analysis and (D) quantification of PEDF protein in liver tissues from sgNTC and sgPedf mice. (n=3 per group, representative data of three experiments).
(E) PEDF level from plasma of sgNTC and sgPedf mice were assessed. (n=3 per group, representative data of three experiments).
(F) GO analysis of PEDF-derived signaling pathways in liver cells.
(G) Representative images of liver tissues stained for CD31 were taken from WT and Pedf−/− mice. Scale bar, 200 μm.
(H-I) (H) Representative images of liver tissues stained for Ki67 were taken from WT and Pedf−/− mice, and (I) quantification of Ki67+ cells in liver tissues. Scale bar, 200 μm.
(J) Representative immunofluorescence staining for CD31 with DAPI of intestinal tissues. Scale bar, 50 μm.
(K-L) (K) Representative immunofluorescence staining for CD31 with Ki67 in villus in small intestine and crypt in colon, and (L) quantification of Ki67+ cells in vessel area. Scale bar, 20 μm.
NS: not significant, **p<0.01, ***p<0.001, (B, D, E, I, L, Unpaired Student’s t-test, error bars represent SEM).
Figure S4. PEDF represses the Wnt/β-catenin signaling pathway on ISCs via LRP5/6, related to Figure 3.
(A) mRNA levels of indicated genes in intestinal crypt cells from WT and Pedf−/− mice. (n=3 per group, representative data of three experiments).
(B) Representative images of intestinal tissues stained for active β-catenin were taken from WT and Pedf−/− mice. Bottom row is magnified from dot line square in upper row. Red arrow, nuclear β-catenin. Scale bar, upper row, 40 μm; lower row, 20 μm. (n=3 per group, representative data of three experiments).
(C-D) (C) Representative immunoblot and (D) quantification of active β-catenin in intestinal tissues from WT and Pedf−/− mice. (n=3 per group, representative data of two experiments).
(E) Quantification of immunoblot of active β-catenin in intestinal tissues from sgNTC and sgPedf mice. (n=3 per group, representative data of two experiments).
(F) Representative images of intestinal tissues stained for PEDF from Pedf−/− mice with or without PEDF treatment. Scale bar, 50 μm. (n=3 per group, representative data of three experiments).
(G) mRNA levels of indicated genes in intestinal crypt cells from Pedf−/− mice with or without PEDF treatment. (n≥3 per group, representative data of three experiments).
(H-I) (H) Representative immunoblot and (I) quantification of active β-catenin in intestinal tissues from Pedf−/− mice with or without PEDF treatment. (n=3 per group, representative data of three experiments).
(J) Representative images of Pedf−/− intestinal organoids stained for Ki67 with or without PEDF treatment. Scale bar, 100 μm. (n=3 per group, representative data of three experiments).
(K) mRNA levels of indicated genes from intestinal organoids with or without PEDF treatment. (n=3 per group, representative data of three experiments).
(L-M) (L) Representative immunoblot and (M) quantification of Lrp5 and Lrp6 in intestinal crypt cells from Lrp5fl/flLrp6fl/fl and Lgr5creERLrp5fl/flLrp6fl/fl mice with tamoxifen pretreatment. (n=3 per group, representative data of three experiments).
(N-Q) (N, P) Experimental design and (O, Q) quantification of immunoblot analysis of active β-catenin in intestinal tissues with or without PEDF treatment. (n=3 per group, representative data of three experiments).
NS: not significant, *p<0.05, **p<0.01, ***p<0.001, (A, D, E, G, I, K, O, Q, Unpaired Student’s t-test, error bars represent SEM).
Figure S5. PEDF deficiency protects mice from intestinal inflammation, related to Figure 4.
(A) Body weight of WT and Pedf−/− mice during DSS-induced colitis was monitored. (n=5 per group, representative data of three experiments).
(B) Representative images of hematoxylin and eosin staining of colonic tissue were taken in WT and Pedf−/− mice at day 10 of DSS-induced colitis. Scale bar, 50 μm. (n=5 per group, representative data of three experiments).
(C) Colon lengths (left) and histological score (right) of WT and Pedf−/− mice, at day 10 of DSS-induced colitis, measured from the colorectal junction to the anal verge. (n=5 per group, representative data of three experiments).
(D) Colon lengths (left) and histological score (right) of sgNTC and sgPedf mice, at day 10 of DSS-induced colitis, measured from the colorectal junction to the anal verge. (n=5 per group, representative data of three experiments).
(E) Body weight of sgNTC and sgPedf mice during TNBS-induced colitis was monitored. (n=5 per group, representative data of three experiments).
(F) Representative images of hematoxylin and eosin staining of colonic tissue were taken from indicated mice at day 3 of TNBS-induced colitis. Scale bar, 50 μm. (n=5 per group, representative data of three experiments).
(G) Colon lengths (left) and histological score (right) of indicated mice at day 3 of TNBS-induced colitis, measured from the colocecal junction to the anal verge. (n=5 per group, representative data of three experiments).
(H-K) Colon lengths (left) and histological score (right) of (H) WT mice with or without PEDF protein treatment, (I) WT mice with or without 44mer peptide treatment, (J) WT mice with or without 34mer peptide treatment, (K) WT mice with or without α-PEDF antibody treatment at day 10 of DSS-induced colitis, measured from the colorectal junction to the anal verge. (n=5 per group, representative data of three experiments).
NS: not significant, *p<0.05, **p<0.01, ***p<0.001, (A, E, Two-way ANOVA with Tukey’s multiple comparison test; C, D, G-K, Unpaired Student’s t-test, error bars represent SEM).
Figure S6. The gut-liver axis calibrates PEDF production for ISC homeostasis, related to Figure 5.
(A) mRNA of Pedf was assessed from hepatocytes of WT mice collected at indicated time point of DSS-induced colitis. (n=4 per group, representative data of three experiments).
(B-C) (B) Representative immunoblot and (C) quantification of PEDF in liver tissues from WT mice at indicated time point of DSS-induced colitis. (n=3 per group, representative data of two experiments).
(D) Representative images of intestinal tissues stained for PEDF from WT mice at indicated time point of DSS-induced colitis. Scale bar, 50 μm. (n=3 per group, representative data of three experiments).
(E) Colon lengths (left) and histological score (right) of Myd88fl/fl and AlbcreMyd88fl/fl mice at day 10 of DSS-induced colitis, measured from the colocecal junction to the anal verge. (n=5 per group, representative data of two experiments).
(F) mRNA of Pedf was assessed from liver tissues of Myd88fl/fl and AlbcreMyd88fl/fl mice collected at indicated time point of DSS-induced colitis. (n=3 per group, representative data of three experiments).
(G-H) (G) Representative immunoblot and (H) quantification of PEDF in liver tissues from Myd88fl/fl and AlbcreMyd88fl/fl mice at indicated time point of DSS-induced colitis. (n=3 per group, representative data of two experiments).
(I) LPS level was assessed in WT mice liver tissue collected at day 0 and day 10 of DSS-induced colitis. (n=5 per group, representative data of two experiments).
(J) mRNA level of Pedf was assessed from murine primary hepatocytes stimulated with LPS for 12 hours. (n=6 per group, representative data of two experiments).
(K) Body weight of Tlr4fl/fl and AlbcreTlr4fl/fl mice during DSS-induced colitis. (n=5 per group, representative data of three experiments).
(L) Representative images of hematoxylin and eosin staining of colonic tissue in Tlr4fl/fl and AlbcreTlr4fl/fl mice at day 10 of DSS-induced colitis. Scale bar, 50 μm. (n=3 per group, representative data of three experiments).
(M) Colon lengths (left) and histological score (right) of Tlr4fl/fl and AlbcreTlr4fl/fl mice at day 10 of DSS-induced colitis, measured from the colorectal junction to the anal verge. (n=5 per group, representative data of three experiments).
(N) mRNA of Pedf was assessed from hepatocytes of Tlr4fl/fl and AlbcreTlr4fl/fl mice collected at indicated time point of DSS-induced colitis. (n=3 per group, representative data of three experiments).
(O-P) (O) Representative immunoblot and (P) quantification of PEDF in liver tissues from Tlr4fl/fl and AlbcreTlr4fl/fl mice at indicated time point of DSS-induced colitis. (n=3 per group, representative data of two experiments).
(Q) Mice were treated with a-PEDF antibody on the same day as DSS for 6 days. Colon lengths (left) and histological score (right) of Tlr4fl/fl and AlbcreTlr4fl/fl mice at day 10 of DSS-induced colitis, measured from the colorectal junction to the anal verge. (n=5 per group, representative data of two experiments).
NS: not significant, *p<0.05, **p<0.01, (A, Q, One-way ANOVA with Tukey’s multiple comparison test; F, H, K, N, P, Two-way ANOVA with Tukey’s multiple comparison test; E, I, J, M, Unpaired Student’s t-test; error bars represent SEM).
Figure S7. Microbial LPS regulates PEDF production via liver-derived PPARα, related to Figure 6.
(A-B) (A) Representative immunoblot and (B) quantification of PEDF and PPARa from mouse liver tissues collected at day 0 and day 10 of DSS-induced colitis. (n=3 per group, representative data of three experiments).
(C-D) (C) Representative immunoblot and (D) quantification of PPARα in liver tissues from Myd88fl/fl and AlbcreMyd88fl/fl mice at indicated time point of DSS-induced colitis. (n=3 per group, representative data of two experiments).
(E) Quantification of immunoblot of PPARα in liver tissues from Tlr4fl/fl and AlbcreTlr4fl/fl mice at indicated time point of DSS-induced colitis. (n=3 per group, representative data of two experiments).
(F) mRNA level of Ppara was assessed from murine primary hepatocytes stimulated with LPS for 12 hours. (n=4 per group, representative data of three experiments).
(G) Quantification of immunoblot of HNF4 and p-ERK in Fig. 6C. (n=3 per group, representative data of three experiments).
(H) Colon lengths (left) and histological score (right) of Pparafl/fl and AlbcrePparafl/fl mice. (n=5 per group, representative data of two experiments).
(I) mRNA of Pedf was assessed from liver tissues of Pparafl/fl and AlbcrePparafl/fl mice collected at indicated time point of DSS-induced colitis. (n=3 per group, representative data of three experiments).
(J-K) (J) Representative immunoblot and (K) quantification of PEDF in liver tissues from Pparafl/fl and AlbcrePparafl/fl mice at indicated time point of DSS-induced colitis. (n=3 per group, representative data of three experiments).
*p<0.05, **p<0.01, (D, E, I, K, Two-way ANOVA with Tukey’s multiple comparison test; F, Unpaired Student’s t-test; error bars represent SEM).
Figure S8. FB enhances susceptibility of intestinal inflammation via PEDF, related to Figure 7.
(A-C) Mice were treated with FB one time on day 4 of DSS. (A) Body weight of WT mice during DSS-induced colitis was monitored. † Mice dead. (B) Representative images of hematoxylin and eosin staining of colonic tissue were taken in WT mice at day 10 of DSS-induced colitis. Scale bar, 50 μm. (C) Colon lengths (left) and histological score (right) of WT mice at day 10 of DSS-induced colitis, measured from the colorectal junction to the anal verge. (n=5 per group, representative data of two experiments).
(D) mRNA of Pedf was assessed from in vitro hepatocytes of WT mice with indicated stimulations. (n=5 per group, representative data of two experiments).
(E) Mice were treated with FB one time at day 4 of DSS. Colon lengths (left) and histological score (right) of WT and Pedf−/− mice at day 10 of DSS-induced colitis, measured from the colocecal junction to the anal verge. (n=5 per group, representative data of two experiments).
(F) mRNA of Pedf was assessed in hepatocytes from Pparafl/fl and AlbcrePparafl/fl mice with in vitro stimulation of FB. (n≥4 per group, representative data of three experiments).
(G) mRNA of Pedf was assessed from liver tissues of Pparafl/fl and AlbcrePparafl/fl mice treated with FB for 8 hours. (n≥4 per group, representative data of three experiments).
(H) Mice were treated with FB one time at day 4 of DSS. Colon lengths (left) and histological score (right) of Pparafl/fl and AlbcrePparafl/fl mice at day 10 of DSS-induced colitis, measured from the colorectal junction to the anal verge. (n=5 per group, representative data of two experiments).
(I) Mice were treated with FB one time at day 4 of DSS, with or without α-PEDF antibody treatment on day 0 of DSS for total of 6 days. Colon lengths (left) and histological score (right) of WT mice at day 10 of DSS-induced colitis, measured from the colorectal junction to the anal verge. (n=5 per group, representative data of two experiments).
(J) Quantification of immunoblot of PEDF protein in indicated human tissues. (n=2 per group, representative data of two experiments).
(K) Representative images of human intestinal tissues stained for PEDF. Scale bar, 20 μm. (n=3 per group, representative data of two experiments).
NS: not significant, *p<0.05, **p<0.01, (D-I, One-way ANOVA with Tukey’s multiple comparison test; A, Two-way ANOVA with Tukey’s multiple comparison test; C, Unpaired Student’s t-test; error bars represent SEM).
KEY RESOURCES TABLE.
| REAGENT or RESOURCE | SOURCE | IDENTIFIER |
|---|---|---|
| Antibodies | ||
| Rabbit polyclonal anti-human/mouse PEDF for WB | Abcam | Cat# ab227295; RRID: AB_2941947 |
| Rabbit polyclonal anti-human/mouse PEDF for IHC | Abcam | Cat# ab180711; RRID: AB_2827998 |
| Goat polyclonal anti-human/mouse PEDF for in vivo neutralization | R&D systems | Cat# AF1177; RRID: AB_2187173 |
| Normal goat IgG | R&D systems | Cat# AB-108-C |
| Mouse monoclonal anti-BrdU | Sigma | Cat# MAB4072; RRID: AB_95024 |
| Rabbit monoclonal anti-human/mouse non-phospho β-catenin for IHC | Cell Signaling Technology | Cat# 19807; RRID: AB_2650576 |
| Rabbit monoclonal anti-human/mouse non-phospho β-catenin for WB | Cell Signaling Technology | Cat# 8814; RRID: AB_11127203 |
| Rabbit monoclonal anti-human/mouse β-catenin | Cell Signaling Technology | Cat# 8480; RRID: AB_11127855 |
| Mouse monoclonal anti-human/mouse PPARα | Thermo Fisher Scientific | Cat# MA1-822; RRID: AB_2165745 |
| Rabbit monoclonal anti-Anti-HNF-4alpha | Sigma | Cat# ZRB1457; RRID: AB_3073545 |
| Rabbit monoclonal anti-human/mouse LRP5 | Cell Signaling Technology | Cat# 5731; RRID: AB_10705602 |
| Rabbit monoclonal anti-human/mouse LRP6 | Cell Signaling Technology | Cat# 3395; RRID: AB_1950408 |
| Rabbit monoclonal anti-Phospho-p44/42 MAPK (Erk1/2) (Thr202/Tyr204) | Cell Signaling Technology | Cat# 4370; RRID: AB_2315112 |
| Rabbit monoclonal anti-p44/42 MAPK (Erk1/2) | Cell Signaling Technology | Cat# 4695; RRID: AB_390779 |
| Mouse monoclonal anti-Phosphoserine | Biolegend | Cat# 944101; RRID: AB_2890869 |
| Rabbit polyclonal anti-human/mouse lysozyme | Proteintech | Cat# 15013-1-AP; RRID: AB_10639507 |
| Rabbit polyclonal anti-human/mouse MUC2 | GeneTex | Cat# GTX100664; RRID: AB_1950958 |
| Rabbit polyclonal anti-human POU2F3 | Sigma | Cat# HPA019652; RRID: AB_1855585 |
| Rabbit polyclonal anti-mouse ChgA | Abcam | Cat# ab15160, RRID: AB_301704 |
| Rat monoclonal anti-mouse CD31 (Pecam-1) | BD Bioscience | Cat# 557355, RRID: AB_396660 |
| Rat monoclonal PE anti-mouse/rat Ki-67 | Invitrogen | Cat# 12-5698-82; RRID: AB_11150954 |
| Donkey polyclonal anti-rat (H+L) highly cross-adsorbed Alexa Fluor™ 488 | Thermo Fisher Scientific | Cat# A-21208; RRID: AB_2535794 |
| Donkey polyclonal anti-mouse (H+L) highly cross-adsorbed Alexa Fluor™ 488 | Thermo Fisher Scientific | Cat# A-21202; RRID: AB_141607 |
| Donkey polyclonal anti-rabbit (H+L) highly cross-adsorbed Alexa Fluor™ 488 | Thermo Fisher Scientific | Cat# A-21206; RRID: AB_2535792 |
| Donkey polyclonal anti-rabbit (H+L) highly cross-adsorbed Alexa Fluor™ 555 | Thermo Fisher Scientific | Cat# A-31572; RRID: AB_162543 |
| Donkey polyclonal anti-rabbit (H+L) highly cross-adsorbed Alexa Fluor™ 647 | Thermo Fisher Scientific | Cat# A-31573; RRID: AB_2536183 |
| Peroxidase AffiniPure donkey anti-mouse IgG (H+L) | Jackson ImmunoResearch | Cat# 715-035-150; RRID: AB_2340770 |
| Peroxidase AffiniPure donkey anti-Rabbit IgG (H+L) | Jackson ImmunoResearch | Cat# 715-035-152; RRID: AB_10015282 |
| Biological samples | ||
| Human Small Intestine Total Protein | Zyagen | Cat# HT-306 |
| Human Spleen Total Protein | Zyagen | Cat# HT-701 |
| Human Liver Total Protein | Zyagen | Cat# HT-314 |
| Human Lung Total Protein | Zyagen | Cat# HT-601 |
| Human Colon Total Protein | Zyagen | Cat# HT-311 |
| Huma Kidney Total Protein | Zyagen | Cat# HT-901 |
| Human Stomach Total Protein | Zyagen | Cat# HT-302 |
| Human Adipose Tissue Total Protein | Zyagen | Cat# HT-103 |
| Human Colon Paraffin Sections | Zyagen | Cat# HP-311 |
| Chemicals, peptides, and recombinant proteins | ||
| Dextran Sulfate Sodium Salt (DSS) | MP Biomedicals | Cat# 160110 |
| 2,4,6-Trinitrobenzenesulfonic acid solution (TNBS) | Sigma | Cat# P2297 |
| Recombinant mouse PEDF | R&D systems | Cat# 8295-SF-025 |
| Recombinant human PEDF | PeproTech | Cat# 130-13 |
| Tamoxifen (TAM) | Sigma | Cat# T5648 |
| Lipopolysaccharide (LPS) | Sigma | Cat# L2630 |
| Fenofibrate | Sigma | Cat# F6020 |
| 5-Bromo-2’-deoxyuridine (BrdU) | Sigma | Cat# B5002 |
| Dithiothreitol (DTT) | Roche | Cat# 10708984001 |
| Recombinant Human Noggin Protein, CF | R&D Systems | Cat# 6057-NG/CF |
| Epidermal Growth Factor (EGF) | Sigma | Cat# E4127 |
| Intesticult™ Organoid Growth Medium (Mouse) | Stemcell Technologies | Cat# 06005 |
| STEMdiff™ Intestinal Organoid Growth Medium | Stemcell Technologies | Cat# 05145 |
| Essential 8™ Medium | Thermo Fisher Scientific | Cat# A1517001 |
| Corning™ Matrigel™ Gfr Membrane Matrix | Corning | Cat# 356231 |
| Fluoromount-G™, With DAPI | Thermo Fisher Scientific | Cat# 00-4959-52 |
| Collagenase D | Roche | Cat# 11088882001 |
| Liberase TM | Roche | Cat# 05401119001 |
| William’s E Medium, no phenol red | Gibco | Cat# A12176-01 |
| Normal Donkey Serum | Jackson ImmunoResearch | Cat# 017-000-121 |
| Bovine Serum Albumin (BSA) | GE Healthcare | Cat# SH30574.03 |
| EDTA, 0.5M | Thermo Fisher Scientific | Cat# AM9261 |
| Percoll | GE Healthcare | Cat# 17-0891-09 |
| DMEM Medium | Gibco | Cat# 11965-092 |
| DMEM/F-12 Medium | Gibco | Cat# 11320-033 |
| Penicillin-streptomycin | Gibco | Cat# 15140 |
| L-Glutamine | Gibco | Cat# 25030 |
| Collagen | Chrono-log corp. | Cat# 385 |
| 1M HEPES | Gibco | Cat# 15630-080 |
| Triton X-100 | Sigma | Cat# X100 |
| 16% Paraformaldehyde solution | Electron Microscopy Sciences | Cat# 15710 |
| 10% Formalin solution | Sigma | Cat# HT501128 |
| Tissue Plus O.C.T compound | Fisher HealthCare | Cat#4585 |
| Triethylammonium bicarbonate | Sigma | Cat# T7408 |
| FocusClear™ | CelExplorer | Cat# FC-101 |
| S-methyl methanethiosulfonate | Sigma | Cat# 49983 |
| Pierce™ Trypsin Protease, MS Grade | Thermo Fisher | Cat# 90057 |
| Trifluoroacetic acid-d | Thermo Fisher Scientific | Cat# 325330100 |
| Acetonitrile | Sigma | Cat# 271004 |
| Acetone | Sigma | Cat# 270725 |
| Glycerol | Sigma | Cat# G5516 |
| Sucrose | Sigma | Cat# S9378 |
| SYLGARD™ 184 Silicone elastomer kit | Dow Chemical Company | Cat# 4019862 |
| Ketamine hydrochloride | Covertrus | NDC# 11695-0703-1 |
| Xylazine | Dechra | FDA NADA# 047-956 |
| Acepromazine maleate | ijCovertus | NDC# 11695-0095-5 |
| Bupivacaine hydrochloride | FRESENIUS KABI | NDC# 63323-467-01 |
| Buprenorphine ER-LAB | ZooPharm | Lot# BERLAB0.5-231703 |
| VICRYL 3–0 | ETHICON | Cat# J393 |
| PERMA-HAND™ Silk 4–0 | ETHICON | Cat# 743 |
| U0126 | Cell signaling | 9903S |
| iScript RT Supermix | Bio-Rad | Cat# 1708841 |
| SYBR Green PCR Master Mix | Thermo Fisher Scientific | Cat# 4309155 |
| SuperSignal West Pico PLUS Chemiluminescent Substrate | Thermo Fisher Scientific | Cat# 34580 |
| Halt™ Protease Inhibitor Cocktail, EDTA-Free | Thermo Fisher Scientific | Cat# 78439 |
| SurePAGE™ 4–12% Bis-Tris Protein Gels | GenScript | Cat# M00654 |
| 34mer PEDF peptide NH2-VLLSPLSVATALSALSLGAEQRTESIIHRALYYDLIS SPDIHGT - COOH | Synpeptide Co. | N/A |
| 44mer PEDF peptide NH2-DPFFKVPVNKLAAAV SNF GYDLYRVRS SMSPTTN-COOH | Synpeptide Co. | N/A |
| Critical commercial assays | ||
| TopTip C-18 | Glygen | Cat# TT2C18 |
| ToxinSensor™ Chromogenic LAL Endotoxin Assay Kit | GenScript | Cat# L00350 |
| Mouse PEDF ELISA kit | MyBioSource | Cat# MBS265201 |
| Human PEDF ELISA kit | CLOUD-CLONE | Cat# SEB972Hu |
| Lipopolysaccharide (LPS) ELISA kit | CLOUD-CLONE | Cat# SEB526Ge |
| TMT10plex Isobaric Label Reagent Set | Thermo Fisher Scientific | Cat# 90110 |
| STEMdiff™ Intestinal Organoid Kit | Stemcell Technologies | Cat# 05140 |
| RNeasy Plus Mini Kit | QIAGEN | Cat# 74136 |
| SimpleChIP® Enzymatic Chromatin IP Kit (Magnetic Beads) | Cell Signaling Technology | Cat# 9003S |
| Dual-Glo Luciferase Assay System | Promega | E2920 |
| Deposited data | ||
| Plasma proteomic data | This paper | MSV000091409 |
| RNA-seq data | This paper | GEO: GSE228829 |
| Experimental models: Cell lines | ||
| HEK293T | ATCC | Cat# CRL-3216 |
| Experimental models: Organisms/strains j | ||
| Mouse: Pedf−/− | Dr. Susan E. Crawford81 | N/A |
| Mouse: Lgr5creER-eGFP | The Jackson Laboratory | Cat# 008875 |
| Mouse: R26RtdTomato | The Jackson Laboratory | Cat# 007909 |
| Mouse: Albcre | The Jackson Laboratory | Cat# 003574 |
| Mouse: Rosa26LSL-Cas9 | The Jackson Laboratory | Cat# 026175 |
| Mouse: Myd88flox/flox | The Jackson Laboratory | Cat# 008888 |
| Mouse: Tlr4fox/fox | The Jackson Laboratory | Cat# 024872 |
| Mouse: Pparaflox/flox | Dr. Frank J. Gonzalez93 | N/A |
| Mouse: Lrp5flox/flox Lrp6flox/flox | Dr. Bart O. Williams94 | N/A |
| Oligonucleotides | ||
| Axin2 forward 5’ TGACTCTCCTTCCAGATCCCA | IDT | N/A |
| Axin2 reverse 5’ TGCCCACACTAGGCTGACA | IDT | N/A |
| Ephb2 forward 5’ GCGGCTACGACGAGAACAT | IDT | N/A |
| Ephb2 reverse 5’ GGCTAAGTCAAAATCAGCCTCA | IDT | N/A |
| Ascl2 forward 5’ AAGCACACCTTGACTGGTACG | IDT | N/A |
| Ascl2 reverse 5’ AAGTGGACGTTTGCACCTTCA | IDT | N/A |
| Cd44 forward 5’ TCGATTTGAATGTAACCTGCCG | IDT | N/A |
| Cd44 reverse 5’ CAGTCCGGGAGATACTGTAGC | IDT | N/A |
| Lgr5 forward 5’ CCTACTCGAAGACTTACCCAGT | IDT | N/A |
| Lgr5 reverse 5’ GCATTGGGGTGAATGATAGCA | IDT | N/A |
| Pedf forward 5’ TTCAAGGGGCAGTGGGTAAC | IDT | N/A |
| Pedf reverse 5’ TACTTCCTGTCAAGGGCAGC | IDT | N/A |
| Pparα forward 5’ACAAGGCCTCAGGGTACCA | IDT | N/A |
| Pparα reverse 5’ GCCGAAAGAAGCCCTTACAG | IDT | N/A |
| Actb forward 5’GGCTGTATTCCCCTCCATCG | IDT | N/A |
| Actb reverse 5’CCAGTTGGTAACAATGCCATGT | IDT | N/A |
| Pedf promoter forward 5 ’ GACAGGTCAATGTGCACGAAC | IDT | N/A |
| Pedf promoter reverse 5’ CTGAAAGCCTCCACACGGAA | IDT | N/A |
| Ppara promoter forward 5’ GTGGGCCACTT AT ACCCCAG | IDT | N/A |
| Ppara promoter reverse 5 ’ GTCCCCTCGTTGGCACATTA | IDT | N/A |
| Pedf promoter -2066 forward 5’ GGTACCCCTGCACAGGTTTTATGGAAAG | IDT | N/A |
| Pedf promoter +503 reverse 5’ CTCGAGCTTCAGGAAGAGCCCAGCCTATG | IDT | N/A |
| sgNTC 5’ ATGACACTTACGGTACTCGT | IDT | N/A |
| sgRNAl 5’ GCAGCAGCTGTCTCCAACTT | IDT | N/A |
| sgRNA2 5’ GT ACAGATCGT AGCCGAAGT | IDT | N/A |
| sgRNA3 5’ CTGGTGCTACTCCTCTGGAC | IDT | N/A |
| Recombinant DNA | ||
| pGL3 Basic | Promega | Cat# E1751 |
| pRL Renilla | Promega | Cat# E2231 |
| px459 | Addgene | Cat# 62988 |
| pAAV-sgNTC | This paper | N/A |
| pAAV-sgPedf | This paper | N/A |
| pSG5 PPAR alpha | Addgene | Cat# 22751 |
| pcDNA3.1 | This paper | N/A |
| Software and Algorithms | ||
| GraphPad Prism | Graphpad | https://www.graphpad.com |
| Fiji | ImageJ | https://imagej.net/Welcome |
| NIS-elements | Nikon | https://www.microscope.healthcare.nikon.com/products/software/nis-elements |
| BZ-X Analyzer software | Keyence | https://www.keyence.com/landing/microscope/lp_fluorescencejsp |
| QIIME2 | Qiime2 | version 2019.10 |
| Partek Flow | Partek | https://www.partek.com/partek-flow/ |
Highlight.
Liver-derived PEDF restrains ISC proliferation;
The gut-liver axis calibrates PEDF production for ISC homeostasis;
Microbial LPS regulates PEDF production via liver-derived PPARa;
Fenofibrate enhances susceptibility of intestinal inflammation via PEDF.
Acknowledgements
We thank Dr. Bart O. Williams (Van Andel Research Institute) for the Lrp5fl/flLrp6fl/fl mice; Dr. Frank J. Gonzalez (National Cancer Institute) for the Pparαflox mice. We thank Joelle Mornini, NIH Library, for manuscript editing assistance. We thank Drs. Jagan Muppidi, Ryan Young (National Cancer Institute) and Enfu Hui (University of California San Diego) for critical review of the manuscript. This work was supported by the Intramural Research Program (ZIA BC012034 to C.W., ZIA DE000751 to Y.W.).
Footnotes
Declaration of Interests
The authors declare no competing interests.
Publisher's Disclaimer: This is a PDF file of an unedited manuscript that has been accepted for publication. As a service to our customers we are providing this early version of the manuscript. The manuscript will undergo copyediting, typesetting, and review of the resulting proof before it is published in its final form. Please note that during the production process errors may be discovered which could affect the content, and all legal disclaimers that apply to the journal pertain.
Reference:
- 1.Hofmann AF, and Hagey LR (2014). Key discoveries in bile acid chemistry and biology and their clinical applications: history of the last eight decades. J Lipid Res 55, 1553–1595. 10.1194/jlr.R049437. [DOI] [PMC free article] [PubMed] [Google Scholar]
- 2.Arab JP, Karpen SJ, Dawson PA, Arrese M, and Trauner M (2017). Bile acids and nonalcoholic fatty liver disease: Molecular insights and therapeutic perspectives. Hepatology 65, 350–362. 10.1002/hep.28709. [DOI] [PMC free article] [PubMed] [Google Scholar]
- 3.Yu LX, and Schwabe RF (2017). The gut microbiome and liver cancer: mechanisms and clinical translation. Nat Rev Gastroenterol Hepatol 14, 527–539. 10.1038/nrgastro.2017.72. [DOI] [PMC free article] [PubMed] [Google Scholar]
- 4.Tripathi A, Debelius J, Brenner DA, Karin M, Loomba R, Schnabl B, and Knight R (2018). The gut-liver axis and the intersection with the microbiome. Nat Rev Gastroenterol Hepatol 15, 397–411. 10.1038/s41575-018-0011-z. [DOI] [PMC free article] [PubMed] [Google Scholar]
- 5.Albillos A, de Gottardi A, and Rescigno M (2020). The gut-liver axis in liver disease: Pathophysiological basis for therapy. J Hepatol 72, 558–577. 10.1016/j.jhep.2019.10.003. [DOI] [PubMed] [Google Scholar]
- 6.Zou ZY, Shen B, and Fan JG (2019). Systematic Review With Meta-analysis: Epidemiology of Nonalcoholic Fatty Liver Disease in Patients With Inflammatory Bowel Disease. Inflamm Bowel Dis 25, 1764–1772. 10.1093/ibd/izz043. [DOI] [PubMed] [Google Scholar]
- 7.Boonstra K, van Erpecum KJ, van Nieuwkerk KMJ, Drenth JPH, Poen AC, Witteman BJM, Tuynman HARE, Beuers U, and Ponsioen CY (2012). Primary sclerosing cholangitis is associated with a distinct phenotype of inflammatory bowel disease. Inflammatory Bowel Diseases 18, 2270–2276. 10.1002/ibd.22938. [DOI] [PubMed] [Google Scholar]
- 8.Zheng HH, and Jiang XL (2016). Increased risk of colorectal neoplasia in patients with primary sclerosing cholangitis and inflammatory bowel disease: a meta-analysis of 16 observational studies. Eur J Gastroenterol Hepatol 28, 383–390. 10.1097/MEG.0000000000000576. [DOI] [PubMed] [Google Scholar]
- 9.de Vries AB, Janse M, Blokzijl H, and Weersma RK (2015). Distinctive inflammatory bowel disease phenotype in primary sclerosing cholangitis. World J Gastroenterol 21, 1956–1971. 10.3748/wjg.v21.i6.1956. [DOI] [PMC free article] [PubMed] [Google Scholar]
- 10.Boonstra K, Beuers U, and Ponsioen CY (2012). Epidemiology of primary sclerosing cholangitis and primary biliary cirrhosis: a systematic review. J Hepatol 56, 1181–1188. 10.1016/j.jhep.2011.10.025. [DOI] [PubMed] [Google Scholar]
- 11.Gabele E, Dostert K, Hofmann C, Wiest R, Scholmerich J, Hellerbrand C, and Obermeier F (2011). DSS induced colitis increases portal LPS levels and enhances hepatic inflammation and fibrogenesis in experimental NASH. J Hepatol 55, 1391–1399. 10.1016/j.jhep.2011.02.035. [DOI] [PubMed] [Google Scholar]
- 12.Bouma G, and Strober W (2003). The immunological and genetic basis of inflammatory bowel disease. Nat Rev Immunol 3, 521–533. 10.1038/nri1132. [DOI] [PubMed] [Google Scholar]
- 13.Dapito DH, Mencin A, Gwak GY, Pradere JP, Jang MK, Mederacke I, Caviglia JM, Khiabanian H, Adeyemi A, Bataller R, et al. (2012). Promotion of hepatocellular carcinoma by the intestinal microbiota and TLR4. Cancer Cell 21, 504–516. 10.1016/j.ccr.2012.02.007. [DOI] [PMC free article] [PubMed] [Google Scholar]
- 14.Fu T, Coulter S, Yoshihara E, Oh TG, Fang S, Cayabyab F, Zhu Q, Zhang T, Leblanc M, Liu S, et al. (2019). FXR Regulates Intestinal Cancer Stem Cell Proliferation. Cell 176, 1098–1112 e1018. 10.1016/j.cell.2019.01.036. [DOI] [PMC free article] [PubMed] [Google Scholar]
- 15.Degirolamo C, Modica S, Palasciano G, and Moschetta A (2011). Bile acids and colon cancer: Solving the puzzle with nuclear receptors. Trends Mol Med 17, 564–572. 10.1016/j.molmed.2011.05.010. [DOI] [PubMed] [Google Scholar]
- 16.Maran RR, Thomas A, Roth M, Sheng Z, Esterly N, Pinson D, Gao X, Zhang Y, Ganapathy V, Gonzalez FJ, and Guo GL (2009). Farnesoid X receptor deficiency in mice leads to increased intestinal epithelial cell proliferation and tumor development. J Pharmacol Exp Ther 328, 469–477. 10.1124/jpet.108.145409. [DOI] [PMC free article] [PubMed] [Google Scholar]
- 17.Jia W, Xie G, and Jia W (2018). Bile acid-microbiota crosstalk in gastrointestinal inflammation and carcinogenesis. Nat Rev Gastroenterol Hepatol 15, 111–128. 10.1038/nrgastro.2017.119. [DOI] [PMC free article] [PubMed] [Google Scholar]
- 18.Barker N, van Es JH, Kuipers J, Kujala P, van den Born M, Cozijnsen M, Haegebarth A, Korving J, Begthel H, Peters PJ, and Clevers H (2007). Identification of stem cells in small intestine and colon by marker gene Lgr5. Nature 449, 1003–1007. 10.1038/nature06196. [DOI] [PubMed] [Google Scholar]
- 19.van der Flier LG, and Clevers H (2009). Stem cells, self-renewal, and differentiation in the intestinal epithelium. Annu Rev Physiol 71, 241–260. 10.1146/annurev.physiol.010908.163145. [DOI] [PubMed] [Google Scholar]
- 20.Santos AJM, Lo YH, Mah AT, and Kuo CJ (2018). The Intestinal Stem Cell Niche: Homeostasis and Adaptations. Trends Cell Biol 28, 1062–1078. 10.1016/j.tcb.2018.08.001. [DOI] [PMC free article] [PubMed] [Google Scholar]
- 21.Biteau B, and Jasper H (2011). EGF signaling regulates the proliferation of intestinal stem cells in Drosophila. Development 138, 1045–1055. 10.1242/dev.056671. [DOI] [PMC free article] [PubMed] [Google Scholar]
- 22.He XC, Zhang J, Tong WG, Tawfik O, Ross J, Scoville DH, Tian Q, Zeng X, He X, Wiedemann LM, Mishina Y, and Li L (2004). BMP signaling inhibits intestinal stem cell self-renewal through suppression of Wnt-beta-catenin signaling. Nat Genet 36, 1117–1121. 10.1038/ng1430. [DOI] [PubMed] [Google Scholar]
- 23.Clevers H, and Nusse R (2012). Wnt/beta-catenin signaling and disease. Cell 149, 1192–1205. 10.1016/j.cell.2012.05.012. [DOI] [PubMed] [Google Scholar]
- 24.Fevr T, Robine S, Louvard D, and Huelsken J (2007). Wnt/beta-Catenin is essential for intestinal Homeostasis and maintenance of intestinal stem cells. Mol Cell Biol 27, 7551–7559. 10.1128/Mcb.01034-07. [DOI] [PMC free article] [PubMed] [Google Scholar]
- 25.Bourhis E, Tam C, Franke Y, Bazan JF, Ernst J, Hwang J, Costa M, Cochran AG, and Hannoush RN (2010). Reconstitution of a frizzled8.Wnt3a.LRP6 signaling complex reveals multiple Wnt and Dkk1 binding sites on LRP6. The Journal of biological chemistry 285, 9172–9179. 10.1074/jbc.M109.092130. [DOI] [PMC free article] [PubMed] [Google Scholar]
- 26.Vermeulen L, and Snippert HJ (2014). Stem cell dynamics in homeostasis and cancer of the intestine. Nat Rev Cancer 14, 468–480. 10.1038/nrc3744. [DOI] [PubMed] [Google Scholar]
- 27.Sancho E, Batlle E, and Clevers H (2004). Signaling pathways in intestinal development and cancer. Annu Rev Cell Dev Biol 20, 695–723. 10.1146/annurev.cellbio.20.010403.092805. [DOI] [PubMed] [Google Scholar]
- 28.Jordan S, Tung N, Casanova-Acebes M, Chang C, Cantoni C, Zhang D, Wirtz TH, Naik S, Rose SA, Brocker CN, et al. (2019). Dietary Intake Regulates the Circulating Inflammatory Monocyte Pool. Cell 178, 1102–1114 e1117. 10.1016/j.cell.2019.07.050. [DOI] [PMC free article] [PubMed] [Google Scholar]
- 29.Priest C, and Tontonoz P (2019). Inter-organ cross-talk in metabolic syndrome. Nat Metab 1, 1177–1188. 10.1038/s42255-019-0145-5. [DOI] [PubMed] [Google Scholar]
- 30.Meex RCR, and Watt MJ (2017). Hepatokines: linking nonalcoholic fatty liver disease and insulin resistance. Nat Rev Endocrinol 13, 509–520. 10.1038/nrendo.2017.56. [DOI] [PubMed] [Google Scholar]
- 31.Jensen-Cody SO, and Potthoff MJ (2021). Hepatokines and metabolism: Deciphering communication from the liver. Mol Metab 44, 101138. 10.1016/j.molmet.2020.101138. [DOI] [PMC free article] [PubMed] [Google Scholar]
- 32.Uhlen M, Fagerberg L, Hallstrom BM, Lindskog C, Oksvold P, Mardinoglu A, Sivertsson A, Kampf C, Sjostedt E, Asplund A, et al. (2015). Proteomics. Tissue-based map of the human proteome. Science 347, 1260419. 10.1126/science.1260419. [DOI] [PubMed] [Google Scholar]
- 33.Wei W, Riley NM, Yang AC, Kim JT, Terrell SM, Li VL, Garcia-Contreras M, Bertozzi CR, and Long JZ (2021). Cell type-selective secretome profiling in vivo. Nat Chem Biol 17, 326–334. 10.1038/s41589-020-00698-y. [DOI] [PMC free article] [PubMed] [Google Scholar]
- 34.Azimifar SB, Nagaraj N, Cox J, and Mann M (2014). Cell-type-resolved quantitative proteomics of murine liver. Cell Metab 20, 1076–1087. 10.1016/j.cmet.2014.11.002. [DOI] [PubMed] [Google Scholar]
- 35.Ding C, Li Y, Guo F, Jiang Y, Ying W, Li D, Yang D, Xia X, Liu W, Zhao Y, et al. (2016). A Cell-type-resolved Liver Proteome. Mol Cell Proteomics 15, 3190–3202. 10.1074/mcp.M116.060145. [DOI] [PMC free article] [PubMed] [Google Scholar]
- 36.Hashimoto O, Funaba M, Sekiyama K, Doi S, Shindo D, Satoh R, Itoi H, Oiwa H, Morita M, Suzuki C, et al. (2018). Activin E Controls Energy Homeostasis in Both Brown and White Adipose Tissues as a Hepatokine. Cell Rep 25, 1193–1203. 10.1016/j.celrep.2018.10.008. [DOI] [PubMed] [Google Scholar]
- 37.Talukdar S, Owen BM, Song P, Hernandez G, Zhang Y, Zhou Y, Scott WT, Paratala B, Turner T, Smith A, et al. (2016). FGF21 Regulates Sweet and Alcohol Preference. Cell Metab 23, 344–349. 10.1016/j.cmet.2015.12.008. [DOI] [PMC free article] [PubMed] [Google Scholar]
- 38.Seo JA, Kang MC, Yang WM, Hwang WM, Kim SS, Hong SH, Heo JI, Vijyakumar A, de Moura LP, Uner A, et al. (2020). Apolipoprotein J is a hepatokine regulating muscle glucose metabolism and insulin sensitivity. Nature Communications 11. ARTN 2024 10.1038/s41467-020-15963-w. [DOI] [PMC free article] [PubMed] [Google Scholar]
- 39.von Holstein-Rathlou S, BonDurant LD, Peltekian L, Naber MC, Yin TC, Claflin KE, Urizar AI, Madsen AN, Ratner C, Holst B, et al. (2016). FGF21 Mediates Endocrine Control of Simple Sugar Intake and Sweet Taste Preference by the Liver. Cell Metabolism 23, 335–343. 10.1016/j.cmet.2015.12.003. [DOI] [PMC free article] [PubMed] [Google Scholar]
- 40.Wu T, Liu Q, Li Y, Li H, Chen L, Yang X, Tang Q, Pu S, Kuang J, Li R, et al. (2021). Feeding-induced hepatokine, Manf, ameliorates diet-induced obesity by promoting adipose browning via p38 MAPK pathway. J Exp Med 218. 10.1084/jem.20201203. [DOI] [PMC free article] [PubMed] [Google Scholar]
- 41.Park K, Lee K, Zhang B, Zhou T, He X, Gao G, Murray AR, and Ma JX (2011). Identification of a novel inhibitor of the canonical Wnt pathway. Molecular and cellular biology 31, 3038–3051. 10.1128/MCB.01211-10. [DOI] [PMC free article] [PubMed] [Google Scholar]
- 42.MacDonald BT, and He X (2012). Frizzled and LRP5/6 receptors for Wnt/beta-catenin signaling. Cold Spring Harb Perspect Biol 4. 10.1101/cshperspect.a007880. [DOI] [PMC free article] [PubMed] [Google Scholar]
- 43.Sato T, van Es JH, Snippert HJ, Stange DE, Vries RG, van den Born M, Barker N, Shroyer NF, van de Wetering M, and Clevers H (2011). Paneth cells constitute the niche for Lgr5 stem cells in intestinal crypts. Nature 469, 415–418. 10.1038/nature09637. [DOI] [PMC free article] [PubMed] [Google Scholar]
- 44.Li C, Huang Z, Zhu L, Yu X, Gao T, Feng J, Hong H, Yin H, Zhou T, Qi W, et al. (2019). The contrary intracellular and extracellular functions of PEDF in HCC development. Cell Death Dis 10, 742. 10.1038/s41419-019-1976-4. [DOI] [PMC free article] [PubMed] [Google Scholar]
- 45.Protiva P, Gong J, Sreekumar B, Torres R, Zhang X, Belinsky GS, Cornwell M, Crawford SE, Iwakiri Y, and Chung C (2015). Pigment Epithelium-Derived Factor (PEDF) Inhibits Wnt/beta-catenin Signaling in the Liver. Cell Mol Gastroenterol Hepatol 1, 535–549 e514. 10.1016/j.jcmgh.2015.06.006. [DOI] [PMC free article] [PubMed] [Google Scholar]
- 46.Dawson DW, Volpert OV, Gillis P, Crawford SE, Xu H, Benedict W, and Bouck NP (1999). Pigment epithelium-derived factor: a potent inhibitor of angiogenesis. Science 285, 245–248. 10.1126/science.285.5425.245. [DOI] [PubMed] [Google Scholar]
- 47.Cruciat CM, and Niehrs C (2013). Secreted and transmembrane wnt inhibitors and activators. Cold Spring Harb Perspect Biol 5, a015081. 10.1101/cshperspect.a015081. [DOI] [PMC free article] [PubMed] [Google Scholar]
- 48.Ren Q, Chen J, and Liu Y (2021). LRP5 and LRP6 in Wnt Signaling: Similarity and Divergence. Front Cell Dev Biol 9, 670960. 10.3389/fcell.2021.670960. [DOI] [PMC free article] [PubMed] [Google Scholar]
- 49.Quante M, and Wang TC (2009). Stem cells in gastroenterology and hepatology. Nat Rev Gastroenterol Hepatol 6, 724–737. 10.1038/nrgastro.2009.195. [DOI] [PMC free article] [PubMed] [Google Scholar]
- 50.Alberdi E, Aymerich MS, and Becerra SP (1999). Binding of pigment epithelium-derived factor (PEDF) to retinoblastoma cells and cerebellar granule neurons. Evidence for a PEDF receptor. The Journal of biological chemistry 274, 31605–31612. 10.1074/jbc.274.44.31605. [DOI] [PubMed] [Google Scholar]
- 51.Amaral J, and Becerra SP (2010). Effects of human recombinant PEDF protein and PEDF-derived peptide 34-mer on choroidal neovascularization. Invest Ophthalmol Vis Sci 51, 1318–1326. 10.1167/iovs.09-4455. [DOI] [PMC free article] [PubMed] [Google Scholar]
- 52.Bilak MM, Becerra SP, Vincent AM, Moss BH, Aymerich MS, and Kuncl RW (2002). Identification of the neuroprotective molecular region of pigment epithelium-derived factor and its binding sites on motor neurons. J Neurosci 22, 9378–9386. [DOI] [PMC free article] [PubMed] [Google Scholar]
- 53.Filleur S, Volz K, Nelius T, Mirochnik Y, Huang H, Zaichuk TA, Aymerich MS, Becerra SP, Yap R, Veliceasa D, Shroff EH, and Volpert OV (2005). Two functional epitopes of pigment epithelial-derived factor block angiogenesis and induce differentiation in prostate cancer. Cancer research 65, 5144–5152. 10.1158/0008-5472.CAN-04-3744. [DOI] [PubMed] [Google Scholar]
- 54.Ruff WE, Greiling TM, and Kriegel MA (2020). Host-microbiota interactions in immune-mediated diseases. Nature reviews. Microbiology 18, 521–538. 10.1038/s41579-020-0367-2. [DOI] [PubMed] [Google Scholar]
- 55.Yang Z, Sun J, Ji H, Shi XC, Li Y, Du ZY, and Chen LQ (2017). Pigment epithelium-derived factor improves TNFalpha-induced hepatic steatosis in grass carp (Ctenopharyngodon idella). Dev Comp Immunol 71, 8–17. 10.1016/j.dci.2017.01.016. [DOI] [PubMed] [Google Scholar]
- 56.Shi L, Kishore R, McMullen MR, and Nagy LE (2002). Lipopolysaccharide stimulation of ERK1/2 increases TNF-alpha production via Egr-1. Am J Physiol Cell Physiol 282, C1205–1211. 10.1152/ajpcell.00511.2001. [DOI] [PubMed] [Google Scholar]
- 57.Veto B, Bojcsuk D, Bacquet C, Kiss J, Sipeki S, Martin L, Buday L, Balint BL, and Aranyi T (2017). The transcriptional activity of hepatocyte nuclear factor 4 alpha is inhibited via phosphorylation by ERK1/2. PloS one 12, e0172020. 10.1371/journal.pone.0172020. [DOI] [PMC free article] [PubMed] [Google Scholar]
- 58.Martinez-Jimenez CP, Kyrmizi I, Cardot P, Gonzalez FJ, and Talianidis I (2010). Hepatocyte nuclear factor 4alpha coordinates a transcription factor network regulating hepatic fatty acid metabolism. Molecular and cellular biology 30, 565–577. 10.1128/MCB.00927-09. [DOI] [PMC free article] [PubMed] [Google Scholar]
- 59.Bays H, and Stein EA (2003). Pharmacotherapy for dyslipidaemia--current therapies and future agents. Expert Opin Pharmacother 4, 1901–1938. 10.1517/14656566.4.11.1901. [DOI] [PubMed] [Google Scholar]
- 60.Willson TM, Brown PJ, Sternbach DD, and Henke BR (2000). The PPARs: from orphan receptors to drug discovery. J Med Chem 43, 527–550. 10.1021/jm990554g. [DOI] [PubMed] [Google Scholar]
- 61.Qi Y, Jiang C, Tanaka N, Krausz KW, Brocker CN, Fang ZZ, Bredell BX, Shah YM, and Gonzalez FJ (2014). PPARalpha-dependent exacerbation of experimental colitis by the hypolipidemic drug fenofibrate. Am J Physiol Gastrointest Liver Physiol 307, G564–573. 10.1152/ajpgi.00153.2014. [DOI] [PMC free article] [PubMed] [Google Scholar]
- 62.Chirinos JA, Lopez-Jaramillo P, Giamarellos-Bourboulis EJ, Davila-Del-Carpio GH, Bizri AR, Andrade-Villanueva JF, Salman O, Cure-Cure C, Rosado-Santander NR, Cornejo Giraldo MP, et al. (2022). A randomized clinical trial of lipid metabolism modulation with fenofibrate for acute coronavirus disease 2019. Nat Metab 4, 1847–1857. 10.1038/s42255-022-00698-3. [DOI] [PMC free article] [PubMed] [Google Scholar]
- 63.Tombran-Tink J, Chader GG, and Johnson LV (1991). PEDF: a pigment epithelium-derived factor with potent neuronal differentiative activity. Experimental eye research 53, 411–414. 10.1016/0014-4835(91)90248-d. [DOI] [PubMed] [Google Scholar]
- 64.Pignolo RJ, Cristofalo VJ, and Rotenberg MO (1993). Senescent WI-38 cells fail to express EPC-1, a gene induced in young cells upon entry into the G0 state. The Journal of biological chemistry 268, 8949–8957. [PubMed] [Google Scholar]
- 65.Steele FR, Chader GJ, Johnson LV, and Tombran-Tink J (1993). Pigment epithelium-derived factor: neurotrophic activity and identification as a member of the serine protease inhibitor gene family. Proceedings of the National Academy of Sciences of the United States of America 90, 1526–1530. 10.1073/pnas.90.4.1526. [DOI] [PMC free article] [PubMed] [Google Scholar]
- 66.Crowe S, Wu LE, Economou C, Turpin SM, Matzaris M, Hoehn KL, Hevener AL, James DE, Duh EJ, and Watt MJ (2009). Pigment epithelium-derived factor contributes to insulin resistance in obesity. Cell Metab 10, 40–47. 10.1016/j.cmet.2009.06.001. [DOI] [PubMed] [Google Scholar]
- 67.Famulla S, Lamers D, Hartwig S, Passlack W, Horrighs A, Cramer A, Lehr S, Sell H, and Eckel J (2011). Pigment epithelium-derived factor (PEDF) is one of the most abundant proteins secreted by human adipocytes and induces insulin resistance and inflammatory signaling in muscle and fat cells. Int J Obes (Lond) 35, 762–772. 10.1038/ijo.2010.212. [DOI] [PubMed] [Google Scholar]
- 68.Ek ET, Dass CR, and Choong PF (2006). Pigment epithelium-derived factor: a multimodal tumor inhibitor. Mol Cancer Ther 5, 1641–1646. 10.1158/1535-7163.MCT-06-0107. [DOI] [PubMed] [Google Scholar]
- 69.Doyon G, St-Jean S, Darsigny M, Asselin C, and Boudreau F (2009). Nuclear receptor co-repressor is required to maintain proliferation of normal intestinal epithelial cells in culture and down-modulates the expression of pigment epithelium-derived factor. The Journal of biological chemistry 284, 25220–25229. 10.1074/jbc.M109.022632. [DOI] [PMC free article] [PubMed] [Google Scholar]
- 70.Magri S, Paduano D, Chicco F, Cingolani A, Farris C, Delogu G, Tumbarello F, Lai M, Melis A, Casula L, Fantini MC, and Usai P (2019). Nonalcoholic fatty liver disease in patients with inflammatory bowel disease: Beyond the natural history. World J Gastroenterol 25, 5676–5686. 10.3748/wjg.v25.i37.5676. [DOI] [PMC free article] [PubMed] [Google Scholar]
- 71.Hyogo H, Yamagishi S, Maeda S, Kimura Y, Ishitobi T, and Chayama K (2012). Serum levels of pigment epithelium-derived factor (PEDF) are independently associated with procollagen III N-terminal peptide levels in patients with nonalcoholic fatty liver disease. Clin Biochem 45, 1554–1557. 10.1016/j.clinbiochem.2012.07.106. [DOI] [PubMed] [Google Scholar]
- 72.Yilmaz Y, Eren F, Ayyildiz T, Colak Y, Kurt R, Senates E, Tuncer I, Dolar E, and Imeryuz N (2011). Serum pigment epithelium-derived factor levels are increased in patients with biopsy-proven nonalcoholic fatty liver disease and independently associated with liver steatosis. Clin Chim Acta 412, 2296–2299. 10.1016/j.cca.2011.08.025. [DOI] [PubMed] [Google Scholar]
- 73.Yang M, Xu D, Liu Y, Guo X, Li W, Guo C, Zhang H, Gao Y, Mao Y, and Zhao J (2015). Combined Serum Biomarkers in Non-Invasive Diagnosis of Non-Alcoholic Steatohepatitis. PloS one 10, e0131664. 10.1371/journal.pone.0131664. [DOI] [PMC free article] [PubMed] [Google Scholar]
- 74.Gregorieff A, Pinto D, Begthel H, Destree O, Kielman M, and Clevers H (2005). Expression pattern of Wnt signaling components in the adult intestine. Gastroenterology 129, 626–638. 10.1016/j.gastro.2005.06.007. [DOI] [PubMed] [Google Scholar]
- 75.Becerra SP, and Notario V (2013). The effects of PEDF on cancer biology: mechanisms of action and therapeutic potential. Nat Rev Cancer 13, 258–271. 10.1038/nrc3484. [DOI] [PMC free article] [PubMed] [Google Scholar]
- 76.Cheng G, Zhong M, Kawaguchi R, Kassai M, Al-Ubaidi M, Deng J, Ter-Stepanian M, and Sun H (2014). Identification of PLXDC1 and PLXDC2 as the transmembrane receptors for the multifunctional factor PEDF. Elife 3, e05401. 10.7554/eLife.05401. [DOI] [PMC free article] [PubMed] [Google Scholar]
- 77.Chavan SS, Hudson LK, Li JH, Ochani M, Harris Y, Patel NB, Katz D, Scheinerman JA, Pavlov VA, and Tracey KJ (2012). Identification of pigment epithelium-derived factor as an adipocyte-derived inflammatory factor. Mol Med 18, 1161–1168. 10.2119/molmed.2012.00156. [DOI] [PMC free article] [PubMed] [Google Scholar]
- 78.Jones GR, Bain CC, Fenton TM, Kelly A, Brown SL, Ivens AC, Travis MA, Cook PC, and MacDonald AS (2018). Dynamics of Colon Monocyte and Macrophage Activation During Colitis. Frontiers in immunology 9, 2764. 10.3389/fimmu.2018.02764. [DOI] [PMC free article] [PubMed] [Google Scholar]
- 79.Vadevoo SMP, Gurung S, Lee HS, Gunassekaran GR, Lee SM, Yoon JW, Lee YK, and Lee B (2023). Peptides as multifunctional players in cancer therapy. Exp Mol Med 55, 1099–1109. 10.1038/s12276-023-01016-x. [DOI] [PMC free article] [PubMed] [Google Scholar]
- 80.Zhang T, Guan M, Xu C, Chen Y, and Lu Y (2007). Pigment epithelium-derived factor inhibits glioma cell growth in vitro and in vivo. Life Sci 81, 1256–1263. 10.1016/j.lfs.2007.08.025. [DOI] [PubMed] [Google Scholar]
- 81.Doll JA, Stellmach VM, Bouck NP, Bergh AR, Lee C, Abramson LP, Cornwell ML, Pins MR, Borensztajn J, and Crawford SE (2003). Pigment epithelium-derived factor regulates the vasculature and mass of the prostate and pancreas. Nat Med 9, 774–780. 10.1038/nm870. [DOI] [PubMed] [Google Scholar]
- 82.Lattier JM, Yang H, Crawford S, and Grossniklaus HE (2013). Host pigment epithelium-derived factor (PEDF) prevents progression of liver metastasis in a mouse model of uveal melanoma. Clin Exp Metastasis 30, 969–976. 10.1007/s10585-013-9596-3. [DOI] [PMC free article] [PubMed] [Google Scholar]
- 83.Chidlow JH Jr., Shukla D, Grisham MB, and Kevil CG (2007). Pathogenic angiogenesis in IBD and experimental colitis: new ideas and therapeutic avenues. Am J Physiol Gastrointest Liver Physiol 293, G5–G18. 10.1152/ajpgi.00107.2007. [DOI] [PubMed] [Google Scholar]
- 84.Scaldaferri F, Vetrano S, Sans M, Arena V, Straface G, Stigliano E, Repici A, Sturm A, Malesci A, Panes J, et al. (2009). VEGF-A links angiogenesis and inflammation in inflammatory bowel disease pathogenesis. Gastroenterology 136, 585–595 e585. 10.1053/j.gastro.2008.09.064. [DOI] [PubMed] [Google Scholar]
- 85.Danese S, Sans M, Spencer DM, Beck I, Donate F, Plunkett ML, de la Motte C, Redline R, Shaw DE, Levine AD, Mazar AP, and Fiocchi C (2007). Angiogenesis blockade as a new therapeutic approach to experimental colitis. Gut 56, 855–862. 10.1136/gut.2006.114314. [DOI] [PMC free article] [PubMed] [Google Scholar]
- 86.Cai J, Jiang WG, Grant MB, and Boulton M (2006). Pigment epithelium-derived factor inhibits angiogenesis via regulated intracellular proteolysis of vascular endothelial growth factor receptor 1. The Journal of biological chemistry 281, 3604–3613. 10.1074/jbc.M507401200. [DOI] [PubMed] [Google Scholar]
- 87.Schepers AG, Snippert HJ, Stange DE, van den Born M, van Es JH, van de Wetering M, and Clevers H (2012). Lineage tracing reveals Lgr5+ stem cell activity in mouse intestinal adenomas. Science 337, 730–735. 10.1126/science.1224676. [DOI] [PubMed] [Google Scholar]
- 88.De Marzo A, Aruta C, and Marigo V (2010). PEDF promotes retinal neurosphere formation and expansion in vitro. Adv Exp Med Biol 664, 621–630. 10.1007/978-1-4419-1399-9_71. [DOI] [PubMed] [Google Scholar]
- 89.Brook N, Brook E, Dharmarajan A, Chan A, and Dass CR (2020). Pigment epithelium-derived factor regulation of neuronal and stem cell fate. Experimental cell research 389, 111891. 10.1016/j.yexcr.2020.111891. [DOI] [PubMed] [Google Scholar]
- 90.Andreu-Agullo C, Morante-Redolat JM, Delgado AC, and Farinas I (2009). Vascular niche factor PEDF modulates Notch-dependent stemness in the adult subependymal zone. Nat Neurosci 12, 1514–1523. 10.1038/nn.2437. [DOI] [PubMed] [Google Scholar]
- 91.Zhou X, Cao L, Jiang C, Xie Y, Cheng X, Krausz KW, Qi Y, Sun L, Shah YM, Gonzalez FJ, Wang G, and Hao H (2014). PPARalpha-UGT axis activation represses intestinal FXR-FGF15 feedback signalling and exacerbates experimental colitis. Nat Commun 5, 4573. 10.1038/ncomms5573. [DOI] [PMC free article] [PubMed] [Google Scholar]
- 92.Luo Y, Xie C, Brocker CN, Fan J, Wu X, Feng L, Wang Q, Zhao J, Lu D, Tandon M, et al. (2019). Intestinal PPARalpha Protects Against Colon Carcinogenesis via Regulation of Methyltransferases DNMT1 and PRMT6. Gastroenterology 157, 744–759 e744. 10.1053/j.gastro.2019.05.057. [DOI] [PMC free article] [PubMed] [Google Scholar]
- 93.Brocker CN, Yue J, Kim D, Qu A, Bonzo JA, and Gonzalez FJ (2017). Hepatocyte-specific PPARA expression exclusively promotes agonist-induced cell proliferation without influence from nonparenchymal cells. Am J Physiol Gastrointest Liver Physiol 312, G283–G299. 10.1152/ajpgi.00205.2016. [DOI] [PMC free article] [PubMed] [Google Scholar]
- 94.Zhong Z, Baker JJ, Zylstra-Diegel CR, and Williams BO (2012). Lrp5 and Lrp6 play compensatory roles in mouse intestinal development. J Cell Biochem 113, 31–38. 10.1002/jcb.23324. [DOI] [PMC free article] [PubMed] [Google Scholar]
- 95.Mitchell C, and Willenbring H (2008). A reproducible and well-tolerated method for 2/3 partial hepatectomy in mice. Nat Protoc 3, 1167–1170. 10.1038/nprot.2008.80. [DOI] [PubMed] [Google Scholar]
- 96.Grieger JC, Choi VW, and Samulski RJ (2006). Production and characterization of adeno-associated viral vectors. Nat Protoc 1, 1412–1428. 10.1038/nprot.2006.207. [DOI] [PubMed] [Google Scholar]
- 97.Kohlbrenner E, Henckaerts E, Rapti K, Gordon RE, Linden RM, Hajjar RJ, and Weber T (2012). Quantification of AAV particle titers by infrared fluorescence scanning of coomassie-stained sodium dodecyl sulfate-polyacrylamide gels. Hum Gene Ther Methods 23, 198–203. 10.1089/hgtb.2012.049. [DOI] [PMC free article] [PubMed] [Google Scholar]
- 98.Bernier-Latmani J, and Petrova TV (2016). High-resolution 3D analysis of mouse small-intestinal stroma. Nat Protoc 11, 1617–1629. 10.1038/nprot.2016.092. [DOI] [PubMed] [Google Scholar]
- 99.Charni-Natan M, and Goldstein I (2020). Protocol for Primary Mouse Hepatocyte Isolation. STAR Protoc 1, 100086. 10.1016/j.xpro.2020.100086. [DOI] [PMC free article] [PubMed] [Google Scholar]
Associated Data
This section collects any data citations, data availability statements, or supplementary materials included in this article.
Supplementary Materials
Figure S1. Liver-derived PEDF restrains ISC proliferation, related to Figure 1.
(A-B) 3 days after splenectomy on WT mice, BrdU was injected into either sham or surgery mice 6 hours before tissue collection. (A) Representative images and (B) quantification of BrdU+ cells per crypt of SI and colons from sham and splenectomy mice. Scale bar, 50 μm. (n=5 per group, representative data of two experiments).
(C) Taxonomic classifications at the phylum level for 16S rDNA of indicated bacteria in fecal samples from sham and hepatectomy mice. (n=6 per group).
(D) mRNA levels of Lgr5 in isolated IECs and intestinal crypt cells from SI and colon tissue. (n=3 per group, representative data of three experiments).
(E) Principal coordinate analysis (PCoA) of proteome from plasma samples of sham and hepatectomy mice. (n=3 per group, representative data of two experiments).
(F) Heatmap of differentially expressed genes in proteomics analysis from plasma samples of sham and hepatectomy mice. Red arrow: Pedf.
NS, not significant, **p<0.01, ***p<0.001, (B, D, Unpaired Student’s t-test, error bars represent SEM).
Figure S2. PEDF regulates expansion of the intestinal stem cell niche, related to Figure 2.
(A) mRNA levels of Pedf in indicated tissues from WT mice. (n=4 per group, representative data of three experiments).
(B) Quantification of immunoblot of PEDF protein in indicated tissues from WT mice. (n=3 per group, representative data of three experiments).
(C) Representatives immunoblot of PEDF protein in liver tissues from WT and Pedf−/− mice. (n=3 per group, representative data of two experiments).
(D) PEDF levels from plasma of WT and Pedf−/− mice were assessed. (n=3 per group, representative data of three experiments).
(E) mRNA levels of Pedf in indicated tissues from WT and Pedf−/− mice. (n=3 per group, representative data of three experiments).
(F-G) 3 days after hepatectomy on (F) WT and (G) Pedf−/− mice, BrdU was injected to either sham or surgery mice 6 hours before tissue collection. Representative images of BrdU and PEDF of SI and colons from sham and hepatectomy mice. Scale bar, 50 μm. (n=3 per group, representative data of two experiments).
(H-I) (H) Representative images and (I) quantification of SI tissues stained for PEDF from WT and Pedf−/− mice. Bottom row is magnified from dot line square in upper row. Scale bar, 50 μm. (n=3 per group, representative data of two experiments).
(J) Quantification of indicated IEC subsets in intestinal tissues from WT and Pedf−/− mice. (n=5 per group, representative data of two experiments).
(K-L) BrdU was injected into WT and Pedf−/− cohoused mice 6 hours before tissue collection. (K) Representative images and (L) quantification of BrdU+ cells per crypt of SI and colons. Scale bar, 50 μm. (n=5 per group, representative data of two experiments).
(M) Taxonomic classifications at the phylum level for 16S rDNA of indicated bacteria in fecal samples from WT and Pedf−/− mice. (n=6 per group).
NS: not significant, **p<0.01, (D, I, L, Unpaired Student’s t-test, error bars represent SEM).
Figure S3. Generation of hepatic PEDF deficient mice, related to Figure 2.
(A) Schematic illustration of sgRNA and experiment design.
(B) mRNA levels of Pedf in indicated tissues from sgNTC and sgPedf mice. (n=3 per group, representative data of three experiments).
(C-D) (C) Immunoblot analysis and (D) quantification of PEDF protein in liver tissues from sgNTC and sgPedf mice. (n=3 per group, representative data of three experiments).
(E) PEDF level from plasma of sgNTC and sgPedf mice were assessed. (n=3 per group, representative data of three experiments).
(F) GO analysis of PEDF-derived signaling pathways in liver cells.
(G) Representative images of liver tissues stained for CD31 were taken from WT and Pedf−/− mice. Scale bar, 200 μm.
(H-I) (H) Representative images of liver tissues stained for Ki67 were taken from WT and Pedf−/− mice, and (I) quantification of Ki67+ cells in liver tissues. Scale bar, 200 μm.
(J) Representative immunofluorescence staining for CD31 with DAPI of intestinal tissues. Scale bar, 50 μm.
(K-L) (K) Representative immunofluorescence staining for CD31 with Ki67 in villus in small intestine and crypt in colon, and (L) quantification of Ki67+ cells in vessel area. Scale bar, 20 μm.
NS: not significant, **p<0.01, ***p<0.001, (B, D, E, I, L, Unpaired Student’s t-test, error bars represent SEM).
Figure S4. PEDF represses the Wnt/β-catenin signaling pathway on ISCs via LRP5/6, related to Figure 3.
(A) mRNA levels of indicated genes in intestinal crypt cells from WT and Pedf−/− mice. (n=3 per group, representative data of three experiments).
(B) Representative images of intestinal tissues stained for active β-catenin were taken from WT and Pedf−/− mice. Bottom row is magnified from dot line square in upper row. Red arrow, nuclear β-catenin. Scale bar, upper row, 40 μm; lower row, 20 μm. (n=3 per group, representative data of three experiments).
(C-D) (C) Representative immunoblot and (D) quantification of active β-catenin in intestinal tissues from WT and Pedf−/− mice. (n=3 per group, representative data of two experiments).
(E) Quantification of immunoblot of active β-catenin in intestinal tissues from sgNTC and sgPedf mice. (n=3 per group, representative data of two experiments).
(F) Representative images of intestinal tissues stained for PEDF from Pedf−/− mice with or without PEDF treatment. Scale bar, 50 μm. (n=3 per group, representative data of three experiments).
(G) mRNA levels of indicated genes in intestinal crypt cells from Pedf−/− mice with or without PEDF treatment. (n≥3 per group, representative data of three experiments).
(H-I) (H) Representative immunoblot and (I) quantification of active β-catenin in intestinal tissues from Pedf−/− mice with or without PEDF treatment. (n=3 per group, representative data of three experiments).
(J) Representative images of Pedf−/− intestinal organoids stained for Ki67 with or without PEDF treatment. Scale bar, 100 μm. (n=3 per group, representative data of three experiments).
(K) mRNA levels of indicated genes from intestinal organoids with or without PEDF treatment. (n=3 per group, representative data of three experiments).
(L-M) (L) Representative immunoblot and (M) quantification of Lrp5 and Lrp6 in intestinal crypt cells from Lrp5fl/flLrp6fl/fl and Lgr5creERLrp5fl/flLrp6fl/fl mice with tamoxifen pretreatment. (n=3 per group, representative data of three experiments).
(N-Q) (N, P) Experimental design and (O, Q) quantification of immunoblot analysis of active β-catenin in intestinal tissues with or without PEDF treatment. (n=3 per group, representative data of three experiments).
NS: not significant, *p<0.05, **p<0.01, ***p<0.001, (A, D, E, G, I, K, O, Q, Unpaired Student’s t-test, error bars represent SEM).
Figure S5. PEDF deficiency protects mice from intestinal inflammation, related to Figure 4.
(A) Body weight of WT and Pedf−/− mice during DSS-induced colitis was monitored. (n=5 per group, representative data of three experiments).
(B) Representative images of hematoxylin and eosin staining of colonic tissue were taken in WT and Pedf−/− mice at day 10 of DSS-induced colitis. Scale bar, 50 μm. (n=5 per group, representative data of three experiments).
(C) Colon lengths (left) and histological score (right) of WT and Pedf−/− mice, at day 10 of DSS-induced colitis, measured from the colorectal junction to the anal verge. (n=5 per group, representative data of three experiments).
(D) Colon lengths (left) and histological score (right) of sgNTC and sgPedf mice, at day 10 of DSS-induced colitis, measured from the colorectal junction to the anal verge. (n=5 per group, representative data of three experiments).
(E) Body weight of sgNTC and sgPedf mice during TNBS-induced colitis was monitored. (n=5 per group, representative data of three experiments).
(F) Representative images of hematoxylin and eosin staining of colonic tissue were taken from indicated mice at day 3 of TNBS-induced colitis. Scale bar, 50 μm. (n=5 per group, representative data of three experiments).
(G) Colon lengths (left) and histological score (right) of indicated mice at day 3 of TNBS-induced colitis, measured from the colocecal junction to the anal verge. (n=5 per group, representative data of three experiments).
(H-K) Colon lengths (left) and histological score (right) of (H) WT mice with or without PEDF protein treatment, (I) WT mice with or without 44mer peptide treatment, (J) WT mice with or without 34mer peptide treatment, (K) WT mice with or without α-PEDF antibody treatment at day 10 of DSS-induced colitis, measured from the colorectal junction to the anal verge. (n=5 per group, representative data of three experiments).
NS: not significant, *p<0.05, **p<0.01, ***p<0.001, (A, E, Two-way ANOVA with Tukey’s multiple comparison test; C, D, G-K, Unpaired Student’s t-test, error bars represent SEM).
Figure S6. The gut-liver axis calibrates PEDF production for ISC homeostasis, related to Figure 5.
(A) mRNA of Pedf was assessed from hepatocytes of WT mice collected at indicated time point of DSS-induced colitis. (n=4 per group, representative data of three experiments).
(B-C) (B) Representative immunoblot and (C) quantification of PEDF in liver tissues from WT mice at indicated time point of DSS-induced colitis. (n=3 per group, representative data of two experiments).
(D) Representative images of intestinal tissues stained for PEDF from WT mice at indicated time point of DSS-induced colitis. Scale bar, 50 μm. (n=3 per group, representative data of three experiments).
(E) Colon lengths (left) and histological score (right) of Myd88fl/fl and AlbcreMyd88fl/fl mice at day 10 of DSS-induced colitis, measured from the colocecal junction to the anal verge. (n=5 per group, representative data of two experiments).
(F) mRNA of Pedf was assessed from liver tissues of Myd88fl/fl and AlbcreMyd88fl/fl mice collected at indicated time point of DSS-induced colitis. (n=3 per group, representative data of three experiments).
(G-H) (G) Representative immunoblot and (H) quantification of PEDF in liver tissues from Myd88fl/fl and AlbcreMyd88fl/fl mice at indicated time point of DSS-induced colitis. (n=3 per group, representative data of two experiments).
(I) LPS level was assessed in WT mice liver tissue collected at day 0 and day 10 of DSS-induced colitis. (n=5 per group, representative data of two experiments).
(J) mRNA level of Pedf was assessed from murine primary hepatocytes stimulated with LPS for 12 hours. (n=6 per group, representative data of two experiments).
(K) Body weight of Tlr4fl/fl and AlbcreTlr4fl/fl mice during DSS-induced colitis. (n=5 per group, representative data of three experiments).
(L) Representative images of hematoxylin and eosin staining of colonic tissue in Tlr4fl/fl and AlbcreTlr4fl/fl mice at day 10 of DSS-induced colitis. Scale bar, 50 μm. (n=3 per group, representative data of three experiments).
(M) Colon lengths (left) and histological score (right) of Tlr4fl/fl and AlbcreTlr4fl/fl mice at day 10 of DSS-induced colitis, measured from the colorectal junction to the anal verge. (n=5 per group, representative data of three experiments).
(N) mRNA of Pedf was assessed from hepatocytes of Tlr4fl/fl and AlbcreTlr4fl/fl mice collected at indicated time point of DSS-induced colitis. (n=3 per group, representative data of three experiments).
(O-P) (O) Representative immunoblot and (P) quantification of PEDF in liver tissues from Tlr4fl/fl and AlbcreTlr4fl/fl mice at indicated time point of DSS-induced colitis. (n=3 per group, representative data of two experiments).
(Q) Mice were treated with a-PEDF antibody on the same day as DSS for 6 days. Colon lengths (left) and histological score (right) of Tlr4fl/fl and AlbcreTlr4fl/fl mice at day 10 of DSS-induced colitis, measured from the colorectal junction to the anal verge. (n=5 per group, representative data of two experiments).
NS: not significant, *p<0.05, **p<0.01, (A, Q, One-way ANOVA with Tukey’s multiple comparison test; F, H, K, N, P, Two-way ANOVA with Tukey’s multiple comparison test; E, I, J, M, Unpaired Student’s t-test; error bars represent SEM).
Figure S7. Microbial LPS regulates PEDF production via liver-derived PPARα, related to Figure 6.
(A-B) (A) Representative immunoblot and (B) quantification of PEDF and PPARa from mouse liver tissues collected at day 0 and day 10 of DSS-induced colitis. (n=3 per group, representative data of three experiments).
(C-D) (C) Representative immunoblot and (D) quantification of PPARα in liver tissues from Myd88fl/fl and AlbcreMyd88fl/fl mice at indicated time point of DSS-induced colitis. (n=3 per group, representative data of two experiments).
(E) Quantification of immunoblot of PPARα in liver tissues from Tlr4fl/fl and AlbcreTlr4fl/fl mice at indicated time point of DSS-induced colitis. (n=3 per group, representative data of two experiments).
(F) mRNA level of Ppara was assessed from murine primary hepatocytes stimulated with LPS for 12 hours. (n=4 per group, representative data of three experiments).
(G) Quantification of immunoblot of HNF4 and p-ERK in Fig. 6C. (n=3 per group, representative data of three experiments).
(H) Colon lengths (left) and histological score (right) of Pparafl/fl and AlbcrePparafl/fl mice. (n=5 per group, representative data of two experiments).
(I) mRNA of Pedf was assessed from liver tissues of Pparafl/fl and AlbcrePparafl/fl mice collected at indicated time point of DSS-induced colitis. (n=3 per group, representative data of three experiments).
(J-K) (J) Representative immunoblot and (K) quantification of PEDF in liver tissues from Pparafl/fl and AlbcrePparafl/fl mice at indicated time point of DSS-induced colitis. (n=3 per group, representative data of three experiments).
*p<0.05, **p<0.01, (D, E, I, K, Two-way ANOVA with Tukey’s multiple comparison test; F, Unpaired Student’s t-test; error bars represent SEM).
Figure S8. FB enhances susceptibility of intestinal inflammation via PEDF, related to Figure 7.
(A-C) Mice were treated with FB one time on day 4 of DSS. (A) Body weight of WT mice during DSS-induced colitis was monitored. † Mice dead. (B) Representative images of hematoxylin and eosin staining of colonic tissue were taken in WT mice at day 10 of DSS-induced colitis. Scale bar, 50 μm. (C) Colon lengths (left) and histological score (right) of WT mice at day 10 of DSS-induced colitis, measured from the colorectal junction to the anal verge. (n=5 per group, representative data of two experiments).
(D) mRNA of Pedf was assessed from in vitro hepatocytes of WT mice with indicated stimulations. (n=5 per group, representative data of two experiments).
(E) Mice were treated with FB one time at day 4 of DSS. Colon lengths (left) and histological score (right) of WT and Pedf−/− mice at day 10 of DSS-induced colitis, measured from the colocecal junction to the anal verge. (n=5 per group, representative data of two experiments).
(F) mRNA of Pedf was assessed in hepatocytes from Pparafl/fl and AlbcrePparafl/fl mice with in vitro stimulation of FB. (n≥4 per group, representative data of three experiments).
(G) mRNA of Pedf was assessed from liver tissues of Pparafl/fl and AlbcrePparafl/fl mice treated with FB for 8 hours. (n≥4 per group, representative data of three experiments).
(H) Mice were treated with FB one time at day 4 of DSS. Colon lengths (left) and histological score (right) of Pparafl/fl and AlbcrePparafl/fl mice at day 10 of DSS-induced colitis, measured from the colorectal junction to the anal verge. (n=5 per group, representative data of two experiments).
(I) Mice were treated with FB one time at day 4 of DSS, with or without α-PEDF antibody treatment on day 0 of DSS for total of 6 days. Colon lengths (left) and histological score (right) of WT mice at day 10 of DSS-induced colitis, measured from the colorectal junction to the anal verge. (n=5 per group, representative data of two experiments).
(J) Quantification of immunoblot of PEDF protein in indicated human tissues. (n=2 per group, representative data of two experiments).
(K) Representative images of human intestinal tissues stained for PEDF. Scale bar, 20 μm. (n=3 per group, representative data of two experiments).
NS: not significant, *p<0.05, **p<0.01, (D-I, One-way ANOVA with Tukey’s multiple comparison test; A, Two-way ANOVA with Tukey’s multiple comparison test; C, Unpaired Student’s t-test; error bars represent SEM).
Data Availability Statement
Plasma proteomic data have been deposited at Dataset: MSV000091409. Bulk RNA-seq data have been deposited at GEO: GSE228829. The Plasma proteomic dataset and the GEO dataset are publicly accessible as of the date of publication.
This paper does not report original code.
Any additional information required to reanalyze the data reported in this paper is available from the lead contact upon request.