

Abstract
Technology provides new opportunities to understand and optimize the relationship between the home indoor environmental quality and health outcomes in older adults. We aimed to establish proof-of-concept and feasibility of remote, real-time, high-frequency, and simultaneous monitoring of select environmental variables and outcomes related to health and wellbeing in older adults. Thirty-four participants (27 were female) with an average age (SD) of 81 years (±7.1) were recruited from community and supportive housing environments. Environmental sensors were installed in each home and participants were asked to use a wearable device on their finger and answer smartphone-based questionnaires on a daily basis. Further, a subgroup of participants were asked to complete tablet-based cognitive tests on a daily basis. Average compliance with the wearable (time worn properly / total time with device) was 81%. Participants responded to 69% of daily smartphone surveys and completed 80% of the prescribed cognitive tests. These results suggest that it is feasible to study the impact of the home thermal environment and air quality on biological rhythms, cognition, and other outcomes in older adults. However, the success of non-passive data collection elements may be contingent upon baseline cognition.
Keywords: Occupant Health, Subjective wellbeing, Indoor Environment, Cognitive Performance, Sleep Quality, Older adults
1. Introduction
Older adults and those with age-related disease are more sensitive and vulnerable to poor Indoor Environmental Quality (IEQ) from both physiologic and behavioural perspectives (Gatto et al., 2014; James III & Sweaney, 2010; Kenney et al., 2014; Medina-Ramon & Schwartz, 2008; Shishegar et al., 2021; Simoni et al., 2015; Van Kamp & Davies, 2013). Among the many factors environmental factors that determine IEQ, a suboptimal home thermal environment (as defined by both temperature and humidity), as well as poor air quality can be particularly determinantal to health and wellbeing of older adults. For example, older adults’ physiological and behavioural adaptation to indoor heat is considerably limited compared to a younger population. As a result, they have a significantly higher mortality and morbidity rate during heat waves (Hondula et al., 2015; Putnam et al., 2018). Experimental studies have also demonstrated that older adults are relatively less able to perceive thermal stress and regulate their body temperature in response to changes in ambient conditions, which in turn is likely to have deleterious effects on various health outcomes (Hansen et al., 2011; Kim et al., 2012; Tartarini et al., 2018). Meanwhile, age-related mobility and cognitive limitations may prevent some older adults from acting to adjust the thermal conditions inside their home (e.g., using the thermostat, turning on a fan, or opening windows) (Hayden et al., 2011; Hayden et al., 2017; White-Newsome et al., 2012). Similarly, older adults are more sensitive to ambient pollution as respiratory function declines with age (Wang et al., 2010).
Based on this rationale, and the fact that older adults spend most of their time inside their home, there exists an exciting opportunity to create an indoor environment that is specifically optimized, actively or passively, based on their unique and ever-changing needs.
A necessary first step to optimizing the home thermal environment and air quality for older adults is to identify the short- and longer-term relationships between fluctuations in indoor environmental variables and one’s physiology, biological rhythms, perceived comfort, well-being, and other meaningful health outcomes related to sleep, affect, gait, balance, and cognition. Unfortunately, there is a paucity of data on these relationships, in large part due to the challenges involved in the continuous monitoring of factors related to IEQ together with synchronous measurement of individual physiology and health outcomes over relatively long periods of time. Fortunately, recent advances in smart and connected sensors, wearable devices, and user-friendly interfaces with technology (e.g., smartphone apps specifically designed for older adults) afford new opportunities to study how different factors related to home IEQ influence the health and wellbeing of older adults over different scales of time (Baig et al., 2019; Wagner et al., 2012). There are several studies in the literature that report feasibility of using wearables or smartphone surveys on older adults. Merilahti et al. (2009) used a wearable watch and reported a success rate of 78% ±20 among 19 older adults (average age = 78) living in an assisted living facility over (average data collection period = 84 days ). Lach et al. (2019) studied the feasibility of a platform to track activity and sleep patterns using the MotionWatch 8 wearable device. While they did not report specific success rate, they stated that all 9 participants (average age = 85) successfully completed the 3-month data collection period and that “actigraphy monitoring using MotionWatch 8 was acceptable to participants”. Batsis et al (2021) conducted a 12-week pilot study in which they provided Fitbit wearables to 28 rural-living older adults (avg. age = 72 years) and reported that participants wore the Fitbit on 93% of the study “days”, although the authors did not clarify whether participants were also instructed to wear the device during the night. Ramsey et al. (2016) tested the feasibility of daily smartphone assessments in 103 older adults with cognitive and emotional concerns and reported that 76% of the participants completed at least half of the assessments over a 20-day period. In another study, Firtz et al. (2017) recruited 97 older African Americans and used smartphone surveys to collect data on daily activities and stress and reported a survey completion rate of 92–98%. Finally, Bartels et al. (2020) reported a 78% compliance rate with daily smartphone surveys of mood, activity, and subjective cognitive complains in 21 older adults. Notably, most of these studies test only one form of data acquisition technology and/or monitor participants over relatively short periods of time.
In this study, we aimed to (1) create a platform that integrates multiple technologies enabling real-time, high-frequency, and simultaneous acquisition of data from select measures of the home IEQ (namely temperature, humidity, and CO2 level), the residents’ physiology, and select outcomes related to their health including sleep, subjective wellbeing, and cognition, and (2) demonstrate the feasibility of using this platform to capture data in older adults across a range of baseline cognitive functional levels.
2. Materials and Methods
Recognizing that several factors related to IEQ can influence health and well-being of older adults, as a proof of concept, we decided to test our data collection platform by focusing on indoor thermal environment (i.e., temperature and humidity) and air quality because of their well-established influence on short- and long-term outcomes related to health and wellbeing, and availability of low-cost and easy-to-use smart sensors to measure them. Further, recognizing that there exist many indoor air pollutants with substantial impact on occupants’ health and wellbeing, as a proof of concept, we selected CO2 concentration because it is a measure of overall indoor air quality and adequacy of natural and/or mechanical ventilation (Batterman & Peng, 1995; Chatzidiakou et al., 2015; Scheff et al., 2000).
Table 1 details the specific physiological variables and outcomes related to health and wellbeing that we aimed to collect. To create this list, we reviewed the relevant literature and selected biological variables and meaningful health outcomes that can be influenced by indoor thermal environment and air quality. This table also includes citations to previous studies that link each biological variable/health outcome to at least one of the indoor environments variables measured in this study. We then searched available technologies on the market and excluded the variables/outcomes that could not be measured with reasonable cost and burden to participants. For example, although blood pressure of older adults is influenced by room temperature (Kim et al., 2012), we excluded it from our variable list because measuring it on a frequent basis requires significant participant effort.
Table 1.
Physiological variables and health outcomes captured by the data collection platform as well as references linking them to home thermal environment and/or CO2 level.
| Health outcome/physiological variable | References |
|---|---|
| Heart rhythms | (Abbasi et al., 2019; Hakim et al., 2018; Xiong et al., 2019) |
| Self-reported comfort | (Giamalaki & Kolokotsa, 2019; Hughes & Natarajan, 2019; Soebarto et al., 2019; Yu et al., 2020; Zhang et al., 2019) |
| Cognitive function | (Cedeño Laurent et al., 2021; Du et al., 2020; Hong et al., 2018) |
| Sleep | (Ngarambe et al., 2019; Nicol, 2019; Xia et al., 2020; Xiong et al., 2020; Xu et al., 2020; Zhang et al., 2021) |
| Activity | (Brandon et al., 2009; Togo et al., 2005) |
| Self-reported mood | (Boix-Vilella et al., 2021; Lan et al., 2011) |
2.1. Data collection
2.1.1. Environmental sensors
There are many low-cost and easy-to-use environmental sensors that measure and record data in real-time. In this study, we used the Netatmo smart air quality monitor (Netatmo, France) that continuously monitors indoor air temperature, relative humidity, and CO2 concentration. This device has been used in previous studies (Christoffersen et al., 2015; Cvetković et al., 2017; Gao et al., 2021; Mueller et al., 2020; Zune et al., 2020) and does not have a display screen, which offers the advantage of limiting participant interaction with the device and the potential for such interaction to change habitual behaviour. We calibrated the CO2 sensor in each device in a well-ventilated office space and then tested its measurements against HOBO MX1102 CO2 logger (Onset, United States) to deployment. We placed two Netatmo devices in each home; one in the bedroom and one in the space where the participant stated they spend most of their awake time. We instructed the participants to not move the device from its location and always keep it plugged in. We used Netatmo’s Application Programming Interface (API) to create a script to record each environmental variable every 15 minutes and upload acquired data to cloud storage for offline analysis. Finally, it should be noted that the data collection platform tested here is agnostic to the environmental sensor, meaning that it can be replaced by sensors that are capable of measuring other factors related to IEQ such as lighting level or other types of air pollutants.
2.1.2. Wearable device
There have been significant advances in wearable technology over the past decade, resulting in a variety of devices that passively measure various physiological rhythms, sleep and activity. After researching and testing available products on the market, we selected the Ouraring (Oura, Finland). The Ouraring measures and reports heart rhythms, respiration rate, skin temperature, movement, and several metrics related to sleep and activity (Altini & Kinnunen, 2021; Kinnunen et al., 2020; Maijala et al., 2019). We connected Oura to participants’ smartphone and provided written and verbal instructions on how to charge and wear the devices correctly. We also used Oura’s API to create a data stream from the device to cloud storage. To assess compliance with the wearable, we calculated “success rate” as the ratio of the nights the ring was worn properly and with the battery charged to the total number of nights the ring was available to the participant. We limited the data to nights because we did not specifically ask the participant to take the devices with them when they left home and instructed them to charge the device in the morning. We excluded dates the participant was away from home due to travel, hospitalization, etc.
2.1.3. Daily smartphone-based questionnaires
To test the feasibility of capturing within-day variance in subjective well-being, we created two short daily surveys (Table 2) to query participants’ subjective well-being and sent them to participants via text messages at random times between 9 AM – 6 PM. The invitation text was as follows: “Hello [participant name], to complete the survey, please visit [survey link]”. All survey responses were presented in the radio button format and participants did not have to type anything to complete the surveys. Based on feedback from our initial pilot test (Baniassadi et al., 2021), we purposely limited the number of surveys to two per day and made sure they don’t take more than 30 seconds to complete. By randomizing the time of survey, we hoped to ensure that over long periods we would collect enough data points to fully capture within-day variation in responses.
Table 2.
Daily subjective wellbeing questionnaires
| Question | Responses |
|---|---|
| Are you at home right now? | [no] [yes] |
| Right now, the room temperature feels … | [very cold] [cold] [slightly cold] [neutral] [slightly hot] [hot] [very hot] |
| Right now, I would like to room temperature to be …. | [colder] [as is] [warmer] |
| Right now, is it difficult to keep your attention on what you are doing? | [no] [yes] |
| Right now, do you feel down/depressed? | [no] [yes] |
| * Last night, I slept … | [worse than usual] [as usual] [better than usual] |
This question was only included in the first survey of the day.
Timestamped responses were collected in real time and stored in a RedCap database. During the initial enrollment visit we instructed participants on how to complete the questionnaires and provided written instructions. To assess participants’ success with the questionnaires, we calculated the ratio of completed tests and surveys to the total number of queries each participant received. We excluded dates the participant was away from home due to travel, hospitalization, etc.
2.1.4. Tablet-based cognitive tests
We gave an iPad Air 4 (Apple, United States) tablet to a subset of participants to complete one cognitive test per day. The cognitive test was presented as an optional component to those who were familiar with tablets and expressed interest. We provided verbal and written instructions during the initial visit. We implemented the tests within the Bevie platform (Linus Health, United States), an app developed specifically for older adults. We provided training on how to complete the tests on the tablet both during the first study visit and then later as requested by the participants. This included instructions on how to unlock the tablet, open the Bevie app, and find the scheduled test. In addition, the assessments always came with clear instructions as well as a short practice at the beginning of each test. Participants who received the tablet were sent one text message every day at random times (between 9 AM and 6 PM). The invitation text was as follows: “Hello [name], if you are at home, please complete the cognitive test on the iPad. To access the test, open the Bevie Senior app and then select “see my schedule”. Thank you!”.
Our cognitive test battery focused on reaction time, response inhibition, visuospatial processing, and working memory. We selected three different tests and rotated between them in the following order: 1) Day one: Go-no-Go 2) Day two: Go-no-Go 3) Day three: Simple Reaction Time 4) Day four: Rapid Multi-modal Assessment. After the fourth day the cycle would repeat itself. In the Go-No-Go test, the participant was instructed to tap the “blast” button only when a “grey alien” (aka, foe) appears and ignore the “green alien” (aka, friend). This test measures both response time and response inhibition. In the simple reaction time test, the participant was instructed to use their finger to tap on the screen as soon as a symbol appears. Finally, the Rapid Multimodal Test includes an immediate word recall test, a clock drawing test, and a delayed recall test. In the word recall test participants are given a set of words and asked to repeat them. Automatic Speech Recognition software is used to determine the accuracy of their responses. In addition, their response is analysed to derive speech metrics such as pause rate, pitch, and speed. In the DCTclock™ test, participants draw two clock faces on an iPad that precisely tracks and records their drawing behavior. One clock face is a ‘command clock’ test, where participants are asked to reproduce a clock face from memory, while the other is a ‘copy clock’ test, where they are asked to draw a clock face while viewing a reference clock face on the screen. On average, our cognitive tests take around 3 minutes to complete. To assess participants’ success with the cognitive tests, we calculated the ratio of completed tests and surveys to the total number of queries each participant received. We excluded dates the participant was away from home due to travel, hospitalization, etc.
2.1.5. Data integration
We created the data infrastructure needed to support our approach to multi-modal data acquisition and analysis. This infrastructure integrates and stores incoming data streams from multiple devices. We used Amazon Web Services (AWS) S3 bucket to store our data. The S3 bucket contains data collected from the environmental sensor and the wearable for each participant. Our extract, load, and transform process uses the APIs from our environmental sensors and wearables to request and retrieve raw data and then store it in the AWS S3 bucket. We created a pipeline that will automatically extract personal access tokens, which grants data retrieval access for each individual from the API of the wearable device, using a browser automating tool called Selenium (an open-source software under Apache License 2.0). Our program automatically logs into each account and requests a personal access token. The token is saved to a CSV file and uploaded to the S3 bucket. Our data extraction script uses the tokens to access and pull data continuously with AWS lambda and AWS Cloudwatch.
This approach also enabled “conditional surveys” a feature needed in longer term studies. Participants would receive a query to respond to these conditional surveys only when a physiological or environmental variable reaches a predefined threshold. For example, a specific cognitive test may be set to initiate only when the CO2 level (measured by the environmental sensor) reaches a certain threshold, or a morning sleep quality questionnaire may be prompted only if the wearable device detects a low sleep quality during the preceding night. We did not implement such conditional queries in the present feasibility study but believe this to be an important feature for future, longer-term investigations.
2.2. Study protocols
2.2.1. Participant eligibility and recruitment
We purposely recruited from different settings and across a wide range of cognitive function and did not exclude individuals based upon their level of familiarity, comfort, or ability to use the technology involved in the study in order to ensure our results are as generalizable as possible. We recruited participants with the following inclusion criteria: 1) At least 65 years old; 2) willing to follow study protocols for the duration of the study; 3) living in the greater Boston metropolitan area; and 4) access to stable internet connection within their home 5) having a smartphone
Exclusion criteria were selected to ensure safety and optimize compliance while minimizing confounds due to overt disease or conditions that may influence study outcomes: 1) stated plans to not live within the current place of residence for the study period; 2) stated daily activities that result in spending most of the time away from home (more than 4 hours per day); 3) any acute or unstable medical condition; 4) self-report of physician-diagnosed dementia, or likelihood of an inability to understand the study protocol and/or safely adhere to study procedures; and 5) self-reported inability to ambulate without the assistance of another person. Older adults were initially screened via phone interview. Those who were interested and potentially eligible then completed an in-person visit. Study procedures were approved by the Advarra Institutional Review Board (Hebrew SeniorLife - Pro00047567).
2.2.2. In-person study visits and baseline assessments
All participants provided written informed consent to participate in the study (for 12 months) at the beginning of the in-person visit. Our in-person baseline assessment included a questionnaire about satisfaction with the temperature and air quality inside their home, and a medical history questionnaire. In addition, we assessed global cognitive function by the Montreal Cognitive Assessment (MoCA) (Smith et al., 2007), a widely employed test with scores ranging from 0–30 where greater values reflect better function. Finally, we assessed mobility and physical performance by conducting a Short Physical Performance Battery (SPPB) test (Fisher et al., 2009), with scores ranging from 0 – 12 where higher scores reflect better performance.
After these assessments, we set up all devices, reviewed the protocol with the participants, and provided them with instructions on paper. Participants were asked to: 1) not move the Netatmo sensor and always keep it plugged-in; 2) wear the Ouraring device and charge it as needed; 3) respond to daily surveys; and 4) complete cognitive tests on the tablet (only the subset that received the tablet). Participants were given phone numbers to reach the study team in case of technical difficulties at any time.
2. 3. statistical analysis
We hypothesized that sex, smartphone type, baseline MoCA score, age, and self-reported familiarity with smartphone (scale of 1–4) partially explain the between-subject variation in success with different elements of the data collection platform. We thus used two sample T test to investigate whether the success rate with each of the elements of the data collection platform is different between females and males (gender), or between iPhone or Android phone users (smartphone type). Further, we calculated Pearson correlation coefficients between the success rate of each of the elements of the protocol, and age, baseline MoCa score1, and self-reported familiarity with technology. Finally, we explored possible links between each of the three success measures and the variability in each of the measured environmental variables (ie, variance in temperature, humidity, and CO2) by calculating the Pearson correlation coefficients between them. All statistical tests were performed using R statistical software (version 1.4.1717).
3. Results
3.1. Recruited participants
34 participants were recruited (see table 3). The length of data collection period varied among participants due to different enrollment dates. The average (SD) length of participation was 101 (±21) days.
Table 3.
Participants’ characteristics
| Baseline Characteristic | N | % | M | SD |
|---|---|---|---|---|
|
| ||||
| Gender | ||||
| Male | 7 | 21 | ||
| Female | 27 | 79 | ||
|
| ||||
| Education | ||||
| High School diploma | 2 | 6 | ||
| 2-year college | 4 | 12 | ||
| 4-year college | 13 | 38 | ||
| Graduate school | 15 | 44 | ||
|
| ||||
| Smartphone type | ||||
| Android | 9 | 28 | ||
| iPhone | 25 | 72 | ||
|
| ||||
| Self-reported confidence using smartphone | ||||
| Very confident | 17 | 50 | ||
| Somewhat confident | 15 | 44 | ||
| Somewhat unconfident | 2 | 2 | ||
| Very unconfident | 0 | 0 | ||
|
| ||||
| Montreal Cognitive Assessment (MoCA) score* | 25 | 3.8 | ||
|
| ||||
| Short Physical Performance Battery (SPPB) score* | 9 | 2.7 | ||
|
| ||||
| Age (years) | 81 | 7.1 | ||
The higher the score the better the cognitive function (range: 0 – 30)
The higher the score the better the physical performance (range: 0 – 12)
All participants were living independently during their participation; ten (29%) were living within a subsidized housing facility.
3.2. Success with different elements of the study
Table 4 shows the success with different components of the data collection platform.
Table 4.
Success with different components of the data collection platform
| Data collection element | Success metric | Success rate | |
|---|---|---|---|
| M | SD | ||
| Environmental sensors | % of time data was received | 96 | 9.9 |
| Wearable device | % of nights worn properly | 82 | 19.1 |
| Smartphone surveys | % completed | 69 | 19 |
| Tablet based cognitive assessments | % completed | 80 | 16.9 |
3.2.1. Data from the environmental sensors
Environmental data were collected without any interruption for 96% (±9.9) of the nights. This percentage was higher than 90% in all but two participants whose WIFI connection was unreliable. Although environmental data were continuously collected with relatively few interruptions, the initial installation of sensors was challenging because nearly half of the participants did not remember their WIFI password.
3.2.2. Data from the wearable device
On average participants wore the ring with the battery charged 82% (±19.1) of the nights it was available to them. This percentage was more than 60% in all but three participants. Two of these participants had the lowest MoCA scores in the sample (one had Parkinson’s disease), and one had self-reported depression and Bi-polar disorder. Ouraring stores collected data on its on-board memory for up to six weeks and only transmits data once the user opens the Oura app on their phone. Most participants regularly opened the app on their own to see their sleep and activity data. Due to lack of interest in seeing their own data, 3 participants needed monthly reminders and instructions over the phone. Five participants (15% of the sample) were not able to open the Oura app on their phone even with phone instructions. Therefore, the staff visited them every month to open the app and avoid loss of data due to memory overwrite. These five participants were among the lowest MoCA and/or SPPB scores in the sample.
3.2.3. Daily smartphone surveys and cognitive tests
Two participants with lowest SPPB scores opted out of completing the surveys after enrollment due to challenges related to motor function. Excluding these two participants, on average, participants completed 69% (±19) of the daily surveys. The 15 participants who were provided with a tablet (11 were female) completed 80% (±16.9) of the daily prescribed cognitive tests. Notably, the mean MoCA score of participants who received the tablet (M=26, SD=4.6) was higher than those who did not (M=23, SD=2.2), t(31)=1.83, p=.076.
3.3. Predictors of success with different elements of the study
Sex, smartphone type, baseline MoCA score, age, and self-reported familiarity with smartphone were hypothesized as partial explanatory variables for the between-subject variation in success with different elements of the data collection platform. The result of this analysis is presented in table 5. MoCA score correlated with wearable success rate r(31)= 0.56, p=.001, but not the survey and cognitive tests completion. On average, the survey completion rate was higher among females (M=73, SD=17.4) than male (M=53, SD=18.4) participants and this difference was statistically significant t(30)=2.68, p=.011. However, success with the wearable or the tablet was not different between female and male participants. The 8 participants who required regular in-person visits or phone reminders to sync the ring with the smartphone app scored lower on the MoCA scale (M=20, SD=4.1) than those who did not (M=26, SD=2.7), t(31)=4.6, p=.001. Moreover, they had a lower success rate with the wearable (M=60, SD=20.6) than those who could perform this task without help (M=87, SD=14.7) t(32)=4.2, p=.002. Age, smartphone type, self-reported confidence in using smartphone, years of college education, and variance in home temperature, humidity, or CO2 were not associated with any of the three success measures.
Table 5.
Potential predictors of success with different elements of the protocol
| Explanatory variable | Success with | ||
|---|---|---|---|
| cognitive tests | Smartphone questionnaires | Wearable device (%) | |
| Correlation test | |||
| Age | NS | NS | NS |
| Self-reported confidence in using smartphone | NS | NS | NS |
| Baseline MoCa score | NS | NS | p=.001** |
| Home temperature variance | NS | NS | NS |
| Home relative humidity variance | NS | NS | NS |
| Home CO2 variance | NS | NS | NS |
| Two sample t test | |||
| Sex | NS | p=.011* | NS |
| Smartphone type (android vs. iPhone) | NS | NS | NS |
NS: not significant (p > .1)
p < .05
p < .01
4. Discussion
Because older adults are more vulnerable to suboptimal IEQ it is crucial to identify specific relationships between different factors related to IEQ outcomes related to their health and well-being. We tested the feasibility of real-time, high-frequency, and simultaneous monitoring of the select environmental variables and outcomes related to health and wellbeing in 34 older adults. The protocol tested in this study included environmental sensors, a wearable device, smartphone-based questionnaires, and tablet-based cognitive tests (optional). The findings suggest that it is feasible to study the impact of the home thermal environment and air quality on biological rhythms, cognition, and other outcomes, simultaneously, in community-dwelling older adults. However, the success of the non-passive elements of the protocol was contingent upon baseline cognitive function.
Compared to past studies, the novelty of the platform tested here is that it enables long-term data capture from different domains (physiology, environment, cognitive function, subjective wellbeing). While past studies (mentioned in the introduction) have different inclusion/exclusion criteria and use different technology, overall, the observed success with the non-passive elements in the present study as well as past research shows that it is feasible to measure continuously measure activity, sleep, and biological rhythms, and subjective well-being of older adults using existing wearable and smartphone technology.
Adherence to each element of the protocol can be improved based on lessons learned from feasibility tests like the present study. For example, the in-person visits to sync the ring data with the app for the five above-mentioned participants presented a challenge to the study team and an extra burden to participants. Given the challenges involved in setting up regular in-person visits, this can potentially result in loss of data as the on-board storage of the wearable device becomes full. This challenge was also reported by Deka et al. who used a Fitbit to validate self-reported exercise diaries and monitor exercise in community dwelling patients with heart failure (Deka et al., 2018). Therefore, for future studies, devices that automatically sync with the smartphone or can store data for longer periods, such as the devices used by Lach et al. (2019), are recommended.
A potential contributor to the success with smartphone surveys was the relatively short time requirement to complete them. The results achieved here were better compared to the pilot test (Baniassadi et al., 2021) which involved four surveys each day that were also longer than surveys used in this study. Therefore, long-term compliance can be maximized by limiting the surveys numbers to two per day. Over long periods, randomizing the time-of-day participants receive the surveys or invitations to complete cognitive tests will enable capturing of the within day variations in outcomes. In addition, the surveys should be as short as possible. The compliance with tablet-based cognitive test observed here was higher than the initial pilot test (Baniassadi et al., 2021) which involved four sets of tests each day. Again, limiting the number of tests per day and making them as short as possible is likely contributing to the high success rate.
The success rate with tablet-based cognitive tests was higher than smartphone questionnaires despite the longer time requirement and more complexity in the task. However, it is important to note that only participants who had prior experience with a tablet and were interested in this optional component received the tablet. Moreover, the 15 participants who received the tablet had a higher MoCA score. Therefore, compliance with a tablet-based cognitive test in this subsample is likely higher than it would have been if all participants were asked to complete the tests. The tablet-based cognitive tests were by far the most complicated element of this platform. Even though the Bevie app was optimized for older adult users, working with the tablet and opening the app presented a challenge especially to those who had no previous experience with tablets. Therefore, tablet-based cognitive tests like those used in this study are feasible mostly in older adults who have prior experience with this technology.
The overall success rate with the ring was better than the survey completion rate. This is likely due to the fact that participants could simply wear the ring for nearly four days without taking it off to charge. However, baseline level of cognitive function influenced the success with the wearable but not the tablet tests or daily surveys. It is possible that those who have lower score on the MoCA scale are more likely to forget wearing/charging the ring. On the other hand, because both the smartphone surveys and tablet-based cognitive tests come with notifications, cognitively intact participants are less likely to forget to respond to them. Therefore, a reminder (e.g., text notification) to wear the wearable before bed could potentially improve compliance.
An important limitation in the present study is that the sample was biased towards more educated individuals. Although years of college education was not correlated with any of the success measures, it is plausible that more educated older adults have more exposure to technologies like smartphones or tablets and as a result are more successful in using them. Future studies could address this limitation by enrolling a sample of older adults whose education matches the general population more closely.
Figure 1.
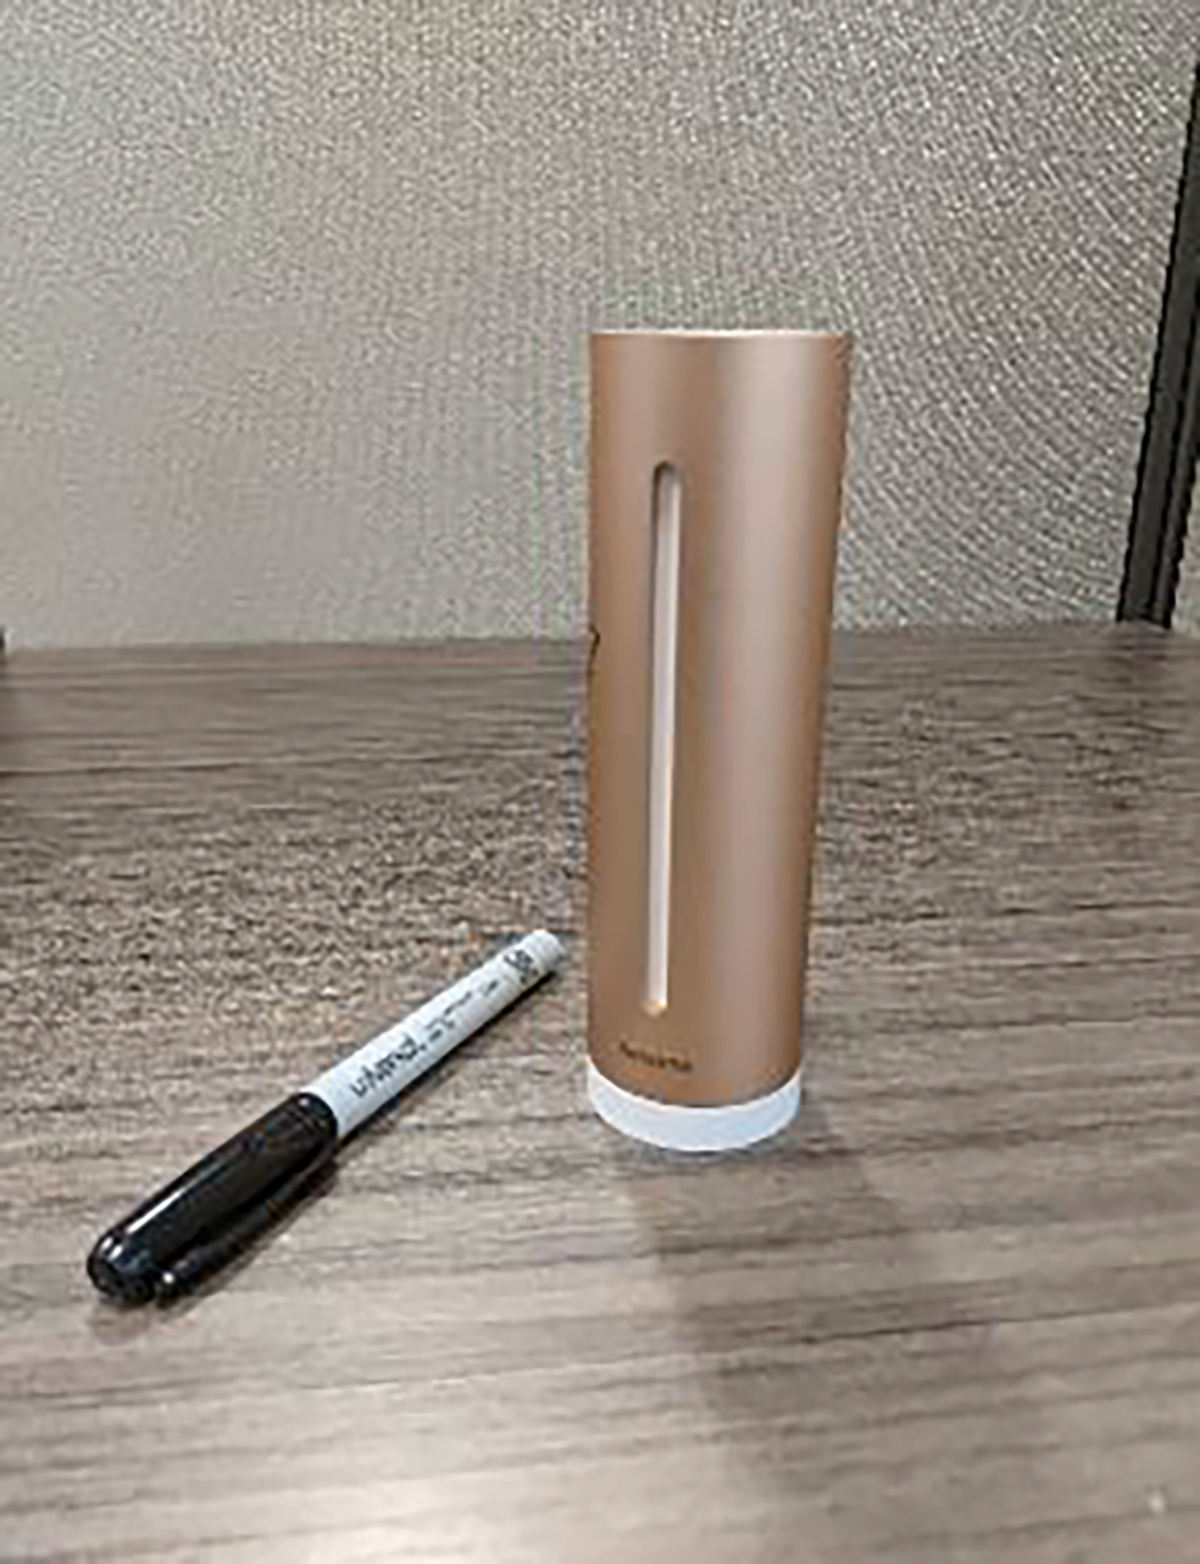
Netatmo indoor air quality and temperature sensor, next to a pen to illustrate its unobtrusive size (source: Netatmo.com)
Figure 2.
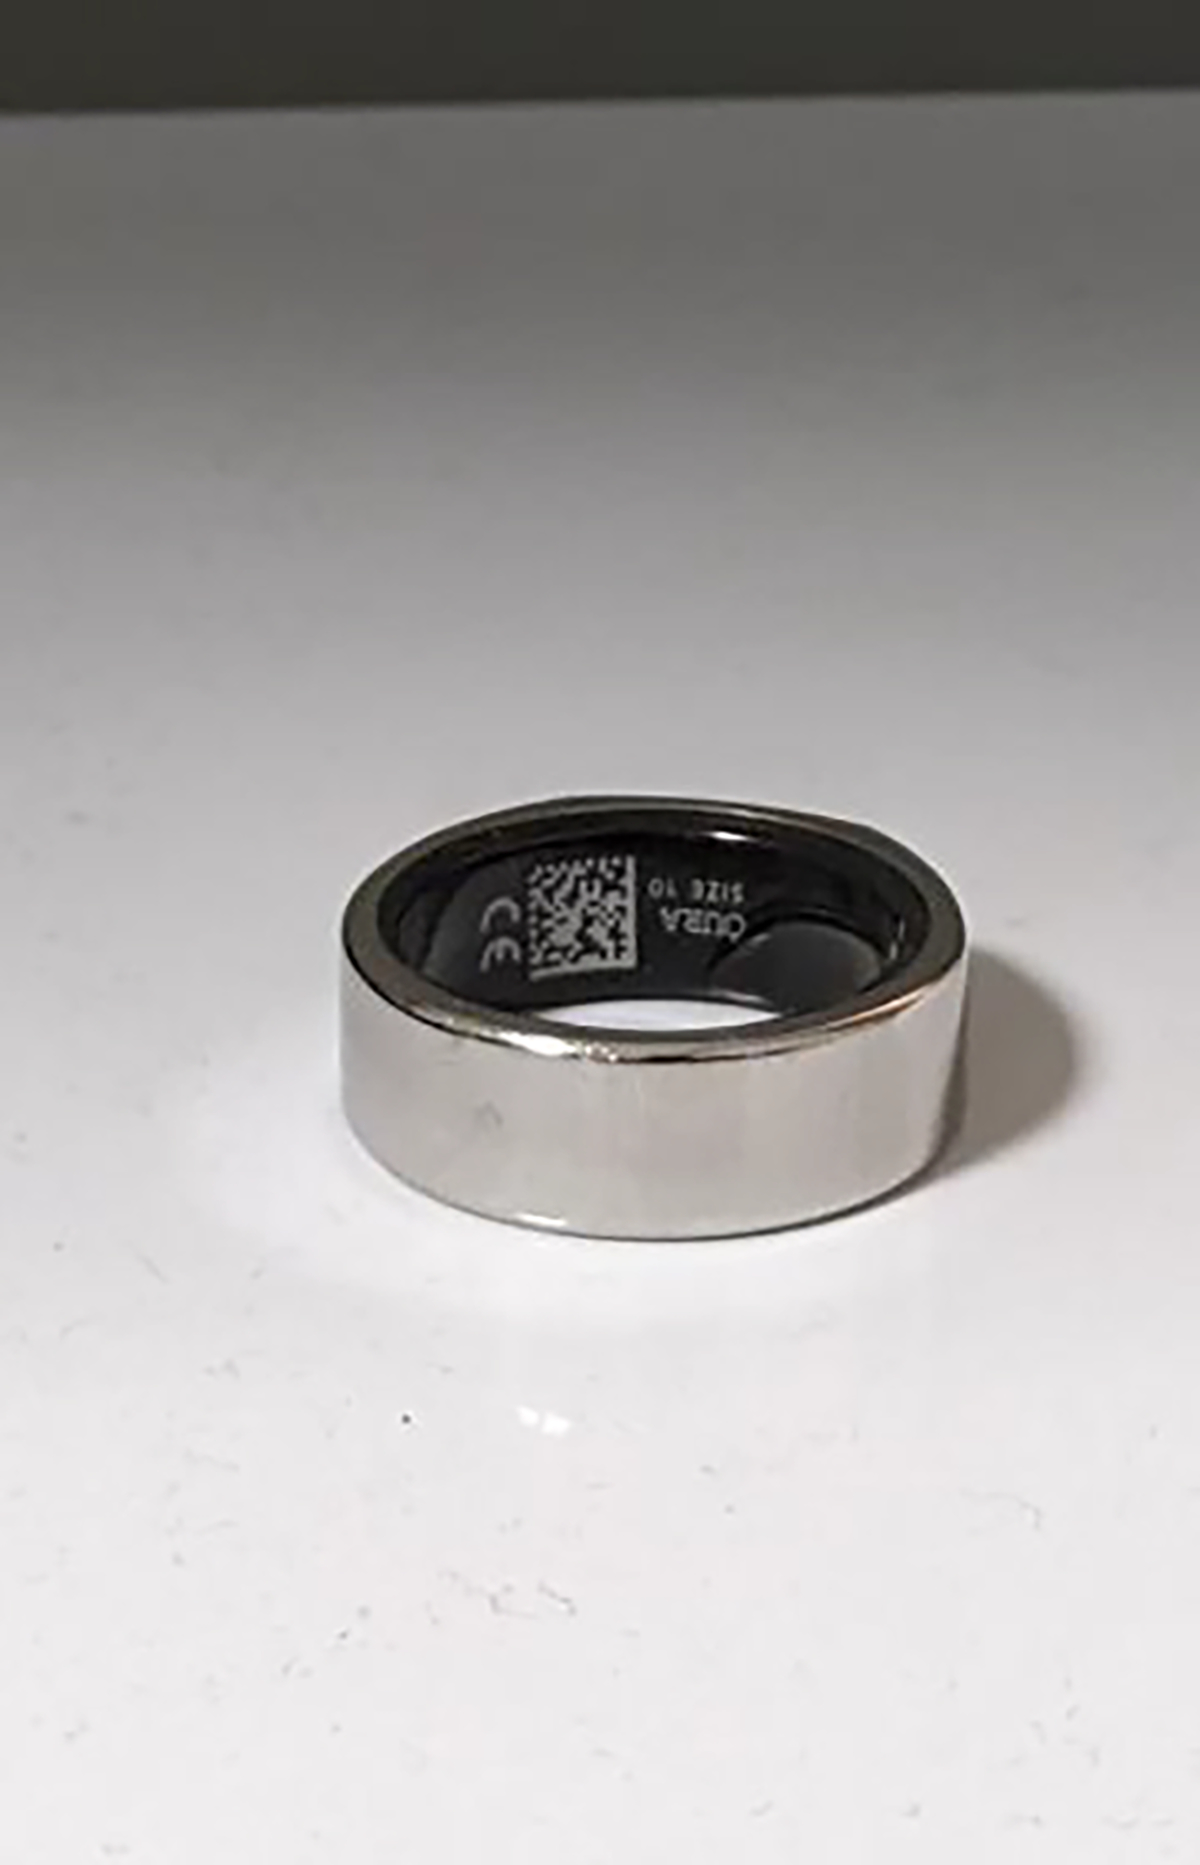
The wearable device used in this study
Figure 3.
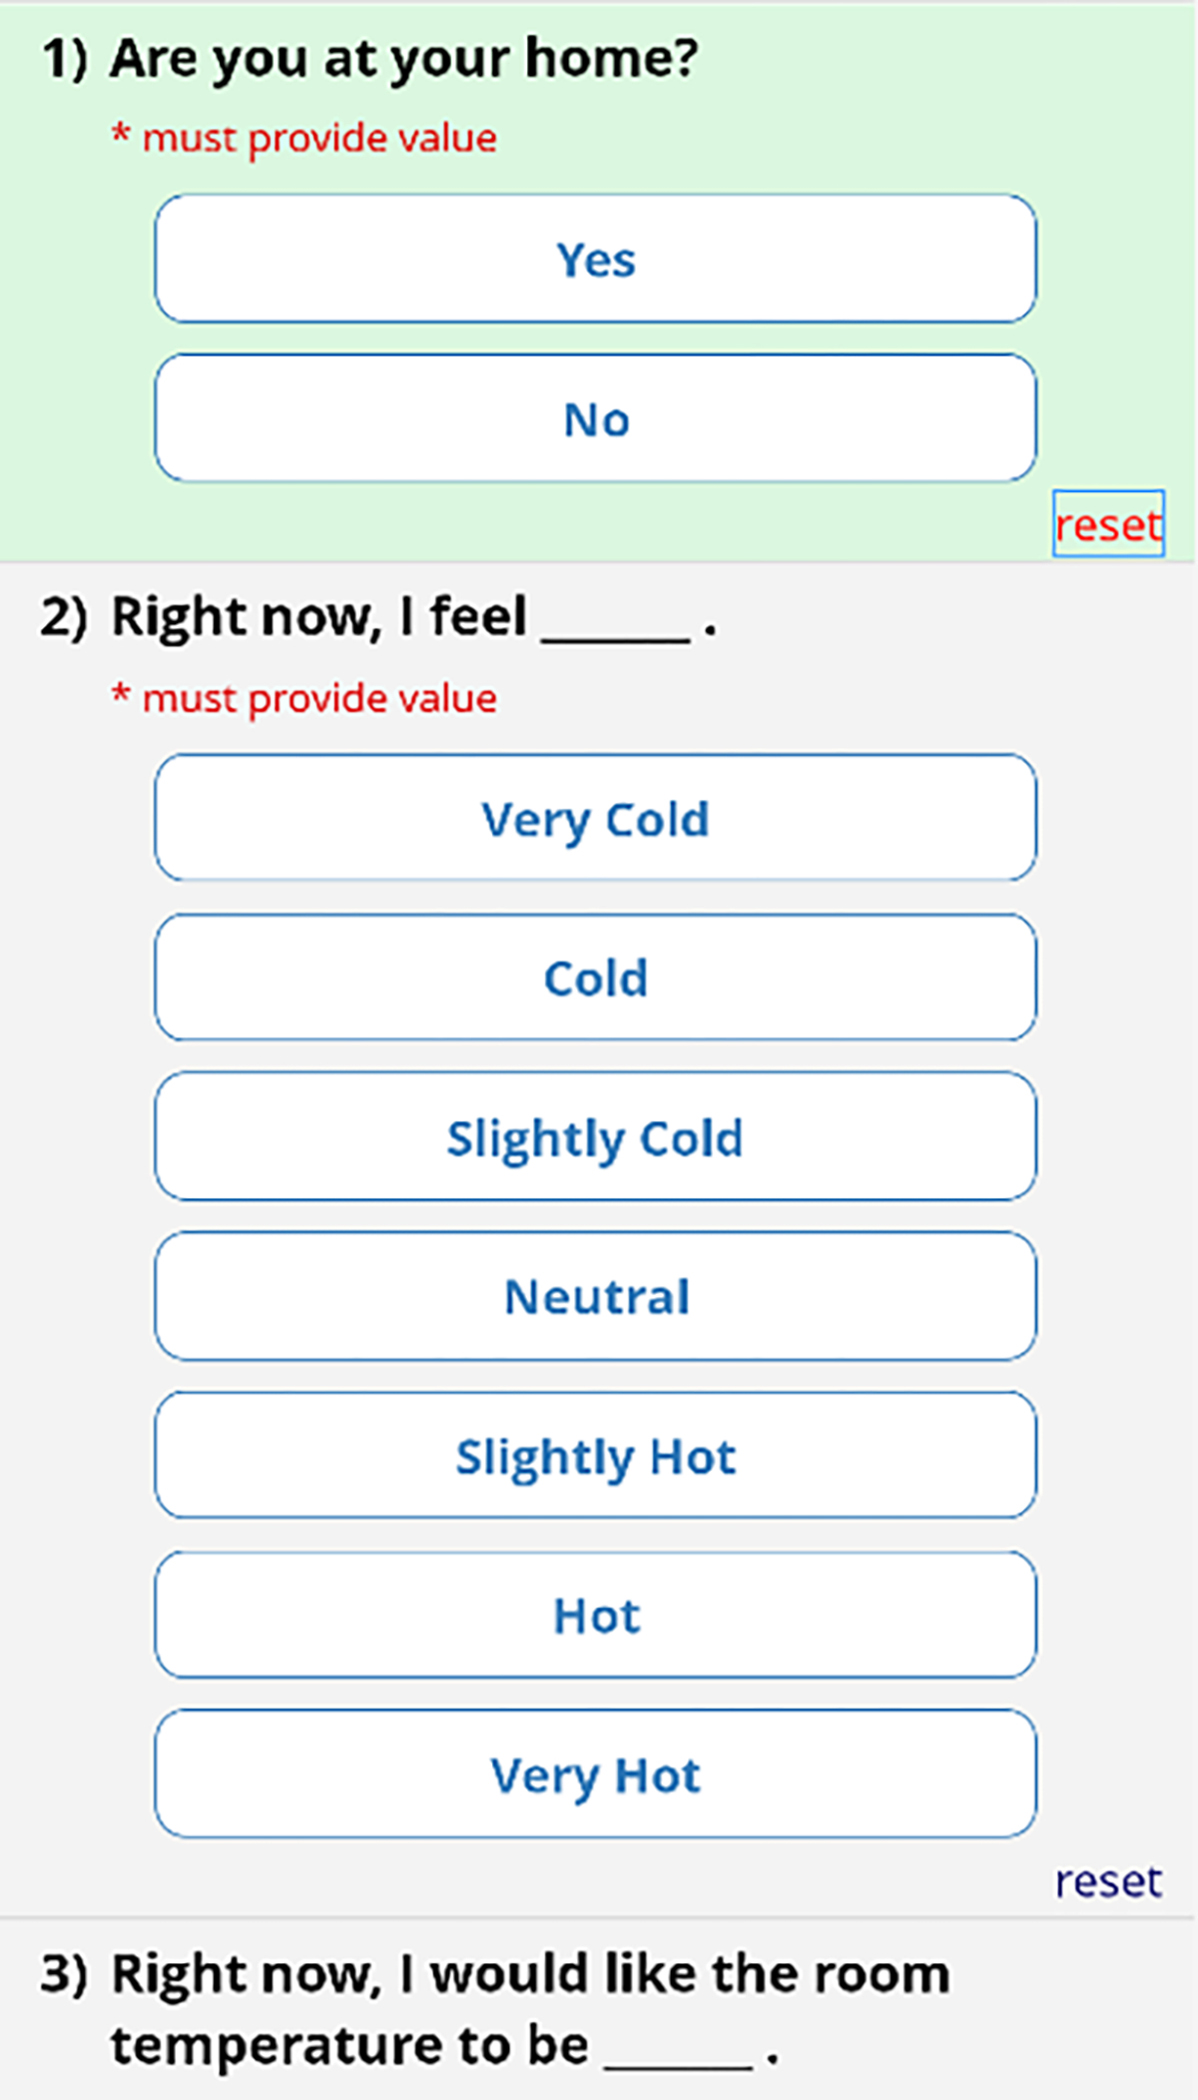
Daily Smartphone surveys presented to participants
Acknowledgments
This study was supported by the TMCity foundation and a T32 postdoctoral fellowship awarded to AB by the National Institute of Health (T32 AG023480).
Footnotes
Declaration of interest
The authors declare that they have no known competing financial interests or personal relationships that could have appeared to influence the work reported in this paper.
One participant could not completed MoCA assessment because of language barrier and was excluded from the all statistical analysis that involve MoCA score.
References
- Abbasi AM, Motamedzade M, Aliabadi M, Golmohammadi R, & Tapak L (2019). The impact of indoor air temperature on the executive functions of human brain and the physiological responses of body. Health promotion perspectives, 9(1), 55–64. 10.15171/hpp.2019.07 [DOI] [PMC free article] [PubMed] [Google Scholar]
- Altini M, & Kinnunen H (2021). The Promise of Sleep: A Multi-Sensor Approach for Accurate Sleep Stage Detection Using the Oura Ring. Sensors, 21(13), 4302. [DOI] [PMC free article] [PubMed] [Google Scholar]
- Baig MM, Afifi S, GholamHosseini H, & Mirza F (2019). A systematic review of wearable sensors and IoT-based monitoring applications for older adults–a focus on ageing population and independent living. Journal of medical systems, 43(8), 1–11. [DOI] [PubMed] [Google Scholar]
- Baniassadi A, Manor B, Yu W, Lipsitz L, & Pascual-Leone A (2021). A Platform to Study the Effects of Home Environment on Health and Wellbeing of Older Adults. Innovation in Aging, 5(Supplement_1), 957–957. [Google Scholar]
- Bartels SL, van Knippenberg RJ, Malinowsky C, Verhey FR, & de Vugt ME (2020). Smartphone-based experience sampling in people with mild cognitive impairment: feasibility and usability study. JMIR aging, 3(2), e19852. [DOI] [PMC free article] [PubMed] [Google Scholar]
- Batsis JA, Petersen CL, Clark MM, Cook SB, Lopez-Jimenez F, Al-Nimr RI, . . . Bartels SJ. (2021). A weight loss intervention augmented by a wearable device in rural older adults with obesity: a feasibility study. The Journals of Gerontology: Series A, 76(1), 95–100. [DOI] [PMC free article] [PubMed] [Google Scholar]
- Batterman S, & Peng C. u. (1995). TVOC and CO2 concentrations as indicators in indoor air quality studies. American Industrial Hygiene Association Journal, 56(1), 55–65. [Google Scholar]
- Boix-Vilella S, Saiz-Clar E, León-Zarceño E, & Serrano MA (2021). Influence of Air Temperature on School Teachers’ Mood and the Perception of Students’ Behavior. Sustainability, 13(17). 10.3390/su13179707 [DOI] [Google Scholar]
- Brandon CA, Gill DP, Speechley M, Gilliland J, & Jones GR (2009). Physical activity levels of older community-dwelling adults are influenced by summer weather variables. Applied Physiology, Nutrition, and Metabolism, 34(2), 182–190. 10.1139/H09-004 [DOI] [PubMed] [Google Scholar]
- Cedeño Laurent JG, MacNaughton P, Jones E, Young AS, Bliss M, Flanigan S, . . . Allen JG. (2021). Associations between acute exposures to PM2.5 and carbon dioxide indoors and cognitive function in office workers: a multicountry longitudinal prospective observational study. Environmental Research Letters, 16(9), 094047. 10.1088/1748-9326/ac1bd8 [DOI] [PMC free article] [PubMed] [Google Scholar]
- Chatzidiakou L, Mumovic D, & Summerfield A (2015). Is CO2 a good proxy for indoor air quality in classrooms? Part 1: The interrelationships between thermal conditions, CO2 levels, ventilation rates and selected indoor pollutants. Building Services Engineering Research and Technology, 36(2), 129–161. [Google Scholar]
- Christoffersen J, Hansen AH, Andersen K, Foldbjerg P, & Asmussen TF (2015). Indoor climate in a renovated Danish school: Measurements of electric light, indoor temperature and air quality (CO2). In: VELUX. [Google Scholar]
- Cvetković B, Gjoreski M, Šorn J, Frešer M, Bogdański M, Jackowska K, . . . Luštrek M. (2017). Management of physical, mental and environmental stress at the workplace. 2017 International Conference on Intelligent Environments (IE), [Google Scholar]
- Deka P, Pozehl B, Norman JF, & Khazanchi D (2018). Feasibility of using the Fitbit® Charge HR in validating self-reported exercise diaries in a community setting in patients with heart failure. European Journal of Cardiovascular Nursing, 17(7), 605–611. [DOI] [PubMed] [Google Scholar]
- Du B, Tandoc MC, Mack ML, & Siegel JA (2020). Indoor CO2 concentrations and cognitive function: A critical review [ 10.1111/ina.12706]. Indoor Air, 30(6), 1067–1082. 10.1111/ina.12706 [DOI] [PubMed] [Google Scholar]
- Fisher S, Ottenbacher KJ, Goodwin JS, Graham JE, & Ostir GV (2009). Short physical performance battery in hospitalized older adults. Aging clinical and experimental research, 21(6), 445–452. [DOI] [PMC free article] [PubMed] [Google Scholar]
- Fritz H, Tarraf W, Saleh DJ, & Cutchin MP (2017). Using a smartphone-based ecological momentary assessment protocol with community dwelling older African Americans. Journals of Gerontology Series B: Psychological Sciences and Social Sciences, 72(5), 876–887. [DOI] [PMC free article] [PubMed] [Google Scholar]
- Gao N, Marschall M, Burry J, Watkins S, & Salim FD (2021). Understanding occupants’ behaviour, engagement, emotion, and comfort indoors with heterogeneous sensors and wearables. arXiv preprint arXiv:2105.06637. [DOI] [PMC free article] [PubMed] [Google Scholar]
- Gatto NM, Henderson VW, Hodis HN, John JAS, Lurmann F, Chen J-C, & Mack WJ (2014). Components of air pollution and cognitive function in middle-aged and older adults in Los Angeles. Neurotoxicology, 40, 1–7. [DOI] [PMC free article] [PubMed] [Google Scholar]
- Giamalaki M, & Kolokotsa D (2019). Understanding the thermal experience of elderly people in their residences: Study on thermal comfort and adaptive behaviors of senior citizens in Crete, Greece. Energy and Buildings, 185, 76–87. [Google Scholar]
- Hakim M, Walia H, Dellinger HL, Balaban O, Saadat H, Kirschner RE, . . . Raman VT (2018). The Effect of Operating Room Temperature on the Performance of Clinical and Cognitive Tasks. Pediatric quality & safety, 3(2), e069–e069. 10.1097/pq9.0000000000000069 [DOI] [PMC free article] [PubMed] [Google Scholar]
- Hansen A, Bi P, Nitschke M, Pisaniello D, Newbury J, & Kitson A (2011). Older persons and heat-susceptibility: the role of health promotion in a changing climate. Health promotion journal of Australia, 22(4), 17–20. [DOI] [PubMed] [Google Scholar]
- Hayden MH, Brenkert-Smith H, & Wilhelmi OV (2011). Differential adaptive capacity to extreme heat: a Phoenix, Arizona, case study. Weather, Climate, and Society, 3(4), 269–280. [Google Scholar]
- Hayden MH, Wilhelmi OV, Banerjee D, Greasby T, Cavanaugh JL, Nepal V, . . . S Gower. (2017). Adaptive capacity to extreme heat: results from a household survey in Houston, Texas. Weather, climate, and society, 9(4), 787–799. [Google Scholar]
- Hondula DM, Davis RE, Saha MV, Wegner CR, & Veazey LM (2015). Geographic dimensions of heat-related mortality in seven US cities. Environmental research, 138, 439–452. [DOI] [PubMed] [Google Scholar]
- Hong T, Kim J, & Lee M (2018). Integrated task performance score for the building occupants based on the CO2 concentration and indoor climate factors changes. Applied Energy, 228, 1707–1713. 10.1016/j.apenergy.2018.07.063 [DOI] [Google Scholar]
- Hughes C, & Natarajan S (2019). ‘The Older I Get, the Colder I Get’—Older People’s Perspectives on Coping in Cold Homes. Journal of Housing For the Elderly, 33(4), 337–357. [Google Scholar]
- James III RN, & Sweaney AL (2010). Housing dissatisfaction and cognitive decline in older adults. Journal of Housing for the Elderly, 24(1), 93–106. [Google Scholar]
- Kenney WL, Craighead DH, & Alexander LM (2014). Heat waves, aging, and human cardiovascular health. Medicine and science in sports and exercise, 46(10), 1891. [DOI] [PMC free article] [PubMed] [Google Scholar]
- Kim Y-M, Kim S, Cheong H-K, Ahn B, & Choi K (2012). Effects of heat wave on body temperature and blood pressure in the poor and elderly. Environmental health and toxicology, 27. [DOI] [PMC free article] [PubMed] [Google Scholar]
- Kinnunen H, Rantanen A, Kenttä T, & Koskimäki H (2020). Feasible assessment of recovery and cardiovascular health: accuracy of nocturnal HR and HRV assessed via ring PPG in comparison to medical grade ECG. Physiological measurement, 41(4), 04NT01. [DOI] [PubMed] [Google Scholar]
- Lach HW, Lorenz RA, Palmer JL, Koedbangkham J, & Noimontree W (2019). Home monitoring to track activity and sleep patterns among older adults: A feasibility study. CIN: Computers, Informatics, Nursing, 37(12), 628–637. [DOI] [PubMed] [Google Scholar]
- Lan L, Wargocki P, Wyon DP, & Lian Z (2011). Effects of thermal discomfort in an office on perceived air quality, SBS symptoms, physiological responses, and human performance [ 10.1111/j.1600-0668.2011.00714.x]. Indoor Air, 21(5), 376–390. 10.1111/j.1600-0668.2011.00714.x [DOI] [PubMed] [Google Scholar]
- Maijala A, Kinnunen H, Koskimäki H, Jämsä T, & Kangas M (2019). Nocturnal finger skin temperature in menstrual cycle tracking: ambulatory pilot study using a wearable Oura ring. BMC women’s health, 19(1), 1–10. [DOI] [PMC free article] [PubMed] [Google Scholar]
- Medina-Ramon M, & Schwartz J (2008). Who is more vulnerable to die from ozone air pollution? Epidemiology, 672–679. [DOI] [PubMed] [Google Scholar]
- Merilahti J, Pärkkä J, Antila K, Paavilainen P, Mattila E, Malm E-J, . . . Korhonen I. (2009). Compliance and technical feasibility of long-term health monitoring with wearable and ambient technologies. Journal of telemedicine and telecare, 15(6), 302–309. [DOI] [PubMed] [Google Scholar]
- Mueller W, Steinle S, Pärkkä J, Parmes E, Liedes H, Kuijpers E, . . . Chapizanis D. (2020). Urban greenspace and the indoor environment: Pathways to health via indoor particulate matter, noise, and road noise annoyance. Environmental research, 180, 108850. [DOI] [PubMed] [Google Scholar]
- Ngarambe J, Yun GY, Lee K, & Hwang Y (2019). Effects of Changing Air Temperature at Different Sleep Stages on the Subjective Evaluation of Sleep Quality. Sustainability, 11(5). 10.3390/su11051417 [DOI] [Google Scholar]
- Nicol F (2019). Temperature and sleep. Energy and Buildings, 204, 109516. 10.1016/j.enbuild.2019.109516 [DOI] [Google Scholar]
- Putnam H, Hondula DM, Urban A, Berisha V, Iñiguez P, & Roach M (2018). It’s not the heat, it’s the vulnerability: attribution of the 2016 spike in heat-associated deaths in Maricopa County, Arizona. Environmental Research Letters, 13(9), 094022. [Google Scholar]
- Ramsey AT, Wetherell JL, Depp C, Dixon D, & Lenze E (2016). Feasibility and acceptability of smartphone assessment in older adults with cognitive and emotional difficulties. Journal of Technology in Human Services, 34(2), 209–223. [DOI] [PMC free article] [PubMed] [Google Scholar]
- Scheff PA, Paulius VK, Huang SW, & Conroy LM (2000). Indoor air quality in a middle school, Part I: Use of CO2 as a tracer for effective ventilation. Applied occupational and environmental hygiene, 15(11), 824–834. [DOI] [PubMed] [Google Scholar]
- Shishegar N, Boubekri M, Stine-Morrow EAL, & Rogers WA (2021). Tuning environmental lighting improves objective and subjective sleep quality in older adults. Building and Environment, 204, 108096. 10.1016/j.buildenv.2021.108096 [DOI] [Google Scholar]
- Simoni M, Baldacci S, Maio S, Cerrai S, Sarno G, & Viegi G (2015). Adverse effects of outdoor pollution in the elderly. Journal of thoracic disease, 7(1), 34. [DOI] [PMC free article] [PubMed] [Google Scholar]
- Smith T, Gildeh N, & Holmes C (2007). The Montreal Cognitive Assessment: validity and utility in a memory clinic setting. The Canadian Journal of Psychiatry, 52(5), 329–332. [DOI] [PubMed] [Google Scholar]
- Soebarto V, Zhang H, & Schiavon S (2019). A thermal comfort environmental chamber study of older and younger people. Building and Environment, 155, 1–14. 10.1016/j.buildenv.2019.03.032 [DOI] [Google Scholar]
- Tartarini F, Cooper P, & Fleming R (2018). Thermal perceptions, preferences and adaptive behaviours of occupants of nursing homes. Building and Environment, 132, 57–69. 10.1016/j.buildenv.2018.01.018 [DOI] [Google Scholar]
- Togo F, Watanabe E, Park H, Shephard RJ, & Aoyagi Y (2005). Meteorology and the physical activity of the elderly: the Nakanojo Study. International Journal of Biometeorology, 50(2), 83–89. 10.1007/s00484-005-0277-z [DOI] [PubMed] [Google Scholar]
- Van Kamp I, & Davies H (2013). Noise and health in vulnerable groups: a review. Noise and health, 15(64), 153. [DOI] [PubMed] [Google Scholar]
- Wagner F, Basran J, & Dal Bello-Haas V (2012). A review of monitoring technology for use with older adults. Journal of geriatric physical therapy, 35(1), 28–34. [DOI] [PubMed] [Google Scholar]
- White-Newsome JL, Sánchez BN, Jolliet O, Zhang Z, Parker EA, Dvonch JT, & O’neill MS (2012). Climate change and health: indoor heat exposure in vulnerable populations. Environmental research, 112, 20–27. [DOI] [PMC free article] [PubMed] [Google Scholar]
- Xia L, Lan L, Tang J, Wan Y, Lin Y, & Wang Z (2020). Bed heating improves the sleep quality and health of the elderly who adapted to no heating in a cold environment. Energy and Buildings, 210, 109687. 10.1016/j.enbuild.2019.109687 [DOI] [Google Scholar]
- Xiong J, Lan L, Lian Z, & De dear R (2020). Associations of bedroom temperature and ventilation with sleep quality. Science and Technology for the Built Environment, 26(9), 1274–1284. 10.1080/23744731.2020.1756664 [DOI] [Google Scholar]
- Xiong J, Ma T, Lian Z, & de Dear R (2019). Perceptual and physiological responses of elderly subjects to moderate temperatures. Building and Environment, 156, 117–122. 10.1016/j.buildenv.2019.04.012 [DOI] [Google Scholar]
- Xu X, Lian Z, Shen J, Cao T, Zhu J, Lin X, . . . Zhang T. (2020). Experimental study on sleep quality affected by carbon dioxide concentration. Indoor air. [DOI] [PubMed] [Google Scholar]
- Yu J, Hassan MT, Bai Y, An N, & Tam VW (2020). A pilot study monitoring the thermal comfort of the elderly living in nursing homes in Hefei, China, using wireless sensor networks, site measurements and a survey. Indoor and Built Environment, 29(3), 449–464. [Google Scholar]
- Zhang H, Chen Y, Rui J, Yoshino H, Zhang J, Chen X, & Liu J (2019). Effects of thermal environment on elderly in urban and rural houses during heating season in a severe cold region of China. Energy and Buildings, 198, 61–74. 10.1016/j.enbuild.2019.05.059 [DOI] [Google Scholar]
- Zhang X, Luo G, Xie J, & Liu J (2021). Associations of bedroom air temperature and CO2 concentration with subjective perceptions and sleep quality during transition seasons [ 10.1111/ina.12809]. Indoor Air, 31(4), 1004–1017. 10.1111/ina.12809 [DOI] [PubMed] [Google Scholar]
- Zune M, Rodrigues L, & Gillott M (2020). The vulnerability of homes to overheating in Myanmar today and in the future: A heat index analysis of measured and simulated data. Energy and Buildings, 223, 110201. [Google Scholar]