Abstract
Interferons (IFNs) and retinoids are potent biological response modifiers. By using JAK-STAT pathways, IFNs regulate the expression of genes involved in antiviral, antitumor, and immunomodulatory actions. Retinoids exert their cell growth-regulatory effects via nuclear receptors, which also function as transcription factors. Although these ligands act through distinct mechanisms, several studies have shown that the combination of IFNs and retinoids synergistically inhibits cell growth. We have previously reported that IFN-β–all-trans-retinoic acid (RA) combination is a more potent growth suppressor of human tumor xenografts in vivo than either agent alone. Furthermore, the IFN-RA combination causes cell death in several tumor cell lines in vitro. However, the molecular basis for these growth-suppressive actions is unknown. It has been suggested that certain gene products, which mediate the antiviral actions of IFNs, are also responsible for the antitumor actions of the IFN-RA combination. However, we did not find a correlation between their activities and cell death. Therefore, we have used an antisense knockout approach to directly identify the gene products that mediate cell death and have isolated several genes associated with retinoid-IFN-induced mortality (GRIM). In this investigation, we characterized one of the GRIM cDNAs, GRIM-12. Sequence analysis suggests that the GRIM-12 product is identical to human thioredoxin reductase (TR). TR is posttranscriptionally induced by the IFN-RA combination in human breast carcinoma cells. Overexpression of GRIM-12 causes a small amount of cell death and further enhances the susceptibility of cells to IFN-RA-induced death. Dominant negative inhibitors directed against TR inhibit its cell death-inducing functions. Interference with TR enzymatic activity led to growth promotion in the presence of the IFN-RA combination. Thus, these studies identify a novel function for TR in cell growth regulation.
Interferons (IFNs) are a group of multifunctional cytokines that stimulate antiviral, antitumor, and immunoregulatory activities (28). Upon binding to their receptors, IFNs activate a rapid signaling cascade wherein Janus tyrosine kinases (JAKs) induce the tyrosine phosphorylation of signal-transducing activators of transcription (STAT) proteins (10). IFN-α/β activate the phosphorylation of STAT-1 and STAT-2, which then associate with a 48-kDa DNA binding protein (p48) to form a multimeric transcriptional complex. This complex translocates to the nucleus, binds to the IFN-stimulated response element, and stimulates transcription. Similarly, IFN-γ induces the specific tyrosine phosphorylation of STAT-1 alone, which binds as a dimer to GAS (the IFN-γ-activated site) and activates transcription (10). These transcriptional complexes induce a number of unique as well as common cellular genes whose activities may be related to their diverse actions (58). Although a great deal is known about the antiviral actions of IFNs (58), the mechanisms responsible for their antitumor and immunoregulatory actions are unclear. In vivo, they up regulate the expression of tumor-specific antigens and natural killer cell and T-cell functions to mediate their antitumor effects (28). In addition to these mechanisms, IFNs directly activate growth-suppressive proteins such as pRb (32, 48) and down regulate c-Myc in certain lymphoid tumor cell lines (47). However, genetic evidence for a tumor growth suppressor role exists only for certain members of the IFN gene-regulatory factor family. Gene mutations or dysregulation of IFN gene-regulatory factor 1 and IFN consensus sequence binding protein has been documented in human myeloid leukemias (25, 53, 64, 66). Since these molecules are IFN-regulated transcription factors, their activities are necessarily dependent on either the induction of growth- inhibitory gene products or the suppression of growth-promoting factors (64). However, the nature of these downstream factors is unknown. Some studies suggest that protein kinase R (PKR) and RNase L, which inhibit viral growth in IFN-treated cells (50, 59), also participate in growth suppression (3, 19). However, direct evidence for the role of these factors in the antitumor action of IFNs is lacking. Despite their strong therapeutic activity as single agents in a number of leukemias, IFNs are less effective in the therapy of solid tumors (18). To overcome such resistance, a number of therapeutic approaches have been developed. Among these, the combination of IFNs with retinoids is highly effective against several tumors (39). The molecular basis for the potentiated growth-suppressive action of the IFN-RA combination is unclear.
Retinoids are vitamin A derivatives that have strong influences on metabolism, cell growth and pattern formation (36). All-trans-retinoic acid (RA) and 9-cis-retinoic acid (9-cRA) are two major physiological retinoids that preferentially interact with specific nuclear receptors, which act as transcription factors (36). Ligand-activated heteromeric complexes of RA receptor, retinoid X receptor, and the associated coactivators up regulate the expression of genes (17) whose promoters contain retinoic acid response elements. Several isoforms and the corresponding subtypes of RA receptors and retinoid X receptors participate in a tissue and gene context-specific manner to induce gene expression (36). Retinoids suppress cell growth of certain primary skin dysplasias and tumor cell lines (26). However, the gene products that mediate these effects are unknown.
Clinical reports and studies with cultured tumor cells have shown that the IFN-RA combination is a more potent inhibitor of cell growth than is either agent alone (39). We have observed that the combination of human IFN-β with RA synergistically suppresses the growth of transplanted human breast and ovarian tumor xenografts in athymic nude mice (34). Here, we show that the IFN-RA combination causes cell death in vitro. To identify the genes responsible for cell death, we have used an antisense technical knockout approach (12). In this approach specific cell death-associated genes are identified by their ability to confer a growth advantage in the presence of death inducers when expressed in an antisense orientation. Using this method of cloning, we have identified several candidate genes that might participate in IFN-RA-activated cell death. In this study we have characterized one of these genes and identified it as human thioredoxin reductase (TR), an intracellular redox regulatory enzyme (16). We show that cellular TR levels are posttranscriptionally enhanced by the IFN-RA combination. Dominant negative mutants corresponding to the dimerization domain of TR interfere with death activation. Overexpression of one of the genes associated with retinoid-IFN-induced mortality (GRIM-12, whose product is identical to TR) enhances cellular susceptibility to IFN-RA-stimulated death. Thus, our studies attribute a novel function to TR in cell growth control.
MATERIALS AND METHODS
Reagents.
Restriction and DNA-modifying enzymes (New England Biolabs), azelaic acid (AZ), dithiothreitol, phenylmethylsulfonyl fluoride, Triton X, imidazole, RA, sodium selenite (Sigma), G418 sulfate, isopropyl-β-d-thiogalactopyranoside (IPTG; Life Technologies); Ni-chelation-Sepharose (Novagen), glutathione-Sepharose (Pharmacia Biotech), nitrocellulose membranes, enhanced chemiluminescence (ECL) reagents, and horseradish peroxidase coupled to anti-rabbit antibodies (Amersham), human IFN-βser (Berlex Inc.), human IFN-α2b (Hoffmann La Roche Inc.), human and murine IFN-γ (Boehringer Mannheim), murine IFN-β (Toray Industries), and hygromycin B (Boehringer Mannheim) were used in these studies. Monoclonal anti-eIF-2α (57), anti-PKR (33) and RNase L (13) were described previously. Antiactin antibodies were from Santa Cruz Biotechnology. Fresh stocks of RA were prepared in ethanol and added to cultures under subdued light.
Cell culture.
All estrogen-dependent cells were cultured in phenol-red free Eagle’s minimal essential medium supplemented with 5% charcoal-stripped fetal bovine serum (CSFBS) and 10−11 M estradiol during treatment with IFN-β and RA. The cells were grown in phenol red-free medium 24 h before treatments were initiated. All other cell lines were cultured in media with phenol red but supplemented with 5% CSFBS prior to treatment with IFN-β and RA.
Cell growth assays.
Cells (2,000 cells/well) were treated with various concentrations of IFN-β and RA in EMEM (Eagle’s minimal essential medium)–5% CSFBS in 96-well plates. Growth was monitored for 5 to 7 days by a colorimetric assay, which monitors cell numbers (60). Each treatment group contained six replicates. The cells were fixed with 10% trichloroacetic acid (TCA) and were stained with 0.4% sulforhodamine B (Sigma) in 1% acetic acid for 1 h at the end of the experiment. After the cells were washed, the bound dye was eluted from the cells with 100 μl of Tris-HCl (pH 10.5) and the absorbance was measured at 570 nm. One control plate was fixed with TCA 8 h after plating to determine the absorbance representing the starting cell number. The absorbance obtained with this plate was considered to represent 0% growth. The absorbance obtained with untreated cells was taken as 100% growth. When expressed as a percentage of the value for untreated controls, an increase in cell number falls on the positive scale and a decrease in cell number (death) appears on the negative scale. This method quantitates cell growth with an accuracy comparable to that of Coulter counting. To determine the cell cycle distribution, cells collected after various treatments were fixed and stained with propidium iodide as described previously (62). The samples were analyzed by flow cytometry (Becton-Dickinson).
Construction of the antisense expression library.
Total RNA from the BT-20 breast tumor cell line, treated with IFN-β (500 U/ml) plus RA (1 μM) for 0, 2, 4, 8, 16, 36, 48, and 72 h, was prepared with RNAZol B reagent (Tel-Test). These RNAs were pooled, and total poly(A)+ RNA was isolated with the polyAtract system (Promega). cDNA libraries were constructed with commercially available kits (Stratagene) as recommended by the manufacturer. A 10-μg portion of mRNA was used for preparing the cDNA library, with an oligo(dT) primer, in the presence of a deoxynucleoside triphosphate mixture that contained 5-methyl-dCTP. After second-strand synthesis, ends and gaps were filled with Pfu thermal DNA polymerase to ensure that the cDNA was blunt ended. The cDNAs were ligated to a synthetic double-stranded bifunctional linker, 5′-GCTTGGATCCAAGC-3′. When attached to the 3′ end of the cDNA, this linker generated a HindIII site. Ligation at the 5′ end created a BamHI site (37). The library was then digested with HindIII and BamHI, purified on a Sepharose 6B column, and inserted into an episomal vector, pTKO1, which carried markers for selection in eukaryotic (hygromycin resistance) and bacterial (ampicillin resistance) cells (12). When cloned into the BglII and HindIII sites of the pTKO1 episomal vector, the cDNA replaced the existing chloramphenicol acetyltransferase gene and the cDNA was expressed in an antisense orientation. The library was then transformed into Escherichia coli DH10B, which takes up large plasmids with methylated DNA, and was plated on several 150-mm-diameter plates. The bacteria were scraped from the plates, and plasmid DNA was extracted and purified on CsCl gradients. This unamplified library was used for transfection. After electroporation of the library (40 μg) into HeLa cells (107), the cells were distributed among several 150-mm plates. Drug selection was initiated with hygromycin B (200 μg/ml), human IFN-β (3,000 U/ml), and RA (5 μM) and continued for 4 weeks. Parallel plates transfected with pTKO1 were selected similarly. All these cells died after 10 to 12 days of selection. The medium was changed and fresh drugs were added daily for the first week and then every other day. At the end of 4 weeks of selection, the surviving colonies were pooled and expanded in the presence of hygromycin B (200 μg/ml), and Hirt DNA extracts were prepared (22). DNA was digested with DpnI and electroporated into E. coli DH10B. The resultant colonies were screened by PCR with plasmid-specific primers to detect the presence of inserts. Inserts were sequenced to identify the gene products.
Each individual episome was tested for cell protection against IFN-RA-induced death in several breast carcinoma cell lines. Individual episomes (20 μg) mixed with 30 μg of salmon sperm DNA were electroporated into cells (106) in Dulbecco’s minimal essential medium with 10% FBS and 5 mM N,N-bis(2-hydroxyethyl)-2-aminoethanesulfonic acid (BES). The electroporation conditions were 250 V, 900 μF, and 13 Ω in a BTX electroporator. Triple selection with IFN-β (500 U/ml), RA (1 μM), and hygromycin B (100 μg/ml) was initiated after 24 h. The cells were selected for 20 days with three drugs. After that, they were grown in medium containing hygromycin B alone. All cells that received only pTKO1 died by 10 to 12 days of triple selection.
Construction of dominant negative mutants.
Dominant negative mutants were constructed by PCR with the following primers. FAD (flavin adenine dinucleotide binding active domain) was generated with 5′-CCAAGCTTATGAACGGCCCTGAAGATC as the forward primer and 5′-CCGAATTCTCATAAGCATTCTCATAGACGAC-3′ as the reverse primer. NBD (NADPH binding domain) was prepared with 5′-CCAAGCTTATGCAATTTATTGGTCCTCACAG-3′ as the forward primer and 5′-CCGAATTCTCATGTCTTATAAACTTGATGCC-3′ as the reverse primer. The ID (interface domain) was generated by using 5′-CCAAGCTTATGGTGCCTTACATCTATGCC-3′ as the forward primer and 5′-CCGAATTCTCAGCAGCCAGCCTGGAG-3′ as the reverse primer. The respective start and stop codons are shown in boldface. PCR products were digested and cloned into the pCXN2 mammalian expression vector, in which the chicken actin promoter regulated the expression of mutants. It also carried a neomycin resistance marker for selection in mammalian cells. Stable transfectants were generated by electroporation of cells with indicated plasmids and selection with G418 (500 μg/ml). After 3 weeks of selection, surviving clones were expanded for further studies. Individual mutants were designated FAD, NBD, or ID. Expression of mutants was monitored by Northern blot analysis.
Overexpression of GRIM-12.
To study the effects of overexpression on cell growth, the GRIM-12 open reading frame (ORF), without the untranslated region (UTR) sequences, was subcloned into eukaryotic expression vector pCXN2. In addition, a Kozak consensus sequence was placed upstream of ATG codon for proper translation. The insert was checked for expression by in vitro transcription and translation before being cloned into pCXN2 (data not presented). Because of the removal of the UTRs, the transfected gene encodes a ∼1.4-kb mRNA which can be readily distinguished from the endogenous one by Northern blot analysis. The cells were stably transfected with comparable concentrations of pCXN2 and GRIM-12 expression vector separately. Multiple plates were included in the experiment and selected for G418 resistance. At the end of 4 weeks of selection, one set of plates was stained with Giemsa to count the number of colonies formed. In each case, drug-resistant clones growing in second set of parallel plates were pooled and used for Northern blot, enzyme, and growth analyses.
Northern blot analysis.
Total RNA (20 μg) was separated on 1% formaldehyde–agarose gels, transferred to a nylon membrane, and probed with the 32P-labeled PCR product of GRIM-12 cDNA. Prehybridization, hybridization, and washing was carried out under stringent conditions (27).
Western blot analysis.
Total protein was extracted by freeze-thaw method after various treatments. Total protein (10 μg) was separated on a 10% acrylamide gel and transferred to a polyvinylidene difluoride membrane (NEN). The membranes were incubated with a primary antibody raised against the peptide VVGFHVLGPNAGEVTQGFAA, derived from the native enzyme (16). After stringent washing, the membranes were incubated with anti-rabbit immunoglobulin G (IgG) antibody conjugated to horseradish peroxidase and developed with ECL reagents.
In vitro transcription and translation.
GRIM-12 was subcloned into pBluescript KS vector (Stratagene) under the control of the T7 promoter. Plasmid DNA (1 μg) was linearized with HindIII, and in vitro transcription was performed with the T7 RNA polymerase (Promega). The resultant RNA was programmed into nuclease-treated rabbit reticulocyte lysates (Promega) in the presence of [35S]methionine. Translation products were separated by sodium dodecyl sulfate-polyacrylamide gel electrophoresis (SDS-PAGE) (10% polyacrylamide), dried, and fluorographed.
Bacterial expression.
pET-32B (Novagen) and pGEX-2TK (Pharmacia Biotech) were used as cloning vectors. The GRIM-12 ORF was PCR amplified from the pTKO1-GRIM-12 cDNA clone with the forward primer 5′-CCAAGCTTATGAACGGCCCTGAAGATC-3′ and the reverse primer 5′-CCGAATTCTCAGCAGCCAGCCTGGAG-3′ (start and stop codons in boldface). These primers contained HindIII and EcoRI sites, respectively, for directional cloning. PCR was carried out for 10 cycles. The PCR product was treated with T4 DNA polymerase and digested with HindIII. It was subcloned into pET-32B at the HindIII and XhoI sites (the sites were blunt ended). ID was PCR amplified from pTKO1-GRIM-12 cDNA clone DNA with the forward primer 5′ CCAAGCTTATGGTGCCCTACATCTATGCC 3′ and the reverse primer 5′ CCGAATTCTCAGCAGCCAGCCTGGAG 3′. These oligonucleotides contained BamHI and EcoRI restriction sites, respectively, for subcloning the amplified inserts. The PCR product (535 bp) was digested with EcoRI and BamHI and subcloned into pGEX-2TK.
pET-32B-GRIM-12 and pGEX-2TK-ID were transformed into E. coli BL21DE3, and transformants were grown in 2YT medium (Life Technologies Inc.). A 2-liter culture was induced with IPTG (0.1 mM) at mid-log phase for 4 h at 37°C. The cells were harvested, washed with 200 ml of buffer (20 mM Tris-HCl [pH 7.9], 500 mM NaCl, 1 mM MgCl2, 1 mM CaCl2, 0.01% Triton X, 5 mM dithiothreitol) and suspended in 20 ml of buffer. They were sonicated, and the clarified supernatants were passed through Ni-chelation-Sepharose or glutathione-Sepharose 4B depending on the fusion tag as recommended by the manufacturer. After elution, the proteins were separated by SDS-PAGE (10% polyacrylamide) and subjected to silver staining.
Protein interaction studies.
Purified GRIM-12 and ID proteins were mixed and incubated for 15 min at 25°C and then for 15 min at 4°C in enzyme assay buffer. After incubation, the samples were passed through Ni-chelation-Sepharose or glutathione-Sepharose 4B columns, washed extensively with HEPES (pH 7.6) containing 50 mM NaCl, and eluted. The proteins were separated by SDS-PAGE (10% polyacrylamide). The gels were electroblotted onto a polyvinylidene difluoride membrane, probed with TR-specific antibody, and developed with ECL reagents to visualize the bands. Western blotting was chosen to discern any residual nonspecific interaction through the tags.
Enzymatic assay.
TR activity was determined as described previously (23). Cell extracts were prepared by freeze-thaw lysis after IFN-RA treatment. A 20-μg portion of extract was incubated with insulin, NADPH, and thioredoxin (Trx) in 0.2 M HEPES (pH 7.6) for 20 min at 37°C. The reactions were stopped with 6 M guanidinium hydrochloride–0.4 mg of dithiobis(2-nitrobenzoic acid) per ml in 0.2 M Tris (pH 8.0). The absorbance at 412 nm was measured. In each case, a corresponding control without Trx was used to determine the basal level of TR activity (due to endogenous Trx and NADPH). Absorbance values obtained from these controls were subtracted from those obtained with the reaction mixtures that contained Trx and NADPH. A control reaction without cell extracts but with all the reaction components was also used. Triplicate samples were measured for enzymatic activity. Pure TR was used as a positive control.
PKR and RNase L assays.
PKR activity was measured by eukaryotic protein synthesis initiation factor (eIF-2α) phosphorylation (51). Phosphorylation of eIF-2α was monitored by vertical slab isoelectric focusing followed by Western blotting with eIF-2α-specific antibodies. Cell lysates were also analyzed for the presence of PKR, eIF-2α, and actin by Western blotting with specific antibodies. RNase L activity was monitored by cross-linking equal amounts of cell extracts with 32P-labeled 2-5A (42) followed by SDS-PAGE (10% polyacrylamide) and autoradiography. Levels of RNase L protein were measured with a monoclonal antibody against human RNase L. The activity of these enzymes in tumor samples was determined as follows. Athymic nude mice bearing palpable human tumor xenografts (5 mm in diameter) were treated with the indicated agents for 8 weeks as described previously (34). Tumors from each treatment group were harvested and snap frozen in liquid nitrogen, and tumor protein extracts (50 μg) were assayed for enzymatic activity.
Nucleotide sequence accession number.
The GenBank accession number for the sequence of GRIM-12 is AF077367.
RESULTS
The IFN-α, IFN-β, and RA combination synergistically induces cell death in human breast carcinoma cells.
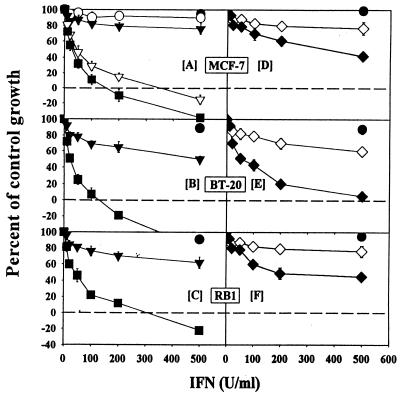
We have previously shown that the human IFN-β–RA combination was a stronger inhibitor of human tumor growth in athymic nude mice than either agent alone (34). Since the IFN-β used in that study was highly species specific and these mice lacked cytotoxic T cells, we hypothesized that growth suppression was largely due to a direct effect of the human IFN-β–RA combination on the tumor cells rather than an activated host immune system. To directly demonstrate that the IFN-RA combination was tumoricidal in vitro, we treated several breast carcinoma cell lines with various IFNs alone or in combination with RA and, after 1 week, measured cell growth with sulforhodamine B (60). Increasing doses of IFN-α or IFN-β alone did not cause significant growth inhibition in MCF-7 (an estrogen-responsive breast carcinoma cell line) in vitro (Fig. 1A). Similarly, RA (1 μM) alone did not significantly inhibit growth. Combination of various doses of IFN-α or IFN-β with RA caused dose-dependent growth inhibition. When combined with RA, IFN-α or IFN-β caused cell death at low doses (150 to 200 U/ml). Although both IFNs in association with RA were cytotoxic in vitro, in several experiments IFN-β was consistently a more potent inducer of cell death than was IFN-α. To determine whether cell death could be observed in estrogen-independent cells, we examined the effects of the IFN-RA combination in BT-20 cells (Fig. 1B). RA alone failed to inhibit BT-20 cell growth. Unlike MCF-7, BT-20 cell growth was inhibited by IFN-β. However, the combination of RA (1 μM) with IFN-β (100 U/ml) caused cell death. Similarly, murine IFN-β–RA induced death in RB1, a cell line derived from a polyomavirus-transformed murine breast tumor (Fig. 1C). Although the data in the figure depict partial cell death, all the cells were killed by the combination after 9 days in various experiments (data not shown; see Fig. 4). To examine whether RA also enhanced the cell growth-inhibitory actions of IFN-γ, similar growth assays were performed. IFN-γ alone did not inhibit growth, but cotreatment with RA enhanced its effect (Fig. 1D to F). Notably, the IFN-γ–RA combination did not cause cell death even at higher doses (500 U/ml). Thus, type I IFNs, when combined with RA, cause cytotoxicity in several tumor cell lines.
FIG. 1.
Cells were grown in the presence of various doses of IFNs and RA (1 μM) for 7 days. At the end of the experiment, the cells were fixed and stained with sulforhodamine B as described in Materials and Methods. The absorbance at 570 nm of bound dye was quantified and expressed as a percentage of untreated controls. Each datum point is the mean ± standard error (SE) of six replicates. Symbols: ○, IFN-α; ▿, RA plus IFN-α; ▾, IFN-β; ■, RA plus IFN-β; ◊, IFN-γ; ⧫, RA plus IFN-γ; •, RA. Human MCF-7 and BT-20 and murine RB1 breast carcinoma cells were treated with human and murine IFNs, respectively. Absorbance values for 0 and 100% growth in this assay, respectively, are as follows: MCF-7, 0.185 and 1.75; BT-20, 0.201 and 2.03; and RB1, 0.172 and 1.59. Values on the negative scale indicate death of initially plated cells.
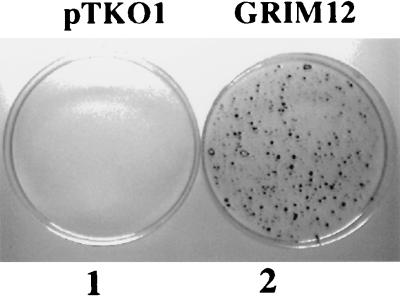
FIG. 4.
Protection of MCF-7 cells by antisense GRIM-12 episome. The cells were electroporated with the indicated episomes (20 μg) and selected for 4 weeks with IFN-β (500 U/ml), RA (1 μM), and hygromycin B (100 μg/ml). Surviving cells were fixed with TCA (10%) and stained with Giemsa.
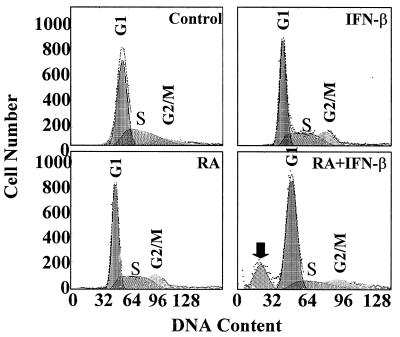
Microscopic examination of cells demonstrated a dose-dependent cytotoxic effect. Scanning electron microscopic analyses revealed a phenotype consistent with programmed cell death (data not presented). However, we did not observe classical internucleosomal fragmentation of genome in terminal deoxynucleotidyltransferase-mediated dUTP-biotin nick end labeling (TUNEL) assays (data not presented). To determine whether there was an arrest of cells in a given phase of cell cycle during induction of death, the cells were treated with various agents for 5 days, stained with propidium iodide, and analyzed by fluorescence-activated cell sorting. Untreated cells exhibited a normal cell cycle profile (Fig. 2A). Neither IFN-β nor RA caused cell cycle arrest, consistent with the cell growth assays. Interestingly, the IFN-β–RA combination also did not cause cell cycle arrest yet readily induced cell death (Fig. 2D). Although in qualitative terms the IFN-RA-treated cells appear to show some accumulation in G2/M, quantitative data from several experiments did not reveal a significant difference from other controls (data not presented). The hypodiploidy seen in Fig. 2D may represent the cell corpses containing randomly digested subnuclear components. Thus, cell death occurred independently of growth arrest.
FIG. 2.
MCF-7 cells were treated with RA (1 μM) or IFN-β (500 U/ml) or the combination for 5 days. The cells were fixed and stained with propidium iodide after RNase A treatment. Fluorescence-activated cell sorter and cell cycle analyses were performed. Dead cells are indicated by a solid arrow.
IFN-RA-mediated cell death does not involve known IFN-stimulated gene products.
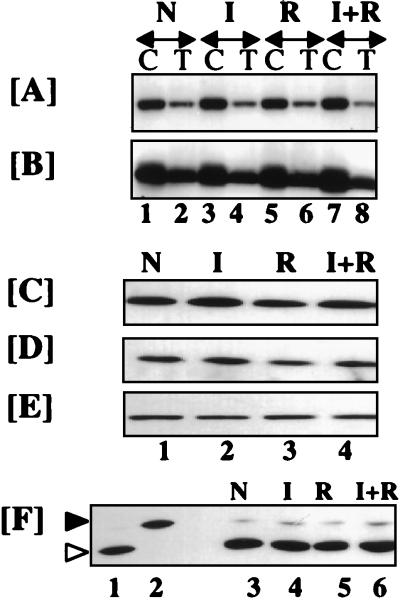
We next examined whether induction of cell death was due to an enhanced activity or expression of IFN-stimulated gene products known to cause growth arrest and apoptosis. Two gene products, PKR and RNase L, have been shown to cause growth inhibition in some cell types (3, 19). The cells were treated with various agents for 5 days, and the enzymatic activities of these proteins were analyzed. No increase in 2′,5′-oligoadenylate synthetase activity was noted after any of the treatments (data not shown). A downstream enzyme, RNase L, cleaves cellular RNAs after binding to 2′,5′-oligoadenylates (59). There was no change in the levels of RNase L or the 2′,5′-binding activity, an indirect measure of active enzyme (Fig. 3A and B). RNase L activity was measured in MCF-7 cells treated in vitro (lanes C) and also in tumor xenografts (lanes T) that regressed in vivo after IFN-RA therapy. In all cases, RNase L activity was not significantly different from that of untreated controls (lanes N). We also did not detect cleavage of rRNA, a characteristic of RNase L activation, in these cells (data not shown).
FIG. 3.
Activation of IFN-stimulated growth-inhibitory gene products does not occur during IFN-RA-induced cell death. (A) Binding of 32P-2,′5′-oligoadenylate to RNase L. (B) Western blot analysis of RNase L. Labels above the arrows: N, no treatment; I, IFN-β; R, RA; I+R, IFN-β plus RA. Labels below the arrows: C, cultured MCF-7; T, MCF-7 tumor xenograft in athymic nude mice. The following doses were used: in vitro, RA (1 μM) and IFN-β (500 U/ml) for 5 days; in vivo, RA (300 μg, oral) and IFN-β (106 U, subcutaneous) every day for 40 days. Cell or tumor extracts (70 μg) were assayed for various proteins. (C to E) Western blot analyses of MCF-7 lysates (50 μg) with specific antibodies: anti-PKR (C), anti-eIF-2α (D), and anti-actin (E). (F) PKR activity as measured by phosphorylation of eIF-2α. Lanes 1 and 2 represent PKR activity in the untreated and hemin- and double-stranded dsRNA-treated reticulocyte lysates (50 μg), respectively. Lanes 3 to 6 show PKR activity in MCF-7 lysates (50 μg) after treatment with various agents in vitro. After vertical slab gel isoelectric focusing, the gels were Western blotted and probed with anti-eIF-2α-specific antibodies. The positions of phosphorylated and unphosphorylated eIF-2α are indicated by solid and open arrowheads, respectively. The labels above panels C to F are as explained above for panel A.
Another IFN-induced enzyme, PKR, phosphorylates eIF-2α, leading to a cessation of polypeptide synthesis and cell growth arrest (50). There was no change in the levels of PKR and eIF-2α or the enzymatic activity of PKR in MCF-7 cells (Fig. 3C, D, and F). Phosphorylation of eIF-2α occurred in confluent NIH 3T3 cells but not in subconfluent ones (3, 50). However, phosphorylation of eIF-2α in MCF-7 cells treated either with IFN-β, RA, or the combination was not different from that of untreated cells (Fig. 3F, lanes 3 to 6). Similarly, no increase in the intratumoral PKR activity was observed following any treatment in MCF-7 tumors (data not shown). In addition, we did not detect an increase in p53 tumor suppressor or BAX (a promoter of cell death) or a decrease in Bcl2 (an inhibitor of death) under these conditions (data not shown).
Genetic approach to isolation of cell death genes.
Because no correlation could be found between the expression of known growth-regulatory genes and IFN-RA-induced cell death, we sought to identify the death-associated genes by using an antisense knockout approach (12). In principle, a death-associated gene can be isolated by antisense inactivation of the gene. In this method, cells are transfected with an antisense cDNA library derived from tumor cells cloned in an episomal expression vector. If this library contains death-mediating gene products, the corresponding antisense RNA will inhibit the expression of that endogenous gene. Consequently, only cell clones that express the death-related antisense mRNA will survive in the presence of the death inducer. Hirt DNA extracts from the surviving cell clones can be isolated and transformed into E. coli to rescue the inserts. The rescued episomes are retransfected individually into the breast tumor cells to identify the death-related products and eliminate false-positives isolated in the first round of transfection.
To isolate the death-associated genes, we prepared antisense cDNA libraries cloned in the episomal vector, pTKO1 (see Materials and Methods). An IFN-stimulated gene promoter drives the expression of antisense RNAs in this vector. This library (40 μg) was electroporated into HeLa cells (∼50% transfection efficiency) and selected for resistance to hygromycin B, human IFN-β, and RA as described in Materials and Methods. Hirt DNA extracts were prepared from surviving clones, digested with DpnI (to inactivate unreplicated input DNA), and transformed into E. coli DH10B by electroporation. A total of 24 individual episomes were rescued in the first round. Each purified episome was then individually transfected into MCF-7 and BT-20 breast carcinoma cell lines and examined for cell protection against IFN-RA-induced death. At the end of two rounds of screening, 14 episomes consistently conferred growth advantage to cells in the presence of IFN-RA (500 U/ml plus 1 μM). Partial sequence analyses revealed that several of these were novel genes (data not shown). We have named them GRIM (genes associated with retinoid-IFN-induced mortality). We chose one of these, GRIM-12, for further characterization, mainly because it contained the largest insert. GRIM-12 clearly protected MCF-7 cells against IFN-RA-induced death (Fig. 4). No surviving colonies were seen in the control plate transfected with pTKO1 vector alone. Thus, transfection of the GRIM-12 (in antisense orientation) episome conferred strong protection against IFN-RA-induced death.
Identification of GRIM-12 as human TR.
The GRIM-12 episome was completely sequenced on both strands. An ORF capable of encoding a 495-amino-acid polypeptide, and long 3′ and 5′ UTRs were present in this cDNA. The 5′ UTR in the clone we isolated is incomplete. The 3′ UTR is 1,896 bases long. The predicted molecular mass of the protein is 54.4 kDa. Figure 5 shows the deduced amino acid sequence of this cDNA. Sequence analysis revealed that this cDNA was identical to that of human TR (16), except for an arginine in place of serine at 156, an asparagine in place of glycine at 215, and an arginine in place of serine at 491. The active center of the enzyme appears to be formed by the cysteine residues at 57 and 62. Homology searches revealed that in addition to TR, it was identical to a protein described as “KM-102 bone marrow-derived reductase-like factor” (GenBank accession no. D88687) between residues 53 and 549 (38). However, the KM-102 reductase has an additional 52 amino acids that is unique to it. The deduced protein sequence also exhibited a close homology to a predicted glutathione reductase gene from Caenorhabitis elegans.
FIG. 5.
Amino acid sequence of GRIM-12. Cysteine residues of the active site (underlined) are shown in boldface.
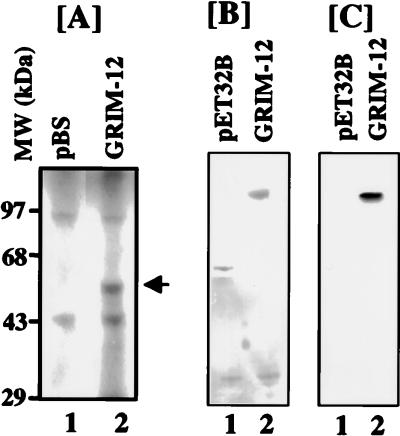
To examine whether the GRIM-12 cDNA contained an intact ORF, the insert was cloned into pBluescript under the control of T7 promoter. The cloned insert was transcribed and translated in vitro with rabbit reticulocyte lysates. GRIM-12 cDNA encoded a protein that migrates as a 58-kDa species on SDS-PAGE (10% polyacrylamide) (Fig. 6A). The ORF was also placed downstream of a histidine tag in pET32B vector and expressed in E. coli. The fusion protein was purified on Ni-chelation columns. A 78-kDa fusion protein was expressed (Fig. 6B). This protein contained 20 kDa of tag-derived sequences. Removal of tag sequences yielded a 58-kDa protein (data not shown). Thus, in both eukaryotic and bacterial expression systems, it encodes a polypeptide of 58 kDa, which was higher than the predicted 54.7 kDa. This difference could be due to posttranslational modifications. Indeed, sequence analyses suggested several phosphorylation sites. However, the contributions of these sites to the enzyme activity remain to be determined. Bacterially expressed fusion protein was analyzed in Western blots with rabbit polyclonal antibodies specific for human TR. These antibodies readily recognized the fusion protein but not the tag (Fig. 6B). Thus, GRIM-12 encoded TR.
FIG. 6.
Identification of GRIM-12 as human TR. (A) GRIM-12 cDNA cloned in pBluescript (pBS) vector was transcribed and translated in vitro by using rabbit reticulocyte lysate. The protein encoded by GRIM-12 is indicated by an arrow. (B) Expression of GRIM-12 in bacteria. Bacterial lysates were purified on a Ni-chelation-Sepharose column before SDS-PAGE and silver staining. (C) Western blot analysis of the protein samples shown in panel B, using a human TR-specific antibody.
Effect of the IFN-RA combination on the expression of GRIM-12.
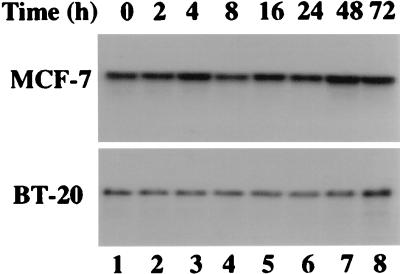
To study the effect of the IFN-RA combination on GRIM-12, we first examined whether its mRNA levels were inducible. Treatment of MCF-7 and BT-20 cells with the IFN-RA combination did not induce the mRNA significantly, although a marginal increase could be seen at 48 or 72 h (Fig. 7). Reprobing of these blots with a glyceraldehyde 3-phosphate dehydrogenase probe confirmed the presence of comparable amounts of RNA in all the lanes (data not shown). Thus, the IFN-RA combination does not regulate the transcription of GRIM-12.
FIG. 7.
Northern blot analysis of GRIM-12 with RNA (20 μg) derived from MCF-7 and BT-20 cells after treatment with the IFN-β (500 U/ml)-RA (1 μM) combination.
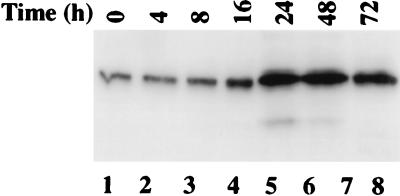
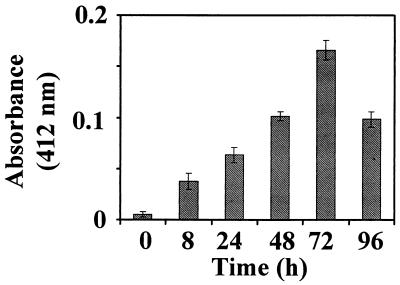
To examine whether the IFN-RA combination enhanced the expression of GRIM-12 protein, Western blot analysis was performed. The IFN-RA combination induced GRIM-12 protein in a time-dependent manner. There was no detectable induction until 8 h posttreatment. Between 8 and 72 h, the TR protein level increased progressively (Fig. 8). We next determined whether an increase in the TR protein level correlated with an increase in enzymatic activity. Insulin reduction assays were performed to measure TR activity by using cell extracts from IFN-RA-treated cells. Indeed, the enzymatic activity of TR increased progressively with the length of IFN-RA exposure of cells (Fig. 9). The decrease in the enzymatic activity at 92 h posttreatment may be due to extensive cell death at that particular point.
FIG. 8.
Western blot analysis of cell extracts (70 μg) prepared after IFN-β (500 U/ml)-RA (1 μM) treatment as in Fig. 7. The blots were probed with TR-specific antibody.
FIG. 9.
TR activity in IFN-RA-stimulated MCF-7 cell extracts. The cells were treated as described in the legend to Fig. 8. TR activity was determined with 20 μg of cell extract from each sample. Each bar represents the mean absorbance ± SE of triplicate measurements.
Antisense inhibition of TR expression by GRIM-12.
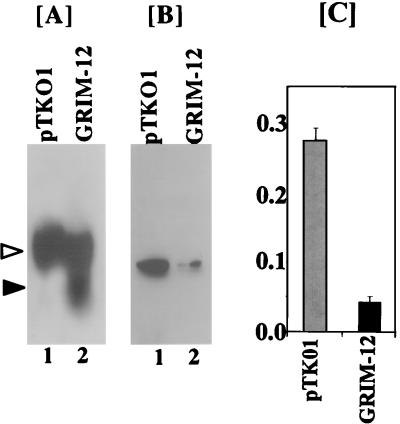
Since the above experiments indicated that an increase in the TR activity was responsible for death, we determined whether cell survival was due to a reduction of TR expression in the cells expressing the GRIM-12 episome. Because original antisense rescue was performed in HeLa cells, we used two stably selected pools of HeLa cells, one that expressed the pTKO1 vector alone and one that expressed the GRIM-12 antisense episome. Northern blot analysis revealed a strong expression of antisense mRNA only in the GRIM-12-transfected cells (Fig. 10A). To determine if antisense GRIM-12 caused a reduction in the level of TR protein, equal amounts of total cell lysates from these cells were subjected to Western blot analysis. Indeed, antisense expression of GRIM-12 mRNA accompanied a strong reduction in the level of TR protein (Fig. 10B). Using the same extracts, we also determined the enzyme activity. Cells expressing antisense GRIM-12 had a sevenfold lower TR activity compared those from the control cells (Fig. 10C). These data indicate that antisense expression of GRIM-12 in long-term culture can repress TR expression.
FIG. 10.
Antisense expression of GRIM-12 interferes with TR expression. HeLa cells transfected with the pTKO1 or GRIM-12 episome were stably selected with hygromycin B for 4 weeks as described in Materials and Methods. (A) Total RNA (40 μg) from each cell line was used for Northern blotting. The blots were probed with 32P-labeled GRIM-12. Solid and open arrowheads indicate the positions of antisense and sense GRIM-12 mRNAs, respectively. (B) Expression of TR protein in the antisense GRIM-12-transfected cells. Equal amounts of the cell extract (50 μg) from the indicated cells were analyzed by Western blotting. Note the differences in expression of TR protein between the two cell types. (C) TR activity of the cells used in panels A and B. Cell extracts (20 μg) were assayed for TR as described in the legend to Fig. 9. Each bar represents mean absorbance ± SE of triplicate determinations.
Overexpression of GRIM-12 mutants inhibits IFN-RA-induced cell death.
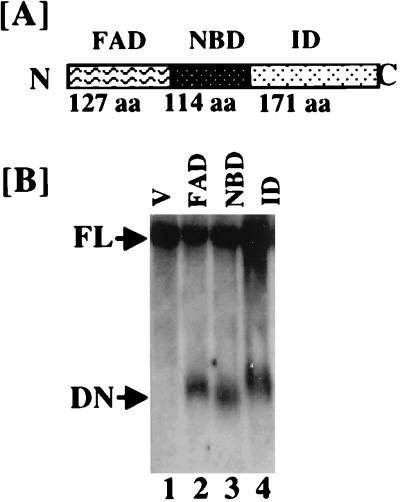
Since GRIM-12 (TR) was isolated as an activator of IFN-RA-stimulated cell death, we next examined whether overexpression of specific subdomains of TR in the cells would also ablate the death induction by the IFN-RA combination. Based on its relationships to other members of the glutathione reductase-TR family, a modular structure of GRIM-12 was predicted (16). An N-terminal FAD binding domain (FAD domain or active domain) and a central NADPH binding domain (NBD) and a C-terminal interface domain (ID) are the major functional modules of this enzyme (Fig. 11A). The FAD domain contains the cysteine residues essential for the reduction of its substrate, Trx. The NBD binds NADPH, an essential cofactor for redox enzymes. The interface domain is crucial for the generation of functional enzyme via dimerization.
FIG. 11.
Expression of various functional domains of GRIM-12 (TR) in MCF-7 cells. (A) Proposed functional domains of GRIM-12 protein and their approximate sizes. N and C indicate the amino and carboxyl termini, respectively, of the native protein. aa, amino acids. (B) Northern blot analysis of total RNA (40 μg) from various cell lines with the GRIM-12 probe. Labels above the panel indicate plasmids transfected into the cells. V, pCXN2 vector; FAD, FAD domain; NBD, NADPH binding domain; ID, interface domain; FL, full-length mRNA; DN, dominant negative mutants. The lanes contained comparable amounts of RNA as detected by the glyceraldehyde-3-phosphate dehydrogenase probe (data not shown).
To determine whether these domains acted as dominant inhibitors of endogenous GRIM-12 (TR), we created deletion mutants that contained only one domain by using region-specific oligonucleotides and PCR. These inserts were subcloned into an eukaryotic expression vector, pCXN2, which also carried a neomycin resistance gene for selection in mammalian cells. Recombinant vectors were then transfected into MCF-7 and BT-20 cells, and stable cell lines were established. Expression of the GRIM-12 mutants was ascertained by Northern blot analysis (Fig. 11B). Comparable amounts of mutant domains were present in the cell lines. As anticipated, expression of GRIM-12 mutants was not seen in cells that were transfected with vector alone. No differences in the growth rates of stable cell lines expressing various mutants were noted (data not presented).
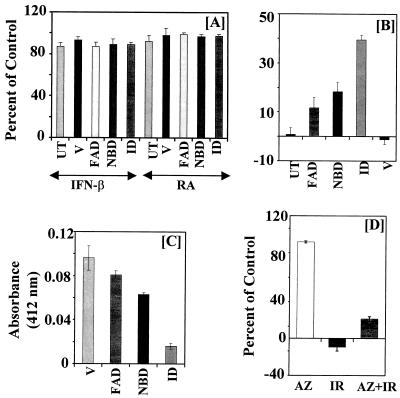
To test the effects of IFN, RA, and their combination, growth assays were performed with cell lines that expressed various domains of GRIM-12. Treatment with either IFN-β (500 U/ml) or RA (1 μM) alone did not cause significant growth inhibition in any cell line (Fig. 12A). These observations were consistent with the sensitivities of the parental cell line (Fig. 1). However, treatment with the IFN-RA combination induced cell death in untransfected cells and those that were transfected with vector alone. Expression of the FAD domain did not significantly inhibit the cell growth-suppressive effect of IFN-RA. The NADPH binding domain conferred slight protection against IFN-RA-induced cell death. However, the ID provided the strongest protection compared to other domains (Fig. 12B). Remarkably, the IFN-RA combination could inhibit ∼60% of cell growth even when the ID was overexpressed. This was not a clonal effect, because similar data were obtained for a pooled population of 100 clones (data not presented). Similar results were obtained with BT-20 cells (data not shown). These data confirmed the role of GRIM-12 as a mediator of cell death in response to IFN-RA treatment.
FIG. 12.
Effects of IFN-β (500 U/ml), RA (1 μM), and their combination on the growth of MCF-7 cells expressing various domains of GRIM-12. (A) Effects of the single agents on the cell growth described in the legend to Fig. 10. (B) Effects of the IFN-RA combination on cell growth. Growth assays were performed as described in the legend to Fig. 1. Each bar represents the mean ± SE of six replicate determinations in the same experiment. UT, untransfected cells. Other notations are explained in the legend to Fig. 11B. Mean absorbance values for 0 and 100% growth, respectively, in this experiment are as follows: UT, 0.195 and 1.83; V, 0.210 and 2.30; FAD, 0.18 and 0.185; NBD, 0.207 and 0.211; ID, 0.17 and 1.83. (C) TR activity of the cells shown in panel B. Each bar shows the mean ± SE of triplicate determinations. Cell extracts (25 μg) were assayed as described in Materials and Methods. (D) Effect of AZ on IFN-RA (IR)-induced cell death. MCF-7 cells were incubated with the indicated agents, and growth was measured after 6 days. Note the cell death in the IR column and its inhibition by AZ (10 μM). Mean absorbance values for 0 and 100% growth are 0.186 and 1.52, respectively.
We next examined whether ablation of IFN-RA-suppressed cell growth was due to a decrease in the enzymatic activity of TR in cells expressing the mutants. Insulin reduction assays were performed to detect these differences. Cells that expressed vector alone had the highest enzymatic activity (Fig. 12C). Cells expressing the FAD domain had a marginal loss of enzymatic activity. Cells with the NBD had intermediate inhibition of TR activity. Expression of ID caused the greatest reduction in enzymatic activity. Thus, ablation of enzymatic activity correlated well with loss of growth suppression by the IFN-RA combination (Fig. 12C).
Since IFN-RA-induced growth inhibition occurred in the cells expressing the ID mutant, it is possible that the mutant acts as an inefficient inhibitor due to a nonnative structure. Therefore, we examined the effect of AZ, a known chemical inhibitor of TR (52), on IFN-RA-induced cell death. As expected, IFN-RA caused cell death in MCF-7 cells. Although AZ itself was slightly inhibitory (7%) under the growth conditions used, it clearly abrogated IFN-RA-stimulated death in MCF-7 cells (Fig. 12D). Interestingly, IFN-RA caused significant growth inhibition (70%) even in the presence of AZ. Thus, genetic and chemical inhibition of TR ablates IFN-RA-induced cell death. Importantly, IFN-RA-induced growth-inhibitory actions continue to operate under both these conditions.
The ID associates with full-length TR in vitro.
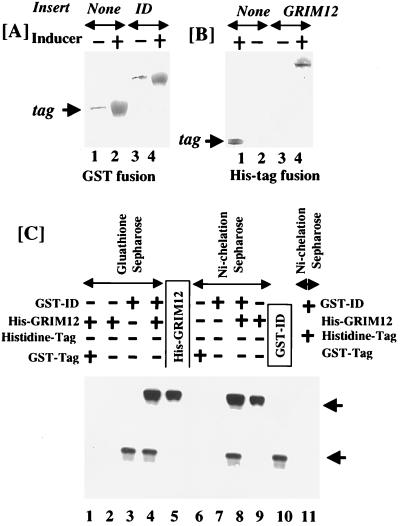
The above results suggested that the dominant negative effect of ID was probably due to its interaction with endogenous TR. To directly test whether ID interacted with the full-length protein, we expressed both these proteins separately in E. coli. Full-length GRIM-12 and ID were expressed as His-tag fusion and glutathione S-transferase (GST) fusion proteins, respectively. Purified proteins (Fig. 13A and B) were tested for interaction with each other on different matrices (Fig. 13C). These proteins were incubated in HEPES (pH 7.6) and then passed over either Ni-chelation-Sepharose (Fig. 13C, lanes 1 to 4) or glutathione-Sepharose (lanes 6 to 9). The Sepharose-bound material was washed extensively, eluted, and loaded on 10% polyacrylamide gels for SDS-PAGE. The GST tag and hexahistidine tag alone were used as negative controls to demonstrate the specificity of interaction. Ni-chelation-Sepharose and glutathione-Sepharose were used as additional negative controls. GST-ID (lane 3) and His-GRIM-12 (lane 9) bound to the glutathione-Sepharose and Ni-chelation-Sepharose, respectively (Fig. 13C). The two proteins interacted with each other when coincubated. Consequently, GST-ID was pulled down along with His-GRIM-12 by Ni-chelation-Sepharose (lane 8). Similarly, His-GRIM-12 was pulled down along with GST-ID by glutathione-Sepharose (lane 4). Neither Ni-chelation-Sepharose (lane 6) nor His tag alone (lane 11) interacted with GST-ID. Therefore, it was not pulled down along with them. Similarly, His-tag GRIM-12 did not interact with either glutathione-Sepharose (lane 2) or GST tag alone (lane 1). These data show that the mutant and wild-type proteins interact with each other in vitro in the absence of other proteins.
FIG. 13.
Binding of purified ID to GRIM-12 (TR) in vitro. ID and GRIM-12 were expressed as GST and histidine-tagged fusion proteins in E. coli. Pure proteins were obtained after two rounds of chromatography on glutathione-Sepharose or Ni-chelation-Sepharose columns. (A and B) Silver-stained SDS-PAGE gels (10% polyacrylamide) after purification of these proteins. Overexpression of fusion protein was performed by treating the cells with an inducer (IPTG). (C) Equimolar amounts of purified proteins were preincubated with each other before being subjected to chromatography on the indicated column. The presence or absence of the proteins in the incubation mixture is indicated by + and −, respectively. Affinity matrices used for separation after protein interaction are indicated above the arrows. After elution, the samples were loaded and separated by SDS-PAGE (10% polyacrylamide). Pure proteins (one-fifth of those in other lanes), without passing over the affinity matrices, were loaded in lanes 5 and 10. After separation, the samples were Western blotted with a TR-specific antibody. Western blotting was used to detect any nonspecific interactions between tags and fusion protein.
GRIM-12 specifically mediates IFN-RA-induced death.
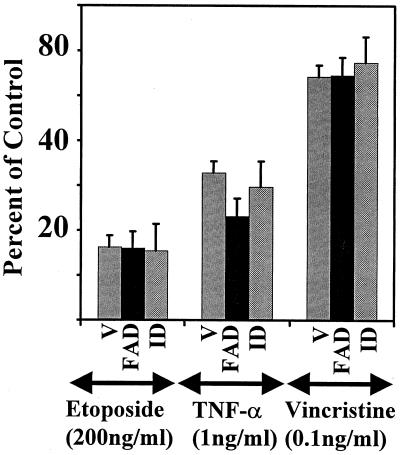
We next examined whether ID also blocked the growth-inhibitory effects of other cytotoxic agents. For this purpose, cell clones expressing vector alone, FAD, or ID were treated with tumor necrosis factor alpha (TNF-α), etoposide, or vincristine and monitored for growth inhibition (Fig. 14). The cells were treated with concentrations of these drugs near their 50% inhibitory concentration. Growth of cells transfected with vector alone was strongly inhibited by all three agents. Overexpression of either the FAD or ID domain did not confer a growth advantage in the presence of these agents. Therefore, TNF-α, etoposide, and vincristine did not require GRIM-12 for inhibiting cell growth. These data suggest a specific participation of GRIM-12 in the IFN-RA-induced cell death pathway.
FIG. 14.
Effects of other growth inhibitors on cells expressing various domains of GRIM-12. Cells were challenged with doses of etoposide, TNF-α, and vincristine near their IC50, and growth assays were performed as in Fig. 1. Mean absorbance values for 0 and 100% growth, respectively, in this experiment are as follows: V, 0.19 and 2.15; FAD, 0.175 and 1.90; ID, 0.22 and 2.31. Other notations are explained in the legend to Fig. 12.
Effect of GRIM-12 overexpression on cell growth.
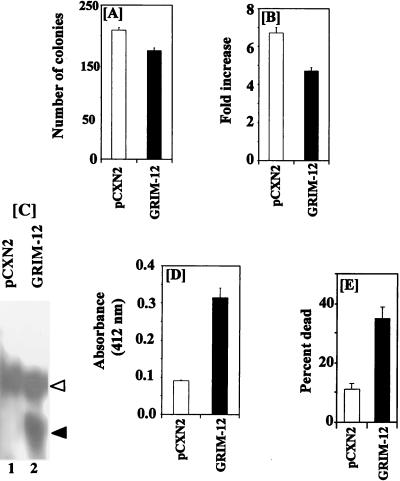
Since the above experiments indicated that interference with TR expression and function prevents IFN-RA-induced cell death, we examined the effect of GRIM-12 overexpression on cell growth. GRIM-12 ORF cloned in pCXN2 vector was electroporated into MCF-7 cells, and G418-resistant clones were selected. A parallel control with the expression vector alone was also included. Multiple plates were used in the experiment. One set was stained with Giemsa to determine the colony number. Other plates were used to determine cell growth, mRNA expression, and enzyme assay. Although drug-resistant colonies formed in both cases, significantly fewer colonies formed in the case of GRIM-12-transfected cells (Fig. 15A). This result suggested that cells expressing the highest level of GRIM-12 died during selection. The surviving drug-resistant colonies from pCXN2 (n = 1,000)- and GRIM-12 (n = 750)-transfected plates were pooled separately, and their growth was monitored by the sulforhodamine B assay (60). The GRIM-12-transfected cells grew significantly slower than those transfected with the vector alone (Fig. 15B). To determine the expression of transfected gene, Northern blot analyses were performed with the RNAs derived from pCXN2- and GRIM-12-transfected cells. A 1.4-kb mRNA was seen only (Fig. 15C, solid arrowhead) in the GRIM-12-transfected cells. A larger species of endogenous mRNA was also seen in pCXN2- and GRIM-12-transfected cells (open arrowhead). Enzyme assays revealed approximately 3.5-fold more enzyme activity in GRIM-12-transfected cells than in those that expressed the vector alone (Fig. 15D). We next examined whether GRIM-12-transfected cells were more sensitive to IFN-RA-induced cell death. Indeed, IFN-RA caused significantly higher cell death in GRIM-12-expressing cells than in those expressing the vector (Fig. 15E).
FIG. 15.
Effect of GRIM-12 overexpression on cell growth. MCF-7 cells were transfected with comparable amounts of pCXN2 or GRIM-12 cloned in pCXN2 vector. The cells were selected for 4 weeks with G418. (A) One set of plates was stained with Giemsa to determine the number of colonies formed. The other was used for the experiments in panels B to E. (B) Growth of different cell types. Cell growth was compared after 6 days of growth by using the sulforhodamine B assay. Each bar represents the fold increase in cell number ± SEM of six samples. (C) Northern blot analysis of GRIM-12 mRNA expression. Open and solid arrowheads indicate the positions of the endogenous and transfected GRIM-12, respectively. (D) TR activity in the cells used in panels B and C. Mean absorbance values ± SE of triplicate determinations are shown. (E) Effect of IFN-RA. Equal numbers of indicated cells were exposed to IFN-RA (500 U/ml and 1 μM) for 6 days. The growth assay was performed as described in the legend to Fig. 1. The percentage of dead cells corresponding to each untreated control was monitored. Each bar represents the mean ± SE of six samples. Mean absorbance values for 0 and 100% growth, respectively, for panels B and E are as follows: pCXN2, 0.21 and 1.407; GRIM-12, 0.23 and 1.08.
DISCUSSION
Although IFNs robustly suppress the growth of several leukemias, they are less effective against solid tumors like breast tumors and melanomas (18, 28). Our studies show that combination of IFN-α/β with RA, but not the single agents, causes cell death in vitro. At a comparable dosage, only IFN-α/β but not IFN-γ causes cell death in the presence of RA (Fig. 1), suggesting that these two cytokines use different mechanisms to exert antitumor actions. Since cell death induction by the IFN-RA combination is independent of cycle arrest (Fig. 2), it appears that different gene products regulate growth arrest and death activities. Interestingly, IFN-RA-induced death does not involve classic internucleosomal fragmentation of the genome, a hallmark of apoptosis (data not shown). A number of studies, including those with IFN-γ, have shown that internucleosomal DNA fragmentation is not obligatory for programmed cell death to occur (9, 11, 55, 56, 65). Taken together, these observations suggest that death regulation by IFNs involves hitherto undefined pathways.
Indeed, examination of two IFN-stimulated pathways that cause growth arrest or apoptosis (50, 59) indicated no significant changes in the levels and activities of PKR and RNase L during IFN-RA-induced cell death. In both cultured cells and regressing tumors, RNase L and PKR activities did not correlate with growth suppression (Fig. 3). No changes in the phosphorylation status of pRb or the levels of p53, Bcl2, or Bax occurred during death (data not presented). Consistent with these observations, IFNs induce cell death independently of p53 in several cell lines (11, 43). Recently, IFN-γ has been shown to induce interleukin-1β-converting enzyme gene expression in HeLa cells that undergo apoptosis (7), indicating that caspases may be crucial for IFN-γ-induced cell death. Indeed, STAT1 is required for basal expression of certain caspases (31). However, IFN-γ alone or in combination with RA did not cause cytotoxicity in the cell lines used in this study (Fig. 1). Even though IFNs failed to induce the death of the human breast carcinoma cells used in our study, TNF-α did so rapidly (data not shown). Since TNF-α induces cell death by using caspases (5, 41), activation of caspases appears to be normal in these cells. Strikingly, a longer exposure to the IFN-RA combination (3 to 4 days) than to TNF-α (6 to 8 h) is required for death induction. Therefore, IFN-β–RA-induced cell death may differ from the known pathways and utilize some undefined gene products.
To identify the functionally relevant death-associated gene products, we used the antisense technical knockout strategy (12). In this approach, specific GRIM are inactivated by antisense gene products, thus providing a growth advantage to transfected cells in the presence of the IFN-RA combination. The library used in the present study was generated with the RNAs isolated from untreated cells as well as those treated with the IFN-RA combination. Thus, genes expressed at all stages of the cell death process were included in the library without a bias for those expressed only after treatment. Because an IFN-stimulated promoter drives the expression of the antisense inserts, a functional JAK-STAT pathway is required (12). Therefore, antisense RNAs directed against the genes encoding IFN receptor chains, JAKs, or STATs cannot account for cell survival in the presence of IFN-RA. In fact, cDNAs corresponding to these products have not been rescued in our studies or in other studies (11). Consistent with the possibility that multiple gene products participate in IFN-RA-induced cell death, we have rescued at least 14 different cDNAs by this approach (data not shown). GRIM-12, the cDNA characterized in this study, protected cells from IFN-RA-induced death when expressed in antisense orientation (Fig. 4 and data not shown). Sequence analysis of this cDNA revealed that it was identical to the gene encoding human TR (16). The transcription of GRIM-12 mRNA was not induced in these cells by IFN-RA treatment. However, its expression was enhanced at a posttranscriptional level. The up regulation of the GRIM-12 protein level corresponded to an increase in its enzymatic activity, which also reached its maximum during cell death. Thus, there appears to be a direct correlation between enzymatic activity and cell death. The relationship between inhibition of TR gene expression by antisense knockout and cell survival in long-term culture was established by the expression of antisense mRNA, suppression of TR expression (protein), and corresponding loss of enzyme activity in the cells that expressed antisense GRIM-12 (Fig. 10).
The observation that antisense mRNA conferred death resistance by ablating TR expression was further confirmed by using dominant negative inhibitors derived from GRIM-12 cDNA (Fig. 12B). Expression of the FAD domain (active site) alone did not confer significant resistance to IFN-RA-induced death. However, expression of the NBD and ID imparted resistance, with the latter conferring the greatest degree of resistance against IFN-RA-induced death. NBD may interfere with optimal activities of other death-associated redox enzymes by sequestering NADPH. Since the ID of TR is required to generate a functional dimeric enzyme, its overexpression may strongly inhibit enzyme activity and also cell death. The FAD domain does not significantly interfere with cell death because it may not inhibit enzymatic activity strongly. The differential sensitivity of transfectants to cell death was not due to a difference in the levels of endogenous TR and mutant domains of GRIM-12 (Fig. 11). Due to a lack of a specific antibody that detects all these mutants, we were unable to demonstrate the expression of the mutant proteins. However, enzyme assays revealed that overexpression of ID strongly interfered with enzymatic activity. They also suggest that inhibition of enzymatic activity is required for interference with death induction. It is likely that ID inhibits the activity by binding to the full-length enzyme, although the exact in vivo conformation of the mutant ID molecule is uncertain. Interaction of purified ID with full-length TR in vitro (Fig. 13) provides support for this hypothesis. The interaction between these proteins is not mediated by their respective expression tags, because tags alone do not bind to full-length TR or ID (Fig. 13C). More importantly, a direct role for TR in IFN-RA-mediated cell death was supported by several observations (Fig. 15). (i) Overexpression of GRIM-12 per se resulted in the formation of fewer colonies compared to control vector alone (13% less than the control value; i.e., cells expressing the highest level of GRIM-12 probably died during the isolation of stable cell lines). (ii) The clones that survived and expressed TR grew relatively slowly. (iii) Cell death was augmented by IFN-RA in GRIM-12-expressing cells compared to those expressing vector alone. (iv) A known activator (selenite) and an inhibitor (AZ) of TR activity augmented and suppressed IFN-RA induced cell death, respectively. The failure of ID to interfere with the growth-inhibitory actions of TNF-α, vincristine, and etoposide suggests a specific role for GRIM-12 (TR) in IFN-RA-inducible cell death (Fig. 14).
In mammalian cells, glutathione reductase and TR reduce their respective substrates, glutathione and Trx, to maintain the intracellular redox state. They then transfer electrons to several cellular transcription factors, including those involved in DNA synthesis. The TR-Trx system is highly conserved from E. coli to mammals. Trx, an ∼11-kDa protein, has the conserved sequence Trp-Cys-Gly-Pro-Cys-Lys. Based on the ability of exogenous and transfected Trx to stimulate cell growth, it has been proposed that the TR-Trx system acts as a growth promoter (15). Trx is also known as adult T-cell-derived leukemic growth factor, because it has been isolated as a stimulant of leukemic cell growth (63). In contrast, results presented in this study and those of others (12) indicate that TR and Trx are growth inhibitors. Although Trx prevents apoptosis in murine WEHI cells (2), it inhibited the growth of certain hepatoma cells (49). These conflicting observations raise the question of how a growth-promoting molecule participates in cell death. A major difference between our studies and others is the presence of selection pressure exerted by cytotoxic agents. Thus, in the absence of growth inhibitors, TR-Trx may participate in normal cell growth processes. However, in the presence of inhibitory pressure (e.g., from IFNs or IFN-RA), the TR-Trx system may activate factors that culminate in cell death. Furthermore, studies with overexpressed Trx might represent a supraphysiological condition, wherein Trx activates only progrowth pathways. Unlike such studies, our studies and those of Deiss and Kimchi (12) lowered the physiological TR or Trx level to provide a growth advantage. That said, TR might also use substrates other than Trx for inducing death. Indeed, mammalian TR also reduces compounds like selenite, alloxan, vitamin K and 5,5′-dithiobis(2-nitrobenzoic acid) in vitro (4, 23, 24). Selenite has been shown to inhibit cell growth, and dietary selinium has been shown to reduce the incidence of tumors (61). Indeed, the addition of selenite to growth media augmented the IFN-RA-induced cell death compared to that in control cultures. Furthermore, selenite as a single agent also caused some growth inhibition compared to that in untreated cells in the present studies (data not shown). Based on these observations, we suggest that TR-Trx acts as a “yin-yang” regulatory system in growth control (20). In an analogous manner, depending on the physiologic status of the cell, the proto-oncogene myc can act as a growth promoter or as a mediator of cell death (21, 44). Irrespective of which mechanism is operative, our studies assign a novel function to TR in IFN-RA-induced death pathways.
Since IFN-α/β and IFN-γ use shared signal transducers (10) to regulate cellular functions, they may also use certain common pathways to inhibit cell growth. Thus, GRIM-12 (TR) and Trx (12) may represent converging points of the death pathway used by these closely related yet functionally distinct cytokines. More importantly, the choice of target (TR or Trx) activated during death induction appears to be influenced by the coactivating ligand. In our study, cell death was induced by a combination of IFN-β and RA, whereas in the earlier study it was IFN-γ alone (12). Despite these close similarities, other GRIMs are not identical to DAP (death-associated protein) genes induced by IFN-γ for killing the cells (30). Although IFN-α/β and IFN-γ use overlapping signal transduction pathways and induce similar downstream genes, each of them also induces unique cellular genes. Consequently, they may also induce different death programs. Thus, the cell growth-inhibitory actions of IFN-α/β and IFN-γ may not be identical.
The roles of oxidoreductases in growth control are less well appreciated, largely because they modify cellular substrates with groups that have a relatively short half-life (46). Unlike protein kinases, these enzymes do not add stable prosthetic groups to their substrates, thus making it difficult to assess their specific roles in growth or death processes. Although the downstream molecular events that mediate TR-Trx-induced growth inhibition or cell death are still unclear, genetic studies by ourselves and others illustrate novel mechanisms of cell death involving oxidoreductases. One level at which Trx may influence the IFN-induced inhibitory growth pathways is via modulation of JAK function. Recent studies have shown that the redox status of JAKs is essential for their activity (14). The reduced state promotes JAK activity, and the oxidized state inhibits it. Expression of the TR dominant negative inhibitors may alter the redox state of JAKs and therefore confer resistance to IFN-RA treatment. Similarly, suppression of Trx levels may ablate growth-inhibitory effects of IFN-γ (12). Interference with JAK function may inhibit the ability of IFNs to induce growth-regulatory genes such as interleukin-1β-converting enzyme or WAF/Cip1 (7, 8) and therefore may enhance cell survival. Oxidative conditions activate NF-κB, which induces the anti-apoptotic gene products (1). Indeed, treatment of cells with Trx inhibits the DNA binding of NF-κB and cotransfection of Trx gene suppresses NF-κB-dependent gene expression (29, 54). Dominant negative inhibition of TR function may also activate the NF-κB-dependent cell survival program. Therefore, these cells may become resistant to IFN-RA. Future studies should resolve these questions.
Lastly, a formal link exists between TR and p53 tumor suppressor activity. For example, human p53 normally induces gene expression and growth inhibition in Schizosaccharomyces pombe but fails to exert these effects in mutants lacking TR (6). Consistent with a role for TR-Trx in growth control, deletion of Trx genes in yeast leads to an increase in the mitotic cycle and DNA replication rates (40). TR also inhibited gene induction from MluI cell cycle (MCB) boxes present in the promoters of genes that regulate yeast cell growth (35). More importantly, a number of p53-induced cell death gene products are oxidoreductases (45). These observations underscore the importance of redox factors in cell growth inhibition and death. Finally, despite the abrogation of cell death by ID mutant of TR, ∼60% of the IFN-RA-induced growth inhibition still occurred. One explanation of this observation is that ID of GRIM-12 may be an inefficient repressor of IFN-RA-induced growth inhibition. Consequently, near 100% growth did not occur in these cells. If that were the situation, a strong inhibitor of TR should completely inhibit IFN-RA-induced growth-suppressive actions. Although AZ, a known inhibitor of TR (52), prevented IFN-RA-induced cell death, it failed to counteract the growth-inhibitory effects completely. Thus, a genetic and a chemical inhibitor of TR both block the IFN-RA-induced death pathway. The fact that the IFN-RA combination continues to inhibit cell growth despite TR inhibition suggests the induction of other GRIM-12 (TR)-independent cell growth-suppressive pathways. Since overexpression of GRIM-12 alone does not kill a majority of transfected cells, ligand-induced posttranslational modifications and expression of other IFN-RA-induced death regulators are necessary for death to occur, in addition to an increase in TR levels. Indeed, isolation of other GRIMs supports this hypothesis.
ACKNOWLEDGMENTS
We thank Ernest Borden, Eric Angell, and Wang Ling for helpful suggestions, and we thank Adi Kimchi and Garth Powis for providing pTKO1 and the TR-specific antibody, respectively.
These studies were supported by grants from the National Cancer Institute to D.V.K. E.R.H. thanks the US-Army Breast Cancer Program for a graduate fellowship. D.J.L. is a fellow of Karl C. Dod foundation.
E.R.H. and M.B. contributed equally to this study.
REFERENCES
- 1.Baichwal V R, Baeuerle P A. Activate NF-kappa B or die? Curr Biol. 1997;7:R94–R96. doi: 10.1016/s0960-9822(06)00046-7. [DOI] [PubMed] [Google Scholar]
- 2.Baker A, Payne C M, Briehl M M, Powis G. Thioredoxin, a gene found overexpressed in human cancer, inhibits apoptosis in vitro and in vivo. Cancer Res. 1997;57:5162–5167. [PubMed] [Google Scholar]
- 3.Barber G N, Wambach M, Thompson S, Jagus R, Katze M G. Mutants of the RNA-dependent protein kinase (PKR) lacking double-stranded RNA binding domain I can act as transdominant inhibitors and induce malignant transformation. Mol Cell Biol. 1995;15:3138–3146. doi: 10.1128/mcb.15.6.3138. [DOI] [PMC free article] [PubMed] [Google Scholar]
- 4.Bjornstedt M, Kumar S, Holmgren A. Selenite and selenodiglutathione: reactions with thioredoxin systems. Methods Enzymol. 1995;252:209–219. doi: 10.1016/0076-6879(95)52024-4. [DOI] [PubMed] [Google Scholar]
- 5.Boldin M P, Goncharov T M, Goltsev Y V, Wallach D. Involvement of MACH, a novel MORT1/FADD-interacting protease, in Fas/APO-1- and TNF receptor-induced cell death. Cell. 1996;85:803–815. doi: 10.1016/s0092-8674(00)81265-9. [DOI] [PubMed] [Google Scholar]
- 6.Casso D, Beach D. A mutation in a thioredoxin reductase homolog suppresses p53-induced growth inhibition in the fission yeast Schizosaccharomyces pombe. Mol Gen Genet. 1996;252:518–529. doi: 10.1007/BF02172398. [DOI] [PubMed] [Google Scholar]
- 7.Chin Y E, Kitagawa M, Kuida K, Flavell R A, Fu X Y. Activation of the STAT signaling pathway can cause expression of caspase 1 and apoptosis. Mol Cell Biol. 1997;17:5328–5337. doi: 10.1128/mcb.17.9.5328. [DOI] [PMC free article] [PubMed] [Google Scholar]
- 8.Chin Y E, Kitagawa M, Su W C, You Z H, Iwamoto Y, Fu X Y. Cell growth arrest and induction of cyclin-dependent kinase inhibitor p21 WAF1/CIP1 mediated by STAT1. Science. 1996;272:719–722. doi: 10.1126/science.272.5262.719. [DOI] [PubMed] [Google Scholar]
- 9.Cohen G M, Sun X M, Snowden R T, Dinsdale D, Skilleter D N. Key morphological features of apoptosis may occur in the absence of internucleosomal DNA fragmentation. Biochem J. 1992;286:331–334. doi: 10.1042/bj2860331. [DOI] [PMC free article] [PubMed] [Google Scholar]
- 10.Darnell J E, Jr, Kerr I M, Stark G R. Jak-STAT pathways and transcriptional activation in response to IFNs and other extracellular signaling proteins. Science. 1994;264:1415–1421. doi: 10.1126/science.8197455. [DOI] [PubMed] [Google Scholar]
- 11.Deiss L P, Feinstein E, Berissi H, Cohen O, Kimchi A. Identification of a novel serine/threonine kinase and a novel 15-kD protein as potential mediators of the gamma interferon-induced cell death. Genes Dev. 1995;9:15–30. doi: 10.1101/gad.9.1.15. [DOI] [PubMed] [Google Scholar]
- 12.Deiss L P, Kimchi A. A genetic tool used to identify thioredoxin as a mediator of a growth inhibitory signal. Science. 1991;252:117–120. doi: 10.1126/science.1901424. [DOI] [PubMed] [Google Scholar]
- 13.Dong B, Silverman R H. 2-5A-dependent RNase molecules dimerize during activation by 2-5A. J Biol Chem. 1995;270:4133–4137. doi: 10.1074/jbc.270.8.4133. [DOI] [PubMed] [Google Scholar]
- 14.Duhe R J, Evans G A, Erwin R A, Kirken R A, Cox G W, Farrar W L. Nitric oxide and thiol redox regulation of Janus kinase activity. Proc Natl Acad Sci USA. 1998;95:126–131. doi: 10.1073/pnas.95.1.126. [DOI] [PMC free article] [PubMed] [Google Scholar]
- 15.Gallegos A, Gasdaska J R, Taylor C W, Paine-Murrieta G D, Goodman D, Gasdaska P Y, Berggren M, Briehl M M, Powis G. Transfection with human thioredoxin increases cell proliferation and a dominant-negative mutant thioredoxin reverses the transformed phenotype of human breast cancer cells. Cancer Res. 1996;56:5765–5770. [PubMed] [Google Scholar]
- 16.Gasdaska P Y, Gasdaska J R, Cochran S, Powis G. Cloning and sequencing of a human thioredoxin reductase. FEBS Lett. 1995;373:5–9. doi: 10.1016/0014-5793(95)01003-w. [DOI] [PubMed] [Google Scholar]
- 17.Glass C K, Rose D W, Rosenfeld M G. Nuclear receptor coactivators. Curr Opin Cell Biol. 1997;9:222–232. doi: 10.1016/s0955-0674(97)80066-x. [DOI] [PubMed] [Google Scholar]
- 18.Gutterman J U. Cytokine therapeutics: lessons from interferon a. Proc Natl Acad Sci USA. 1994;91:1198–1205. doi: 10.1073/pnas.91.4.1198. [DOI] [PMC free article] [PubMed] [Google Scholar]
- 19.Hassel B A, Zhou A, Sotomayor C, Maran A, Silverman R H. A dominant negative mutant of 2-5A-dependent RNase suppresses antiproliferative and antiviral effects of interferon. EMBO J. 1993;12:3297–3304. doi: 10.1002/j.1460-2075.1993.tb05999.x. [DOI] [PMC free article] [PubMed] [Google Scholar]
- 20.Heppell-Parton A, Cahn A, Bench A, Lowe N, Lehrach H, Zehetner G, Rabbitts P. Thioredoxin, a mediator of growth inhibition, maps to 9q31. Genomics. 1995;26:379–381. doi: 10.1016/0888-7543(95)80223-9. [DOI] [PubMed] [Google Scholar]
- 21.Hermeking H, Eick D. Mediation of c-Myc-induced apoptosis by p53. Science. 1994;265:2091–2093. doi: 10.1126/science.8091232. [DOI] [PubMed] [Google Scholar]
- 22.Hirt B. Selective extraction of polyoma DNA from infected mouse cell cultures. J Mol Biol. 1967;26:365–369. doi: 10.1016/0022-2836(67)90307-5. [DOI] [PubMed] [Google Scholar]
- 23.Holmgren A, Bjornstedt M. Thioredoxin and thioredoxin reductase. Methods Enzymol. 1995;252:199–208. doi: 10.1016/0076-6879(95)52023-6. [DOI] [PubMed] [Google Scholar]
- 24.Holmgren A, Lyckeborg C. Enzymatic reduction of alloxan by thioredoxin and NADPH-thioredoxin reductase. Proc Natl Acad Sci USA. 1980;77:5149–5152. doi: 10.1073/pnas.77.9.5149. [DOI] [PMC free article] [PubMed] [Google Scholar]
- 25.Holtschke T, Lohler J, Kanno Y, Fehr T, Giese N, Rosenbauer F, Lou J, Knobeloch K P, Gabriele L, Waring J, Bachmann M F, Zinkernagel R M, Morse H C, Ozato K, Horak I. Immunodeficiency and chronic myelogenous leukemia-like syndrome in mice with a targeted mutation of the ICSBP gene. Cell. 1996;87:307–317. doi: 10.1016/s0092-8674(00)81348-3. [DOI] [PubMed] [Google Scholar]
- 26.Hong W K, Itri L M. Retinoids and human cancer. In: Sporn M B, Roberts A B, Goodman D S, editors. The retinoids: biology, chemistry and medicine. 2nd ed. New York, N.Y: Raven Press; 1994. pp. 597–630. [Google Scholar]
- 27.Kalvakolanu D V, Bandyopadhyay S K, Harter M L, Sen G C. Inhibition of interferon-inducible gene expression by adenovirus E1A proteins: block in transcriptional complex formation. Proc Natl Acad Sci USA. 1991;88:7459–7463. doi: 10.1073/pnas.88.17.7459. [DOI] [PMC free article] [PubMed] [Google Scholar]
- 28.Kalvakolanu D V, Borden E C. An overview of the interferon system: signal transduction and mechanisms of action. Cancer Investig. 1996;14:25–53. doi: 10.3109/07357909609018435. [DOI] [PubMed] [Google Scholar]
- 29.Kim I Y, Stadtman T C. Inhibition of NF-kappaB DNA binding and nitric oxide induction in human T cells and lung adenocarcinoma cells by selenite treatment. Proc Natl Acad Sci USA. 1997;94:12904–12907. doi: 10.1073/pnas.94.24.12904. [DOI] [PMC free article] [PubMed] [Google Scholar]
- 30.Kimchi A. DAP genes: novel apoptotic genes isolated by a functional approach to gene cloning. Biochim Biophys Acta. 1998;1377:F13–F33. doi: 10.1016/s0304-419x(98)00002-x. [DOI] [PubMed] [Google Scholar]
- 31.Kumar A, Commane M, Flickinger T W, Horvath C M, Stark G R. Defective TNF-alpha-induced apoptosis in STAT1-null cells due to low constitutive levels of caspases. Science. 1997;278:1630–1632. doi: 10.1126/science.278.5343.1630. [DOI] [PubMed] [Google Scholar]
- 32.Kumar R, Atlas I. Interferon alpha induces the expression of retinoblastoma gene product in human Burkitt lymphoma Daudi cells: role in growth regulation. Proc Natl Acad Sci USA. 1992;89:6599–6603. doi: 10.1073/pnas.89.14.6599. [DOI] [PMC free article] [PubMed] [Google Scholar]
- 33.Laurent A G, Krust B, Galabru J, Svab J, Hovanessian A G. Monoclonal antibodies to an interferon-induced Mr 68,000 protein and their use for the detection of double-stranded RNA-dependent protein kinase in human cells. Proc Natl Acad Sci USA. 1985;82:4341–4345. doi: 10.1073/pnas.82.13.4341. [DOI] [PMC free article] [PubMed] [Google Scholar]
- 34.Lindner D J, Borden E C, Kalvakolanu D V. Synergistic antitumor effects of a combination of interferons and retinoic acid on human tumor cells in vitro and in vivo. Clin Cancer Res. 1997;3:931–937. [PubMed] [Google Scholar]
- 35.Machado A K, Morgan B A, Merrill G F. Thioredoxin reductase-dependent inhibition of MCB cell cycle box activity in Saccharomyces cerevisiae. J Biol Chem. 1997;272:17045–17054. doi: 10.1074/jbc.272.27.17045. [DOI] [PubMed] [Google Scholar]
- 36.Mangelsdorf D J, Evans R M. The RXR heterodimers and orphan receptors. Cell. 1995;83:841–850. doi: 10.1016/0092-8674(95)90200-7. [DOI] [PubMed] [Google Scholar]
- 37.Meissner P S, Sisk W P, Berman M L. Bacteriophage lambda cloning system for the construction of directional cDNA libraries. Proc Natl Acad Sci USA. 1987;84:4171–4175. doi: 10.1073/pnas.84.12.4171. [DOI] [PMC free article] [PubMed] [Google Scholar]
- 38.Miranda-Vizuete A, Spyrou G. The novel oxidoreductase KDRF (KM-102-derived reductase-like factor) is identical with human thioredoxin reductase. Biochem J. 1997;325:287–288. doi: 10.1042/bj3250287. [DOI] [PMC free article] [PubMed] [Google Scholar]
- 39.Moore D M, Kalvakolanu D V, Lippman S M, Kavanagh J J, Hong W K, Borden E C, Paredes-Espinoza M, Krakoff I H. Retinoic acid and interferon in human cancer: mechanistic and clinical studies. Semin Hematol. 1994;31:31–37. [PubMed] [Google Scholar]
- 40.Muller E G. Thioredoxin deficiency in yeast prolongs S phase and shortens the G1 interval of the cell cycle. J Biol Chem. 1991;266:9194–9202. [PubMed] [Google Scholar]
- 41.Muzio M, Chinnaiyan A M, Kischkel F C, O’Rourke K, Shevchenko A, Ni J, Scaffidi C, Bretz J D, Zhang M, Gentz R, Mann M, Krammer P H, Peter M E, Dixit V M. FLICE, a novel FADD-homologous ICE/CED-3-like protease, is recruited to the CD95 (Fas/APO-1) death-inducing signaling complex. Cell. 1996;85:817–827. doi: 10.1016/s0092-8674(00)81266-0. [DOI] [PubMed] [Google Scholar]
- 42.Nolan-Sorden N L, Lesiak K, Bayard B, Torrence P F, Silverman R H. Photochemical crosslinking in oligonucleotide-protein complexes between a bromine-substituted 2-5A analog and 2-5A-dependent RNase by ultraviolet lamp or laser. Anal Biochem. 1990;184:298–304. doi: 10.1016/0003-2697(90)90684-2. [DOI] [PubMed] [Google Scholar]
- 43.Ossina N K, Cannas A, Powers V C, Fitzpatrick P A, Knight J D, Gilbert J R, Shekhtman E M, Tomei L D, Umansky S R, Kiefer M C. Interferon-gamma modulates a p53-independent apoptotic pathway and apoptosis-related gene expression. J Biol Chem. 1997;272:16351–16357. doi: 10.1074/jbc.272.26.16351. [DOI] [PubMed] [Google Scholar]
- 44.Packham G, Cleveland J L. c-Myc and apoptosis. Biochim Biophys Acta. 1995;1242:11–28. doi: 10.1016/0304-419x(94)00015-t. [DOI] [PubMed] [Google Scholar]
- 45.Polyak K, Xia Y, Zweier J L, Kinzler K W, Vogelstein B. A model for p53-induced apoptosis. Nature. 1997;389:300–305. doi: 10.1038/38525. [DOI] [PubMed] [Google Scholar]
- 46.Powis G, Briehl M, Oblong J. Redox signalling and the control of cell growth and death. Pharmacol Ther. 1995;68:149–173. doi: 10.1016/0163-7258(95)02004-7. [DOI] [PubMed] [Google Scholar]
- 47.Raveh T, Hovanessian A G, Meurs E F, Sonenberg N, Kimchi A. Double-stranded RNA-dependent protein kinase mediates c-Myc suppression induced by type I interferons. J Biol Chem. 1996;271:25479–25484. doi: 10.1074/jbc.271.41.25479. [DOI] [PubMed] [Google Scholar]
- 48.Resnitzky D, Tiefenbrun N, Berissi H, Kimchi A. Interferons and interleukin 6 suppress phosphorylation of the retinoblastoma protein in growth-sensitive hematopoietic cells. Proc Natl Acad Sci USA. 1992;89:402–406. doi: 10.1073/pnas.89.1.402. [DOI] [PMC free article] [PubMed] [Google Scholar]
- 49.Rubartelli A, Bonifaci N, Sitia R. High rates of thioredoxin secretion correlate with growth arrest in hepatoma cells. Cancer Res. 1995;55:675–680. [PubMed] [Google Scholar]
- 50.Samuel C E, Kuhen K L, George C X, Ortega L G, Rende-Fournier R, Tanaka H. The PKR protein kinase—an interferon-inducible regulator of cell growth and differentiation. Int J Hematol. 1997;65:227–237. doi: 10.1016/s0925-5710(96)00544-0. [DOI] [PubMed] [Google Scholar]
- 51.Savinova O, Jagus R. Use of vertical slab isoelectric focusing and immunoblotting to evaluate steady-state phosphorylation of eIF2 alpha in cultured cells. Methods. 1997;11:419–425. doi: 10.1006/meth.1996.0438. [DOI] [PubMed] [Google Scholar]
- 52.Schallreuter K U, Wood J M. Azelaic acid as a competitive inhibitor of thioredoxin reductase in human melanoma cells. Cancer Lett. 1987;36:297–305. doi: 10.1016/0304-3835(87)90023-1. [DOI] [PubMed] [Google Scholar]
- 53.Schmidt M, Nagel S, Proba J, Thiede C, Ritter M, Waring J F, Rosenbauer F, Huhn D, Wittig B, Horak I, Neubauer A. Lack of interferon consensus sequence binding protein (ICSBP) transcripts in human myeloid leukemias. Blood. 1998;91:22–29. [PubMed] [Google Scholar]
- 54.Schulze-Osthoff K, Schenk H, Droge W. Effects of thioredoxin on activation of transcription factor NF-kappa B. Methods Enzymol. 1995;252:253–264. doi: 10.1016/0076-6879(95)52028-7. [DOI] [PubMed] [Google Scholar]
- 55.Schulze-Osthoff K, Walczak H, Droge W, Krammer P H. Cell nucleus and DNA fragmentation are not required for apoptosis. J Cell Biol. 1994;127:15–20. doi: 10.1083/jcb.127.1.15. [DOI] [PMC free article] [PubMed] [Google Scholar]
- 56.Schwartz L M, Smith S W, Jones M E, Osborne B A. Do all programmed cell deaths occur via apoptosis? Proc Natl Acad Sci USA. 1993;90:980–984. doi: 10.1073/pnas.90.3.980. [DOI] [PMC free article] [PubMed] [Google Scholar]
- 57.Scorsone K A, Panniers R, Rowlands A G, Henshaw E C. Phosphorylation of eukaryotic initiation factor 2 during physiological stresses which affect protein synthesis. J Biol Chem. 1987;262:14538–14543. [PubMed] [Google Scholar]
- 58.Sen G C, Ransohoff R M. Transcriptional regulation in the interferon system. Austin, Tex: Chapman & Hall and Landes Bioscience; 1997. [Google Scholar]
- 59.Silverman R H. 2-5A dependent Rnase L: a regulated endoribonuclease in the interferon system. In: D’Alessio G, Riordan J F, editors. Ribonucleases: structure and functions. New York, N.Y: Academic Press, Inc.; 1997. pp. 515–551. [Google Scholar]
- 60.Skehan P, Storeng R, Scudiero D, Monks A, McMahon J, Vistica D, Warren J T, Bokesch H, Kenney S, Boyd M R. New colorimetric cytotoxicity assay for anticancer-drug screening. J Natl Cancer Inst. 1990;82:1107–1112. doi: 10.1093/jnci/82.13.1107. [DOI] [PubMed] [Google Scholar]
- 61.Spyrou G, Bjornstedt M, Skog S, Holmgren A. Selenite and selenate inhibit human lymphocyte growth via different mechanisms. Cancer Res. 1996;56:4407–4412. [PubMed] [Google Scholar]
- 62.Studzinski G P, editor. Cell growth and apoptosis: a practical approach. Oxford, United Kingdom: IRL Press; 1995. [Google Scholar]
- 63.Tagaya Y, Maeda Y, Mitsui A, Kondo N, Matsui H, Hamuro J, Brown N, Arai K, Yokota T, Wakasugi H, et al. ATL-derived factor (ADF), an IL-2 receptor/Tac inducer homologous to thioredoxin: possible involvement of dithiol-reduction in the IL-2 receptor induction. EMBO J. 1989;8:757–764. doi: 10.1002/j.1460-2075.1989.tb03436.x. [DOI] [PMC free article] [PubMed] [Google Scholar]
- 64.Taniguchi T, Lamphier M S, Tanaka N. IRF1: the transcription factor linking interferon response and oncogenesis. Biochim Biophys Acta. 1997;1333:M9–M17. doi: 10.1016/s0304-419x(97)00014-0. [DOI] [PubMed] [Google Scholar]
- 65.Ucker D S, Obermiller P S, Eckhart W, Apgar J R, Berger N A, Meyers J. Genome digestion is a dispensable consequence of physiological cell death mediated by cytotoxic T lymphocytes. Mol Cell Biol. 1992;12:3060–3069. doi: 10.1128/mcb.12.7.3060. [DOI] [PMC free article] [PubMed] [Google Scholar]
- 66.Willman C L, Sever C E, Pallavicini M G, Harada H, Tanaka N, Slovak M L, Yamamoto H, Harada K, Meeker T C, List A F, Taniguchi T. Deletion of IRF-1, mapping to chromosome 5q31.1, in human leukemia and preleukemic myelodysplasia. Science. 1993;259:968–971. doi: 10.1126/science.8438156. [DOI] [PubMed] [Google Scholar]


