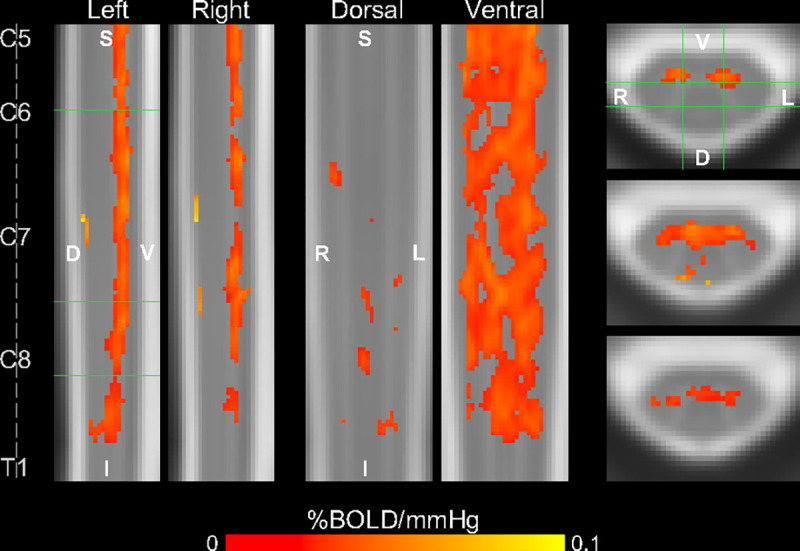
Fig. 1. Group-level SCVR amplitude map.

Significant SCVR is shown in units of %BOLD/mmHg (p<0.05, FWE-corrected). Two sagittal, two coronal, and three axial slices are shown (green lines indicate location of slices). Approximate centers of spinal cord segments are indicated. (FWE=family-wise error, S=superior, I=inferior, D=dorsal, V=ventral, L=left, R=right).
