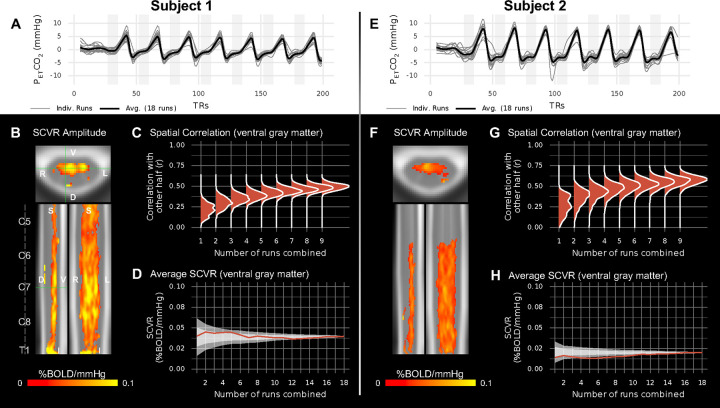
Fig. 2. SCVR mapping in two highly-sampled subjects.
(A,E) PETCO2 regressors (convolved with the canonical HRF and demeaned) for 18 breath-holding task runs and their average. (B,F) Maps of SCVR amplitude in axial, sagittal, and coronal planes (FWE-corrected, p<0.05). Spinal cord segments and slice locations (green lines) are indicated. (C,G) Split-halves spatial correlation of gray matter SCVR amplitude for varying number of runs combined (1–9) vs. other half combined (9 runs). (D,H) Average SCVR as runs are sequentially combined in the order they were acquired (red line) and in randomly shuffled orders (shaded areas; ±1SD and ±2SD).

