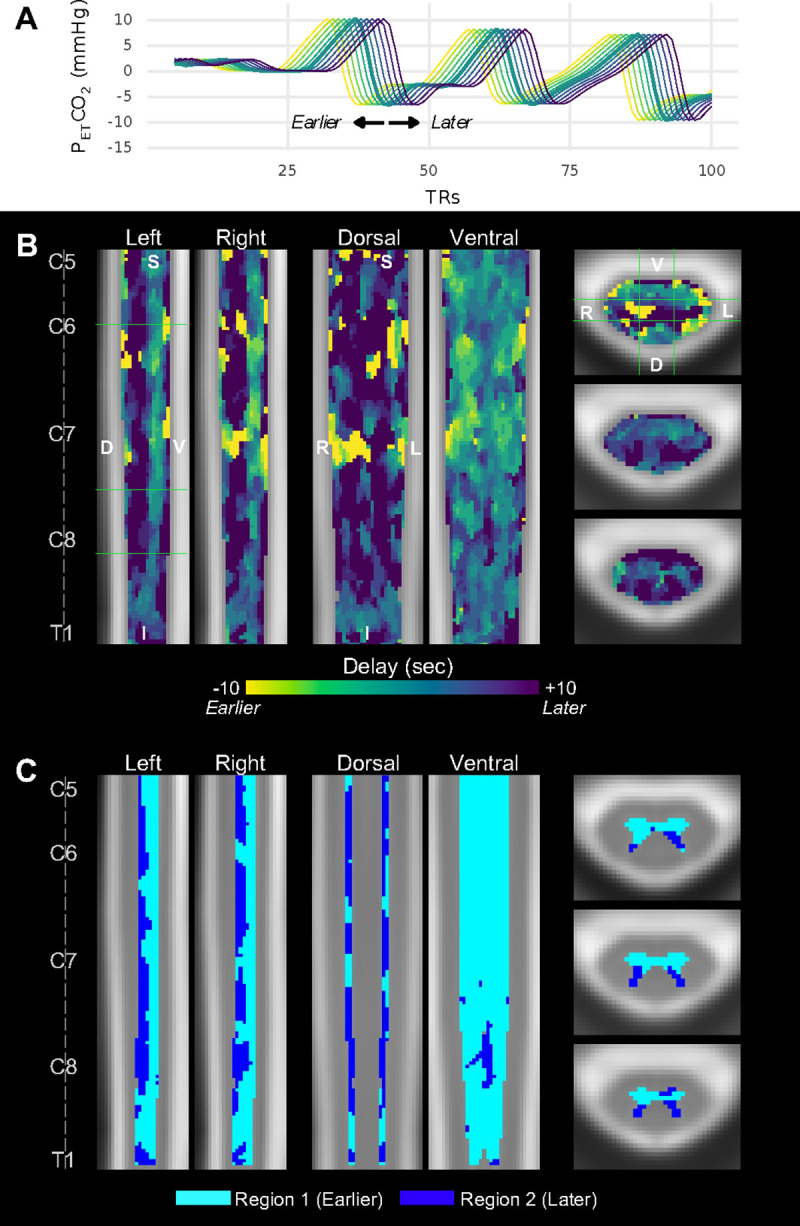
Fig. 3. SCVR hemodynamic delay mapping at the group-level.

(A) Example of temporally shifted PETCO2 regressors. The unshifted (no delay) PETCO2 regressor (thick green line) and each tested shift ±10s, in 2s increments, are shown. Line colors correspond to the “Delay” colorbar in panel B. Full traces are truncated at 100 TRs for ease of visualization. (B) SCVR hemodynamic delay map (ranging ±10s, in increments of 2s). The same slices as Fig. 1 are shown. (C) Gray matter regional segmentation based on delay threshold.
