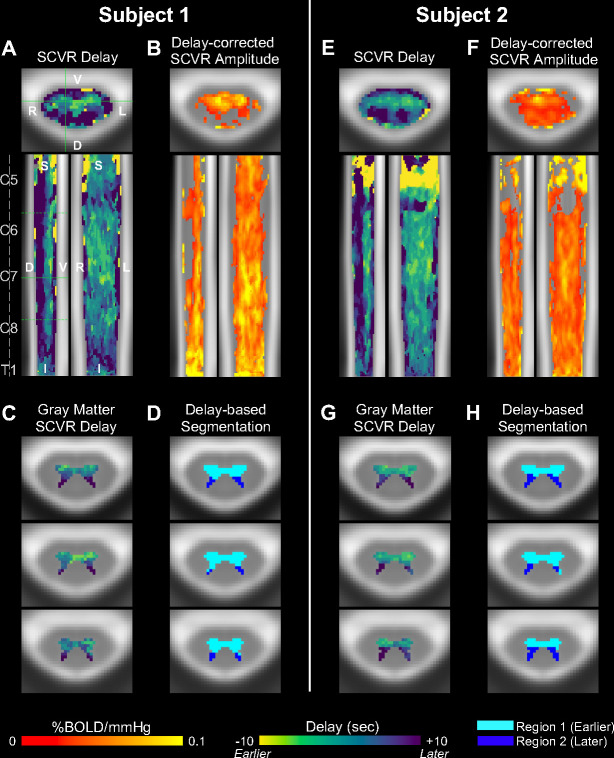
Fig. 4. SCVR delay mapping in two highly-sampled subjects.
(A,E) SCVR delay map (ranging ±10s, in increments of 2s). Spinal cord segments and slice locations (solid green lines) are indicated. The three solid and dotted green lines in the sagittal view indicate axial slices in the lower panels. (B,F) Delay-corrected SCVR amplitude (FWE-corrected, p<0.05). The same slices as Fig. 2 are shown. (C,G) SCVR delay map within gray matter voxels. (D,H) Gray matter regional segmentation based on delay threshold.

