

Abstract
Introduction:
Access to effective contraception prevents unintended pregnancies among sexually active female youth. Potentially impacted by the Affordable Care Act’s Medicaid-related policies, contraception use increased among sexually active high-school students from 2013 to 2019.
Methods:
Analyses conducted in 2021 assessed state-level Youth Risk Behavior Survey data among female students in grades 9–12 who reported being sexually active. States that expanded Medicaid were compared with other states in 2013 (baseline) and 2019 (after expansion). Measured outcomes included self-reported use of moderately effective or highly effective, long-acting reversible contraception at last sex. Long-acting reversible contraception included intrauterine devices and implants. Moderately effective contraception included birth control pills, injectables, patches, or rings. Results were weighted and adjusted for age and race/ethnicity.
Results:
Students in Medicaid expansion states (n=27,564) did not differ significantly from those in nonexpansion states (n=6,048) at baseline or after expansion with respect to age, age at first sex, or the number of sexual partners in the past 3 months; however, race/ethnicity population characteristics changed over time. Postexpansion increased use of intrauterine devices/implants was greater in Medicaid expansion states than in nonexpansion states (238.1% increase vs 120.0% increase, adjusted p=0.047). For those aged 16–17 years, Medicaid expansion states had a 283.3% increase in intrauterine device/implant use compared with an increase of 69.7% in nonexpansion states (adjusted p=0.004).
Conclusions:
Medicaid expansion was associated with a greater population-level increase in intrauterine device/implant use among sexually active female high-school students aged 16–17 years. These findings point to the possibility that the Affordable Care Act’s Medicaid-related policies played a role in young women’s use of intrauterine devices/implants.
INTRODUCTION
Effective methods of contraception can enable sexually active adolescents to avoid unintended pregnancies. Besides the birth-control pill, other moderately effective methods1 include injection or injectables, patch, or ring. Failure rates of moderately effective methods range from 6% to 9%.2 Highly effective reversible methods, including intrauterine devices (IUDs) and implants,1 require 1-time insertion and have a failure rate <1%.2 Deemed safe for adolescents,3,4 the use of moderately or highly effective contraception increased among high-school students in the U.S. from 25.3% in 2013 to 30.3% in 2019.5
In 2018, the teen birth rate was approximately twice as high for Hispanic and non-Hispanic Black teens as for non-Hispanic White teens,6 and counties with higher teen birth rates tend to have less favorable socioeconomic indicators.7 Teen pregnancy rates in the U.S. are up to 7 times that of other high-income countries.8 Many sexually active adolescents do not receive needed reproductive health services, and those without insurance coverage are less likely than those with coverage to receive those services.9 Adolescents involved in foster care or juvenile justice or from families with lower incomes have been shown to experience barriers to health care.9,10 These circumstances, coupled with the variation of contraceptive use by race/ethnicity,11 may contribute to the observed disparities in unintended pregnancies.
In 2013, data from the National Health Interview Survey showed that 10.7% of individuals in the U.S. aged 15–18 years were uninsured and that 29.3% relied on public health insurance.12 Medicaid expansion pursuant to the Affordable Care Act (ACA) created eligibility pathways that may have impacted high-school students either through spill-over effects after their parents became eligible with the expanded income limits13 or through direct income-based eligibility for young adults in high school.14 In 2020, children in nonexpansion states were twice as likely to be uninsured (8.6%) as those living in expansion states (4.0%).15
Increasing access to effective contraception can expand contraceptive options and support method choice.16 In addition to lacking health insurance coverage, other barriers to accessing highly effective methods have been documented at the individual level (e.g., level of reimbursement, availability at a preferred provider) and administrative level (e.g., device acquisition and stocking costs).17,18 IUDs/implants generally have a higher initial cost than other forms of contraception; however, increased use of highly effective methods may potentially reduce the total public cost of unintended pregnancies from $24.2 billion to $12.2 billion annually.19
Evaluating the public health impact of state Medicaid expansion may result in findings policy makers can use to make evidence-based decisions about healthcare coverage and access. A previously published study sought to evaluate whether Medicaid expansion was associated with increased use of contraception among females of child-bearing age who visited community health centers in 2013 and 2016. Although the study was not population based, it showed that the effect of Medicaid expansion on contraception use was most pronounced among females aged 15–20 years.20 This study sought to assess whether state Medicaid expansion was associated with increased use of contraception among female students in grades 9–12.
METHODS
To evaluate the hypothesis that states implementing Medicaid expansion in 2014 would show greater increases in contraception use than states opting not to expand Medicaid as of 2019, information documented by the Kaiser Family Foundation21 was used to categorize sites on the basis of Medicaid expansion status as of December 31, 2019. States were considered expansion states if Medicaid expansion was implemented by December 31, 2014 (study Medicaid expansion states), thereby excluding 7 states that implemented Medicaid expansion at some point between January 1, 2015 and December 31, 2019 (Alaska, Indiana, Pennsylvania, Louisiana, Montana, Maine, and Virginia).
Study Population
The Youth Risk Behavior Surveillance System consists of national and site-level surveys.22 Participating states and jurisdictions can conduct their own site-level Youth Risk Behavior Survey (YRBS) every 2 years using methods designed by the U.S. Centers for Disease Control and Prevention (CDC). Youth Risk Behavior Surveillance System data are publicly available on CDC website, along with questionnaires and documentation for proper analytic methods.23 The YRBS is a cross-sectional survey of high-school students, which meets the high standards of representative data needed for public health surveillance of behaviors among youth.
Site-level surveys contain questions from a CDC standard questionnaire and additional questions chosen during each site’s questionnaire design process. Although sites are required by CDC to include at least two thirds of standard questions, they may choose to replace some. No YRBS questions assess family income or insurance status. For inclusion, site-level surveys were required to contain standard questions assessing current sexual activity and contraception methods used at last sex. The standard question response options changed in 2011 and 2013 but remained consistent from 2013 to 2019. Not all sites asked the questions each year (Appendix Table 1, available online); therefore, to ensure that the same states were included in comparisons, authors analyzed surveys from 2013 (baseline measure before Medicaid expansion) and 2019 (5 years after expansion). The median response rate was 68.5% in 2013 and 65.0% in 2019.
Measures
For contraception method, students were asked to select the one method they used to prevent pregnancy the last time they had sexual intercourse. Condoms were included as a contraceptive option, and condom use for any reason was assessed in a previous question. To avoid reporting bias by males who were unaware of their partner’s use of contraception,11 analyses were limited to sexually active females. Among these records, 1,207 (3.6%) were excluded owing to missing contraception information, and the final sample size was 32,405. Subcategories available for analysis included highly effective methods (IUD/implant) and moderately effective methods (birth-control pills, injectables, patch, or ring). Condoms and other methods (i.e., withdrawal or no method) were not analyzed.
Statistical Analysis
Calculations included weighted proportions and 95% CIs accounting for the complex survey design of YRBS. Unadjusted statistical differences were tested using t-tests (p<0.05). Percentage change over the study time period was calculated as an unadjusted descriptive statistic. For adjusted analyses, each category of contraceptive method was modeled as a binary outcome variable in logistic regression. Year and expansion status were binary exposure variables, and their interaction was tested for significance to determine whether year had a significantly different effect depending on expansion status (referred to as difference in difference24). Age and race/ethnicity were independent categorical variables added to adjust for demographics, which may have differed between expansion and nonexpansion states or changed over time. When the sample size allowed (n≥30), stratified models focused on age, race/ethnicity, and race groups not restricted by ethnicity or single race responses. Mutually exclusive race/ethnicity groups were used in overall regression models: (1) Hispanic ethnicity, (2) non-Hispanic Black or African American (3) non-Hispanic White, and (4) other (including American Indian or Alaska Native, Asian, Native Hawaiian or Other Pacific Islander, or multiracial). For stratification, nonmutually exclusive groups allowed for students who selected >1 race; no restrictions were based on ethnicity,25 and comparisons were not made between racial groups. Adjusted differences and interactions were tested using Wald F-tests in logistic regression (p<0.05). Supplemental trend analyses adjusted for age and race/ethnicity using methods described in YRBS online documentation.26 The complex survey design, survey weights, and state-level sampling stratification were accounted for using SAS-callable SUDAAN, version 11.0.3,27 in SAS, version 9.4.28
RESULTS
Of the 27 YRBS sites that expanded Medicaid in 2014 (26 states plus the District of Columbia [DC]), authors were able to include 18 (66.7%) sites in the analysis (Arkansas, Arizona, Connecticut, Washington, DC, Hawaii, Illinois, Kentucky, Massachusetts, Maryland, Michigan, New Hampshire, New Jersey, New Mexico, Nevada, New York, Ohio, Rhode Island, and West Virginia). Three Medicaid expansion states were excluded because they did not conduct a site-level YRBS, and 6 were excluded because they did not ask the questions of interest. Of the 17 states that had not expanded as of 2019, the authors included 11 sites (64.7%) (Alabama, Florida, Kansas, Missouri, Mississippi, Nebraska, Oklahoma, South Carolina, South Dakota, Texas, and Wisconsin). Six were excluded because they did not ask the questions of interest. The use of moderately or highly effective contraception increased significantly in 7 expansion sites (6 states plus DC) and 3 nonexpansion states after adjustment (Appendix Table 1, available online). Appendix Table 2 (available online) contains results of a sensitivity analysis limited to the 15 expansion and 5 nonexpansion states with data available for all the years from 2013 to 2019. Appendix Table 3 (available online) contains results of a prestudy period analysis limited to response options available from 2009 to 2013 (also limited to 15 expansion and 11 nonexpansion states with data available for all years).
Of the sexually active female students in the sample, 27,564 represented students in Medicaid expansion states, and 6,048 represented students in nonexpansion states. Over half of students in Medicaid expansion states were aged 16 or 17 years (59.6%) in 2013 (Table 1). This proportion did not change significantly over time (p=0.093), and it was not significantly different from that of nonexpansion states in 2013 (p=0.525) or 2019 (p=0.544). In addition, the proportionate size of other age groups did not differ between expansion and nonexpansion states.
Table 1.
Characteristics of Sexually Active Female High-School Students, by Medicaid Expansion Status
| Characteristics | Expansion states, n | Expansion states, 2013 % (95% CI) | Expansion states, 2019 % (95% CI) | Expansion states, 2013 vs 2019, p-value | Nonexpansion states, n | Nonexpansion states, 2013 % (95% CI) | Nonexpansion states, 2019 % (95% CI) | Nonexpansion states, 2013 vs 2019, p-value | Expansion vs nonexpansion states, 2013, p-value | Expansion vs nonexpansion states, 2019, p-value |
|---|---|---|---|---|---|---|---|---|---|---|
| Age, years | ||||||||||
| <16 | 6,714 | 18.4 (16.6, 20.3) | 18.2 (16.3, 20.2) | 0.864 | 1,340 | 19.4 (17.0, 22.0) | 17.5 (14.4, 21.2) | 0.389 | 0.541 | 0.748 |
| 16–17 | 17,045 | 59.6 (57.5, 61.6) | 57.0 (54.6, 59.2) | 0.093 | 3,578 | 58.5 (55.6, 61.3) | 58.4 (54.3, 62.4) | 0.981 | 0.525 | 0.544 |
| ≥18 | 3,786 | 22.0 (20.2, 24.0) | 24.9 (22.7, 27.2) | 0.055 | 1,126 | 22.2 (19.4, 25.2) | 24.1 (20.6, 28.0) | 0.426 | 0.924 | 0.720 |
| Race/ethnicity | ||||||||||
| Hispanic or Latino | 5,452 | 15.9 (14.4, 17.7) | 21.2 (18.9, 23.7) | <0.001 | 1,280 | 26.0 (21.7, 30.8) | 30.7 (26.2, 35.5) | 0.157 | <0.001 | <0.001 |
| NH Blacka | 5,273 | 15.5 (13.3, 18.0) | 12.0 (9.7, 14.8) | 0.047 | 852 | 18.6 (15.3, 22.5) | 13.2 (10.5, 16.4) | 0.022 | 0.158 | 0.558 |
| NH Whitea | 13,111 | 62.6 (59.4, 65.6) | 59.9 (56.5, 63.3) | 0.265 | 3,244 | 49.8 (45.6, 54.0) | 49.3 (44.5, 54.0) | 0.865 | <0.001 | <0.001 |
| NH other | 3,248 | 6.0 (5.2, 6.8) | 6.8 (6.0, 7.8) | 0.168 | 590 | 5.6 (4.7, 6.7) | 6.9 (5.4, 8.8) | 0.185 | 0.574 | 0.919 |
| Race, not restrictedb | ||||||||||
| American Indian or Alaska Native | 1,526 | 3.4 (2.8, 4.1) | 3.9 (3.2, 4.7) | 0.380 | 463 | 6.2 (5.2, 7.5) | 6.8 (5.0, 9.1) | 0.646 | <0.001 | 0.008 |
| Asian | 1,808 | 3.1 (2.6, 3.6) | 4.0 (3.3, 4.8) | 0.047 | 172 | 1.6 (1.2, 2.1) | 2.4 (1.5, 3.8) | 0.165 | <0.001 | 0.024 |
| Black | 7,224 | 18.9 (16.5, 21.6) | 16.2 (13.8, 18.9) | 0.136 | 1,154 | 22.0 (18.5, 25.9) | 16.6 (13.5, 20.4) | 0.039 | 0.185 | 0.831 |
| Native Hawaiian or other Pacific Islander | 1,385 | 2.2 (1.8, 2.7) | 2.8 (2.3, 3.3) | 0.133 | 125 | 2.3 (1.8, 2.8) | 1.6 (1.0, 2.4) | 0.101 | 0.955 | 0.006 |
| Mean age at first sexc | 27,105 | 14.84 | 15.11 | <0.001 | 6,009 | 14.82 | 15.12 | <0.001 | 0.637 | 0.908 |
| Mean number of current sex partners | 27,564 | 1.31 | 1.24 | 0.007 | 6,048 | 1.30 | 1.24 | 0.068 | 0.740 | 0.915 |
Note: Boldface indicates statistical significance (p<0.05).
Study excludes females who did not have sex in the 3 months before the survey and excludes states that did not have data available in both 2013 and 2019.
Students are not Hispanic or Latino and reported 1 race.
Students may have reported >1 race and may be Hispanic or Latino; groups are not mutually exclusive.
Measure not available in Rhode Island in 2019.
NH, non-Hispanic.
The proportion of Hispanic/Latino students was lower in Medicaid expansion states than in nonexpansion states in 2013 (15.9% vs 26.0%, p<0.001) and 2019 (21.2% vs 30.7%, p<0.001) but increased over time in expansion states (p<0.001) (Table 1). Students in Medicaid expansion states were more likely to be non-Hispanic White in 2013 (62.6% vs 49.8%, p<0.001) and 2019 (59.9% vs 49.3%, p<0.001). They were also more likely to be Asian and less likely to be American Indian/Alaska Native than students in nonexpansion states at both time points. The proportion of Native Hawaiian/Other Pacific Islander was greater in expansion states in 2019 only (2.8% vs 1.6%, p=0.006). The mean age at first sex increased over time, and the mean number of sexual partners decreased over time. These measures were similar for students in Medicaid expansion and nonexpansion states at both time points.
The use of any moderately or highly effective contraception was more common among students in Medicaid expansion states than among those in nonexpansion states at baseline (35.1% vs 28.4%, p<0.001) and after expansion (39.7% vs 32.7%, p=0.001). Over time, the use of any moderately or highly effective contraception increased by 13.1% in study Medicaid expansion states and 15.1% in study nonexpansion states (Table 2). Both increases were statistically significant after adjustment (p<0.001 and p=0.040, respectively), and there was no differential effect of time by expansion status (p=0.962).
Table 2.
Use of Highly or Moderately Effective Contraception, by Age and Medicaid Expansion Status
| Age group | Expansion states, 2013 % (95% CI) | Expansion states, 2019 % (95% CI) | Expansion states, % change from 2013 to 2019 | Expansion states, 2013 versus 2019,p-valuea | Nonexpansion states, 2013 % (95% CI) | Nonexpansion states, 2019 % (95% CI) | Nonexpansion states, % change from 2013 to 2019 | Nonexpansion states, 2013 versus 2019, p-valuea | Difference in difference, p-valuea |
|---|---|---|---|---|---|---|---|---|---|
| All ages | |||||||||
| Any methodb | 35.1 (33.1, 37.0) | 39.7 (37.6, 41.8) | +13.1 | <0.001 | 28.4 (25.9, 31.0) | 32.7 (29.0, 36.5) | +15.1 | 0.040 | 0.962 |
| IUD/implant | 2.1 (1.6, 2.7) | 7.1 (5.9, 8.4) | +238.1 | <0.001 | 3.0 (2.4, 3.8) | 6.6 (5.0, 8.5) | +120.0 | <0.001 | 0.047 |
| Birth-control pills | 25.7 (23.8, 27.6) | 27.7 (25.7, 29.9) | +7.8 | 0.147 | 17.2 (15.1, 19.5) | 21.4 (18.9, 24.2) | +24.4 | 0.009 | 0.192 |
| Injectable, patch, or ring | 7.3 (6.3, 8.6) | 4.9 (3.9, 6.0) | −32.9 | 0.005 | 8.2 (7.0, 9.4) | 4.7 (3.8, 5.8) | −42.7 | <0.001 | 0.492 |
| Age <16 years | |||||||||
| Any methodb | 19.4 (16.6, 22.5) | 27.3 (23.6, 31.5) | +40.7 | 0.001 | 19.7 (16.2, 23.9) | 27.3 (19.6, 36.7) | +38.6 | 0.162 | 0.764 |
| IUD/implant | 0.9 (0.5, 1.7) | 4.3 (2.8, 6.7) | +377.8 | <0.001 | 1.9 (0.8, 4.3) | 8.3 (3.2, 19.6) | +336.8 | 0.021 | 0.939 |
| Birth-control pills | 12.9 (10.8, 15.3) | 18.5 (15.1, 22.5) | +43.4 | 0.004 | 10.8 (8.5, 13.6) | 16.1 (12.7, 20.2) | +49.1 | 0.045 | 0.791 |
| Injectable, patch, or ring | 5.5 (3.8, 8.0) | 4.5 (3.1, 6.6) | −18.2 | 0.381 | 7.1 (4.9, 10.2) | 2.9 (1.4, 6.1) | −59.2 | 0.026 | 0.209 |
| Age 16–17 years | |||||||||
| Any methodb | 36.8 (34.2, 39.4) | 41.2 (38.2, 44.2) | +12.0 | 0.011 | 29.0 (25.9, 32.2) | 33.8 (30.0, 37.7) | +16.6 | 0.031 | 0.883 |
| IUD/implant | 1.8 (1.3, 2.5) | 6.9 (5.6, 8.5) | +283.3 | <0.001 | 3.3 (2.3, 4.5) | 5.6 (4.2, 7.3) | +69.7 | 0.016 | 0.004 |
| Birth-control pills | 27.4 (25.0, 30.0) | 28.9 (26.3, 31.7) | +5.5 | 0.321 | 17.5 (15.0, 20.3) | 22.7 (19.5, 26.2) | +29.7 | 0.010 | 0.114 |
| Injectable, patch, or ring | 7.6 (6.4, 8.9) | 5.3 (4.1, 6.8) | −30.3 | 0.035 | 8.3 (7.0, 9.7) | 5.5 (4.4, 6.9) | −33.7 | 0.009 | 0.778 |
| Age ≥18 years | |||||||||
| Any methodb | 43.5 (39.9, 47.1) | 45.1 (39.5, 50.9) | +3.7 | 0.682 | 34.6 (29.5, 40.0) | 33.8 (27.8, 40.3) | −2.3 | 0.753 | 0.958 |
| IUD/implant | 3.7 (2.4, 5.7) | 9.4 (6.6, 13.2) | +154.1 | 0.001 | 3.4 (2.1, 5.6) | 7.8 (4.9, 12.1) | +129.4 | 0.017 | 0.816 |
| Birth-control pills | 31.6 (28.2, 35.2) | 31.7 (25.6, 38.4) | +0.3 | 0.885 | 22.2 (18.6, 26.4) | 22.1 (17.1, 28.1) | −0.5 | 0.627 | 0.706 |
| Injectable, patch, or ring | 8.2 (5.7, 11.6) | 4.1 (2.5, 6.7) | −50.0 | 0.043 | 8.9 (5.6, 13.9) | 3.9 (2.4, 6.4) | −56.2 | 0.026 | 0.815 |
Note: Boldface indicates statistical significance (p<0.05).
Study excludes females who did not have sex in the 3 months before the survey and excludes states that did not have data available in both 2013 and 2019.
Adjusted for age and race/ethnicity in overall results; adjusted for race/ethnicity in results by age group.
Including highly effective methods (IUD, implant) and moderately effective methods (birth-control pill, injectable, patch, ring).
IUD, intrauterine device.
For IUDs/implants, use increased by 238.1% in study Medicaid expansion states and 120.0% in nonexpansion states (Table 2). Both increases were statistically significant after adjustment (p<0.001), and a statistically significant time interaction showed that the increase was greater for Medicaid expansion states than for nonexpansion states (p=0.047) (Figure 1). The time interaction for use of IUDs/implants was significant among students aged 16–17 years (p=0.004) for whom use increased by 283.3% in study Medicaid expansion states and 69.7% in study nonexpansion states (Table 2).
Figure 1.
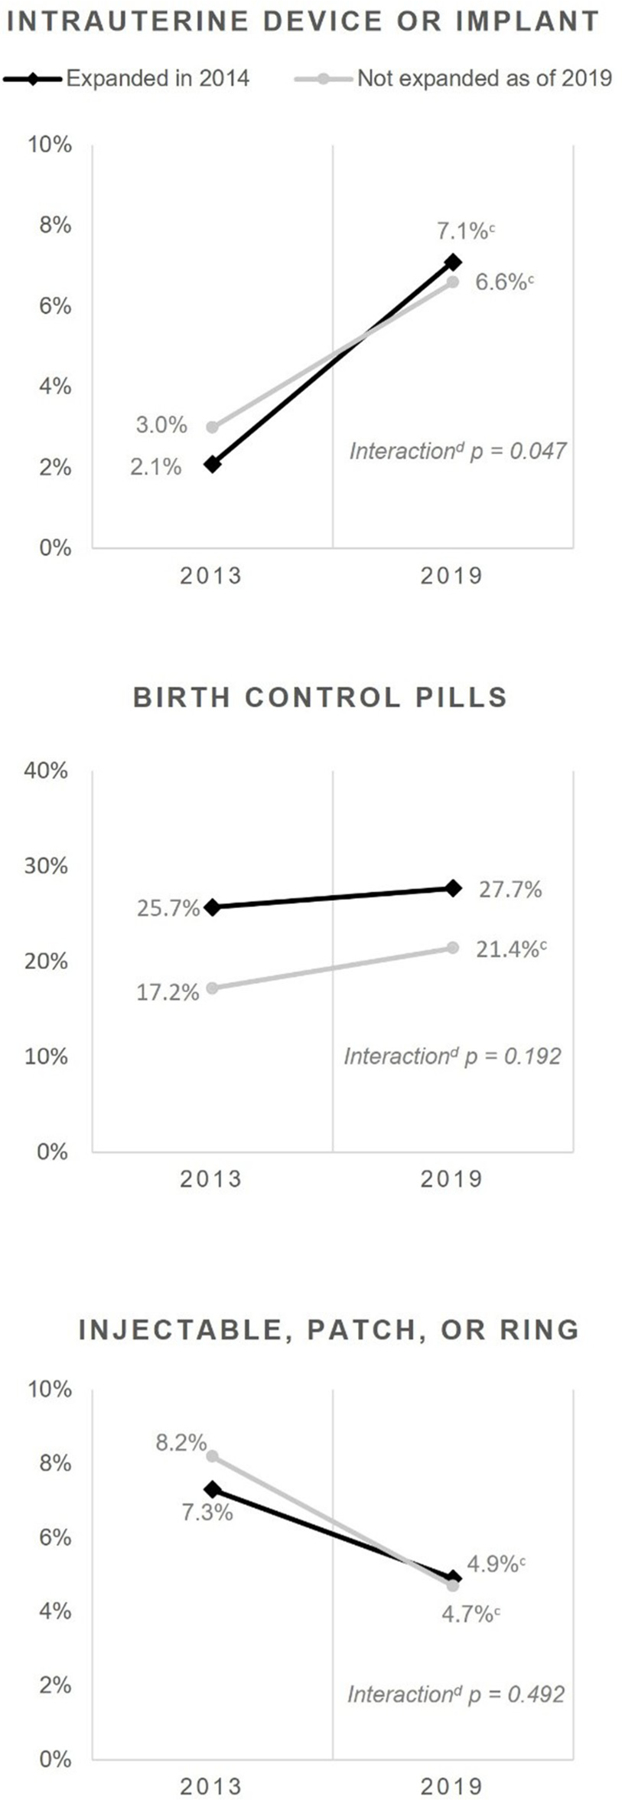
Changes in the use of different types of highly or moderately effective contraceptiona by Medicaid expansion status.b
Note: Change from 2013 to 2019 include the following: +238.1% in expansion states and +120.0% in nonexpansion states for intrauterine devices or implants; +7.8% in expansion states and +24.4% in nonexpansion states for birth-control pills; and −32.9% in expansion states and −42.7% in nonexpansion states for injectable, patch, or ring. Expansion states (18) included Arkansas, Arizona, Connecticut, Washington, District of Columbia, Hawaii, Illinois, Kentucky, Massachusetts, Maryland, Michigan, New Hampshire, New Jersey, New Mexico, Nevada, New York, Ohio, Rhode Island, and West Virginia. Nonexpansion states (11) included Alabama, Florida, Kansas, Missouri, Mississippi, Nebraska, Oklahoma, South Carolina, South Dakota, Texas, and Wisconsin.
aUsed before last sex among female high-school students who had sex in the 3 months before the survey.
bExcluding states that did not have data available in both 2013 and 2019.
cSignificant difference between 2013 and 2019 after adjusting for age and race (p<0.05).
dChange significantly different between expansion and nonexpansion states after adjusting for age and race (p<0.05).
The use of birth-control pills did not increase significantly (p=0.147) in the study Medicaid expansion states but did increase significantly in nonexpansion states by 24.4% (p=0.009) (Table 2); the time interaction was not significant after adjustment (p=0.192) (Figure 1). For injectable, patch, or ring, use decreased by 32.9% in Medicaid expansion states and 42.7% in nonexpansion states, with no significant difference in the change.
Asian students in study Medicaid expansion states experienced a change over time for use of highly or moderately effective contraception (p=0.014), which did not differ significantly from the experience of those in nonexpansion states (an increase of 55.3% vs 2.9%, respectively; age-adjusted interaction p=0.190) (Table 3). Results for Hispanic students showed a similar pattern (an increase of 27.3% vs 23.6%, age-adjusted p=0.841). For American Indian/Alaska Native students, the 89.0% increase for nonexpansion states was not significantly higher than the 18.0% increase in expansion states after age adjustment (p=0.216). Increases were evident for non-Hispanic White students in both groups; however, no change was evident for Black students in either group. Owing to statistical limitations, models for each type of contraception by race/ethnicity were not shown.
Table 3.
Use of Highly or Moderately Effective Contraception, by Race/Ethnicity and Medicaid Expansion Status
| Race/ethnicity | Expansion states, 2013 % (95% CI) | Expansion states, 2019 % (95% CI) | Expansion states, % change from 2013 to 2019 | Expansion states, 2013 versus 2019,p-valuea | Nonexpansion states, 2013 % (95% CI) | Nonexpansion states, 2019 % (95% CI) | Nonexpansion states, % change from 2013 to 2019 | Nonexpansion states, 2013 versus 2019, p-valuea | Difference in difference, p-valuea |
|---|---|---|---|---|---|---|---|---|---|
| Hispanic or Latino | 23.8 (20.9, 26.9) | 30.3 (26.7, 34.2) | +27.3 | 0.010 | 19.1 (14.1, 25.3) | 23.6 (16.8, 32.3) | +23.6 | 0.337 | 0.841 |
| NH Blackb | 28.3 (23.0, 34.3) | 24.5 (19.3, 30.5) | −13.4 | 0.463 | 22.3 (18.2, 27.1) | 22.4 (16.1, 30.2) | +0.4 | 0.834 | 0.732 |
| NH Whitee | 40.7 (38.3, 43.1) | 47.3 (44.7, 49.9) | +16.2 | 0.001 | 36.1 (33.3, 39.0) | 41.6 (38.1, 45.2) | +15.2 | 0.013 | 0.961 |
| Unrestricted racec | |||||||||
| American Indian/Alaska Native | 24.5 (18.3, 31.9) | 28.9 (21.2, 37.9) | +18.0 | 0.549 | 17.2 (13.0, 22.5) | 32.5 (18.7, 50.3) | +89.0 | 0.041 | 0.216 |
| Asian | 19.0 (14.3, 24.7) | 29.5 (22.5, 37.6) | +55.3 | 0.014 | 24.3 (13.7, 39.5) | 25.0 (14.2, 40.2) | +2.9 | 0.864 | 0.190 |
| Black | 28.4 (23.9, 33.5) | 25.6 (21.2, 30.7) | −9.9 | 0.585 | 22.1 (18.4, 26.4) | 22.3 (16.7, 29.2) | +0.9 | 0.838 | 0.826 |
| Native Hawaiian or other Pacific Islander | 20.8 (13.9, 29.9) | 25.6 (18.5, 34.2) | +23.1 | 0.409 | 23.9 (12.0, 41.8) | 19.7 (8.7, 38.7) | −17.6 | 0.759 | 0.522 |
Note: Boldface indicates statistical significance (p<0.05).
Moderately Effective includes highly effective methods (IUD, implant) or moderately effective methods (birth-control pill, injectable, patch, ring). Results include highly effective methods (IUD, implant) or moderately effective methods (birth control pill, injectable, patch, ring. Study excludes females who did not have sex in the 3 months before the survey and excludes states that did not have data available in both 2013 and 2019.
Adjusted for age.
Students are not Hispanic or Latino and reported 1 race.
Students may have reported >1 race and may be Hispanic or Latino.
IUD, intrauterine device; NH, non-Hispanic.
DISCUSSION
The findings from this study suggest that ACA’s Medicaid-related policies were associated with a greater increase in the use of IUDs/implants among high-school females 5 years after expansion. No association was evident with the use of birth-control pills or other moderately effective contraception. These findings are consistent with a previously reported study of ambulatory care clinic patients in community health centers located in 12 Medicaid expansion states and 8 nonexpansion states.20 Although the study included all women aged 15–44 at-risk for pregnancy, the findings were strongest among patients aged 15–20 years.20 The current findings were also consistent with those of a study of female patients aged 15–45 years in a single employer-based health plan, concluding that elimination in cost sharing was more strongly associated with increases in contraceptive prescription fills and birth rate reductions for low-income women.29 Although this study was not able to include all states, the focus on youth in a nationally representative sample of high-school students permits greater generalizability of results, thereby addressing a limitation of other studies.
National YRBS data show that increases in the use of moderately or highly effective contraception from 2013 to 2019 among female high-school students were only statistically significant among non-Hispanic White students.30 The sample size of this state-level study, in addition to the analytic approach allowing racial groups to be multiracial and unrestricted by ethnicity, enabled us to examine each group separately. As states evaluate their adoption of ACA’s Medicaid-related policies, they may assess whether benefits are reaching all populations equally and thereby addressing disparities. For example, this study found no difference by expansion status for American Indian and Alaska Native students. These students may be eligible for healthcare services on the basis of federal funding of Indian Health Services and tribal facilities, even if received in the private sector through such funding mechanisms as allowed in federal provisions.31 Eligibility is not income based,32 thus Medicaid expansion may have less influence on access to services for American Indian and Alaska Native students. Although an evaluation of racial and ethnic disparities may be best accomplished at the state level, the aggregated data show that the gain in contraception use for Hispanic and Asian students in Medicaid expansion states outpaced that in nonexpansion states, but the difference was not statistically significant. These results show that Medicaid expansion was not associated with a greater increase in moderately or highly effective contraceptive use among Black students. This lack of association between contraceptive use and Medicaid expansion may be a useful area for additional research, taking into consideration that children of color remained disproportionately uninsured in 2020.15
Further research is warranted to better understand contraception choice and use among students of all racial/ethnic groups, including a focus on understanding barriers that go beyond public health insurance coverage. For instance, the findings among Black students could be an indication that Black females face barriers beyond cost, which has been discussed in other studies.33 A study by Kelsey Wright concluded that “eliminating financial barriers to access contraceptive services does not eliminate the socioeconomic contexts that influence method selection and use that occur as part of everyday lived experiences.”34 Additional focus on the social conditions associated with health disparities (including the higher proportion of students of color in nonexpansion states), systemic racism, and reproductive justice could serve to inform more effective adolescent reproductive health programs and services in the future.35,36
The mean age at first sex among female high-school students was about 15.1 years in both Medicaid expansion and nonexpansion states, highlighting the critical time period when youth need sexual and reproductive health services. The association between Medicaid expansion and the use of IUDs/implants was significant overall and specifically among students aged 16–17 years. The proportion of students in this age group who reported using moderately or highly effective contraception was higher in Medicaid expansion states both at baseline and after expansion, suggesting that other policies or societal factors may contribute to overall higher proportions in expansion states and cannot be attributed to Medicaid expansion alone.37 Further evaluation could reveal whether students in Medicaid expansion states tend to face fewer barriers unrelated to cost, such as restrictions on age of consent for reproductive services,38 provider hesitation, or logistical barriers to adolescent-friendly services.39
The current results show that with or without Medicaid expansion, >60% of sexually active female high-school students remain at-risk for unintended pregnancy arising from the use of less effective methods (i.e., condoms) or no contraception. They may also be at-risk for sexually transmitted diseases (STDs), and although this study did not address condom use, it is important to consider it in the context of contraception. Condom use has declined among high-school students5 for reasons that could be related to increased use of IUDs/implants.40 Because hormonal contraceptive methods do not protect against STDs, healthcare providers can promote the use of condoms as a way of reducing this risk.11 Similarly, previous studies have shown reduced STD transmission among youth when school-based health centers and clinics encouraged the dual use of moderately or highly effective contraception and condoms as part of a broad approach to promoting sexual health.11 Youth Advisory Boards and similar peer-led school organizations can promote Condom Availability Programs in their schools41 and openly discuss condom use when addressing healthy norms and relationships.
Limitations
This study has several limitations to consider when interpreting these results. First, Medicaid coverage of student participants is not known, and an association was not measured specifically among Medicaid enrollees. Second, the authors were unable to include all states and did not adjust for the complex interaction of social conditions or policies conducive to adolescent care seeking42 or supplemental programming. For example, teen pregnancy prevention programs43 and initiatives focused on increasing access to contraception44,45 were active during this period. Provider bias against the use of IUDs/implants in youth has been documented globally,46 and the results may have been skewed if such bias tends to be greater in nonexpansion states. Income eligibility expansions for family planning services and enhancements to health insurance enrollment made by nonexpansion states also add to the complexity in interpreting results.47 Other limitations relate to the design of YRBS, including potential misreporting of contraceptive use or sexual behaviors, site variations in the exclusion of youth not attending public school,48 and the inability to include trends in IUD/implant use before 2013.
CONCLUSIONS
This study suggests a population-level association between state Medicaid expansion and greater increased use of IUDs/implants among sexually active female high-school students aged 16–17 years. Public health professionals, clinicians, and policy makers can continue to assess how ACA’s Medicaid-related policies may impact population-level outcomes such as teen pregnancy rates.
Supplementary Material
ACKNOWLEDGMENTS
The authors would like to acknowledge constructive feedback provided by Lisa Romero, DrPH, MPH and Shanna Cox, MSPH in the Division of Reproductive Health and Patricia Dittus, PhD in the Division of Adolescent and School Health at the U.S. Centers for Disease Control and Prevention
The findings and conclusions in this report are those of the authors and do not necessarily represent the official position of the Centers for Disease Control and Prevention.
No financial disclosures were reported by any of the authors of this paper.
Footnotes
CREDIT AUTHOR STATEMENT
Greta Kilmer: Conceptualization; Data curation; Formal analysis; Investigation; Methodology; Visualization; Roles/Writing – original draft; Writing – review & editing. Michelle Leon-Nguyen: Conceptualization; Data curation; Formal analysis; Investigation; Methodology; Validation; Roles/Writing & original draft; Writing – review & editing. Jennifer Smith-Grant: Conceptualization; Data curation; Formal analysis; Project administration; Roles/Writing – original draft; Writing – review & editing. Anna W. Brittain: Conceptualization; Methodology; Project administration; Roles/Writing – original draft; Writing – review & editing. Adriana Rico: Conceptualization; Data curation; Methodology; Project administration; Roles/Writing – original draft; Writing – review & editing.Susan H. Adkins: Conceptualization; Investigation; Methodology; Supervision; Roles/Writing – original draft; Writing – review & editing. Connie Lim: Conceptualization; Data curation; Investigation; Methodology; Validation; Roles/Writing –original draft; Writing – review & editing. Leigh E. Szucs: Conceptualization; Investigation; Methodology; Supervision; Roles/Writing – original draft; Writing – review & editing.
SUPPLEMENTAL MATERIAL
Supplemental materials associated with this article can be found in the online version at https://doi.org/10.1016/j.amepre.2022.04.020.
REFERENCES
- 1.Trussell J, Aiken AR, Micks E, Guthrie KA. Efficacy, safety, and personal considerations. Contraceptive Technology Mishawaka, IN: Ayer Company Publishers, Inc., 2018. [Google Scholar]
- 2.Trussell J Contraceptive failure in the United States. Contraception 2011;83(5):397–404. 10.1016/j.contraception.2011.01.021. [DOI] [PMC free article] [PubMed] [Google Scholar]
- 3.Committee Opinion No. 710: Counseling adolescents about contraception. Obstet Gynecol 2017;130(2):e74–e80. 10.1097/AOG.0000000000002234. [DOI] [PubMed] [Google Scholar]
- 4.MacGregor KE, Khadr SN. Contraception for adolescents (American Academy of Pediatrics). Arch Dis Child Educ Pract Ed 2016;101(2):61–64. 10.1136/archdischild-2014-307955. [DOI] [PubMed] [Google Scholar]
- 5.Centers for Disease Control and Prevention. Youth Risk Behavior Survey Data Summary & Trends Report 2009–2019 Atlanta, GA: Centers for Disease Control and Prevention, 2019. https://www.cdc.gov/healthyyouth/data/yrbs/pdf/YRBSDataSummaryTrendsReport2019-508.pdf. Accessed May 5, 2022. [Google Scholar]
- 6.Martin JA, Hamilton BE, Osterman MJK, Driscoll AK. Births: final data for 2018. Natl Vital Stat Rep 2019;68(13):1–47. [PubMed] [Google Scholar]
- 7.Romero L, Pazol K, Warner L, et al. Reduced disparities in birth rates among teens aged 15–19 years - United States, 2006–2007 and 2013–2014. MMWR Morb Mortal Wkly Rep 2016;65(16):409–414. 10.15585/mmwr.mm6516a1. [DOI] [PubMed] [Google Scholar]
- 8.Sedgh G, Finer LB, Bankole A, Eilers MA, Singh S. Adolescent pregnancy, birth, and abortion rates across countries: levels and recent trends. J Adolesc Health 2015;56(2):223–230. 10.1016/j.jadohealth.2014.09.007. [DOI] [PMC free article] [PubMed] [Google Scholar]
- 9.Tyler CP, Warner L, Gavin L, Barfield W, Centers for Disease Control and Prevention (CDC). Receipt of reproductive health services among sexually experienced persons aged 15–19 years–National Survey of Family Growth, United States, 2006–2010. MMWR Suppl 2014;63 (2):89–98. [PubMed] [Google Scholar]
- 10.Brindis CD, Morreale MC, English A. The unique health care needs of adolescents. Future Child 2003;13(1):117–135. 10.2307/1602643. [DOI] [PubMed] [Google Scholar]
- 11.Szucs LE, Lowry R, Fasula AM, et al. Condom and contraceptive use among sexually active high school students - Youth Risk Behavior Survey, United States, 2019. MMWR Suppl 2020;69(1):11–18. 10.15585/mmwr.su6901a2. [DOI] [PMC free article] [PubMed] [Google Scholar]
- 12.Spencer DL, McManus M, Call KT, et al. Health care coverage and access among children, adolescents, and young adults, 2010–2016: implications for future health reforms. J Adolesc Health 2018;62 (6):667–673. 10.1016/j.jadohealth.2017.12.012. [DOI] [PMC free article] [PubMed] [Google Scholar]
- 13.Schubel J Expanding Medicaid for parents improves coverage and health for both parents and children Washington, DC: Center on Budget and Policy Priorities, 2021. https://www.cbpp.org/research/health/expanding-medicaid-for-parents-improves-coverage-and-health-for-both-parents-and. Published June 14. Accessed May 5, 2022. [Google Scholar]
- 14.Gangopadhyaya A, Johnston EM. Impacts of the ACA’s Medicaid expansion on health insurance coverage and health care access among young adults Washington, DC: Urban Institute, 2021. https://www.urban.org/research/publication/impacts-acas-medicaid-expansion-health-insurance-coverage-and-health-care-access-among-young-adults. Published February 18, 2021. Accessed May 25, 2022. [Google Scholar]
- 15.Williams EGR. How Could the build back better act affect uninsured children? San Francisco, CA: Kaiser Family Foundation, 2021. https://www.kff.org/medicaid/issue-brief/how-could-the-build-back-better-act-affect-uninsured-children/. Published November 11. Accessed May 5, 2022. [Google Scholar]
- 16.Gavin L, Moskosky S, Carter M, et al. Providing quality family planning services: recommendations of CDC and the U.S. Office of Population Affairs. MMWR Recomm Rep 2014;63(RR-04):1–54. https://www.cdc.gov/mmwr/preview/mmwrhtml/rr6304a1.htm. Accessed May 25, 2022. [PubMed] [Google Scholar]
- 17.Committee Opinion No. 642: Increasing access to contraceptive implants and intrauterine devices to reduce unintended pregnancy. Obstet Gynecol 2015;126(4):e44–e48. 10.1097/AOG.0000000000001106. [DOI] [PubMed] [Google Scholar]
- 18.Centers for Disease Control and Prevention. The 6|18 initiative evidence summary: prevent unintended pregnancy Atlanta, GA: Centers for Disease Control and Prevention, 2015. https://www.cdc.gov/sixeighteen/docs/6-18-evidence-summary-pregnancy.pdf. Published December 2015. Accessed May 25, 2022. [Google Scholar]
- 19.Welti KM, Manlove J. How increasing the use of effective contraception could reduce unintended pregnancy and public health care costs Bethesda, MD: Child Trends, 2017. https://www.childtrends.org/wp-content/uploads/2017/03/2017-03IncreasingEffectiveContraception.pdf. Published February 2017. Accessed May 25, 2022. [Google Scholar]
- 20.Darney BG, Jacob RL, Hoopes M, et al. Evaluation of Medicaid expansion under the Affordable Care Act and contraceptive care in U.S. community health centers. JAMA Netw Open 2020;3(6):e206874. 10.1001/jamanetworkopen.2020.6874. [DOI] [PMC free article] [PubMed] [Google Scholar]
- 21.Kaiser Family Foundation. Status of state Medicaid expansion decisions: interactive Map San Francisco, CA: Kaiser Family Foundation, 2022. https://www.kff.org/medicaid/issue-brief/status-of-state-medicaid-expansion-decisions-interactive-map/. Published April 26, 2022. Accessed May 25, 2022. [Google Scholar]
- 22.Underwood JM, Brener N, Thornton J, et al. Overview and methods for the Youth Risk Behavior Surveillance System - United States, 2019. MMWR Suppl 2020;69(1):1–10. 10.15585/mmwr.su6901a1. [DOI] [PMC free article] [PubMed] [Google Scholar]
- 23.YRBSS data & documentation Centers for Disease Control and Prevention. https://www.cdc.gov/healthyyouth/data/yrbs/data.htm. Updated May 2, 2022. Accessed May 25, 2022. [Google Scholar]
- 24.Caniglia EC, Murray EJ. Difference-in-difference in the time of cholera: a gentle introduction for epidemiologists. Curr Epidemiol Rep 2020;7(4):203–211. 10.1007/s40471-020-00245-2. [DOI] [PMC free article] [PubMed] [Google Scholar]
- 25.Ponce NB, Becker T, Babey S, et al. Improving data capacity for American Indian/Alaska Native (AIAN) populations in federal health surveys Washington, DC: Assistant Secretary for Planning and Evaluation, HHS, 2019. https://aspe.hhs.gov/system/files/pdf/263361/improving-data-capacity-aian.pdf. Published October 1, 2019. Accessed May 25, 2022. [Google Scholar]
- 26.Centers for Disease Control and Prevention. Conducting trend analyses of YRBS data Atlanta, GA: Centers for Disease Control and Prevention, 2020. https://www.cdc.gov/healthyyouth/data/yrbs/pdf/2019/2019_YRBS_Conducting_Trend_Analyses.pdf. Published August 2020. Accessed May 25, 2022. [Google Scholar]
- 27.SUDAAN. Version 11.0.3. RTI International. [Google Scholar]
- 28.SAS. SAS Institute. [Google Scholar]
- 29.Dalton VK, Moniz MH, Bailey MJ, et al. Trends in birth rates after elimination of cost sharing for contraception by the Patient Protection and Affordable Care Act. JAMA Netw Open 2020;3(11):e2024398. 10.1001/jamanetworkopen.2020.24398. [DOI] [PMC free article] [PubMed] [Google Scholar]
- 30.1991–2019 high school youth risk behavior survey data Centers for Disease Control and Prevention. http://nccd.cdc.gov/youthonline/. Accessed May 25, 2022. [Google Scholar]
- 31.Federal funding for services “received through” an IHS/tribal facility and furnished to medicaid-eligible American Indians and Alaska Natives. Centers for Medicare and Medicaid Services; https://www.medicaid.gov/medicaid/indian-health-medicaid/tribal-affairs-guidance-resources/med-icaid-services-received-through-indian-health-servicetribal-facility-request-for-comment/index.html. Accessed May 25, 2022. [Google Scholar]
- 32.Indian health manual. Indian Health Service https://www.ihs.gov/ihm/pc/. Accessed May 25, 2022.
- 33.Fuerst MF, George KE, Moore JE. Long-acting reversible contraception in Medicaid: where do we go from here? Womens Health Issues 2021;31(4):310–313. 10.1016/j.whi.2020.11.010. [DOI] [PubMed] [Google Scholar]
- 34.Wright KQ. Contraceptive selection and practice: associations with self-identified race and socioeconomic disadvantage. Soc Sci Med 2020;266:113366. 10.1016/j.socscimed.2020.113366. [DOI] [PMC free article] [PubMed] [Google Scholar]
- 35.Brandi K, Fuentes L. The history of tiered-effectiveness contraceptive counseling and the importance of patient-centered family planning care. Am J Obstet Gynecol. 2020;222(4S):S873–S877. 10.1016/j.ajog.2019.11.1271. [DOI] [PubMed] [Google Scholar]
- 36.Moyano N, Granados R, Durán CA, Galarza C. Self-esteem, attitudes toward love, and sexual assertiveness among pregnant adolescents. Int J Environ Res Public Health 2021;18(3):1270. 10.3390/ijerph18031270. [DOI] [PMC free article] [PubMed] [Google Scholar]
- 37.Ranji US, Salganicoff A, Sobel L, Gomez I. Financing family planning services for low-income women: the role of public programs San Francisco, CA: Kaiser Family Foundation, October 2019. https://www.kff.org/wp-content/uploads/2019/10/Issue-Brief-Financing-Family-Planning-Services-for-Low-income-Women-1.pdf. Published October 2019. Accessed May 25, 2022. [Google Scholar]
- 38.Guttmacher Institute. An overview of consent to reproductive health services by young people New York, NY: Guttmacher Institute, 2022. https://www.guttmacher.org/print/state-policy/explore/overview-minors-consent-law. Published May 1, 2022. Accessed May 25, 2022. [Google Scholar]
- 39.Mazur A, Brindis CD, Decker MJ. Assessing youth-friendly sexual and reproductive health services: a systematic review. BMC Health Serv Res 2018;18(1):216. 10.1186/s12913-018-2982-4. [DOI] [PMC free article] [PubMed] [Google Scholar]
- 40.Garnett C, Pollack L, Rodriguez F, Renteria R, Puffer M, Tebb KP. The association between nonbarrier contraceptive use and condom use among sexually active Latina adolescents. J Adolesc Health 2021;68 (5):985–990. 10.1016/j.jadohealth.2020.07.044. [DOI] [PubMed] [Google Scholar]
- 41.Condom availability programs (CAPs) in schools: things to consider Centers for Disease Control and Prevention, 2019. https://www.cdc.gov/healthyyouth/healthservices/caps/caps_things-to-consider.htm. Updated October 24. Accessed March 10, 2022. [Google Scholar]
- 42.Frost JJ, Mueller J, Pleasure ZH. are, 2006–2019. Trends and differentials in receipt of sexual and Reproductive Health Services in The United States: services received and sources of c New York, NY: Guttmacher Institute, 2021. https://www.guttmacher.org/sites/default/files/report_pdf/sexual-reproductive-health-services-in-us-sources-care-2006-2019.pdf. Published June 2021. Accessed May 25, 2022. [Google Scholar]
- 43.Teen pregnancy prevention (TPP) program HHS. https://opa.hhs.gov/grant-programs/teen-pregnancy-prevention-program-tpp. Accessed May 25, 2022. [Google Scholar]
- 44.Kroelinger CD, Waddell LF, Goodman DA, et al. Working with state health departments on emerging issues in maternal and child health: immediate postpartum long-acting reversible contraceptives. J Womens Health (Larchmt) 2015;24(9):693–701. 10.1089/jwh.2015.5401. [DOI] [PMC free article] [PubMed] [Google Scholar]
- 45.Association of State and Territorial Health Officials. Increasing access to contraception: immediate postpartum long-acting reversible contraception (LARC) Atlanta, GA: Association of State and Territorial Health Officials. https://www.astho.org/globalassets/brief/increasing-access-to-contraception-infographic-series-larc.pdf. Accessed May 25, 2022. [Google Scholar]
- 46.World Health Organization. Global consensus statement for expanding contraceptive choice for adolescents and youth to include long-acting reversible contraception Geneva, Switzerland: World Health Organization. https://www.familyplanning2020.org/sites/default/files/Global%20Consensus%20Statement%20-%20Expanding%20Contraceptive%20Choice.pdf. Accessed May 25, 2022. [Google Scholar]
- 47.Prevention status reports: teen pregnancy Centers for Disease Control and Prevention, 2019. https://wwwn.cdc.gov/psr/NationalSummary/NSTP.aspx. Published April 10, 2019. Accessed May 25, 2022. [Google Scholar]
- 48.Underwood JM, Brener N, Halpern-Felsher B. Tracking adolescent health behaviors and outcomes: strengths and weaknesses of the youth risk behavior surveillance system. NAM Perspect 2020;2020. 10.31478/202010a. [DOI] [PMC free article] [PubMed] [Google Scholar]
Associated Data
This section collects any data citations, data availability statements, or supplementary materials included in this article.