

Summary
microRNAs (miRNAs) are small regulatory RNAs that repress target mRNA transcripts through base pairing. Although the mechanisms of miRNA production and function are clearly established, new insights into miRNA regulation or miRNA-mediated gene silencing are still emerging. In order to facilitate the discovery of miRNA regulators or effectors, we have developed sRNA-Effector, a machine learning algorithm trained on enhanced crosslinking and immunoprecipitation sequencing and RNA sequencing data following knockdown of specific genes. sRNA-Effector can accurately identify known miRNA biogenesis and effector proteins and identifies 9 putative regulators of miRNA function, including serine/threonine kinase STK33, splicing factor SFPQ, and proto-oncogene BMI1. We validated the role of STK33, SFPQ, and BMI1 in miRNA regulation, showing that sRNA-Effector is useful for identifying new players in small RNA biology. sRNA-Effector will be a web tool available for all researchers to identify potential miRNA regulators in any cell line of interest.
Subject areas: Nucleic acids, Gene network, Biocomputational method, Machine learning
Graphical abstract
Highlights
-
•
sRNA-Effector is a machine learning algorithm based on known features of RBPs
-
•
The algorithm is trained on a large cohort of transcriptomics and eCLIP data
-
•
User can use it to predict miRNA binders or effectors from gene expression data
-
•
Predicted miRNA regulation by STK33, SFPQ, and BMI1 was validated by experiments
Nucleic acids; Gene network; Biocomputational method; Machine learning
Introduction
The cellular small RNA (sRNA) pool is largely composed of microRNA (miRNA) and tRNA fragments (tRFs), with contributions of fragments from other longer RNAs, such as snoRNAs, rRNAs, and mRNAs.1,2 miRNAs are the most well-studied group of sRNAs, and their function and biogenesis have been well characterized. miRNA biogenesis begins with transcription by RNA polymerase II, followed by cleavage of the primary miRNA by the microprocessor complex composed of DROSHA and DGCR8. The resulting precursor miRNA is then exported from the nucleus to the cytoplasm where it is cleaved by DICER1. Finally, one strand of the mature miRNA is selected for stable argonaute entry, forming the functional RNA-induced silencing complex (RISC).3
Despite the seemingly well-understood gene silencing function of miRNAs, intricate regulation on miRNA activity is still being uncovered. After their biogenesis, miRNAs are subjected to different regulatory mechanisms, such as uridylation of mature miRNAs and their subsequent degradation by DIS3L2.4 Precursor miRNAs are also regulated by uridylation and the RNA exosome.5,6 Another miRNA regulatory process involves target-directed miRNA degradation (TDMD). TDMD is a process in which target RNAs that are highly complementary to miRNAs lead to the degradation of that miRNA. Recently, ZSWIM8, a component of an E3 ubiquitin ligase complex, has been shown to play an integral role in TDMD and was identified using a large-scale CRISPR reporter screen.7,8
These data suggest that RISC function is tightly regulated, and perhaps more regulators await to be discovered. We propose that miRNA regulators can be identified faster and using fewer resources by leveraging the use of publicly available data. Our approach relies on the assumption that miRNAs repress gene expression and so an alteration in the level or activity of an miRNA will specifically alter the levels of the miRNA target mRNAs relative to non-target mRNAs. Thus, for example, after DICER1 knockdown, the resulting decrease in miRNA levels is expected to upregulate many miRNA targets relative to non-targets. We will use the changes in mRNA levels following knockdown of various cellular proteins as a readout of miRNA levels or activity and thus identify potential miRNA regulators or effectors. Interestingly there is an extensive collection of publicly available data in the form of microarray and mRNA sequencing datasets, following knockdown of various cellular proteins, many not yet implicated in miRNA regulation. In addition, we utilized features from enhanced crosslinking and immunoprecipitation (eCLIP) data from ENCODE9 to identify proteins associated with miRNAs. Combining the two sets of data using machine learning, we developed sRNA-Effector to predict miRNA regulators or effectors. sRNA-Effector robustly identifies known miRNA effector proteins and predicts several players in sRNA regulation. sRNA-Effector predicted a role of STK33, SFPQ, and BMI1 as possible regulators, and we validated these predictions, establishing the utility of sRNA-Effector for sRNA regulator discovery.
Results
Knockdown RNA sequencing (RNA-seq) data can reveal miRNA effectors
At the time of writing, there are over 5,000 datasets in the Gene Expression Omnibus (GEO) database associated with the term “knockdown” for human cell lines and tissues. There are an additional ∼1,000 datasets associated with the term “knockout.” These data represent experiments completed by various laboratories that could be used to establish reproducibility and establish insights into biology by assessing concordant effects on miRNA targets following knockdown/knockout of genes. We reason that depletion of a gene important for miRNA biogenesis, function, or regulation would alter the levels of that miRNA and subsequently alter the expression of that miRNA’s target genes which could be detected by microarray or RNA-seq. For example, if the key miRNA biogenesis factor DROSHA is knocked down, miRNA levels are expected to decrease and miRNA target expression is expected to increase (Figure 1A). A decrease in miRNA targets would suggest an overall increase in miRNA activity, which would be expected for knockdown of a negative regulator of miRNA activity. Alternatively, knockdown of a gene unrelated to regulating miRNA levels or activity is not expected to alter miRNA target genes in a concerted fashion, and thus no difference between miRNA targets and non-targets would be observed. A general increase in a specific miRNA’s target level relative to non-targets can be visualized using a cumulative distribution function (CDF) plot. We employed a summary metric, effect size (ES, expressed in log2 scale; details in STAR Methods and Figure 1A), to measure the degree of repression or derepression of targets relative to non-targets. A negative ES means that an miRNA’s targets are repressed relative to non-targets, and a positive ES means that an miRNA’s targets are derepressed relative to non-targets.
Figure 1.

Effect of depletion of known miRNA effectors on miRNA targets
(A) Schematic overview of identification of miRNA effectors using gene expression data following perturbation of a gene of interest (GOI). Effect size (ES) is the horizontal shift of the target curve relative to the non-target curve at the 0.5 mark on the Y axis.
(B) Effect sizes for miRNA targets after DROSHA depletion.
(C and D) CDF plots of miR-19a-3p′s targets affected by DROSHA or DICER knockdown.
(E) Heatmap of effect sizes for miRNA targets after depletion of other known miRNA effectors: DICER (HeLa), DGCR8 (HeLa), and AGO2 (HCT116). Each column corresponds to a different miRNA.
To test whether this approach can successfully identify the known miRNA regulators, such as DROSHA, DICER, DGCR8, and AGO2, we examined four independent publicly available RNA-seq and RNA microarray datasets after individual miRNA regulators have been knocked down.10,11 We first identified miRNAs considered high confidence in miRBase12,13 and annotated in MirGeneDB, a manually curated database that annotates validated miRNAs.14 Recognizing that the choice of miRNA target prediction tool could influence our ES analysis, we then compared three different miRNA target prediction tools head to head: miRDB,15 TargetScan 8.0,16 and miRTarBase.17 We found that miRDB-predicted targets had the most positive ES after knockdown of important and known miRNA effectors (Figure S1), suggesting that miRDB captured the most targets compared to TargetScan 8.0 and miRTarBase. We therefore decided to proceed with miRDB-predicted targets for further analysis. To determine if ES analysis can be used in both microarray and RNA-seq datasets, we compared ES in HeLa cells depleted of DGCR8. There was a significant correlation in ES of different miRNAs between the microarray (GSE13640) and RNA-seq (GSE73376) studies (Pearson correlation coefficient = 0.15, p value = 7.973e-05), and the median ESs were comparable at 0.057 for the microarray dataset and 0.075 for the RNA-seq dataset (Figure S2). These data show that ES analysis can be used on both microarray and RNA-seq data. miRNA targets were generally derepressed relative to targets as indicated by a positive ES for most miRNAs after DROSHA depletion (Figure 1B). Some CDF plots are shown as examples in Figures 1C and 1D. Similar to our DROSHA findings, depletion of DICER, DGCR8, and AGO2 all resulted in most miRNA targets being derepressed as evidenced by the positive ES (Figure 1E; Table S1). Although the general trend is obvious, the variations in the behavior of individual miRNAs may be revealing underlying differences in miRNA regulation, differences in cell lines, or differences in experimental approach. Together, these data show that publicly available gene expression data can be used to identify known miRNA effector proteins.
RNA-seq data after large-scale knockdown or knockout experiments can be used to screen for miRNA effectors
Since we established that analysis of the transcriptome after depletion of known miRNA effectors can indirectly reveal changes in miRNA level or function, we wanted to extend our analysis to a larger screen. To do this, we took advantage of the large-scale short hairpin RNA (shRNA) experiments followed by RNA-seq available from the ENCODE consortium.9 These datasets include known miRNA effectors allowing us to monitor the utility of this approach with this dataset. There were 237 genes knocked down in HepG2 cells and 235 genes knocked down in K562 cells. Of these genes, 209 were knocked down in both datasets. The list of genes is available in Table S2. Analysis in both cell lines allows us to screen for putative miRNA effectors that are broadly involved in the regulation of miRNAs regardless of cell type and also allows discovery of cell-type-specific miRNA effectors.
We first calculated the ES at 50th percentile for the targets of high-confidence miRNAs (as defined by miRBase12,13) in the DROSHA shRNA RNA-sequencing (RNA-seq) data from HepG2. Knockdown of DROSHA resulted in an induction of most miRNA targets (positive ES), confirming that the analysis is capable of picking up bona fide miRNA effectors in the ENCODE dataset (Figure 2A; Table S3). Next, we calculated the ES for the targets of high-confidence miRNA for each of the genes that were depleted in HepG2 (Tables S3 and S4). We also evaluated the significance of the difference in the CDF plots of targets vs. non-targets by using the Wilcoxon rank-sum test and kept an ES only when p < 0.05. Knockdown of 15 genes had a significant ES on the targets of more than half of the miRNAs, suggesting a broad role in the up- or downregulation of miRNAs, e.g., U2AF2, XRN2, and BCCIP (Figure 2B). For a given gene, we also averaged the significant ES across miRNAs in order to determine whether there is a general negative or positive effect on miRNA targets, suggesting up- or downregulation of the miRNAs, respectively, after the knockdown of the gene. Intriguingly, splicing-related genes GEMIN5, RAVER1, and U2AF2 were the top three genes whose knockdown is associated with an average positive ES, suggesting that these genes promote miRNA levels or function (Figure 2C). Despite not affecting a large proportion of miRNAs, SRSF7, PPIL4, and AKAP1 were the top three genes associated with a negative average ES, suggesting their role in potentially reducing the levels of miRNAs or their function (Figure 2C).
Figure 2.

Effect sizes measured by RNA-seq after shRNA knockdown of different genes identify known and previously unknown putative miRNA effectors
(A) Distribution of effect sizes for different miRNAs after DROSHA knockdown in HepG2.
(B) Ranking of genes by fraction of miRNAs showing significant effect sizes after knockdown of the gene in HepG2.
(C) Gene list as in (B) but by the average of significant effect size from negative ES to positive ES.
(D–F) Same as (A–C) but in K562 cells. Red labels in F indicate genes that have the most extreme ES in either direction in HepG2 cells. Also in red is RBM39. ES, effect size.
We conducted the same analysis for K562 cells (Table S4) and found that DROSHA knockdown also led to a general increase in miRNA target expression as exemplified by a positive ES distribution (Figure 2D). In contrast to HepG2 cells, there were no genes that appeared to alter more than half of high-confidence miRNAs (Figure 2E). In both HepG2 and K562, RBM39 was among the top genes whose depletion affected the targets of a large number of miRNAs, as measured by ESs (Figure 2E). SERBP1, AQR, and RPS3 were the top three genes associated with a positive average ES while genes RBM22, PTBP1, and FAM120A were the top three genes associated with an average negative ES (Figure 2F). Consistent with the HepG2 findings, the depletion of splicing factors U2AF2, RAVER1, and RBM39 also correlated with a positive ES, suggesting that these three genes promote miRNA levels and function in a cell-type-independent manner (Figure 2F). Intriguingly, 30 (out of 60) miRNA targets appear to be regulated in the same direction by these three splicing factors. (Figure S3). 83% of these 30 miRNAs are located in introns, compared to the global average of about 41%–50%,18,19,20 suggesting a role of these splicing factors in regulation of miRNAs located within introns. In contrast, comparing Figures 2C and 2F, SRSF7, PPIL4, and AKAP1 have effects in opposite directions, suggesting that they may have differing effects in different cell lines.
Direct RNA binding and sequencing studies add confidence to putative miRNA effectors
Our approach so far can reveal putative miRNA effectors but gives no information regarding whether putative effectors are acting directly or indirectly on miRNA. Additionally, orthogonal data to support or refute an effector’s role in miRNA regulation can increase the confidence in prediction based on the ESs. To this end, we determined whether the proteins of interest from Figure 2 bound miRNAs that are affected by that protein’s depletion using eCLIP data from HepG2 or K562 cells in ENCODE. As a positive control, we could clearly detect DGCR8 and DROSHA eCLIP RNA reads that map to the genome near the miR-20a and miR-186 loci in both cell lines (Figures 3A and 3B). We could also detect LIN28B binding to let-7 miRNAs in HepG2, consistent with the known function for LIN28B (Figure S4).21 Furthermore, we also find eCLIP reads near the miR-20a and miR-186 loci for several of the putative effectors identified by the ES approach (Figures 3A and 3B), suggesting that they too bind to the miRNAs or their precursors (either directly or indirectly via other proteins). These data suggest that the ES-based approach can identify proteins that interact with and alter the function of miRNAs. It also suggests that coupling the ES on targets of miRNAs after gene knockdown with eCLIP data will reduce noise in ES-based regulator/effector identification (Figure 3C). Such noise in the ES approach could come from indirect effects caused by gene knockdown. Alternatively, the ES approach may detect alterations in miRNA function mediated by proteins that do not directly interact with the miRNA or known miRNA effectors. For example, a transcription factor may not directly bind the miRNA but, instead, may regulate transcription of the pri-miRNA that gives rise to the pre-miRNA and mature miRNA. On the other hand, the eCLIP binding data may be limited by technical issues, such as immunoprecipitation efficiency, protein-RNA binding affinity, or RNA modifications that may interfere with RNA-seq. Thus, combining information from both datasets (ES from RNA-seq and eCLIP) would improve our ability to identify proteins that directly bind to and regulate miRNAs, but unfortunately eCLIP data are still limited in its availability.
Figure 3.

eCLIP sequencing data complements miRNA effector identification based on shRNA sequencing results
(A and B) eCLIP reads for putative miRNA effectors at the miR-20a (A) and miR-186 (B) locus shown on a gene browser. Each effector has two replicates in each cell type. Y axis indicates the effectors immunoprecipitated for the eCLIP reads. The thickness of the horizontal track is proportional to the read depth at that site.
(C) Overlap of effectors and binders from ENCODE HepG2 shRNA sequencing and eCLIP, respectively. Effectors are genes whose knockdown leads to a significant ES in the CDF plots of targets vs. non-targets for at least one miRNA (Wilcoxon rank-sum test p < 0.05). Binders are genes that have a significant peak called by the ENCODE pipeline on at least one miRNA locus from eCLIP. Genes in red text are genes that are binders and effectors for the same miRNA.
Strategy to train sRNA-Effector as a tool to predict miRNA effectors
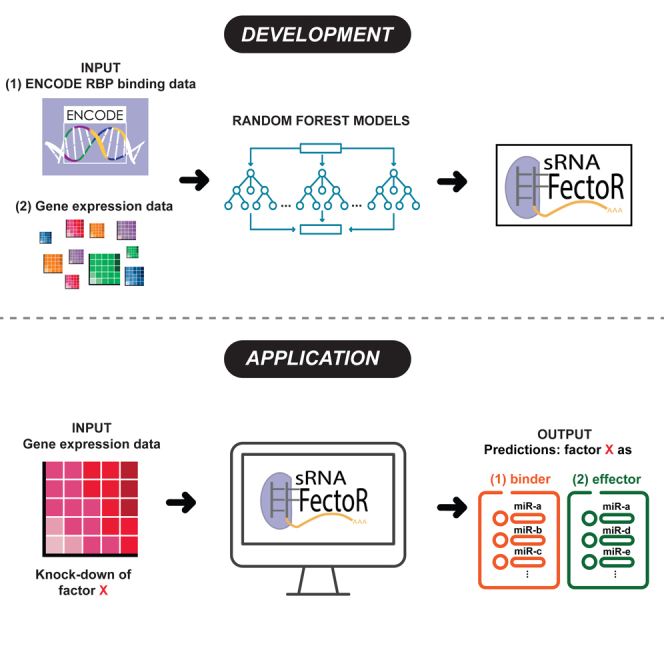
So far, we have shown that RNA-seq analysis after knockdown of genes combined with eCLIP data can be used to identify known and previously unknown miRNA effectors. However, given the thousands of transcriptome profiling datasets and the relative paucity of direct protein-RNA interaction data available, we sought to develop a machine learning algorithm that will identify an miRNA effector without the use of eCLIP data (Figure 4A). To do this, we first defined the ground truth, the binding or effecting capability of a pool of 62 proteins identified earlier using both ENCODE RNA-seq experiments after shRNA knockdown and the peaks from the ENCODE eCLIP dataset from HepG2 cells (Table S5). We did not use the K562 dataset because of the strange result that DROSHA does not appear to have a large effect on a large proportion of miRNA targets in K562. There are several possible explanations for this, including inadequate DROSHA depletion to detect robust miRNA target effects in K562, miRNAs being unusually stable in K562, or alternative biogenesis mechanisms that are more prominent in K562. It is also possible that DROSHA has roles outside of miRNA biogenesis that are more prominent in K562 cells. To get an idea of whether DROSHA may have functions outside of miRNA biogenesis in K562 cells, we analyzed miRNA peaks and peaks outside the miRNAome. We identified 78 miRNAs with peaks in HepG2 cells and 73 miRNAs with peaks in K562 cells. There were 40 miRNAs with peaks in common between the two cell lines. On the other hand, there were 1,483 genes with DROSHA peaks in K562 cells and 489 genes with DROSHA peaks in HepG2. The nearly 3-fold difference in peaks outside miRNAs in K562 compared to HepG2 suggests the possibility that DROSHA has alternative functions in K562 cells. Regardless of the mechanism, we did not include the ENCODE K562 shRNA-seq and eCLIP data in the ground-truth dataset because of the unclear effects of DROSHA depletion on miRNAs and their targets. An effector was defined by a significant Wilcoxon rank-sum test in the CDF plots of targets vs. non-target after the gene knockdown, and a protein was considered an miRNA binder if there was an eCLIP peak at the miRNA locus. This resulted in four different classifications for genes (outcomes): "BinderEffector," "notBinderEffector," "BinderNotEffector," and "notBinderNotEffector." After establishing the ground-truth data, we devised a set of features to help predict the outcome without eCLIP data. The features describe the miRNA (i.e., the miRNA sequence), protein (i.e., physicochemical properties, presence or absence of miRNA-specific gene ontology [GO] terms), and target repression (i.e., ES, Wilcoxon rank-sum test p value) (Table 1 and STAR Methods). We then separated the ground-truth data into three parts: 80% for training, 10% for validation, and 10% for testing.
Figure 4.

A predictive model of miRNA effector discovery
(A) Schematic showing the overall approach for development of a model to predict miRNA effectors.
(B) Validation to evaluate the various models. Outcome metrics accuracy and mean F1 score (the average of the F1 scores for each predicted outcome) for the various tested models in the validation dataset. Gbm = gradient boosted machine, mlpWeightDecayML = multilayer perceptron with tunable hyperparameters weight and decay, nnet = neural network with a single layer, ranger = random forest, svmLinear2 = Support Vector Machines with Linear Kernel.
(C) Receiver operator characteristic curve and average area under the curve results generated by the random forest model on the test dataset. There are four curves (representing each of the four possible classifications) that almost completely overlap.
(D and E) External validation of the random forest model on shDROSHA and shDICER microarray data. 405 out of 636 high-confidence miRNAs were predicted to be bound and affected by DROSHA. 416 out of 636 high-confidence miRNAs were predicted to be bound and affected by DICER1.
Table 1.
sRNA-Effector features
| Feature category | Feature (see STAR Methods for details) |
|---|---|
| Target repression | ES50 |
| ES90 | |
| ES10 | |
| p value | |
| FDR | |
| SDtargets | |
| SDnontargets | |
| miRNA sequence | numerically encoded pre-miRNA sequence |
| Query protein features (physicochemical & Gene Ontologies) | aliphatic index |
| Boman (Potential Protein Interaction) index | |
| theoretical net charge of the protein sequence | |
| hydrophobicity index | |
| instability index | |
| molecular weight | |
| isoelectric point | |
| Cruciani properties | |
| Kidera factors | |
| protFP descriptors | |
| regulation of translation (GO:0006417) | |
| response to virus (GO:0009615) | |
| miRNA metabolic process (GO:0010586) | |
| double-stranded RNA binding (GO:0003725) | |
| nuclease activity (GO:0004518) | |
| RNA helicase activity (GO:0003724) | |
| RNA catabolic process (GO:0006402) |
Further details in STAR Methods.
∗Abbreviations: ES50, effect size at 50th percentile; ES90, effect size at 90th percentile; ES10, effect size at 10th percentile; SD, standard deviation.
In order to identify the most effective machine learning algorithm, we trained four different algorithms: gradient boosted machines, support vector machines, neural networks, and random forests. Before training, the data were pre-processed by centering (subtracting the mean of each feature from all values in that feature), and scaling (dividing the values in a feature by the standard deviation of that feature). During training, 10-fold cross-validation was performed to further optimize the algorithms. 10-fold cross-validation splits the training data into 10 equal parts, trains on 9 parts, and then tests on the remaining 1 part. This process is repeated until all parts have been used as a test set and performance metrics are averaged across all sets. After training, all four algorithms were tested on the 10% of the unseen ground-truth validation data for model selection. All algorithms performed well on the unseen validation data by outcome metric mean accuracy (the number of correct predictions divided by the total number of predictions). They also performed well on another outcome metric: mean F1 metric. The F1 metric is the harmonic mean of precision (ratio of true positives to total predicted positives) and recall (ratio of predicted true positives to all positives in the ground truth). The F1 gives a more holistic view of the algorithms’ performance than accuracy alone because it incorporates both precision and recall. We use a “mean” accuracy and F1 since there are four different outcomes and therefore four different F1 scores. All algorithms performed relatively well on accuracy and F1 scores during validation, with random forest and gradient boosted machines performing the best (Figure 4B); we therefore picked the fully trained random forest model as the final model we term “sRNA-Effector” and applied it to the 10% dataset aside as test data. A receiver operator characteristic curve and area under the curve analysis shows an average of 0.9962 for prediction of each of the four classes using the random forest model on the test dataset (Figure 4C).
For external validation of the model we turned to independently derived microarray data for RNA-level changes following knockdown of key miRNA biogenesis genes DROSHA and DICER in MDA-MB-231 breast cancer cell lines22 (GSE48160). Here we are not using any eCLIP or RNA-seq data that were used to develop the model. Following feature curation for these two datasets, we asked whether sRNA-Effector classifies DROSHA and DICER as miRNA binders and/or effectors. In this validation DROSHA and DICER are predicted to bind and regulate ∼60% of miRNAs using only the three sets of features (repression effects from microarray, miRNA features, and protein features) that did not include eCLIP data (Figures 4D and 4E). Given earlier findings that DROSHA depletion does not have a dramatic effect on a large proportion of miRNA targets in K562, we also ran sRNA-Effector on the ENCODE shDROSHA dataset from K562 and an independent DROSHA knockdown dataset also conducted in K562 cells. In both datasets, DROSHA was depleted about 2-fold, yet very few miRNAs were predicted to be bound and affected by DROSHA knockdown (Figure S5 compared to Figure 4D). These data show that sRNA-Effector is also capable of detecting cell-type-specific differences in miRNA effector function, though some of the differences could be due to variability in the knockdown of the test gene (DROSHA in this case).
Using sRNA-Effector to predict putative miRNA effectors from independent datasets
To use sRNA-Effector to screen for miRNA effectors, we processed 55 independent microarray datasets with knockdown ≥2-fold, together covering 41 genes. The majority of genes are predicted by sRNA-Effector to not bind miRNAs but can still affect activity of some miRNAs (Figure 5A: top group “NotBinderEffector”; Table S6). In addition, 13 microarray datasets revealed 9 genes that are predicted to bind and affect miRNAs (Figure 5A, bottom group; Table S7). We proceeded to investigate the hits from both categories.
Figure 5.

Discovery of small RNA effectors using sRNA-Effector
(A) Heatmap of sRNA-Effector predicted classifications for 55 microarray datasets from the GEO database. Note color is on log2 scale with a pseudocount of 0.001 added to avoid log2 of zero. The bold genes are the ones followed up for validation.
(B–E) STK33 knockdown or inhibition derepresses specific miRNA targets. B) Distribution of effect size (ES) for miRNA targets after STK33 knockdown (GSE15151). (C and D) Luciferase reporter assay for miR-186-5p (C) and miR-92a-3p (D) after inhibition of STK33 with ML281 (p value by one-sample t test, n = 7; data are represented as mean ± SE). (E) miR-186-5p level is not altered by ML281 treatment (20 μM, 48 h). miR expression is normalized to spike-in control and DMSO treatment (p value by one-sample t test, n = 3).
Case 1: sRNA-Effector identifies STK33 kinase as an miR effector
The “NotBinderEffector” genes predicted by sRNA-Effector might not be direct miRNA binders, but they may still affect miRNA levels or function. To validate sRNA-Effector’s ability to predict "NotBinderEffector" proteins, we decided to test the effect of kinase STK33 on miRNA function. We chose STK33 because it was predicted to affect a substantial proportion of miRNAs, had not been explored for its effects on miRNA regulation, is a protein kinase and AGO2 has been found to be regulated by phosphorylation,23 and could be readily inhibited by a commercially available compound ML281. Knockdown of STK33 in the GSE15151 dataset resulted in a positive ES distribution; therefore, STK33 likely increases miRNA levels or function (Figure 5B). miR-186-5p was predicted to be significantly affected but not bound by STK33 in the acute myeloid leukemia cell line SKM-1, while miR-92a-3p was not predicted to be bound or affected by STK33 in any cell line. Indeed, inhibition of STK33 in 293T with ML281 results in derepression of an miR-186-5p luciferase reporter (Figure 5C) but did not result in statistically significant alterations in an miR-92a-3p luciferase reporter (Figure 5D). Notably, the decreased miR-186-5p activity is not due to decreased miRNA level (Figure 5E), suggesting STK33 is modulating this miR’s activity by an unknown mechanism. Although miR-92a-3p levels appeared to increase with ML281, the result did not pass the test of significance.
Case 2: sRNA-Effector identifies miRs affected by SFPQ
The most intriguing hits by sRNA-Effector prediction are the nine factors categorized to bind and affect miRNAs (Figure 5A, bottom group “BinderEffector”). These represent potential direct miRNA regulators. Ranking the genes by the number of miRNAs predicted to be bound and affected placed BMI1 at the top of the rank list for binding and affecting the most miRNAs (∼300 out of ∼600 miRNAs tested) (Figure 6A). The second top prediction, SFPQ, has been shown to positively regulate maturation and/or repression by miRNAs, including miR-17-9224 and let-7.25 sRNA-Effector predicts 104 miRNAs to be bound and affected by SFPQ, including previously reported miR-17-5p, miR-19a-3p, miR-20a-5p, and miR-20b-5p. All predicted 104 miRs show an overall positive ES upon SFPQ knockdown (Figure 6B), indicating its role in upregulating miRNA level or activity. We decided to follow up on miR-182-5p, which displayed the most significant positive ES upon SFPQ knockdown (Table S7) and has not been shown to be regulated by SFPQ. After knocking down SFPQ in HeLa cells (Figure 6C), miR-182-5p repression activity was significantly decreased (its target was derepressed) (Figure 6D), confirming that SFPQ positively regulates the activity of this miR.
Figure 6.

sRNA-Effector identifies miRs affected by SFPQ
(A) Ranking of the 55 datasets by the proportion of miRNAs predicted to be bound and affected by knocked-down genes.
(B) Distribution of effect size (ES) for miRNA targets after SFPQ knockdown (GSE13857).
(C) SFPQ is knocked down by siRNA in HeLa cells. Relative SFPQ expression is normalized to U6 small RNA.
(D) SFPQ knockdown abrogated miR-182-5p repression activity, as measured by miRNA 3′ UTR dual-luciferase reporters (Y axis indicates siSFPQ versus siNC, p value by two-sample unpaired t test, n = 4, ∗∗∗p < 0.001). Data are represented as mean ± SD.
Case 3: sRNA-Effector predicts miR binder effectors such as BMI1
The success of using sRNA-Effector to identify known miR regulator SFPQ as the second top hit prompted us to look into the top hit BMI1. BMI1 is a proto-oncogene that functions to maintain the transcriptionally repressed state of genes as part of the Polycomb group multiprotein PRC1-like complex (PcG complex), and this not only represses genes directly but may also lead to some genes being induced indirectly.26 Intriguingly, BMI1 has not been shown to directly regulate miRs (Figure 7A; Table S7).To validate BMI1 as an miR regulator, we analyzed an independent dataset where BMI1 was knocked down in the cholangiocarcinoma cell line QBC939 followed by RNA-seq of both mRNAs and sRNAs (GSE163175).27 sRNA-Effector, using the repression features from the mRNA RNA-seq data along with the other two features, predicted that about 30% of miRNAs were bound and affected by BMI1 (Figure 7B). Using the short RNA sequencing data we determined the effect of BMI1 knockdown at level of expression of miRNAs. As expected, miRNA levels were both induced or repressed after shBMI1. The log2 fold change of miRNAs after shBMI1 was significantly negatively correlated with the ES obtained from RNA-seq after shBMI1 (Figure 7C), consistent with the idea that shBMI1 could regulate many miRNAs by affecting the abundance of the miRNAs. However the negative correlation coefficient of −0.23 leaves open the possibility that not all miRNAs are regulated by a change in abundance when BMI1 is knocked down.
Figure 7.

sRNA-Effector predicts miR binder effectors such as BMI1
(A) sRNA-Effector predicts both positive and negative miR binder effectors, including BMI1 as a novel negative regulator. See also Tables S7 and S8.
(B) Classification results of sRNA-Effector on a separate shBMI RNA sequencing experiment (GSE163175).
(C) Pearson correlation between effect size (ES) from shBMI1 RNA sequencing from (B) and the log2 fold change in miRNA after shBMI1 followed by small RNA sequencing (GSE163094) in QBC939 cells. Labeled points are a subset of points that have significant adjusted p values for both differential expression and ES, or (in red) the ones we validate experimentally in DAOY cells.
(D) BMI1 is knocked down by siRNA in DAOY cells. Relative BMI1 expression is normalized to ACTB.
(E) BMI1 knockdown enhanced miRNAs repression activity, as measured by miRNA 3′ UTR dual-luciferase reporters (Y axis indicates siBMI1 versus siNC, p value by two-sample unpaired t test, n = 4).
(F) miR levels after BMI1 knockdown. miR expression is normalized to spike-in control and siRNA negative control (p value by one-sample t test, n = 3, ∗∗∗p < 0.001). Data are represented as mean ± SD.
We therefore experimentally validated BMI1’s effect on miR activity in DAOY medulloblastoma cell line, the same cells where BMI1 were predicted to be a top miR binder effector (Figure 6A). We selected three miRNAs, miR-1343-3p, miR-504-5p, and miR-149-5p, based on negative ES after BMI1 knockdown in both QBC939 (Figure 7C) and DAOY (Table S7). Knocking down BMI1 by small interfering RNA (siRNA) (Figure 7D) significantly repressed the reporters targeted by these three miRNAs (Figure 7E) so that, if this was due to change in miRNA abundance, we would expect the miRNA levels to increase. However, the increased repression was not accompanied by increase in any of the three miR levels (Figure 7F), suggesting BMI1 is regulating the activities of these miRs by an unknown mechanism that does not involve change in the transcription or abundance of the miRs.
Discussion
A basic understanding of sRNA biology has led to the creation of pharmaceuticals with unprecedented specificity and durability. Continued elucidation of miRNA biology will help identify new ways to improve sRNA therapeutics. We are only just beginning to understand the metabolism and regulation of miRNAs by RNases such as the DIS3 family28,29,30 and TDMD.7,8,31,32,33,34 In this work we developed a new approach for identifying putative miRNA effectors by assessing effects on miRNA targets following perturbation of a gene of interest (termed ES analysis). As a proof of concept, we show a concerted derepression of miRNA targets after knockdown of DROSHA, known to be important for the biogenesis of most miRNAs. Similar effects are observed after knockdown of other genes known to be involved in the biogenesis (e.g., DICER) or function (e.g., AGO2) of miRNAs. Although DROSHA is believed to be involved in the biogenesis of the vast majority of miRNAs, it is interesting to note the small median ES after Drosha knockdown in some experiments (for example Figure 1B) and the prediction by sRNA-Effector that DROSHA is neither a binder nor an effector of ∼30% miRNAs (Figure 4D). We attribute this to differences in levels of expression and stability of various miRNAs and even differences in the amount of knockdown of DROSHA protein achieved in different experiments. For instance, an miRNA that is not expressed at all in a cell line is unlikely to be repressed further by DROSHA knockdown, or an miRNA that is very stable may not show a significant decrease in levels during the time frame of the experiment. The result highlights that it is not the magnitude of the ES50 but the consistency of effects seen on multiple miRNA targets that is important in predicting possible sRNA regulators/effectors.
Having established our method is sensitive enough to detect known miRNA effectors, we next analyzed ENCODE RNA-seq data following shRNA-mediated knockdown, which also showed a general derepression of miRNA targets after DROSHA knockdown in both HepG2 and K562 cell lines. Expanding our ES analysis to the rest of the shRNA-seq data, we identified several splicing factors that appear to be involved in increasing repression by miRNAs, including U2AF2, RBM39, and RAVER1. Splicing has been linked to miRNA biogenesis, especially for miRNAs located within introns.35,36,37,38,39,40,41 However, to our knowledge, U2AF2, RBM39, and RAVER1 have received little attention for their potential role in regulation of miRNA levels or function. Interestingly, it was shown that knockdown of U2AF2 reduces the levels of several mature miRNA members of the miR-17-92 cluster and increases the expression of the precursor miRNA.37 Together, these data suggest that our ES analysis reveals putative miRNA effectors worthy of future study.
Our ES analysis after shRNA-seq also revealed intriguing, cell-type-specific results. For example, SRSF7, PPIL4, and AKAP1 have effects in opposite directions in HepG2 and K562 cells. Opposing ESs may be observed for a variety of reasons, including differential isoform expression, differential expression, or differences in miRNA expression. For example, although lowly expressed, miR-199a-5p is expressed at higher levels in K562 than HepG2 in the ENCODE dataset (data not shown). It has been shown that overexpression of an miR-199a-5p mimic can reduce the expression of AKAP1 at the RNA and protein level.42 One possibility is that basal expression of AKAP1 is kept lower in K562 cells either at the RNA and/or at protein level and that further repression of AKAP1 with shRNA does not cause a major shift in miRNA expression and function. On the other hand, higher basal expression of AKAP1 in HepG2 cells means that knockdown may lead to a more dramatic effect on miRNAs and their targets. Similar mechanisms, and myriad others, might explain disparate effects across different cell lines. The possibility of cell type specificity for sRNA-Effector predictions cannot be completely ruled out, and it is important that users test the predictions across multiple cell lines.
Since knockdown of a gene can have several indirect effects, we surmised that analysis of RNAs directly bound to proteins identified via eCLIP would strengthen our ES-based analysis to identify true regulators/effectors of miRNAs. Indeed, we found that several hits from the ES-based analysis bound miRNAs or precursor miRNAs. A previous study combined analysis of eCLIP and miRNA sequencing data after knockdown of various genes to identify new miRNA regulators.36 Additionally, several machine learning-based algorithms exist for the prediction of RNA-binding protein (RBP) interaction with RNAs.43,44,45,46,47,48 However, both of these approaches are limited because either they require generation of both binding and miRNA expression data or predictions are limited in that it is unclear if RBP interaction with target RNA actually alters the function of that RNA or in what direction. To that end, we combined the ES analysis (measuring repression of miRNA targets) with direct binding analysis (from eCLIP data) to generate ground-truth data classifying ∼60 genes into four groups based on their ability to bind miRNAs or alter miRNA activity. This ground-truth data were used to develop a predictive model based solely on genome-wide transcriptomics data following knockdown of a gene together with sequence features of the miRNA and the knocked-down protein. The predictive model, sRNA-Effector, was able to accurately classify genes where we only had transcriptomics data after knockdown (but no binding data) as binders and/or effectors. sRNA-Effector was able to accurately predict that key miRNA biogenesis enzymes DROSHA and DICER were binders and effectors of miRNAs (Figures 4D and 4E). sRNA-Effector also showed that DROSHA depletion in K562 cells had fewer “BinderEffector” predictions than one would expect (Figure S4) but is consistent with our earlier ES analysis in K562 cells from ENCODE. These data suggest that there may be a protein that substitutes for DROSHA in K562 cells in the biogenesis of miRNAs or that DROSHA has alternative functions that compete for its role in miRNA biogenesis in this cell line. The finding that there are three times as many DROSHA eCLIP peaks outside miRNA space compared to HepG2 is intriguing and deserving of future research. For example, DROSHA has been found to have key miRNA-independent roles in hematopoietic stem cells, which may at least in part explain these findings.49 These data also highlight the ability of sRNA-Effector to detect cell-type-specific functions. Application of sRNA-Effector to publicly available microarray data from the GEO suggested several miRNA effectors including STK33, SFPQ, and BMI1.
Using sRNA-Effector, we predict and validate STK33 as a “NotBinderEffector.” STK33 is a serine/threonine kinase that has been associated with phosphorylation and regulation of vimentin.50,51 STK33 has also been shown to be synthetic lethal in KRAS-dependent tumors, although this has been a subject of debate.52,53,54 The mechanism by which STK33 might regulate miRNAs is unclear, but vimentin has been proposed to regulate miRNA targeting of tissue factor RNA in circulating tumor cells.55 Our results show that although “NotBinderEffector” proteins predicted by sRNA-Effector may not directly bind miRNA or known miRNA effectors, they can be validated using reporter-based assays in cell culture.
From our ground-truth data and the sRNA-Effector predictions, we have identified several genes that appear to regulate >100 miRNAs (Figures 2B and 7A). Examples of such genes that globally regulate a large number of miRNAs (and a subset of the regulated miRNAs) are given in Tables S3 and S4 and include genes like DROSHA that are involved in the biogenesis of nearly all miRNAs. We identified BMI1 and SFPQ as the top miR binder effectors, with SFPQ as a positive regulator and BMI1 as a negative regulator. Indeed, SFPQ has been previously found to regulate several miR levels and activities.24,25 Here our analysis suggests SFPQ may have a broader impact in miR regulation. Lastly, BMI1 is a proto-oncogene that, as part of the PcG complex, maintains a transcriptionally repressed state. EZH2 of the PcG complex has been implicated in repression of several miRNAs,56,57 but little is known about BMI1-mediated regulation of miRNAs. Intriguingly, sRNA-Effector predicts that BMI1 either directly binds miRNA or interacts with known miRNA effector proteins and regulates miRNA function. Our data suggest that, in addition to BMI1’s regulation of transcription, BMI1 may also control gene expression in a post-transcriptional manner. The mechanism by which BMI1 can induce some miRNAs and repress others is unclear. BMI1-mediated repression of an miRNA can be explained by the known mechanism of action for BMI1: ubiquitination of histone H2A on lysine 119 and subsequent chromatin condensation and transcriptional silencing of the pri-miRNA.58,59,60 BMI1-mediated induction of specific miRNAs might be explained by BMI1 transcriptionally silencing a repressor of miRNA expression or function. BMI1 may also either directly or indirectly (via interaction with known miRNA effectors, such as Ago2) interact with miRNAs and enhance their expression or function.
Another interesting application of sRNA-Effector is to identify regulators/effectors that act on a few specific miRNAs. For example, LIN28 A/B are known to interact with let-7. Interaction between let-7 family members and LIN28B can be detected by eCLIP in HepG2 (Figure S4); however, we did not observe a significant effect of LIN28B targeting on let-7 activity. This could be due to insufficient knockdown of LIN28B or perhaps LIN28B-mediated let-7 regulation is effective on only a subset of let-7 targets. Furthermore, LIN28B depletion has different effects depending on the cell type. For example, in HepG2, depletion of LIN28B led to enhanced repression of miR-374a/b-5p, miR-27a/b-3p, and miR-128-3p targets, suggesting a role for LIN28B in increasing the levels or function of these miRNAs in HepG2 (Table S4). On the other hand, depletion of LIN28B in K562 cells only resulted in a significant derepression of miR-126-5p targets, suggesting a role for LIN28B in decreasing the expression or function of miR-126-5p in this cell type (Table S4). The cell-specific role of LIN28B on non-let-7 miRNAs is worthy of future study. Because of the identification of BMI1 as a BinderEffector or many miRNAs, other interesting genes to test are members of the PrC2 complex, SUZ12 and EED, as well as RING2 of the PrC1 complex. EZH2 has been previously reported to repress the expression of certain miRNAs and contribute to tumorigenesis.56,57 In the opposite direction, it would be interesting to identify effectors of miR-451a, a DICER-independent miRNA. Interestingly, we identify several genes that are classified as BinderEffector or notBinderEffector for only a small number of miRNAs in our GEO microarray screen. Examples of these genes (SIRT1, TP63, HNRNPA1B2, and PARG) and the putatively regulated miRNA(s) are included in Tables S6 and S7. Future experiments will determine whether genes in both these classes (global vs. miRNA-specific) are bona fide regulators of these miRNAs and how the regulation is achieved.
Together, our data show that the abundance of sequencing data that are publicly available can be used to make new discoveries in sRNA biology, even when sRNA profiling after gene knockdown or binding data of the proteins are unavailable. Importantly, sRNA-Effector is available for download and only requires a log2 fold change file from transcriptome profiling. As more transcriptomic data are produced after knockdown of various cellular genes, we believe that sRNA-Effector will be a valuable tool in finding regulators of sRNA biology.
Limitations of the study
sRNA-Effector is a model that uses machine learning to predict putative miRNA effectors. As with any machine learning-based model, predictions rely on the underlying data used to train the model. Although this approach has the advantage of utilizing accumulated knowledge, it is also a limitation in that the model can only make predictions based on what is already known. In other words, sRNA-Effector does not incorporate new features of sRNA regulation or biogenesis. Additionally, as previously stated, it is important to recognize that sRNA-Effector predictions may be cell type specific. Any predictions made should be validated in both the original cell type that generated the input transcriptomic data and other cell types if more global conclusions are to be drawn.
STAR★Methods
Key resources table
| REAGENT or RESOURCE | SOURCE | IDENTIFIER |
|---|---|---|
| Chemicals, peptides, and recombinant proteins | ||
| ML281 (STK33 inhibitor) | Selleck Chemicals | Cat#S0431; CAS: 1404437-62-2 |
| ML281 (STK33 inhibitor) | Tocris Bioscience | Cat#4880; CAS: 1404437-62-2 |
| Critical commercial assays | ||
| Direct-zol RNA extraction kit | Zymo Research | Cat#R2052 |
| miRCURY LNA RT kit | Qiagen | Cat#339340 |
| miRCURY LNA SYBR Green PCR kit | Qiagen | Cat#339345 |
| Dual Luciferase Reporter Assay | Promega | Cat#E1910 |
| Deposited data | ||
| Processed eCLIP data and mRNA-seq data in HepG2 and K562 | ENCODE | https://www.encodeproject.org |
| Microarray and RNA-seq datasets after gene knock-down | Gene Expression Omnibus | See Tables S6 and S7 |
| Depletion of DROSHA, DGCR8, DICER, AGO2 (Figure 1) | Gene Expression Omnibus | GSE13639, GSE160819, GSE13640, GSE89942 |
| Experimental models: Cell lines | ||
| HEK293T | ATCC | Cat#CRL-3216 |
| HeLa | ATCC | Cat#CCL-2 |
| DAOY | ATCC | Cat#HTB-186 |
| Oligonucleotides | ||
| siBMI1 | Sigma | Cat#SASI_HS01_00175765 |
| siSFPQ | Qiagen | Cat#GS654798 |
| qPCR primers | This paper | See Table S9 |
| miRCURY LNA assays | Qiagen | Cat#339306 (see Table S9) |
| Recombinant DNA | ||
| Psicheck2 | Promega | Cat#C8021 |
| miR reporters | This paper | See Table S9 |
| Software and algorithms | ||
| sRNAeffector code | This paper | https://github.com/bw9bj/sRNA-Effector |
| unitas v1.7.0 | Gebert et al.61 | https://www.smallrnagroup.uni-mainz.de/software.html |
| R DESeq2 package v1.40 | Love et al.62 | https://bioconductor.org/packages/release/bioc/html/DESeq2.html |
| Biogrid | Stark et al.63 Oughtred et al.64 |
https://thebiogrid.org/ |
| Gene Ontology | Ashburner et al.65 Gene Ontology Consortium66 |
https://cran.r-project.org/web/packages/biomartr/index.html |
| R package biomaRt v2.48.3 | R package | https://cran.r-project.org/web/packages/biomartr/index.html |
| R package peptides v2.4.4 | R package | https://cran.r-project.org/web/packages/Peptides/index.html |
| R caret package v6.0 | R package | http://topepo.github.io/caret/index.html |
| miRBase | Kozomara et al.12,13 | https://mirbase.org/ |
| miRDB | Liu et al.15 | https://mirdb.org/mirdb/index.html |
| TargetScan v8.0 | McGeary et al.16 | https://www.targetscan.org/vert_80/ |
| miRTarBase v9.0 | Huang et al.17 | https://mirtarbase.cuhk.edu.cn/∼miRTarBase/miRTarBase_2022/php/index.php |
| MirGeneDBv2.0 | Fromm et al.14 | https://mirgenedb.org/ |
Resource availability
Lead contact
Further information and requests for resources and reagents should be directed to and will be fulfilled by the lead contact, Anindya Dutta (duttaa@uab.edu).
Materials availability
Plasmids generated in this study will be made available upon request. We may require a payment and/or a completed materials transfer agreement in case there is potential for commercial application.
Data and code availability
-
•
This paper analyzes existing, publicly available data. These accession numbers for the datasets are listed in the key resources table.
-
•
The original code to this algorithm “sRNA-Effector v1.0” has been deposited and is publicly available on github: https://github.com/bw9bj/sRNA-Effector.
-
•
Any additional information required to reanalyze the data reported in this paper is available from the lead contact upon request.
Experimental model and study participant details
HEK293T cells (ATCC #CRL-3216, Female) and HeLa cells (ATCC #CCL-2, Female) were grown in DMEM/high glucose (Corning #10-013-CV, 4500 mg/L glucose, 4 mM L-glutamine, 110 mg/L sodium pyruvate) with 10% FBS and 1% penicillin/streptomycin. DAOY (ATCC #HTB-186, male) were grown in Eagle’s MEM (Corning #10-009-CV) with 10% FBS and 1% penicillin/streptomycin. All cells were routinely tested for mycoplasma and maintained in humidified incubators with 5% CO2 at 37°C. All cell lines were directly purchased from ATCC and used in their early passages. We also authenticated HEK293T and HeLa by STR method.
Method details
Sequencing data and analysis
Processed Enhanced crosslinking ligation and immunoprecipitation (eCLIP) data and mRNA sequencing after shRNA mediated knockdown of cellular proteins was done by ENCODE in HepG2 (liver cancer) and K562 (myeloid leukemia) cells. These data were downloaded from the ENCODE data portal. Microarray data from other knockdown experiments was downloaded from the gene expression omnibus (GEO). Microarray data was processed using GEO2R. GEO predictions and accession numbers are listed in Tables S6 and S7. For GEO microarray data to be considered high quality, knockdown efficiency of the gene of interest had to be greater than or equal to 2 fold. Unitas61 was used to map small RNAs after shBMI1. DESeq262 was used for differential expression analysis of small RNA sequencing after knockdown of BMI1.
Derivation of predictive model
Ground truth data
eCLIP data identifies whether a protein is a Binder or NotBinder to miRNAs. mRNA sequencing data following knockdown of a given gene identifies whether the target mRNAs are repressed or induced relative to non-targets, and if an effect is seen (defined by the specific cut-off below), the protein is an Effector, and if no effect is seen, the protein is a NotEffector. In this manner we produce ground truth data for building a model that classifies a gene as a “BinderEffector”, “NotBinderEffector”, “BinderNotEffector”, or “NotBinderNotEffector” for a given miRNA.
For a gene to be considered a “binder”, the protein had to have a peak called that intersects with a miRNA locus. We extended the definition of “binder” to include proteins that are known to interact with proteins involved in the miRNA metabolic process. Proteins that were included in the GO term “miRNA metabolic process” (GO:0010586) were used to search Biogrid for protein-protein interactions.63,64 Therefore, a binder can interact directly with a miRNA or interact with a known miRNA interacting protein.
For a gene to be considered an “effector”, CDF plots of the miRNA targets and non-targets following knockdown of the gene should show a significant difference by the two-sided Wilcoxon Rank Sum test (p-value < 0.05). miRNA targets were obtained from mirdb.15 The effect size of the knockdown is calculated as the log2 fold change of targets minus the log2 fold change of the non-targets (as defined in67) at the 50th percentile on the Y-axis of CDF plots (Fraction of genes). This statistic serves to summarize the strength of target repression or derepression. This is the value referred to as ES or ES50 in the manuscript. However, for the machine learning, we also use the Effect size at the 90th percentile (ES90) and at the 10th percentile (ES10) as additional features (Table 1).
Only high confidence miRNAs as defined by miRBase12 were used for target prediction and eCLIP binding analysis. High confidence miRNAs are those that have miRNA reads mapping to both the 5p and 3p strand of the miRNA duplex, have a hairpin precursor structure, have ∼2 nt 3′ overhang, and a consistent 5′ end.
Model training, testing, and validation
We wanted to develop a machine learning algorithm that can identify regulators of microRNAs using only transcriptome analyses after gene knockdown and features embedded in the sequence of the microRNAs and of the proteins being queried. The code to this algorithm “sRNA-Effector v1.0” is now available on github: https://github.com/bw9bj/sRNA-Effector.
Ground truth data necessary for developing a machine learning based model were the four classes of genes ("BinderEffector", "NotBinderEffector", "BinderNotEffector", "NotBinderNotEffector") from the ∼60 genes that were classified by the effect size analysis and eCLIP data as described above and in results. ∼12,000 protein-miRNA pairs were included in the final ground-truth dataset, with about ∼6,000 protein-miRNA pairs remaining following feature curation. These were split 80:10:10 for training, validation, and testing, respectively. R caret package68 was used for all aspects of model training, validation, and testing. All data was scaled and centered. Additionally, during training, 10-fold cross validation was employed.
Feature definitions
The features used as predictors in the machine learning models can be broadly grouped into three categories: 1) target repression features, 2) miRNA sequence features, and 3) query protein features.
-
(1)
Target repression features included: i) The effect size of miRNA mediated target repression at the 50th percentile on the Y -axis (Figure 4.1A), ES50. This is calculated by subtracting the log2 fold change of the non-targets from the log2 fold change of the targets at the 50th percentile on the Y-axis in the CDF plots of targets vs. non-targets. (Figure 4.1A) ii) The effect size at the 90th percentile. iii) The effect size at the 10th percentile. iv)The p-value from a two-sided Wilcoxon Rank Sum Test of the separation of the target vs. non-target CDF plots and the D value. The D value is the maximum vertical distance between the two curves. v). A false discovery rate adjusted p-value was also calculated. vi) The standard deviation for the log2 fold change of the targets. vii) The standard deviation of the log2 fold change of the non-targets.
-
(2)
miRNA sequence features were numerically encoded sequences of precursor miRNA and 5’ and 3’ flanking sequences such that all sequences were 125 nucleotides. These sequences were obtained from Kim et al. 2021.69 This converts the nucleotide sequences to numeric, which is required for most machine learning algorithms.
-
(3)
Query protein physicochemical features: In order to reduce the number of features, we used physicochemical properties of the query proteins rather than directly encoding the amino acids. Amino acid sequences for proteins were downloaded from Ensembl using the R package biomaRt.70 For each protein, we calculated the following using the Peptides R package:71 i) the aliphatic index, ii) the Boman (Potential Protein Interaction) index, iii) the theoretical net charge of the protein sequence, iv) hydrophobicity index, v) instability index of the protein, vi) molecular weight, vii) isoelectric point, viii) the Cruciani properties of the query protein, ix) the Kidera factors, and x) the protFP descriptors. Gene ontologies were also used as features.65,66 These include: i) regulation of translation (GO:0006417), ii) response to virus (GO:0009615), iii) miRNA metabolic process (GO:0010586), iv) double stranded RNA binding (GO:0003725), v) nuclease activity (GO:0004518), vi) RNA helicase activity (GO:0003724), vii) RNA catabolic process (GO:0006402).
Cell lines and treatment
HEK293T cells (ATCC #CRL-3216) and HeLa cells (ATCC #CCL-2) were grown in DMEM/high glucose (Corning #10-013-CV, 4500 mg/L glucose, 4 mM L-glutamine, 110 mg/L sodium pyruvate) with 10% FBS and 1% penicillin/streptomycin. DAOY (ATCC #HTB-186) were grown in Eagle’s MEM (Corning #10-009-CV) with 10% FBS and 1% penicillin/streptomycin. All cells were maintained in humidified incubators with 5% CO2 at 37°C.
STK33 inhibitor ML281 (Selleckchem #S0431 or TOCRIS #4880) was dissolved with DMSO to make 50 mM stock. Cells were treated with 10-20 uM ML281 for 48 hours. siBMI1 (Sigma #SASI_HS01_00175765) was transfected twice with RNAiMax (Life Technologies #13778-150) at a final concentration of 1 nM. siSFPQ (Qiagen FlexiTube #GS654798) was transfected twice with RNAiMax at a final concentration of 5-10 nM. siNC (Qiagen #1027310) was used as non-targeting control. RNA extraction and reporter assay reading was performed 96-hours after first siRNA transfection. After treatment, cells were washed on ice twice with cold PBS and Trizol added directly to cells before RNA extraction.
RNA extraction and RT-PCR
RNA was purified using the Direct-zol kit (Zymo Research #R2052), including the on-column DNase digestion step. For confirmation of BMI1 or SFPQ knock-down, cDNA was synthesized by PrimeScript 1st strand cDNA synthesis kit (Takara #6110) followed by qPCR with PowerTrack SYBR Green master mix (Applied Biosystems #A46109). Relative expression was derived by ddCt method, compared to ACTB or U6 expression. For measurement of miR levels, miRCURY LNA RT kit (Qiagen #339340) and miRCURY LNA SYBR Green PCR kit (Qiagen #339345) was used with spike-in controls added to the same amount of total RNAs. The complete list of qPCR primers and miRCURY LNA assays (Qiagen #339306) are listed in Table S9.
Luciferase reporter construction and assay
Dual luciferase reporters were constructed on the basis of psicheck2 (Promega #C8021). miR target site (perfect complementary sequence to corresponding mature miR sequence) was inserted into Renilla luciferase 3’ UTR between PmeI and XhoI sites. In HEK293T: 2 ng of reporter plasmid and 250ng pcDNA3 were reverse transfected into 293T cells using the standard Lipofectamine 2000 protocol. 24 hours later, the indicated amounts of STK33 inhibitor ML281 were added to cells. After 48 hours luciferase assay was conducted according to the protocol outlined by the Dual Luciferase Reporter Assay (Promega #E1910). In DAOY, 25000 cells were seeded in 24 well plate (Corning#353047) and BMI1 was reversed-knocked down by 1 nM siBMI1 using RNAiMAX lipofectamine (Life Technologies #13778-150), and 24 hours later another round of knock down took place. siNC (Qiagen #1027310) was used as non-targeting control. 24 hours after the second transfection, cells were transfected with 200 ng dual luciferase 3’UTR reporters containing target sites for miR-1343-3p, miR-504-5p and miR-149-5p using Lipofectamine 3000 kit (Life Technologies #L3000-015). 48 hours later cells were washed twice by PBS, luciferase assay was conducted according to the protocol outlined by the Dual Luciferase Reporter Assay (Promega #E1910) using GLOMAX 96 microplate luminometer (Promega). In HeLa cells, the same protocol as DAOY was performed, except that 5 nM of siRNA was used and 10-100 ng reporter plasmids were used. The luciferase activity was measured 24 hours later than the reporter transfection. For all reporter assays, empty psicheck2 was included as negative control. The complete list of luciferase reporters is listed in Table S9.
Quantification and statistical analysis
For global gene expression analysis (both microarray and RNA-seq), CDF plots of the miRNA targets and non-targets following knockdown of the gene are evaluated by two-sided Wilcoxon Rank Sum test (significance cut-off, p-value < 0.05). miR expression is normalized to spike-in control and control treatment and evaluated by one-sample t test (n = 3) with significance cut-off p value < 0.05. miRNA 3’ UTR dual-luciferase reporters between siSFPQ (or siBMI1) and siNC are evaluated by two-sample unpaired t test (n = 4) with significance cut-off p value < 0.05. “n” represents the number of replicates in experiments or number of targets in CDF plots. Statistical details can also be found in the figure legends.
Acknowledgments
We thank the Dutta Laboratory for the helpful discussion and suggestions. This research was supported by the NCI Cancer Center Support Grant 5P30CA044579; NIH grant R01GM146756 and R01CA060499 (to A.D.) which paid the salary for A.D., Z.S., and B.W.; NIH NCI F30 grant 1F30CA254134 (to B.W.) which helped to pay the salary for B.W.; and NIH NCI grant R00CA259526 (to Z.S.) which helped to pay the salary for Z.S.. The funders had no role in study design, data collection and analysis, decision to publish, or preparation of the manuscript.
Author contributions
Conception of the study, B.W. and A.D. ENCODE data curation, analysis, and model development, B.W. GEO dataset curation, M.P. Validation, F.E., Z.S., and B.W. sRNA-Effector code development, B.W. and W.S. Writing, B.W. and Z.S. Editing, A.D. and Z.S.
Declaration of interests
The authors declare no competing interests.
Published: February 20, 2024
Footnotes
Supplemental information can be found online at https://doi.org/10.1016/j.isci.2024.109300.
Contributor Information
Zhangli Su, Email: zsu@uab.edu.
Anindya Dutta, Email: duttaa@uab.edu.
Supplemental information
References
- 1.Lee Y.S., Shibata Y., Malhotra A., Dutta A. A novel class of small RNAs: tRNA-derived RNA fragments (tRFs) Genes Dev. 2009;23:2639–2649. doi: 10.1101/gad.1837609. [DOI] [PMC free article] [PubMed] [Google Scholar]
- 2.Cole C., Sobala A., Lu C., Thatcher S.R., Bowman A., Brown J.W.S., Green P.J., Barton G.J., Hutvagner G. Filtering of deep sequencing data reveals the existence of abundant Dicer-dependent small RNAs derived from tRNAs. RNA. 2009;15:2147–2160. doi: 10.1261/rna.1738409. [DOI] [PMC free article] [PubMed] [Google Scholar]
- 3.Bartel D.P. Metazoan MicroRNAs. Cell. 2018;173:20–51. doi: 10.1016/j.cell.2018.03.006. [DOI] [PMC free article] [PubMed] [Google Scholar]
- 4.Yang A., Shao T.-J., Bofill-De Ros X., Lian C., Villanueva P., Dai L., Gu S. AGO-bound mature miRNAs are oligouridylated by TUTs and subsequently degraded by DIS3L2. Nat. Commun. 2020;11:2765. doi: 10.1038/s41467-020-16533-w. [DOI] [PMC free article] [PubMed] [Google Scholar]
- 5.Heo I., Ha M., Lim J., Yoon M.-J., Park J.-E., Kwon S.C., Chang H., Kim V.N. Mono-uridylation of pre-microRNA as a key step in the biogenesis of group II let-7 microRNAs. Cell. 2012;151:521–532. doi: 10.1016/j.cell.2012.09.022. [DOI] [PubMed] [Google Scholar]
- 6.Kim B., Ha M., Loeff L., Chang H., Simanshu D.K., Li S., Fareh M., Patel D.J., Joo C., Kim V.N. TUT7 controls the fate of precursor microRNAs by using three different uridylation mechanisms. EMBO J. 2015;34:1801–1815. doi: 10.15252/embj.201590931. [DOI] [PMC free article] [PubMed] [Google Scholar]
- 7.Han J., LaVigne C.A., Jones B.T., Zhang H., Gillett F., Mendell J.T. A ubiquitin ligase mediates target-directed microRNA decay independently of tailing and trimming. Science. 2020;370 doi: 10.1126/science.abc9546. [DOI] [PMC free article] [PubMed] [Google Scholar]
- 8.Shi C.Y., Kingston E.R., Kleaveland B., Lin D.H., Stubna M.W., Bartel D.P. The ZSWIM8 ubiquitin ligase mediates target-directed microRNA degradation. Science. 2020;370 doi: 10.1126/science.abc9359. [DOI] [PMC free article] [PubMed] [Google Scholar]
- 9.Van Nostrand E.L., Freese P., Pratt G.A., Wang X., Wei X., Xiao R., Blue S.M., Chen J.-Y., Cody N.A.L., Dominguez D., et al. A large-scale binding and functional map of human RNA-binding proteins. Nature. 2020;583:711–719. doi: 10.1038/s41586-020-2077-3. [DOI] [PMC free article] [PubMed] [Google Scholar]
- 10.Han J., Pedersen J.S., Kwon S.C., Belair C.D., Kim Y.-K., Yeom K.-H., Yang W.-Y., Haussler D., Blelloch R., Kim V.N. Posttranscriptional crossregulation between Drosha and DGCR8. Cell. 2009;136:75–84. doi: 10.1016/j.cell.2008.10.053. [DOI] [PMC free article] [PubMed] [Google Scholar]
- 11.Jiang X., Prabhakar A., Van der Voorn S.M., Ghatpande P., Celona B., Venkataramanan S., Calviello L., Lin C., Wang W., Black B.L., et al. Control of ribosomal protein synthesis by the Microprocessor complex. Sci. Signal. 2021;14 doi: 10.1126/scisignal.abd2639. [DOI] [PMC free article] [PubMed] [Google Scholar]
- 12.Kozomara A., Griffiths-Jones S. miRBase: annotating high confidence microRNAs using deep sequencing data. Nucleic Acids Res. 2014;42:D68–D73. doi: 10.1093/nar/gkt1181. [DOI] [PMC free article] [PubMed] [Google Scholar]
- 13.Kozomara A., Birgaoanu M., Griffiths-Jones S. miRBase: from microRNA sequences to function. Nucleic Acids Res. 2019;47:D155–D162. doi: 10.1093/nar/gky1141. [DOI] [PMC free article] [PubMed] [Google Scholar]
- 14.Fromm B., Høye E., Domanska D., Zhong X., Aparicio-Puerta E., Ovchinnikov V., Umu S.U., Chabot P.J., Kang W., Aslanzadeh M., et al. MirGeneDB 2.1: toward a complete sampling of all major animal phyla. Nucleic Acids Res. 2022;50:D204–D210. doi: 10.1093/nar/gkab1101. [DOI] [PMC free article] [PubMed] [Google Scholar]
- 15.Liu W., Wang X. Prediction of functional microRNA targets by integrative modeling of microRNA binding and target expression data. Genome Biol. 2019;20 doi: 10.1186/s13059-019-1629-z. [DOI] [PMC free article] [PubMed] [Google Scholar]
- 16.McGeary S.E., Lin K.S., Shi C.Y., Pham T.M., Bisaria N., Kelley G.M., Bartel D.P. The biochemical basis of microRNA targeting efficacy. Science. 2019;366 doi: 10.1126/science.aav1741. [DOI] [PMC free article] [PubMed] [Google Scholar]
- 17.Huang H.-Y., Lin Y.-C.-D., Cui S., Huang Y., Tang Y., Xu J., Bao J., Li Y., Wen J., Zuo H., et al. miRTarBase update 2022: an informative resource for experimentally validated miRNA–target interactions. Nucleic Acids Res. 2022;50:D222–D230. doi: 10.1093/nar/gkab1079. [DOI] [PMC free article] [PubMed] [Google Scholar]
- 18.Rodriguez A., Griffiths-Jones S., Ashurst J.L., Bradley A. Identification of mammalian microRNA host genes and transcription units. Genome Res. 2004;14:1902–1910. doi: 10.1101/gr.2722704. [DOI] [PMC free article] [PubMed] [Google Scholar]
- 19.Sun Y., Ji F., Kumar M.R., Zheng X., Xiao Y., Liu N., Shi J., Wong L., Forgues M., Qin L.-X., et al. Transcriptome integration analysis in hepatocellular carcinoma reveals discordant intronic miRNA-host gene pairs in expression. Int. J. Biol. Sci. 2017;13:1438–1449. doi: 10.7150/ijbs.20836. [DOI] [PMC free article] [PubMed] [Google Scholar]
- 20.Liu B., Shyr Y., Liu Q. Pan-Cancer Analysis Reveals Common and Specific Relationships between Intragenic miRNAs and Their Host Genes. Biomedicines. 2021;9 doi: 10.3390/biomedicines9091263. [DOI] [PMC free article] [PubMed] [Google Scholar]
- 21.Piskounova E., Polytarchou C., Thornton J.E., LaPierre R.J., Pothoulakis C., Hagan J.P., Iliopoulos D., Gregory R.I. Lin28A and Lin28B inhibit let-7 microRNA biogenesis by distinct mechanisms. Cell. 2011;147:1066–1079. doi: 10.1016/j.cell.2011.10.039. [DOI] [PMC free article] [PubMed] [Google Scholar]
- 22.Fan M., Krutilina R., Sun J., Sethuraman A., Yang C.H., Wu Z.-H., Yue J., Pfeffer L.M. Comprehensive analysis of microRNA (miRNA) targets in breast cancer cells. J. Biol. Chem. 2013;288:27480–27493. doi: 10.1074/jbc.M113.491803. [DOI] [PMC free article] [PubMed] [Google Scholar]
- 23.Golden R.J., Chen B., Li T., Braun J., Manjunath H., Chen X., Wu J., Schmid V., Chang T.-C., Kopp F., et al. An Argonaute phosphorylation cycle promotes microRNA-mediated silencing. Nature. 2017;542:197–202. doi: 10.1038/nature21025. [DOI] [PMC free article] [PubMed] [Google Scholar]
- 24.Jiang L., Shao C., Wu Q.-J., Chen G., Zhou J., Yang B., Li H., Gou L.-T., Zhang Y., Wang Y., et al. NEAT1 scaffolds RNA-binding proteins and the Microprocessor to globally enhance pri-miRNA processing. Nat. Struct. Mol. Biol. 2017;24:816–824. doi: 10.1038/nsmb.3455. [DOI] [PMC free article] [PubMed] [Google Scholar]
- 25.Bottini S., Hamouda-Tekaya N., Mategot R., Zaragosi L.-E., Audebert S., Pisano S., Grandjean V., Mauduit C., Benahmed M., Barbry P., et al. Post-transcriptional gene silencing mediated by microRNAs is controlled by nucleoplasmic Sfpq. Nat. Commun. 2017;8:1189. doi: 10.1038/s41467-017-01126-x. [DOI] [PMC free article] [PubMed] [Google Scholar]
- 26.Xu J., Li L., Shi P., Cui H., Yang L. The Crucial Roles of Bmi-1 in Cancer: Implications in Pathogenesis, Metastasis, Drug Resistance, and Targeted Therapies. Int. J. Mol. Sci. 2022;23 doi: 10.3390/ijms23158231. [DOI] [PMC free article] [PubMed] [Google Scholar]
- 27.Liu Z., Hu C., Zheng L., Liu J., Li K., Li X., Wang Y., Mu W., Chen T., Shi A., et al. BMI1 promotes cholangiocarcinoma progression and correlates with antitumor immunity in an exosome-dependent manner. Cell. Mol. Life Sci. 2022;79:469. doi: 10.1007/s00018-022-04500-1. [DOI] [PMC free article] [PubMed] [Google Scholar]
- 28.Ustianenko D., Hrossova D., Potesil D., Chalupnikova K., Hrazdilova K., Pachernik J., Cetkovska K., Uldrijan S., Zdrahal Z., Vanacova S. Mammalian DIS3L2 exoribonuclease targets the uridylated precursors of let-7 miRNAs. RNA. 2013;19:1632–1638. doi: 10.1261/rna.040055.113. [DOI] [PMC free article] [PubMed] [Google Scholar]
- 29.Liu X., Zheng Q., Vrettos N., Maragkakis M., Alexiou P., Gregory B.D., Mourelatos Z. A MicroRNA precursor surveillance system in quality control of MicroRNA synthesis. Mol. Cell. 2014;55:868–879. doi: 10.1016/j.molcel.2014.07.017. [DOI] [PMC free article] [PubMed] [Google Scholar]
- 30.Towler B.P., Jones C.I., Viegas S.C., Apura P., Waldron J.A., Smalley S.K., Arraiano C.M., Newbury S.F. The 3’-5' exoribonuclease Dis3 regulates the expression of specific microRNAs in Drosophila wing imaginal discs. RNA Biol. 2015;12:728–741. doi: 10.1080/15476286.2015.1040978. [DOI] [PMC free article] [PubMed] [Google Scholar]
- 31.Ghini F., Rubolino C., Climent M., Simeone I., Marzi M.J., Nicassio F. Endogenous transcripts control miRNA levels and activity in mammalian cells by target-directed miRNA degradation. Nat. Commun. 2018;9:3119. doi: 10.1038/s41467-018-05182-9. [DOI] [PMC free article] [PubMed] [Google Scholar]
- 32.de la Mata M., Gaidatzis D., Vitanescu M., Stadler M.B., Wentzel C., Scheiffele P., Filipowicz W., Großhans H. Potent degradation of neuronal miRNAs induced by highly complementary targets. EMBO Rep. 2015;16:500–511. doi: 10.15252/embr.201540078. [DOI] [PMC free article] [PubMed] [Google Scholar]
- 33.Fuchs Wightman F., Giono L.E., Fededa J.P., de la Mata M. Target RNAs Strike Back on MicroRNAs. Front. Genet. 2018;9:435. doi: 10.3389/fgene.2018.00435. [DOI] [PMC free article] [PubMed] [Google Scholar]
- 34.Sheu-Gruttadauria J., Pawlica P., Klum S.M., Wang S., Yario T.A., Schirle Oakdale N.T., Steitz J.A., MacRae I.J. Structural Basis for Target-Directed MicroRNA Degradation. Mol. Cell. 2019;75:1243–1255.e7. doi: 10.1016/j.molcel.2019.06.019. [DOI] [PMC free article] [PubMed] [Google Scholar]
- 35.Trabucchi M., Briata P., Garcia-Mayoral M., Haase A.D., Filipowicz W., Ramos A., Gherzi R., Rosenfeld M.G. The RNA-binding protein KSRP promotes the biogenesis of a subset of microRNAs. Nature. 2009;459:1010–1014. doi: 10.1038/nature08025. [DOI] [PMC free article] [PubMed] [Google Scholar]
- 36.Nussbacher J.K., Yeo G.W. Systematic Discovery of RNA Binding Proteins that Regulate MicroRNA Levels. Mol. Cell. 2018;69:1005–1016.e7. doi: 10.1016/j.molcel.2018.02.012. [DOI] [PMC free article] [PubMed] [Google Scholar]
- 37.Du P., Wang L., Sliz P., Gregory R.I. A Biogenesis Step Upstream of Microprocessor Controls miR-17∼92 Expression. Cell. 2015;162:885–899. doi: 10.1016/j.cell.2015.07.008. [DOI] [PMC free article] [PubMed] [Google Scholar]
- 38.Treiber T., Treiber N., Meister G. Regulation of microRNA biogenesis and its crosstalk with other cellular pathways. Nat. Rev. Mol. Cell Biol. 2019;20:5–20. doi: 10.1038/s41580-018-0059-1. [DOI] [PubMed] [Google Scholar]
- 39.Michlewski G., Cáceres J.F. Post-transcriptional control of miRNA biogenesis. RNA. 2019;25:1–16. doi: 10.1261/rna.068692.118. [DOI] [PMC free article] [PubMed] [Google Scholar]
- 40.Ha M., Kim V.N. Regulation of microRNA biogenesis. Nat. Rev. Mol. Cell Biol. 2014;15:509–524. doi: 10.1038/nrm3838. [DOI] [PubMed] [Google Scholar]
- 41.Fan L., Gao B., Xu Y., Flynn N., Le B., You C., Li S., Achkar N., Manavella P.A., Yang Z., Chen X. Arabidopsis AAR2, a conserved splicing factor in eukaryotes, acts in microRNA biogenesis. Proc. Natl. Acad. Sci. USA. 2022;119 doi: 10.1073/pnas.2208415119. [DOI] [PMC free article] [PubMed] [Google Scholar]
- 42.Yang N., Liang Y., Zhu T., Long Y., Chen Z., Zhang X., Jiang L. Epigenetic silencing of microRNA-199a-5p promotes the proliferation of non-small cell lung cancer cells by increasing AKAP1 expression. Oncol. Lett. 2021;21:434. doi: 10.3892/ol.2021.12695. [DOI] [PMC free article] [PubMed] [Google Scholar]
- 43.Zhang J., Chen Q., Liu B. iDRBP_MMC: Identifying DNA-Binding Proteins and RNA-Binding Proteins Based on Multi-Label Learning Model and Motif-Based Convolutional Neural Network. J. Mol. Biol. 2020;432:5860–5875. doi: 10.1016/j.jmb.2020.09.008. [DOI] [PubMed] [Google Scholar]
- 44.Grønning A.G.B., Doktor T.K., Larsen S.J., Petersen U.S.S., Holm L.L., Bruun G.H., Hansen M.B., Hartung A.-M., Baumbach J., Andresen B.S. DeepCLIP: predicting the effect of mutations on protein-RNA binding with deep learning. Nucleic Acids Res. 2020;48:7099–7118. doi: 10.1093/nar/gkaa530. [DOI] [PMC free article] [PubMed] [Google Scholar]
- 45.Li X., Kazan H., Lipshitz H.D., Morris Q.D. Finding the target sites of RNA-binding proteins. Wiley Interdiscip. Rev. RNA. 2014;5:111–130. doi: 10.1002/wrna.1201. [DOI] [PMC free article] [PubMed] [Google Scholar]
- 46.Zhang X., Liu S. RBPPred: predicting RNA-binding proteins from sequence using SVM. Bioinformatics. 2017;33:854–862. doi: 10.1093/bioinformatics/btw730. [DOI] [PubMed] [Google Scholar]
- 47.Brannan K.W., Jin W., Huelga S.C., Banks C.A.S., Gilmore J.M., Florens L., Washburn M.P., Van Nostrand E.L., Pratt G.A., Schwinn M.K., et al. SONAR Discovers RNA-Binding Proteins from Analysis of Large-Scale Protein-Protein Interactomes. Mol. Cell. 2016;64:282–293. doi: 10.1016/j.molcel.2016.09.003. [DOI] [PMC free article] [PubMed] [Google Scholar]
- 48.Alipanahi B., Delong A., Weirauch M.T., Frey B.J. Predicting the sequence specificities of DNA- and RNA-binding proteins by deep learning. Nat. Biotechnol. 2015;33:831–838. doi: 10.1038/nbt.3300. [DOI] [PubMed] [Google Scholar]
- 49.Gu K., Walpole C., Gooneratne S., Liu X., Haigh O.L., Radford K.J., Chong M.M. DROSHA but not DICER is required for human haematopoietic stem cell function. Clin. Transl. Immunol. 2022;11 doi: 10.1002/cti2.1361. [DOI] [PMC free article] [PubMed] [Google Scholar]
- 50.Brauksiepe B., Mujica A.O., Herrmann H., Schmidt E.R. The Serine/threonine kinase Stk33 exhibits autophosphorylation and phosphorylates the intermediate filament protein Vimentin. BMC Biochem. 2008;9:25. doi: 10.1186/1471-2091-9-25. [DOI] [PMC free article] [PubMed] [Google Scholar]
- 51.Wang P., Cheng H., Wu J., Yan A., Zhang L. STK33 plays an important positive role in the development of human large cell lung cancers with variable metastatic potential. Acta Biochim. Biophys. Sin. 2015;47:214–223. doi: 10.1093/abbs/gmu136. [DOI] [PubMed] [Google Scholar]
- 52.Scholl C., Fröhling S., Dunn I.F., Schinzel A.C., Barbie D.A., Kim S.Y., Silver S.J., Tamayo P., Wadlow R.C., Ramaswamy S., et al. Synthetic lethal interaction between oncogenic KRAS dependency and STK33 suppression in human cancer cells. Cell. 2009;137:821–834. doi: 10.1016/j.cell.2009.03.017. [DOI] [PubMed] [Google Scholar]
- 53.Babij C., Zhang Y., Kurzeja R.J., Munzli A., Shehabeldin A., Fernando M., Quon K., Kassner P.D., Ruefli-Brasse A.A., Watson V.J., et al. STK33 kinase activity is nonessential in KRAS-dependent cancer cells. Cancer Res. 2011;71:5818–5826. doi: 10.1158/0008-5472.CAN-11-0778. [DOI] [PubMed] [Google Scholar]
- 54.Fröhling S., Scholl C. STK33 kinase is not essential in KRAS-dependent cells--letter. Cancer Res. 2011;71:7716–7717. doi: 10.1158/0008-5472.CAN-11-2495. author reply 7717. [DOI] [PubMed] [Google Scholar]
- 55.Francart M.-E., Vanwynsberghe A.M., Lambert J., Bourcy M., Genna A., Ancel J., Perez-Boza J., Noël A., Birembaut P., Struman I., et al. Vimentin prevents a miR-dependent negative regulation of tissue factor mRNA during epithelial-mesenchymal transitions and facilitates early metastasis. Oncogene. 2020;39:3680–3692. doi: 10.1038/s41388-020-1244-1. [DOI] [PMC free article] [PubMed] [Google Scholar]
- 56.Cao Q., Mani R.-S., Ateeq B., Dhanasekaran S.M., Asangani I.A., Prensner J.R., Kim J.H., Brenner J.C., Jing X., Cao X., et al. Coordinated regulation of polycomb group complexes through microRNAs in cancer. Cancer Cell. 2011;20:187–199. doi: 10.1016/j.ccr.2011.06.016. [DOI] [PMC free article] [PubMed] [Google Scholar]
- 57.Wang G.G., Konze K.D., Tao J. Polycomb genes, miRNA, and their deregulation in B-cell malignancies. Blood. 2015;125:1217–1225. doi: 10.1182/blood-2014-10-606822. [DOI] [PMC free article] [PubMed] [Google Scholar]
- 58.Cao R., Tsukada Y.-I., Zhang Y. Role of Bmi-1 and Ring1A in H2A ubiquitylation and Hox gene silencing. Mol. Cell. 2005;20:845–854. doi: 10.1016/j.molcel.2005.12.002. [DOI] [PubMed] [Google Scholar]
- 59.Wang H., Wang L., Erdjument-Bromage H., Vidal M., Tempst P., Jones R.S., Zhang Y. Role of histone H2A ubiquitination in Polycomb silencing. Nature. 2004;431:873–878. doi: 10.1038/nature02985. [DOI] [PubMed] [Google Scholar]
- 60.Bracken A.P., Helin K. Polycomb group proteins: navigators of lineage pathways led astray in cancer. Nat. Rev. Cancer. 2009;9:773–784. doi: 10.1038/nrc2736. [DOI] [PubMed] [Google Scholar]
- 61.Gebert D., Hewel C., Rosenkranz D. Unitas: The universal tool for annotation of small RNAs. BMC Genom. 2017;18 doi: 10.1186/s12864-017-4031-9. [DOI] [PMC free article] [PubMed] [Google Scholar]
- 62.Love M.I., Huber W., Anders S. Moderated estimation of fold change and dispersion for RNA-seq data with DESeq2. Genome Biol. 2014;15 doi: 10.1186/s13059-014-0550-8. [DOI] [PMC free article] [PubMed] [Google Scholar]
- 63.Stark C., Breitkreutz B.-J., Reguly T., Boucher L., Breitkreutz A., Tyers M. BioGRID: a general repository for interaction datasets. Nucleic Acids Res. 2006;34:D535–D539. doi: 10.1093/nar/gkj109. [DOI] [PMC free article] [PubMed] [Google Scholar]
- 64.Oughtred R., Rust J., Chang C., Breitkreutz B.-J., Stark C., Willems A., Boucher L., Leung G., Kolas N., Zhang F., et al. The BioGRID database: A comprehensive biomedical resource of curated protein, genetic, and chemical interactions. Protein Sci. 2021;30:187–200. doi: 10.1002/pro.3978. [DOI] [PMC free article] [PubMed] [Google Scholar]
- 65.Ashburner M., Ball C.A., Blake J.A., Botstein D., Butler H., Cherry J.M., Davis A.P., Dolinski K., Dwight S.S., Eppig J.T., et al. Gene ontology: tool for the unification of biology. The Gene Ontology Consortium. Nat. Genet. 2000;25:25–29. doi: 10.1038/75556. [DOI] [PMC free article] [PubMed] [Google Scholar]
- 66.Gene Ontology Consortium The Gene Ontology resource: enriching a GOld mine. Nucleic Acids Res. 2021;49:D325–D334. doi: 10.1093/nar/gkaa1113. [DOI] [PMC free article] [PubMed] [Google Scholar]
- 67.Parikh R., Wilson B., Marrah L., Su Z., Saha S., Kumar P., Huang F., Dutta A. tRForest: a novel random forest-based algorithm for tRNA-derived fragment target prediction. NAR Genom. Bioinform. 2022;4:lqac037. doi: 10.1093/nargab/lqac037. [DOI] [PMC free article] [PubMed] [Google Scholar]
- 68.Kuhn M. Building Predictive Models in R Using the caret Package. J. Stat. Softw. 2008;28:1–26. doi: 10.18637/jss.v028.i05. [DOI] [Google Scholar]
- 69.Kim K., Baek S.C., Lee Y.-Y., Bastiaanssen C., Kim J., Kim H., Kim V.N. A quantitative map of human primary microRNA processing sites. Mol. Cell. 2021;81:3422–3439.e11. doi: 10.1016/j.molcel.2021.07.002. [DOI] [PubMed] [Google Scholar]
- 70.Drost H.-G., Paszkowski J. Biomartr: genomic data retrieval with R. Bioinformatics. 2017;33:1216–1217. doi: 10.1093/bioinformatics/btw821. [DOI] [PMC free article] [PubMed] [Google Scholar]
- 71.Osorio D., Rondón-Villarreal P., Torres R. Peptides: A package for data mining of antimicrobial peptides. R J. 2015;7:44–444. [Google Scholar]
Associated Data
This section collects any data citations, data availability statements, or supplementary materials included in this article.
Supplementary Materials
Data Availability Statement
-
•
This paper analyzes existing, publicly available data. These accession numbers for the datasets are listed in the key resources table.
-
•
The original code to this algorithm “sRNA-Effector v1.0” has been deposited and is publicly available on github: https://github.com/bw9bj/sRNA-Effector.
-
•
Any additional information required to reanalyze the data reported in this paper is available from the lead contact upon request.