

Abstract
Endotherms recently expanding to cold environments generally exhibit strong physiological acclimation to sustain high body temperature. During this process, gut microbes likely play a considerable role in host physiological functions, including digestion and thermogenesis. The light-vented bulbul Pycnonotus sinensis represents one such species. It used to be restricted to the Oriental realm but expanded its distribution range north to the Palearctic areas during the past few decades. Here, we explored the seasonal dynamics of the resting metabolic rate (RMR) and microbiota for local and newly colonized populations of the species. Our results showed that the mass-adjusted RMR and body mass were positively correlated with latitude variations in both seasons. Consistently, the gut microbiota showed a corresponding variation to the northern cold environments. In the two northern populations, the alpha diversity decreased compared with those of the two southern populations. Significant differences were detected in dominant phyla, such as Firmicutes, Bacteroidetes, Proteobacteria, and Desulfobacterota in both seasons. The core microbiota showed geographic differences in the winter, including the elevated relative abundance of 5 species in northern populations. Finally, to explore the link between microbial communities and host metabolic thermogenesis, we conducted a correlation analysis between microbiota and mass-adjusted RMR. We found that more genera were significantly correlated with mass-adjusted RMR in the wintering season compared to the breeding season (71 vs. 23). These results suggest that microbiota of the lighted-vented bulbul linked with thermogenesis in diversity and abundance under northward expansion.
Keywords: bird, body mass, gut microbiota, RMR, season
With climate change arising, the geographical distribution patterns of a large number of species on Earth have changed (Osland et al. 2021). Wild animals, including mammals, insects, and birds, have been extending their ranges toward the Arctic or North temperate zone (Bradshaw and Holzapfel 2006). For example, birds, which are highly mobile and may serve as early indicators of the effects of climate change on ecosystems and biodiversity, are dispersing both to higher latitudes and altitudes (Virkkala and Lehikoinen 2017). In the northern cold distribution range, birds routinely experience below-freezing average temperatures in the winter months and endure significant snowfall, while the southern populations experience much warmer winters where below-freezing temperatures and snow rarely occur (DeVries et al. 2022). How birds sustain high body temperature in cold environments deserves further exploration.
Facing cold ambient temperatures, endotherms need to rely on an increase in thermogenic rate to counteract heat lost to the environment, thereby maintaining a high and stable core body temperature (McKechnie 2008). The critical physiological strategy to cope with cold environments is changing the metabolic rate to modulate heat production (Li and Wang 2005). The metabolism is a physiological index that facilitates immediate and short-term responses to variations in weather and has been proposed as a response to changing environments (Van de Ven et al. 2013). In the cold and harsh winters, the increase in the metabolic rate in endotherms can improve their survival probability (Petit et al. 2017). Similarly, studies with cardinals in Ohio, United States, found that metabolic rates in nonbreeding season exceeded those in the breeding season, supporting the importance of being able to buffer against lower temperatures (Sgueo et al. 2012).
In addition to responses in metabolism, the gut microbiota can improve digestion and promote energy extraction and storage, which can be used as another indicator for acclimation to environmental change (Sepulveda and Moeller 2020). When wild populations are making shifts in geographic ranges, the modification and regulation of microbiotas occur more rapidly than genetic variation, which takes at least several generations (Alberdi et al. 2016). For example, the migration of swan geese Anser cygnoides from their breeding area at Khukh Lake, Mongolia, to their wintering area at Poyang Lake, China, is accompanied by changes in beta-diversity, which the gut microbiome varied widely between the two areas (Wu et al. 2018). In addition, bacterial metabolites can act as paracrine or endocrine factors, and may also play an important role in regulating the energy metabolism of the host species (Cani et al. 2019). In Mongolian gerbils, Meriones unguiculatus, some specific bacteria are more sensitive to ambient temperature and are associated with the dynamics of host metabolism (Khakisahneh et al. 2020). Similarly, the temperature reduces the relative abundance of Firmicutes when comparing the abundance of Firmicutes of house mice raised at 6 ℃ with those raised at 25 ℃ (Chevalier et al. 2015). However, whether the changes in microbial composition and host metabolic thermogenesis during bird expansion to the northern cold environment remains understudied.
The light-vented bulbul Pycnonotus sinensis was widely distributed in eastern and southern China, the Oriental realm in biogeography, before the 1930s. However, it has rapidly expanded its distribution range northward during the past few decades. By the 1980s, it crossed the Yangtze River and colonized the wide Palearctic ecozones to become residents of northeastern China by the 2000s (Figure 1) (Williams 1992; Zhang 2003). The light-vented bulbul serves as an excellent model system for understanding the adaptive and acclimation mechanisms associated with a northward range expansion scenario. Our previous studies have found significant divergence in vocalization rather than in genetics between northward expanding populations and original populations of light-vented bulbul (Song et al. 2013; Xing et al. 2013). However, it is not known whether light-vented bulbul exhibits metabolic and microbial changes in rapidly expanding populations acclimated to colder environments. In this study, we first explored the mass-adjusted RMR (resting metabolic rate) and body mass of different geographic populations. Then, we identified the seasonal and latitudinal changes in gut microbial compositions, and further correlated the microbiota to the mass-adjusted RMR. This study would provide a new insight into the response of the metabolism and gut microbiota of a host bird to the northern changed environment.
Figure 1.

Map of study sites (Downloaded from Standard Map Service System http://bzdt.ch.mnr.gov.cn/).
Materials and Methods
Sample collection
We captured adult light-vented bulbuls from south to north of their distribution range at four different sites: Guilin (GL, 25.04N, 110.17E), Nanchang (NC, 28.46N, 115.50E), Donghai (DH, 34.34N, 118.43E), and Beijing (BJ, 40.05N, 116.31E) in both the breeding season (June to July 2019) and wintering season (November to December 2019) using vocalization playback and mist nets (Figure 1). A total of 135 feces samples were collected, placed into the 2 mL sterilized storage tubes and immediately stored in liquid nitrogen (Table S1).
Respirometry measurement
Before measuring the RMR, we kept each individual bird in a dark and quiet cage for 1 h to put them in a resting state. We measured the rates of oxygen consumption VO2 by open flow-through respirometry (Foxbox) at 25℃. For RMR, light-vented bulbuls were maintained in a 1.0 L transparent metabolic chamber with an airflow rate of 500 mL/minute, and O2 and CO2 concentrations within the chamber were recorded for over 15 min. The lowest 1-min average oxygen consumption was taken as the RMR (Xiong et al. 2020).
DNA extraction and sequencing of fecal samples
DNA from fecal content was extracted by QIAamp DNA Stool Mini Kit from Qiagen (Germany), according to the manufacturer’s instructions. The 16S rRNA gene comprising the V3 and V4 regions was amplified by PCR using composite specific bacterial primers (343F: TACGGRAGGCAGCAG,798R: AGGGTATCTAATCCT) (Zhu et al. 2020). We then used the Illumina MiSeq sequencing platform to obtain paired-end 250 base pair reads. All subsequent library building and sequencing work were conducted at OE Biotech Co., Ltd. (China).
The DADA2 pipeline (Callahan et al. 2016) within the QIIME2 (version 2021.8) package (https://qiime2.org) was used to filter low-quality and chimera errors and generate unique sequence variants. Because the “operational taxonomic units (OTUs)” resulting from DADA2 are created through the grouping of unique sequences, these are the equivalent of 100% OTUs and are generally referred to as amplicon sequence variants (ASVs). The obtained ASVs were taxonomically annotated in the Silva SSURef database version 138 (https://www.arb-silva.de) (Bird et al. 2019).
Core microbiome
Groups of amplicon sequence variants (ASVs) were characterized as core microbiomes if they were present (i.e., detectable) in 50% or more individuals in the wintering or breeding populations, and these levels of differentiation corresponded to natural divisions in the data (Kokou et al. 2018).
Statistical analysis
Alpha diversity measures such as the observed ASVs (i.e., total number of ASVs detected per sample) and Shannon index (i.e., number of taxa and evenness of their distribution, more influenced by the richness and rare species) were compared (Delbeke et al. 2022). As some of the variables were not normally distributed, we used the Kruskal–Wallis test to compare the differences among groups. Effects of latitude and season in the 2- by 2-factor design on alpha diversity were analyzed by linear mixed model in R (implemented in R package limerTest) (Bates and Pinheiro 1998). We used the observed ASVs and Shannon index as the response variable, latitude and season as the fixed effects, and sex as the random effect.
Bray-Curtis and Jaccard’s dissimilarities were used to visualize beta diversity in order to examine the difference in microbial composition among the sampled groups. The principal component analysis was visualized in R (implemented in R package vegan) (Segata et al. 2011). We used pairwise permutational multivariate analysis of variance (PERMANOVA) with 999 random permutations to test the significance of the differences among groups (Anderson 2001).
The functional capacity of the gut microbial community was predicted using PICRUSt2. The ASVs table was supplied to PICRUSt2 and then predicted functional genes were categorized into MetaCyc pathways (Low et al. 2021). For comparing differences of four geographical populations in MetaCyc frequencies, multiple comparisons were adjusted for using the Benjamini–Hochberg correction (adjusted P ≤ 0.15).
Results
Latitudinal changes in RMR and body mass
We found that the mass-adjusted RMR exhibited significant geographic differences during the winter, with a significant positive correlation to latitude (Figure 2A; P = 0.0011, r = 0.33). Although this relationship was not significant in the breeding season, the trend was also positive (Figure 2A; P = 0.065, r = 0.25). Consistently, body mass was also positively related to the latitude in the both breeding and wintering seasons (Figure 2B; breeding season: P = 0.045, r = 0.27, wintering season: P = 0.0012, r = 0.25).
Figure 2.
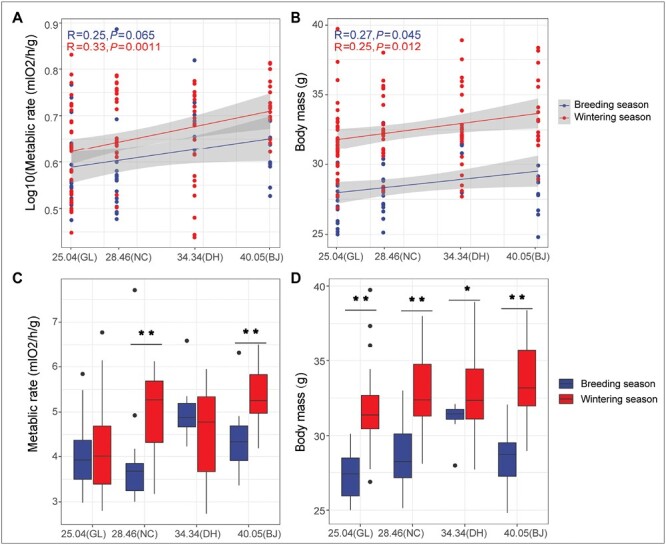
Changes of mass-adjusted RMR and body mass in different latitudes in light-vented bulbul. (A) Pearson correlation analysis between latitude and mass-adjusted RMR (A) as well as body mass (B) during the breeding and wintering seasons. Seasonal differences of mass-adjusted RMR (C) and body mass (D) in the same geographic population using the t test. (* represents P < 0.05, ** represents P < 0.01).
In addition, body mass and mass-adjusted RMR varied between seasons. The mass-adjusted RMR of the two populations (NC and BJ) were significantly elevated in the wintering season compared to the breeding season (Figure 2C; t test, P < 0.05), while no difference between the two seasons was found in the GL and DH populations (Figure 2C; t test, P > 0.05). The body mass of the four geographic populations was also significantly higher in the wintering season than breeding season (Figure 2D, t test, P < 0.05). Together, our results showed both latitudinal and seasonal variation in both mass-adjusted RMR and body mass, with variation in body mass bigger than that in mass-adjusted RMR.
Latitudinal variation in microbial diversity in different geographic populations
To identify whether the gut microbiota varied across a latitudinal gradient, we analyzed 16S rRNA sequences of 135 fecal samples from four groups (GL, NC, DH, and BJ) in both breeding and wintering seasons (Table S1). After quality control, a total of 6,170,643 high-quality sequences were retained for all samples and an average of 45,708 sequences were obtained per sample (Table S2). According to the rarefaction curve, the sequencing effort was sufficient to describe the bacterial diversity of the samples (Figure S1).
Linear mixed-effects model analysis indicated that latitude was the major factor shaping the microbial community diversity of light-vented bulbul (Table 1; FASVs = 52.6421, P < 0.001; FShannon = 83.709, P < 0.001). In the breeding season, although the ASVs index was not significantly different among populations (Figure 3A; Kruskal–Wallis test, P = 0.21), the value was higher in the southern populations (GL and NC) than that in the northern populations (DH and BJ). The Shannon index was significantly higher in the southern populations (GL and NC) than that in the northern populations (DH and BJ) (Figure 3A; Wilcoxon test, P < 0.05). In addition, based on the PERMANOVA of the Bray-Curtis and Jaccard’s distance matrix, we found that microbial communities were significantly different among the four groups (P = 0.001). The PCoA plot showed that the northern populations (DH and BJ) were clustered together, and were dramatically different from the others (Figure 3B and Figure S3). We further found that the relative abundances of the four phyla (Proteobacteria, Firmicutes, Bacteroidetes, and Desulfobacterota) were significantly different among the four groups (Figure 3C and Figure S2; Kruskal–Wallis test, FDR < 0.05). Core microbial analysis showed that only 3 species (Acinetobacter radioresistens, Bacillus nealsonii and Chryseobacterium stagni) had significantly increased relative abundances in the northern populations (DH and BJ) compared with the southern population (GL and NC), while 7 species were significantly decreased in the northern populations (Figure 3D; Wilcoxon test, FDR < 0.05). Overall, during the breeding season, the diversity of the northern populations was lower than that in the southern populations, and the microbial composition was also different among populations.
Table 1.
Linear mixed-effects model by restricted maximum likelihood (REML) for alpha diversity of ASVs and Shannon indices in light-vented bulbul.
| df | F | P value | |
|---|---|---|---|
| Main effects – ASVs | |||
| AIC = 1492.82 | |||
| Latitude | 131 | 52.64 | <0.001 |
| Season | 131 | 9.17 | 0.003 |
| Main effects – Shannon | |||
| AIC = 323.67 | |||
| Latitude | 131 | 83.71 | <0.001 |
| Season | 131 | 99.08 | <0.001 |
Df, degrees of freedom; AIC, Akaike information criterion.
Figure 3.
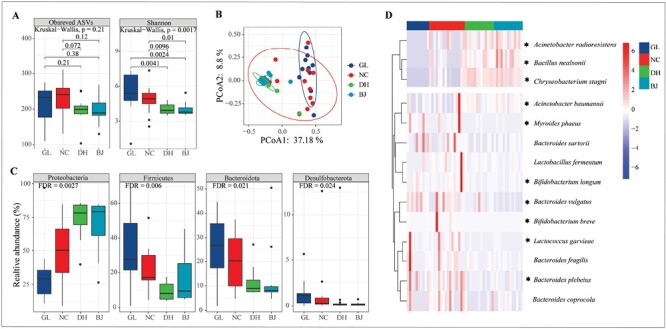
The gut microbiome diversity of light-vented bulbul in the breeding season. (A) Alpha diversity (ASVs and Shannon index) of bacterial communities in four groups using the Kruskal–Wallis test. (B) PCoA plot based on Bray-Curtis distance metrics depicting the differences in microbial community structure of four groups. (C) Relative abundances of bacterial phyla among groups (Kruskal–Wallis test). (D) The core microbiomes present in > 50% of individuals of light-vented bulbul in the breeding season. The relative abundance differences of genera between southern (GL and NC) and northern populations (DH and BJ) use the Wilcoxon test (* represents FDR < 0.05).
Likewise, a latitudinal pattern of gut microbiota was observed during the wintering season. Both ASVs and Shannon indices were significantly varied among the four groups (Figure 4A; Kruskal–Wallis test, P = 1e–09, P = 2.3e–09), and the two indices were significantly higher in the southern populations (GL and NC) than that in the northern populations (DH and BJ) (Wilcoxon test, P < 0.05). Microbial communities (i.e., beta-diversity) were significantly different across the four populations based on PERMANOVA of the Bray-Curtis and Jaccard’s distance matrix (P = 0.001). The principal-coordinate analysis (PCoA) graphs clearly illustrated that the samples of northern birds (DH and BJ) were clustered together, and GL samples were clustered together, whereas NC samples were discrete in the two clusters (Figure 4B and Figure S3). In addition, the relative abundances of the top five phyla (Firmicutes, Bacteroidetes, Proteobacteria, Actinobacteriota and Desulfobacterota) were significantly different in all four groups (Figure 4C and Figure S2; Kruskal–Wallis test, FDR < 0.05). The core microbiome showed geographic differences (Figure 4D). Specifically, the relative abundance of 11 species was significantly decreased in northern populations (DH and BJ), while those of 5 species (Alistipes shahii, Bacteroides stercoris, Bacteroides vulgatus, Parabacteroides merdae, and Bacteroides spp.) were significantly elevated in southern populations (GL and NC) (Figure 3D; Wilcoxon test, FDR < 0.05). Therefore, during the wintering season, the diversity of the northern populations decreased compared with that of the southern populations, and the microbial composition was also different between the northern and southern populations.
Figure 4.
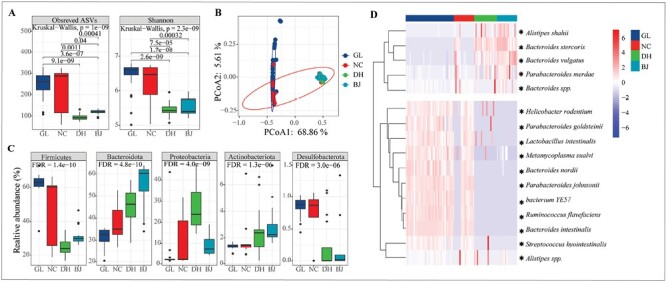
The gut microbiome diversity of light-vented bulbul in the wintering season. (A) Alpha diversity (ASVs and Shannon index) of bacterial communities in four groups using the Kruskal–Wallis test. (B) PCoA plot based on Bray-Curtis distance metrics depicting the differences in microbial community structure of four groups. (C) Relative abundances of bacterial phyla among groups (Kruskal–Wallis test). (D) The core microbiomes present in >50% of individuals of light-vented bulbul in wintering season. The relative abundance differences of genera between southern (GL and NC) and northern populations (DH and BJ) use the Wilcoxon test (* represents FDR < 0.05).
Furthermore, bacterial functions were predicted using the MetaCyc database. In both seasons, more pathways associated with metabolism and biosynthesis increased as latitude increased (Table S3). In the breeding season, the abundance of 143 pathways increased along latitudinal gradients (Mann–Kendall test, FDR < 0.01, z > 0), while 54 pathways decreased (Mann–Kendall test, FDR < 0.01, z < 0). In the wintering season, the abundance of 171 pathways increased with increasing latitude (Mann–Kendall test, FDR < 0.01, z > 0), whereas only 61 pathways decreased (Mann–Kendall test, FDR < 0.01, z < 0).
Identification of gut microbiota associated with the RMR
We further analyzed the gut microbiota in relation to the RMR of the light-vented bulbul. In the breeding season, 23 genera were significantly correlated with the mass-adjusted RMR (22 in positive correlation and 1 in negative correlation), of which only 4 genera were also related to latitude (Figure 5A). However, in the wintering season, we found more genera (71 genera: 20 in positive correlation, 51 in negative correlation) that were significantly correlated with the mass-adjusted RMR, of which 69 genera were related to latitude (Figure 5B). Importantly, in the wintering season, we found that the overlapping 19 genera, such as Bacteroides, Lachnospira, Alistipes, and Faecalibacterium, which were positively related to both latitude and mass-adjusted RMR, were significantly enriched (Figure 5B). Our results showed that more genera correlated with the mass-adjusted RMR and latitude in the wintering season than that in the breeding season, which suggested a critical role in metabolic thermogenesis, especially in winter.
Figure 5.

The compositions of the genera level were significantly correlated with mass-adjusted RMR of light-vented bulbul in the breeding season (A) and wintering season (B). Color gradient and circle size denote Pearson’s correlation coefficients. The color of the line represents the significance of the difference. The size of the line represents Pearson’s correlation coefficients.
Variation in microbial diversity between the breeding and wintering seasons
To evaluate the dynamics of the gut microbiota in the breeding and wintering seasons, a Venn diagram of amplicon sequence variants (ASVs) was constructed, as shown in Figure 6A. We found a total of 359 shared, and 989 and 654 specific ASVs to breeding samples and wintering samples, respectively. Linear mixed-effects model analysis indicated that seasonal change was also important to the microbial community diversity (Table 1; FASVs = 9.1736, P = 0.003; FShannon = 99.083, P < 0.0001). Specifically, in northern populations (DH and BJ), the ASVs index was dramatically higher in the breeding season than that in the wintering season (Figures 3A and 4A; Wilcoxon test, P < 0.01), while there was no significant difference in southern populations (GL and NC) (Figures 3A and 4A; Wilcoxon test, P > 0.05). The Shannon index was strikingly lower in the breeding season than that in the wintering season in the three groups (NC, DH, and BJ) (Figures 3A and 4A; Wilcoxon test, P < 0.01), while there was no significant difference in the GL group (Figures 3A and 4A; Wilcoxon test, P > 0.05). Additionally, PERMANOVA analysis revealed that microbial communities (beta-diversity) were significantly different between the two seasons (P = 0.001). The PCoA plot showed that the breeding season samples were clustered together, and were obviously different from the wintering samples (Figure 6B and Figure S3). Therefore, the diversity of the microbiota was different between seasons.
Figure 6.

Different microbiota in the breeding and wintering seasons of light-vented bulbul. (A) Venn diagram of common and specific amplicon sequence variants (ASVs). (B) PCoA plots based on Bray-Curtis distance metrics depict the differences in microbial community structure between two groups.
Significant differences were also detected at the phylum level during the breeding and wintering seasons. Firmicutes abundance was significantly higher in the wintering season than that in the breeding season in the four groups (Figures 3C and 4C; Wilcoxon test, FDR < 0.05). Similarly, Bacteroidetes abundance was significantly elevated in the wintering season in the three groups (Figures 3C and 4C; Wilcoxon test, FDR < 0.05) except for the GL. In contrast, Proteobacteria abundance was significantly decreased in the wintering season (Figures 3C and 4C; Wilcoxon test, FDR < 0.05).
Discussion
Distribution change and range expansion due to climate change have been widely documented (Kubelka et al. 2021). Birds recently expanding to cold environments generally exhibit increased thermogenesis, a critical way of producing heat by increasing metabolic rates (Van de Ven et al. 2013). The light-vented bulbul is an ideal species to investigate the RMR and gut microbiota to the newly colonized cold environments. The results show that body mass and mass-adjusted RMR are positively correlated with latitude. Compared with the breeding season, although the gut microbiota shows decreased diversity in the wintering season, more bacteria are significantly correlated with the mass-adjusted RMR, which may play a critical role in metabolic thermogenesis, especially in winter.
Metabolic rate is an important physiological indicator that reflects immediately increased energy throughput when facing sudden cold exposure (Ksiązek et al. 2009). Using both conventional and phylogenetically independent analysis of covariance, canids from the Arctic climate zone had significantly higher mass-adjusted basal metabolic rates than species from hot deserts (Careau et al. 2007). Similarly, we found that the mass-adjusted RMR was positively related to latitude in the wintering season (Figure 2A). Low temperatures could favor a high metabolic rate through an enhanced thermoregulatory capacity (e.g., the ability to withstand cold challenges). One potential explanation is that in a cold climate, the ambient temperature may regularly become much colder than the thermoneutral zone of an animal, so a high thermogenic capacity may be required to compensate for heat loss (Speakman et al. 2003). Thus, increasing metabolic rates can help birds rapidly adapt to colder environments.
Animals have a larger body size in cold regions than that in warm environments (Bergmann 1848). For example, it has been found that birds at higher latitudes have a general trend of larger body masses by analyzing regional distributions of avian body masses (Ashton 2002; Olson et al. 2009). Likewise, we found that the body mass of the light-vented bulbul increased with latitudinal variation (Figure 2B). One explanation is that in colder environments, larger body mass shows higher thermal inertia, or higher heat conservation capacity, which is consistent with the heat balance hypothesis (Olalla-Tárraga et al. 2010). An alternative explanation is that resident animals’ body weight often increases in winter and declines again in summer reflecting gradual seasonal changes in their fattening strategies (Lehikoinen 1987; Haftorn 1989). For example, the great tits respond to the rising risk of starvation under low temperatures by increasing their body reserves (Krams 2010).
Microbial diversity is the result of the coevolution of microbial communities and their hosts and is influenced by the environment (Ley et al. 2008). A recent study of tilapia found that the gut microbial diversity and richness severely decreased during cold exposure than that in fish raised at standard temperatures (Kokou et al. 2018). In addition, a study found that increasing temperatures by ~2 °C resulted in a decline in alpha diversity within the gut microbiota of individual lizards (Bestion et al. 2017). In our study, the bacterial alpha diversity of the northern populations (DH and BJ) was reduced compared to that of the southern populations (GL and NC), especially in the wintering season (Figure 4A). We infer that low temperature at high latitudes is a driving factor in changing the diversity of microbiota and that the variation in gut microbiota increases the fitness of birds living in colder environments.
Of the ecological and environmental factors, the diet has been shown to have a strong influence on shaping the gut microbiomes of many wild animals (Bodawatta et al. 2021; Renelies-Hamilton et al. 2021). Intraspecific differences in bird populations from habitats with potentially different food availabilities further support the plastic nature of bird gut microbiomes (Loo et al. 2019), as does the higher individual variation and gut bacterial diversity of omnivorous birds compared to bird species with more specialized diets (e.g., insectivores) (Bodawatta et al. 2018). The Light-vented bulbul is an omnivorous species and mainly feeds on plant food (including privets, purple leaf plumes, and black locust), accounting for 96.67% of the total food composition, while insects only account for 0.95% of northern populations (34.58N, 112.42E) in winter (Guo 2018). However, the light-vented bulbul is mainly fed on plant food, with the volume rate of plant and insect foods reaching 75% and 25%, respectively, in southern populations (22.65N, 110.18E) in winter (Peng et al. 2008). Here, we found that the relative abundances of dominant phyla, Firmicutes, Bacteroidetes, Proteobacteria, Actinobacteriota, and Desulfobacterota, were significantly different among the four groups during the wintering seasons (Figure 4C). We speculate that food might be a potential impact factor. Compared to southern source populations, the lighted-vented bulbul of northern populations merely feeds recent study suggests few insects, which may change the richness of bacteria.
The northward expanding populations change the structure of the gut microbiota, which may have a certain impact on metabolism (Cani et al. 2019). A recent study suggests that depletion of gut microbiota in antibiotic-treated gerbils impairs the metabolic plasticity of the host species (Khakisahneh et al. 2020). In addition, gut microbiota can alter host metabolism for large herbivores by producing short-chain fatty acids (Lindsay et al. 2020). In this study, we found that more genera were significantly correlated with the mass-adjusted RMR in the wintering season than that in the breeding season (Figures 5A and 5B). Furthermore, 19 genera were positively related to both RMR and latitude in winter, such as Bacteroides, Lachnospira, and Alistipes, which are associated with metabolic activities, including consumption of fruits and fiber (Golloso-Gubat et al. 2020), fermentation of carbohydrates, and utilization of nitrogenous substances (Stefanaki et al. 2017). Therefore, genera related to the mass-adjusted RMR may play a crucial role in enhancing host heat production for cold environments, especially in the wintering season for the light-vented bulbul.
Changing seasons usually result in variations in microbial abundance and diversity in animals (Sun et al. 2016). In ground squirrels, UniFrac analysis shows that microbiota is clustered strongly by season, while maternal influences, diet history, host age, and host body temperature have minimal effects (Carey et al. 2013). Compared with the variation in free-range yak gut microbes in the Qinghai–Tibet Plateau, the Shannon index is significantly higher in the cold season than that in the warm season (Wen et al. 2022). Seasonal changes in gut microbial communities are also found in the giant panda Ailuropoda melanoleuca as its diet transitions from protein-rich bamboo shoots to bamboo leaves that are less protein-rich with a higher cellulose content (Wu et al. 2017). Likewise, compared with the breeding season, the gut microbial alpha diversity decreased in the wintering season in northern populations (Figures 3A and 4A). The shift to a low-quality diet is related to the gut microbiota becoming less diverse, but more focused on decomposing cellulose. Previous studies indicated that Bacteroidetes can produce carbohydrate metabolism-related enzymes to promote food digestion and provide nutrients to the host (Newsome et al. 2020). Therefore, gut microbiota adapted to seasonal dietary changes can rapidly shift their metabolic activity, maximize energy extraction, thus likely increase fitness living in colder environments.
In summary, metabolic rates can enhance thermoregulatory capacity, which has been proposed as a response to changing environments. Gut microbes likely play a considerable role in host physiological functions (including digestion and thermogenesis) in the process of northward expansion. Our study showed the changes in metabolic rates and gut microbiota of the light-vented bulbul during the northward expansion, and the positive correlation of the body mass and mass-adjusted RMR with latitude. Additionally, the gut microbiota showed significant variation, with decreased diversity in the northern populations. Importantly, we have found that more genera were significantly correlated with the mass-adjusted RMR in the wintering season compared to the breeding season, expressing a crucial role in enhancing host heat production in cold environments. Our findings imply the importance of metabolism and gut microbiota variations in adaption to the newly colonized cold environment during rapid northward expansion.
Supplementary Material
Acknowledgements
The authors thank Prof Weiwei Zhang at Jiangxi Agricultural University, Prof Aiwu Jiang and Lijiang Yu at Guangxi University for their kind facility offer during the fieldworks. They also owe Zhishuai Zhang from Hebei University for his assistance during the field trip.
Contributor Information
Yun Wu, Key Laboratory of Zoological Systematics and Evolution, Institute of Zoology, Chinese Academy of Sciences, Beijing 100101, China; College of Life Science, University of Chinese Academy of Sciences, Beijing 100049, China.
Ying Xiong, Key Laboratory of Zoological Systematics and Evolution, Institute of Zoology, Chinese Academy of Sciences, Beijing 100101, China; Department of Zoology, College of Life science, Sichuan Agricultural University, Ya’an 625099, Sichuan, China.
Yanzhu Ji, Key Laboratory of Zoological Systematics and Evolution, Institute of Zoology, Chinese Academy of Sciences, Beijing 100101, China; College of Life Science, University of Chinese Academy of Sciences, Beijing 100049, China.
Yalin Cheng, Key Laboratory of Zoological Systematics and Evolution, Institute of Zoology, Chinese Academy of Sciences, Beijing 100101, China; College of Life Science, University of Chinese Academy of Sciences, Beijing 100049, China.
Qianghui Zhu, Key Laboratory of Zoological Systematics and Evolution, Institute of Zoology, Chinese Academy of Sciences, Beijing 100101, China; College of Life Science, University of Chinese Academy of Sciences, Beijing 100049, China.
Xiaolu Jiao, Key Laboratory of Zoological Systematics and Evolution, Institute of Zoology, Chinese Academy of Sciences, Beijing 100101, China; College of Life Science, University of Chinese Academy of Sciences, Beijing 100049, China.
Yongbin Chang, Key Laboratory of Zoological Systematics and Evolution, Institute of Zoology, Chinese Academy of Sciences, Beijing 100101, China; Henan Engineering Research Center of Bird-Related Outage, Zhengzhou Normal University, Zhengzhou 450044, China.
Na Zhao, Key Laboratory of Zoological Systematics and Evolution, Institute of Zoology, Chinese Academy of Sciences, Beijing 100101, China; School of Ecology and Environment, Anhui Normal University, Wuhu 241002, Anhui, China.
Jing Yang, School of Environmental Science and Engineering, Shaanxi University of Science and Technology, Xian 710021, China.
Fumin Lei, Key Laboratory of Zoological Systematics and Evolution, Institute of Zoology, Chinese Academy of Sciences, Beijing 100101, China; College of Life Science, University of Chinese Academy of Sciences, Beijing 100049, China; Center for Excellence in Animal Evolution and Genetics, Chinese Academy of Sciences, Kunming 650223, China.
Gang Song, Key Laboratory of Zoological Systematics and Evolution, Institute of Zoology, Chinese Academy of Sciences, Beijing 100101, China.
Ethics Approval
All samples were collected and all experiments were conducted in accordance with the regulations of the ethics committee of the Institute of Zoology, Chinese Academy of Sciences, Beijing, China, with authorization from the local forestry authorities, and in compliance with the National Wildlife Conservation Law of China.
Funding
The research is funded by National Natural Science Foundation of China (31471991) to G.S., the National Key Research and Development Program of China (2022YFC2601601), and the Strategic Priority Research Program of the Chinese Academy of Sciences (XDA19050202) to F.L., and the National Natural Science Foundation of China (32000295) to J.Y..
Competing Interests
The authors claim no competing interests.
Authors’ Contributions
FL and GS conceived the research project; YW, YX, and CY collected samples; YW, QZ, and XJ analyzed the data; YW sequenced samples; YW, JY, YC, NZ, and JY led the writing. All authors read and approved the final manuscript.
Data Availability
Raw sequence data have been deposited in the NCBI Sequence Read Archive under BioProject accession no. PRJNA892237.
References
- Alberdi A, Aizpurua O, Bohmann K, Zepeda-Mendoza ML, Gilbert MTP, 2016. Do vertebrate gut metagenomes confer rapid ecological adaptation? Trend Ecol Evol 31:689–699. [DOI] [PubMed] [Google Scholar]
- Anderson MJ, 2001. A new method for non-parametric multivariate analysis of variance. Austral Ecol 26:32–46. [Google Scholar]
- Ashton KG, 2002. Patterns of within-species body size variation of birds: strong evidence for Bergmann’s rule. Glob Ecol Biogeogr 11:505–523. [Google Scholar]
- Bates DM, Pinheiro JC, 1998. Linear and nonlinear mixed-effects models. America: Kansas University. Conference on Applied Statistics in Agriculture. 10.4148/2475-7772.1273 [DOI] [Google Scholar]
- Bergmann C, 1848. Über die Verhältnisse der Wärmeökonomie der Thiere zu ihrer Grösse. Gottinger Studien. [Google Scholar]
- Bestion E, Jacob S, Zinger L, Di Gesu L, Richard Met al. , 2017. Climate warming reduces gut microbiota diversity in a vertebrate ectotherm. Nature Ecol Evolut 1:1–3. [DOI] [PubMed] [Google Scholar]
- Bird S, Prewer E, Kutz S, Leclerc LM, Vilaça STet al. 2019. Geography, seasonality, and host-associated population structure influence the fecal microbiome of a genetically depauparate Arctic mammal. Ecol Evol 9:13202–13217. [DOI] [PMC free article] [PubMed] [Google Scholar]
- Bodawatta KH, Freiberga I, Puzejova K, Sam K, Jnsson KA, 2021. Flexibility and resilience of great tit Parus major gut microbiomes to changing diets. Anim Microbiome 3:20. [DOI] [PMC free article] [PubMed] [Google Scholar]
- Bodawatta KH, Sam K, Jonsson KA, Poulsen M, 2018. Comparative analyses of the digestive tract microbiota of new Guinean passerine birds. Front Microbiol 9:1830. [DOI] [PMC free article] [PubMed] [Google Scholar]
- Bradshaw WE, Holzapfel CM, 2006. Evolutionary response to rapid climate change. Science 312:1477–1478. [DOI] [PubMed] [Google Scholar]
- Callahan BJ, McMurdie PJ, Rosen MJ, Han AW, Johnson AJAet al. , 2016. DADA2: High-resolution sample inference from Illumina amplicon data. Nat Methods 13:581–583. [DOI] [PMC free article] [PubMed] [Google Scholar]
- Cani PD, Van Hul M, Lefort C, Depommier C, Rastelli Met al. , 2019. Microbial regulation of organismal energy homeostasis. Nat Metab 1:34–46. [DOI] [PubMed] [Google Scholar]
- Careau V, Morand-Ferron J, Thomas D, 2007. Basal metabolic rate of Canidae from hot deserts to cold arctic climates. J Mammal 88:394–400. [Google Scholar]
- Carey HV, Walters WA, Knight R, 2013. Seasonal restructuring of the ground squirrel gut microbiota over the annual hibernation cycle. Am J Physiol Regul Integr Comp Physiol 304:R33–R42. [DOI] [PMC free article] [PubMed] [Google Scholar]
- Chevalier C, Stojanović O, Colin DJ, Suarez-Zamorano N, Trajkovski M, 2015. Gut microbiota orchestrates energy homeostasis during cold. Cell 163:1360–1374. [DOI] [PubMed] [Google Scholar]
- Delbeke H, Casteels I, Joossens M, 2022. The effect of topical anesthetics on 16S ribosomal ribonucleic acid amplicon sequencing results in ocular surface microbiome research. Transl Vision Sci Technol 11:2. [DOI] [PMC free article] [PubMed] [Google Scholar]
- DeVries MS, Waraczynski M, Baldassarre DT, Slevin MC, Anderson Ret al. , 2022. Geographic variation in morphology of northern cardinals: possible application of Bergmann’s rule? J Field Ornithol 93:9.3 [Google Scholar]
- Golloso-Gubat MJ, Ducarmon QR, Tan RCA, Zwittink RD, Kuijper EJet al. , 2020. Gut microbiota and dietary intake of normal-weight and overweight Filipino children. Microorganisms 8:1015. [DOI] [PMC free article] [PubMed] [Google Scholar]
- Guo SL, 2018. Preliminary study on winter feeding habits and feeding space niche of light-vented bulbul. Heilongjiang Animal Sci Vet Med 7:210–212. [Google Scholar]
- Haftorn S, 1989. Seasonal and diurnal body weight variations in titmice, based on analyses of individual birds. Wilson Bull 101:217–235. [Google Scholar]
- Khakisahneh S, Zhang XY, Nouri Z, Wang DH, 2020. Gut microbiota and host thermoregulation in response to ambient temperature fluctuations. Msystems 5:e00514–e00520. [DOI] [PMC free article] [PubMed] [Google Scholar]
- Kokou F, Sasson G, Nitzan T, Doron-Faigenboim A, Harpaz Set al. , 2018. Host genetic selection for cold tolerance shapes microbiome composition and modulates its response to temperature. Elife 7:6398e3. [DOI] [PMC free article] [PubMed] [Google Scholar]
- Krams I, Cirule D, Suraka V, Krama T, Rantala MJet al. , 2010. Fattening strategies of wintering great tits support the optimal body mass hypothesis under conditions of extremely low ambient temperature. Funct Ecol 24:172–177. [Google Scholar]
- Ksiązek A, Czerniecki J, Konarzewski M, 2009. Phenotypic flexibility of traits related to energy acquisition in mice divergently selected for basal metabolic rate (BMR). J Exp Biol 212:808–814. [DOI] [PubMed] [Google Scholar]
- Kubelka V, Sandercock BK, Székely T, Freckleton RP, 2021. Animal migration to northern latitudes: Environmental changes and increasing threats. Trends Ecol Evolut 37:30–41. [DOI] [PubMed] [Google Scholar]
- Lehikoinen E, 1987. Seasonality of the daily weight cycle in wintering passerines and its consequences. Ornis Scandinavica 18:216–226. [Google Scholar]
- Ley RE, Hamady M, Lozupone C, Turnbaugh PJ, Ramey RRet al. , 2008. Evolution of mammals and their gut microbes. Science 320:1647–1651. [DOI] [PMC free article] [PubMed] [Google Scholar]
- Li XS, Wang DH, 2005. Seasonal adjustments in body mass and thermogenesis in Mongolian gerbils Meriones unguiculatus: the roles of short photoperiod and cold. J Compar Physiol 175:593–600. [DOI] [PubMed] [Google Scholar]
- Lindsay EC, Metcalfe NB, Llewellyn MS, 2020. The potential role of the gut microbiota in shaping host energetics and metabolic rate. J Anim Ecol 89:2415–2426. [DOI] [PubMed] [Google Scholar]
- Loo WT, Garcia-Loor J, Dudaniec RY, Kleindorfer S, Cavanaugh CM, 2019. Host phylogeny, diet, and habitat differentiate the gut microbiomes of Darwin’s finches on Santa Cruz Island. Sci Rep 9:18781. [DOI] [PMC free article] [PubMed] [Google Scholar]
- Low A, Soh M, Miyake S, Aw VZJ, Feng Jet al. , 2021. Longitudinal changes in diet cause repeatable and largely reversible shifts in gut microbial communities of laboratory mice and are observed across segments of the entire intestinal tract. Int J Mol Sci 22:5981. [DOI] [PMC free article] [PubMed] [Google Scholar]
- McKechnie AE, 2008. Phenotypic flexibility in basal metabolic rate and the changing view of avian physiological diversity: a review. J Compar Physiol B 178:235–247. [DOI] [PubMed] [Google Scholar]
- Newsome SD, Feeser KL, Bradley CJ, Wolf C, Takacs-Vesbach Cet al. , 2020. Isotopic and genetic methods reveal the role of the gut microbiome in mammalian host essential amino acid metabolism. Proc Royal Soc B 287:2995. [DOI] [PMC free article] [PubMed] [Google Scholar]
- Olalla-Tárraga MA, Bini LM, Diniz-Filho JA, Rodríguez MA, 2010. Cross-species and assemblage-based approaches to Bergmann’s rule and the biogeography of body size in Plethodon salamanders of eastern North America. Ecography 33:362–368. [Google Scholar]
- Olson VA, Davies RG, Orme CDL, Thomas GH, Meiri Set al. , 2009. Global biogeography and ecology of body size in birds. Ecology Lett 12:249–259. [DOI] [PubMed] [Google Scholar]
- Osland MJ, Stevens PW, Lamont MM, Brusca RC, Hart KMet al. 2021. Tropicalization of temperate ecosystems in North America: The northward range expansion of tropical organisms in response to warming winter temperatures. Global Change Biol 27:3009–3034. [DOI] [PubMed] [Google Scholar]
- Peng YH, Wen QH, Huang J, Huang YX, 2008. The study of spring diet habit of three species of Pycnonotidae. Sichuan J Zool 27:99–101. [Google Scholar]
- Petit M, Clavijo-Baquet S, Vézina F, 2017. Increasing winter maximal metabolic rate improves intrawinter survival in small birds. Physiol Biochem Zool 90:166–177. [DOI] [PubMed] [Google Scholar]
- Renelies-Hamilton J, Germer K, Sillam-Dussès D, Bodawatta KH, Poulsen M, 2021. Disentangling the relative roles of vertical transmission, subsequent colonizations, and diet on cockroach microbiome assembly. Msphere 6:e01023–e01020. [DOI] [PMC free article] [PubMed] [Google Scholar]
- Segata N, Izard J, Waldron L, Gevers D, Miropolsky Let al. , 2011. Metagenomic biomarker discovery and explanation. Genome Biol 12:R601–R618. [DOI] [PMC free article] [PubMed] [Google Scholar]
- Sepulveda J, Moeller AH, 2020. The effects of temperature on animal gut microbiomes. Front Microbiol 11:384. [DOI] [PMC free article] [PubMed] [Google Scholar]
- Sgueo C, Wells ME, Russell DE, Schaeffer PJ, 2012. Acclimatization of seasonal energetics in northern cardinals Cardinalis cardinalis through plasticity of metabolic rates and ceilings. J Exp Biol 215:2418–2424. [DOI] [PubMed] [Google Scholar]
- Song G, Yu L, Gao B, Zhang R, Qu Yet al. , 2013. Gene flow maintains genetic diversity and colonization potential in recently range-expanded populations of an Oriental bird, the Light-vented bulbul (Pycnonotus sinensis, Aves: Pycnonotidae). Divers Distrib 19:1248–1262. [Google Scholar]
- Speakman JR, Thomas DW, Kunz T, Fenton M, 2003. Physiological ecology and energetics of bats. Chicago: University of Chicago Press, pp. 430–490. [Google Scholar]
- Stefanaki C, Peppa M, Mastorakos G, Chrousos GP, 2017. Examining the gut bacteriome, virome, and mycobiome in glucose metabolism disorders: Are we on the right track? Metabolism 73:52–66. [DOI] [PubMed] [Google Scholar]
- Sun B, Wang X, Bernstein S, Huffman MA, Xia DPet al. , 2016. Marked variation between winter and spring gut microbiota in free-ranging Tibetan Macaques. Macaca thibetana. Sci Rep 6:1–8. [DOI] [PMC free article] [PubMed] [Google Scholar]
- Van de Ven TM, Mzilikazi N, McKechnie AE, 2013. Phenotypic flexibility in body mass, basal metabolic rate and summit metabolism in southern red bishops Euplectes orix: responses to short term thermal acclimation. Compar Biochem Physiol 165:319–327. [DOI] [PubMed] [Google Scholar]
- Virkkala R, Lehikoinen A, 2017. Birds on the move in the face of climate change: High species turnover in northern Europe. Ecol Evol 7:8201–8209. [DOI] [PMC free article] [PubMed] [Google Scholar]
- Wen Y, Li S, Wang Z, Feng H, Yao Xet al. , 2022. Intestinal microbial diversity of free-range and captive yak in Qinghai Province. Microorganisms 10:754. [DOI] [PMC free article] [PubMed] [Google Scholar]
- Williams MD, Carey GJ, Duff DG, Xu WS, 1992. Autumn bird migration at Beidaihe, China. Forktail 7:3–55. [Google Scholar]
- Wu Q, Wang X, Ding Y, Hu Y, Nie Yet al. , 2017. Seasonal variation in nutrient utilization shapes gut microbiome structure and function in wild giant pandas. Proc Royal Soc B 284:201709550955. [DOI] [PMC free article] [PubMed] [Google Scholar]
- Wu Y, Yang Y, Cao L, Yin H, Xu Met al. , 2018. Habitat environments impacted the gut microbiome of long-distance migratory swan geese but central species conserved. Sci Rep 8:1–11. [DOI] [PMC free article] [PubMed] [Google Scholar]
- Xing X, Alström P, Yang X, Lei F, 2013. Recent northward range expansion promotes song evolution in a passerine bird, the Light-vented Bulbul. J Evol Biol 26:867–877. [DOI] [PubMed] [Google Scholar]
- Xiong Y, Fan L, Hao Y, Cheng Y, Chang Yet al. , 2020. Physiological and genetic convergence supports hypoxia resistance in high-altitude songbirds. PLoS Genet 16:e100. [DOI] [PMC free article] [PubMed] [Google Scholar]
- Zhang ZW, Bi ZL, Wang N, Song J, 2003. Two new records of birds found in Beijing. Beijing Normal Univ (Nat Sci) 39:541–543. [Google Scholar]
- Zhu C, Song W, Tao Z, Liu H, Zhang Set al. , 2020. Analysis of microbial diversity and composition in small intestine during different development times in ducks. Poult Sci 99:1096–1106. [DOI] [PMC free article] [PubMed] [Google Scholar]
Associated Data
This section collects any data citations, data availability statements, or supplementary materials included in this article.
Supplementary Materials
Data Availability Statement
Raw sequence data have been deposited in the NCBI Sequence Read Archive under BioProject accession no. PRJNA892237.