

Abstract
Background
Over 20% of patients are discharged to a skilled nursing facility (SNF) after coronary artery bypass graft surgery, but little is known about specific drivers for postdischarge SNF use. The purpose of this study was to evaluate hospital variation in SNF use and its association with postoperative outcomes after coronary artery bypass graft.
Methods and Results
A retrospective study design utilizing Medicare Provider Analysis and Review files was used to evaluate SNF use among 70 509 beneficiaries undergoing coronary artery bypass graft, with or without valve procedures, between 2016 and 2018. A total of 17 328 (24.6%) were discharged to a SNF, ranging from 0% to 88% across 871 hospitals. Multilevel logistic regression models identified significant patient‐level predictors of discharge to SNF including increasing age, comorbidities, female sex, Black race, dual eligibility, and postoperative complications. After adjusting for patient and hospital factors, 15.6% of the variation in hospital SNF use was attributed to the discharging hospital. Compared with the lower quartile of hospital SNF use, hospitals in the top quartile of SNF use had lower risk‐adjusted 1‐year mortality (12.5% versus 8.6%, P<0.001) and readmission (59.9% versus 49.8%, P<0.001) rates for patients discharged to a SNF.
Conclusions
There is high variability in SNF use among hospitals that is only partially explained by patient characteristics. Hospitals with higher SNF utilization had lower risk‐adjusted 1‐year mortality and readmission rates for patients discharged to a SNF. More work is needed to better understand underlying provider and hospital‐level factors contributing to SNF use variability.
Keywords: CABG, hospital variation, outcomes, postacute care, SNF
Subject Categories: Health Services, Quality and Outcomes, Cardiovascular Surgery
Nonstandard Abbreviations and Acronyms
- SNF
skilled nursing facility
Clinical Perspective.
What Is New?
Patient and complication‐specific factors after coronary artery bypass graft only partially explain the significant variation in skilled nursing facility (SNF) use by hospitals.
What Are the Clinical Implications?
Careful evaluation of which patients are potentially better suited for SNFs is key for optimizing postdischarge outcomes.
More granular SNF‐level factors, such as SNF quality, warrant more research to further evaluate differences in hospital SNF use and outcomes after coronary artery bypass graft.
Skilled nursing facility (SNF) care comprises the largest share of 90‐day postacute care (PAC) spending relative to other modalities (ie, home health, inpatient rehabilitation, and outpatient rehabilitation) among Medicare beneficiaries after surgery. 1 Prior research, specifically within the field of cardiac surgery, has shown significant variability in PAC care after coronary artery bypass graft (CABG) surgery and aortic valve replacement, with inpatient rehabilitation and SNF accounting for >80% of spending variation between low‐ and high‐PAC–spending hospitals. 2 , 3 Additionally, >20% of patients are admitted to a SNF after CABG 1 , 2 and experience worse mortality and readmission rates, further increasing downstream health care costs. 2 , 4 The increased economic burden of SNF care has added pressure on providers to reduce unnecessary PAC spending, while still maintaining quality care. 5 , 6
Despite these known facts, there is little understanding of potential drivers of hospital‐level variation in SNF use and the extent to which it affects postoperative outcomes after CABG. A high acuity patient population that is older with more comorbidities, that experience more frequent postoperative complications, could drive higher postdischarge SNF use and, subsequently, worse clinical outcomes. 4 , 7 , 8 Alternatively, high SNF use may be driven by nonclinical factors, such as hospital size, staffing, geographic location, and ownership style (eg, nonprofit, for‐profit). 9 , 10 , 11 Taken together, it is, therefore, critical to understand the relationship between variation in hospital SNF use and postoperative outcomes after CABG to ensure optimal short‐ and long‐term care for patients.
The purpose of this study was to evaluate variation in hospital SNF use after CABG and its impact on postoperative outcomes across hospitals in a national cohort of Medicare beneficiaries. We hypothesized that there would be significant variation in SNF use after CABG that is explained only partially by patient‐level factors. We additionally hypothesized that patients discharged from high SNF‐use hospitals will have worse postoperative mortality and readmission rates.
Methods
Data Source and Sample
The primary source of data for this study was the Medicare Beneficiary Summary File, Medicare Provider Analysis and Review, as well as Carrier and SNF claim files from 2016 to 2018. Medicare Provider Analysis and Review data were used to identify patients undergoing CABG using the International Classification of Diseases, Tenth Revision (ICD‐10) procedure codes 0210*, 0211*, 0212*, and 0213*. Patients were included in the study cohort if they were 65 years of age or older and underwent CABG between July 1, 2016 and December 31, 2017. Patients were excluded from the study cohort if they (1) died during the index admission; (2) were not enrolled in both Parts A and B 6 months before surgery through 1 year after discharge; (3) had a SNF claim within 6 months before the index admission; or (4) were admitted to hospitals with <20 cases over the study period (Figure S1). The University of Michigan Institutional Review Board approved this study (HUM00175541). The use of Medicare data was covered by a data use agreement with ResDAC (20‐UFA04161). Informed consent was waived because the study used existing data with no direct identifiers. Because of the sensitive nature of the data in this study, public access to the data will not be provided.
Skilled Nursing Facility Use
Medicare SNF files were used to identify claims for SNF use in our sample, which were used to create several variables of interest. At the beneficiary level, SNF use was categorized as yes if a beneficiary had a paid SNF claim within 1 year of discharge, otherwise the beneficiary was categorized as having no SNF use. The number of days in a SNF within 1 year of discharge was estimated based on admission and discharge dates from SNF claims. At the hospital level, crude rates of SNF use were estimated by dividing the number of patients with any SNF use by the total number of patients attributed to that hospital based on the unique Medicare provider number. Hospitals were ranked according to their SNF use rates and subsequently grouped into 4 quartiles. The first quartile included all patients in the lowest SNF use hospitals and the fourth quartile included all patients in the highest SNF use hospitals.
Clinical Outcomes
The outcomes of interest in this study were 1‐year rates of mortality and hospital readmission. Postoperative mortality was defined as death within 1 year after discharge from the index hospitalization (ie, hospitalization in which CABG was performed). Dates of discharge and death were identified from the Medicare Beneficiary Summary Files. A binary indicator of death was created for each patient as well to indicate whether the patient died within 1 year of discharge, otherwise, the patient was categorized as alive. Readmission was defined as any inpatient readmission to an acute care hospital within 1 year of discharge from the index hospitalization. Readmissions within 1 year were chosen to fully capture the range of patients with short and long lengths of stays within SNFs.
Covariates
Several patient‐level covariates were created for our study cohort. Demographic information including age, sex (ie, male versus female), and self‐reported race/ethnicity category (White, Black, Other, Asian, Hispanic, North American Native, and Unknown) were abstracted from the Medicare Beneficiary Summary File files. Beneficiary eligibility for both Medicare and Medicaid insurance coverage, referred to as dual eligible, was also obtained from the Medicare Beneficiary Summary File.
Clinical factors from the index admission were drawn from the Medicare Provider Analysis and Review files, which included type of admission (ie, elective versus nonelective), hospital length of stay (in days), and concomitant valve surgery. Medicare Provider Analysis and Review and Carrier files were used to identify comorbidities present within 6 months before admission based on the Charlson Comorbidity Index, categorized as (0, 1, 2, or 3 or more). 12 Established claims‐based algorithms were also used to identify postoperative complications, including acute kidney injury, bleeding, pneumonia, cardiac arrest, stroke, myocardial infarction, and sepsis. 13 Hospital characteristics included teaching status (major, minor, nonteaching), system affiliated (yes versus no), ownership (nonprofit, for‐profit, government), and hospital size (≥500, 300–499, 100–299, or <100 beds).
Statistical Analysis
Patient characteristics were described and compared across quartiles of hospital‐level SNF use. χ2 and ANOVA were used to test for significant differences in categorical and continuous variables, respectively. Additionally, Cochrane‐Armitage tests of trend were conducted to evaluate trends in categorical variables across quartile as an ordinal variable, and linear regression was used to test for significant differences in continuous variables across quartiles as a continuous variable. Multivariable logistic regression was used to identify independent patient (ie, age, sex, race/ethnicity, dual eligible status, comorbid conditions, postoperative complications), clinical (ie, elective versus nonelective, concomitant procedures), and hospital‐level (ie, teaching status, ownership, hospital size) predictors of SNF use. From this model, a predicted probability of SNF use was also estimated. The predicted probabilities of SNF use were summed at the hospital level to get an expected SNF rate. Hospital observed and expected SNF rates were compared using a Pearson correlation coefficient. Multivariable logistic regression models were used to generate risk‐adjusted rates of 1‐year mortality and readmission rates across quartiles of SNF use. Hospital SNF use quartiles were modeled as categorical variables and tested for significant differences relative to the lowest quartile, as well as an ordinal variable to test for a significant linear trend across quartiles. All multivariable models included adjustment for patient characteristics, hospital characteristics, and included a hospital random effect. Statistical tests were performed at the 5% significance level. Finally, statistical analyses were performed using Stata 17 (Stata Corp., College Station, TX).
Results
Patient and Hospital Characteristics
This study included 70 509 patients (871 hospitals) who underwent CABG with or without valve procedure, of which 17 328 (24.6%) used a SNF after discharge. The low quartile of SNF use hospitals discharged (9.2%) to a SNF while the top quartile of SNF use hospitals discharged 41.3% of patients to a SNF. Characteristics that significantly differed across unadjusted hospital quartiles for SNF use are listed in Table 1. A larger proportion of patients in hospitals with high SNF use had more comorbidities (Charlson Comorbidity Index ≥3: 43.9% versus 37.5%, P<0.001), were dual eligible (10.0% versus 9.2%, P<0.001), and more often had a concomitant valve procedure (20.3% versus 15.4%, P<0.001). Patients who received care at high SNF use hospitals more frequently experienced acute kidney injury (14.9% versus 11.7%, P<0.001) and pneumonia (2.4% versus 1.8%, P<0.001). Patients discharged from hospitals with high SNF use had a higher hospital (9.4 days versus 8.2 days, P<0.001) and SNF (10.4 days versus 2.8 days, P<0.001) mean length of stay. Hospitals with high SNF use were more likely to be major teaching hospitals (26.8% versus 20.2%, P<0.001), encompassed within an affiliated hospital system (80.4% versus 74.4%, P<0.001), nonprofit (80.2% versus 73.0%, P<0.001), and have ≥500 beds (37.6% versus 34.5%, P<0.001).
Table 1.
Baseline Characteristics of Patients Undergoing Coronary Artery Bypass Grafting Stratified by Hospital Skilled Nursing Facility Use Quartiles
| Characteristics | Overall | Quartile of hospital SNF Use | P value | P trend | |||
|---|---|---|---|---|---|---|---|
| Q1 ‐ low | Q2 | Q3 | Q4 ‐ high | ||||
| Hospital, n | 871 | 216 | 219 | 219 | 217 | ‐ | |
| Patients, n | 70 509 | 14 639 | 20 329 | 17 918 | 17 623 | ‐ | |
| SNF use, n (%) | 17 328 (24.6) | 1343 (9.2) | 3780 (18.6) | 4919 (27.5) | 7286 (41.3) | <0.001 | <0.001 |
| Days in SNF, mean (SD) | 6.4 (17.6) | 2.8 (13.4) | 5.1 (15.7) | 7.1 (18.3) | 10.4 (20.9) | <0.001 | <0.001 |
| Age, y, mean (SD) | 73.6 (5.6) | 72.9 (5.3) | 73.5 (5.5) | 73.7 (5.7) | 74.2 (5.8) | <0.001 | <0.001 |
| Female, n (%) | 17 937 (25.4) | 3635 (24.8) | 5120 (25.2) | 4547 (25.4) | 4635 (26.3) | 0.015 | 0.002 |
| Race/ethnicity, n (%) | <0.001 | ||||||
| White | 63 741 (90.4) | 13 216 (90.3) | 18 150 (89.3) | 16 296 (91.0) | 16 079 (91.2) | <0.001 | |
| Black | 2706 (3.8) | 666 (4.6) | 952 (4.7) | 553 (3.1) | 535 (3.0) | <0.001 | |
| Other | 1108 (1.6) | 159 (1.1) | 380 (1.9) | 299 (1.7) | 270 (1.5) | 0.036 | |
| Asian | 784 (1.1) | 132 (0.9) | 255 (1.3) | 188 (1.1) | 209 (1.2) | 0.129 | |
| Hispanic | 548 (0.8) | 108 (0.7) | 143 (0.7) | 165 (0.9) | 132 (0.8) | 0.391 | |
| North American Native | 377 (0.8) | 113 (0.8) | 129 (0.6) | 83 (0.5) | 52 (0.3) | 0.950 | |
| Unknown | 1245 (1.8) | 245 (1.7) | 320 (1.6) | 334 (1.9) | 346 (2.0) | 0.008 | |
| Medicare/Medicaid dual eligibility, n (%) | 6618 (9.4) | 1347 (9.2) | 1854 (9.1) | 1651 (9.2) | 1766 (10.0) | 0.010 | 0.008 |
| Elective procedure, n (%) | 39 808 (56.5) | 8862 (60.5) | 11 671 (57.4) | 9916 (55.3) | 9359 (53.1) | <0.001 | <0.001 |
| Concomitant valve procedure, n (%) | 13 113 (18.6) | 2258 (15.4) | 3841 (18.9) | 3439 (19.2) | 3575 (20.3) | <0.001 | <0.001 |
| Charlson Comorbidity Index, n (%) | <0.001 | ||||||
| 0 | 10 310 (14.6) | 2413 (16.5) | 2954 (14.5) | 2557 (14.3) | 2386 (13.5) | <0.001 | |
| 1 | 16 371 (23.2) | 3692 (25.2) | 4766 (23.4) | 3978 (22.2) | 3935 (22.3) | <0.001 | |
| 2 | 14 431 (20.5) | 3046 (20.8) | 4141 (20.4) | 3671 (20.5) | 3573 (20.3) | 0.324 | |
| ≥3 | 29 397 (41.7) | 5488 (37.5) | 8468 (41.7) | 7712 (43.0) | 7729 (43.9) | <0.001 | |
| Hospital length of stay, mean (SD) | 8.9 (5.2) | 8.2 (4.5) | 8.8 (5.1) | 9.0 (5.4) | 9.4 (5.5) | <0.001 | <0.001 |
| Complications, n (%) | |||||||
| Acute kidney injury | 9914 (14.1) | 1710 (11.7) | 2874 (14.1) | 2710 (15.1) | 2620 (14.9) | <0.001 | <0.001 |
| Bleeding | 34 571 (49.0) | 6762 (46.2) | 10 189 (50.1) | 9310 (52.0) | 8310 (47.2) | <0.001 | 0.051 |
| Pneumonia | 1408 (2.0) | 263 (1.8) | 330 (1.6) | 386 (2.2) | 429 (2.4) | <0.001 | <0.001 |
| Cardiac arrest | 344 (0.5) | 57 (0.4) | 113 (0.6) | 78 (0.4) | 96 (0.5) | 0.07 | 0.209 |
| Stroke | 537 (0.8) | 85 (0.6) | 159 (0.8) | 153 (0.9) | 140 (0.8) | 0.033 | 0.028 |
| Myocardial infarction | 454 (0.6) | 71 (0.5) | 129 (0.6) | 114 (0.6) | 140 (0.8) | 0.007 | 0.001 |
| Sepsis | 606 (0.9) | 104 (0.7) | 163 (0.8) | 166 (0.9) | 173 (1.0) | 0.034 | 0.004 |
| Hospital characteristics | |||||||
| Teaching status, n (%) | <0.001 | ||||||
| Major | 19 603 (27.8) | 2954 (20.2) | 6162 (30.3) | 5759 (32.1) | 4728 (26.8) | <0.001 | |
| Minor | 36 683 (52.0) | 8227 (56.2) | 11 108 (54.6) | 8913 (49.7) | 8435 (47.9) | <0.001 | |
| Nonteaching | 14 223 (20.2) | 3458 (23.6) | 3059 (15.1) | 3246 (18.1) | 4460 (25.3) | <0.001 | |
| System affiliated, n (%) | 57 506 (81.6) | 10 895 (74.4) | 17 611 (86.6) | 14 828 (82.8) | 14 172 (80.4) | <0.001 | <0.001 |
| Ownership, n (%) | <0.001 | ||||||
| Not‐for‐profit | 55 809 (79.2) | 10 679 (73.0) | 16 286 (80.1) | 14 709 (82.1) | 14 135 (80.2) | <0.001 | |
| For‐profit | 8893 (12.6) | 2888 (19.7) | 2163 (10.6) | 1718 (9.6) | 2124 (12.1) | <0.001 | |
| Government | 5807 (8.2) | 1072 (7.3) | 1880 (9.3) | 1491 (8.3) | 1364 (7.7) | 0.743 | |
| Size (No. of beds), n (%) | <0.001 | ||||||
| ≥500 | 29 189 (41.4) | 5043 (34.5) | 10 219 (50.3) | 7306 (40.8) | 6621 (37.6) | 0.002 | |
| 300–500 | 22 429 (31.8) | 4635 (31.7) | 5796 (28.5) | 7008 (39.1) | 4990 (28.3) | 0.462 | |
| 100–300 | 16 445 (23.3) | 4042 (27.6) | 3717 (18.3) | 3128 (17.5) | 5558 (31.5) | <0.001 | |
| <100 | 2446 (3.5) | 919 (6.3) | 597 (2.9) | 476 (2.7) | 454 (2.6) | <0.001 | |
Baseline characteristics of patients undergoing CABG stratified by hospital volume (quartiles). χ2 and ANOVA were used to test for significant differences in categorical and continuous variables, respectively.
CABG indicates coronary artery bypass graft; and SNF, skilled nursing facility.
Patient‐ and Hospital‐Level Predictors of SNF Use
Several patient characteristics increased the odds of being discharged to a SNF (Table 2). In a multivariable analysis, sociodemographic characteristics of increasing age (odds ratio [OR], 1.10 [95% CI, 1.10–1.11]; P<0.001), increasing comorbidity burden (Charlson Comorbidity Index ≥3; OR, 2.34 [95% CI, 2.18–2.51]; P<0.001), female sex (OR, 2.08 [95% CI, 1.99–2.17]; P<0.001), Black race (OR, 1.38 [95% CI, 1.14–1.66]; P<0.001), and dual eligibility insurance status (OR, 2.23 [95% CI, 2.09–2.39]; P<0.001) were significantly associated with being discharged to a SNF. Procedure factors of having elective surgery (OR, 1.07 [95% CI, 1.02–1.12]; P=0.003) or a concomitant valve operation (OR, 1.22 [95% CI, 1.16–1.28]; P<0.001) were significantly associated with increased likelihood of discharge to a SNF. Postoperative factors of increased hospital length of stay (OR, 1.12 [95% CI,1.11–1.26]; P<0.001) and complications of acute kidney injury (OR, 1.11 [95% CI, 1.05–1.18]; P<0.001), bleeding (OR, 1.19 [95% CI, 1.13–1.24]; P<0.001), pneumonia (OR, 1.20 [95%, CI, 1.05–1.37]; P=0.01), and stroke (OR, 1.93 [95% CI,1.57–2.37]; P<0.001) increased patient odds of being discharged to a SNF. Hospital factors were nonsignificant predictors of SNF use.
Table 2.
Patient and Hospital‐Level Predictors of Skilled Nursing Facility Use
| Characteristics | Odds ratio | 95% CI | P value |
|---|---|---|---|
| Age (per year) | 1.10 | 1.10–1.11 | <0.001 |
| Female | 2.08 | 1.99–2.17 | <0.001 |
| Race/ethnicity | |||
| White | Ref | ‐ | ‐ |
| Black | 1.38 | 1.14–1.66 | 0.001 |
| Other | 1.87 | 1.51–2.31 | <0.001 |
| Asian | 1.19 | 0.93–1.52 | 0.17 |
| Hispanic | 0.79 | 0.60–1.04 | 0.092 |
| North American Native | 0.93 | 0.69–1.50 | 0.632 |
| Unknown | 1.39 | 0.99–1.94 | 0.054 |
| Dual eligibility | 2.23 | 2.09–2.39 | <0.001 |
| Elective procedure | 1.07 | 1.02–1.12 | 0.003 |
| Concomitant valve procedure | 1.22 | 1.16–1.28 | <0.001 |
| Charlson Comorbidity Index | |||
| 0 | Ref | ‐ | ‐ |
| 1 | 1.27 | 1.17–1.37 | <0.001 |
| 2 | 1.57 | 1.46–1.70 | <0.001 |
| 3 or more | 2.34 | 2.18–2.51 | <0.001 |
| Hospital length of stay (per day) | 1.12 | 1.11–1.26 | <0.001 |
| Complications | |||
| Acute kidney injury | 1.11 | 1.05–1.18 | <0.001 |
| Bleeding | 1.19 | 1.13–1.24 | <0.001 |
| Pneumonia | 1.20 | 1.05–1.37 | 0.008 |
| Cardiac arrest | 1.24 | 0.95–1.61 | 0.107 |
| Stroke | 1.93 | 1.57–2.37 | <0.001 |
| Myocardial infarction | 1.11 | 0.89–1.39 | 0.35 |
| Sepsis | 0.94 | 0.77–1.16 | 0.579 |
| Teaching status | |||
| Major | Ref | ‐ | ‐ |
| Minor | 1.11 | 0.94–1.32 | 0.219 |
| Nonteaching | 1.15 | 0.93–1.41 | 0.199 |
| System affiliated | 0.91 | 0.78–1.06 | 0.224 |
| Ownership | |||
| Not‐for‐profit | Ref | ‐ | ‐ |
| For‐profit | 0.85 | 0.71–1.01 | 0.059 |
| Government | 0.75 | 0.60–0.93 | 0.01 |
| Hospital size, number of beds | |||
| <100 | Ref | ‐ | ‐ |
| 100–300 | 1.19 | 0.82–1.72 | 0.366 |
| 300–500 | 1.01 | 0.69–1.47 | 0.978 |
| ≥500 | 0.94 | 0.63–1.39 | 0.743 |
Patient and hospital‐level predictors of SNF use. Multivariable logistic regression was used to evaluate predictors. SNF indicates skilled nursing facility.
Hospital Variation in SNF Use
Crude SNF rates ranged from 0% to 88% across hospitals, with a median SNF rate of 22.7% (interquartile range, 13.6%–32.4%; Figure 1). Expected rates of SNF use based on patient and hospital factors ranged from 11.2% to 42.0% across hospitals, with a median of 22.1% (interquartile range, 19.3%–25.43%). There was a moderate but significant correlation between hospital observed and expected rates of SNF use (Pearson r=0.44, P<0.001; Figure 2). After adjusting for patient and hospital factors, 15.6% of the variation in hospital SNF use was attributed to the hospital level (intraclass correlation coefficient, 0.156 [95% CI, 0.142–0.173]).
Figure 1. Crude percentage of patients with skilled nursing facility (SNF) use after discharge. Hospital‐level crude and expected rates of SNF use after discharge.
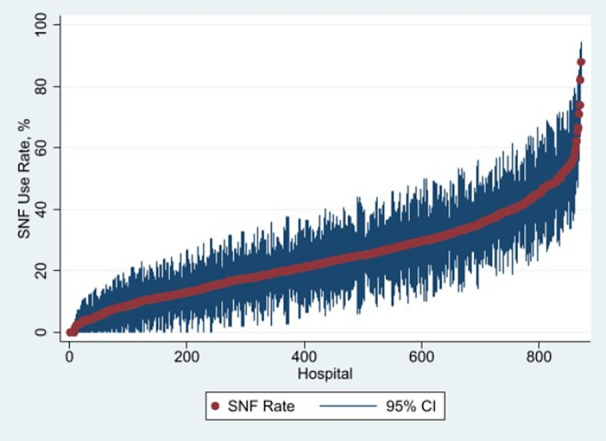
Crude SNF rates ranged from 0% to 88% across hospitals, with a median SNF rate of 22.7% (interquartile range, 18.7%). SNF indicates skilled nursing facility.
Figure 2. Correlation between hospital‐level observed and expected skilled nursing facility (SNF) rates.
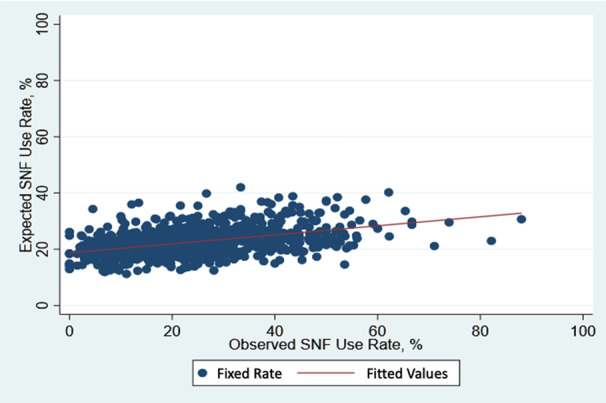
Expected rates of SNF use based on patient and hospital factors ranged from 11.2% to 42.0% across hospitals, with a median of 22.1% (interquartile range, 6.1%). There was a moderate but significant correlation between hospital observed and expected rates of SNF use (Pearson r=0.44, P<0.001).
Clinical Outcomes Across SNF Use Categories
As seen in Table 3, the overall postoperative 1‐year readmission and mortality rates were similar across hospital SNF use quartiles. Once stratified by patient SNF use, readmission (49.8% versus 59.9%, P<0.005) and mortality rates (8.6% versus 12.5%, P<0.001) for patients discharged to SNF were significantly and clinically lower in high SNF use hospitals (quartile 4) compared with low SNF use hospitals (quartile 1), and both had a significant decreasing trend when SNF quartile was modeled as a continuous variable (both P‐trend P<0.001). For patients not discharged to a SNF, mortality (2.3% versus 2.8%, P<0.05) was significantly lower in high‐ versus low‐SNF–use hospitals, although the absolute difference was modest. There was no difference in readmission rates among non‐SNF users in high and low SNF use hospitals.
Table 3.
Adjusted 1‐Year Readmission and Mortality Rates After Discharge by Skilled Nursing Facility Use Quartiles for All Patients and Stratified by Patient‐Level Skilled Nursing Facility Use
| Outcomes | Quartile 1 ‐ (9.2%) | Quartile 2 ‐ (18.6%) | Quartile 3 ‐ (27.5%) | Quartile 4 ‐ (41.3%) | P trend | |
|---|---|---|---|---|---|---|
| 1‐Y readmissions | All patients |
33.2% (32.3%–34.2%) |
34.0% (33.1%–34.8%) |
34.8%* (33.9%–35.7%) |
35.5%** (34.6%–36.4%) |
<0.001 |
| SNF users |
59.9% (57.2%–62.7%) |
55.1%* (53.4%–56.9%) |
51.9%† (50.3%–53.5%) |
49.8%† (48.5%–51.2%) |
<0.001 | |
| Non‐SNF users |
28.8% (27.9%–29.7%) |
28.4% (27.6%–29.3%) |
28.7% (27.8%–29.6%) |
28.1% (27.1%–29.1%) |
0.404 | |
| 1‐Y mortality | All patients |
4.2% (3.8%–4.6%) |
4.3% (4.0%–4.7%) |
4.3% (3.9%–4.6%) |
4.4% (4.0%–4.7%) |
0.507 |
| SNF users |
12.5% (10.7%–14.3%) |
10.9% (9.8%–11.9%) |
9.7%* (8.8%–10.7%) |
8.6%† (7.8%–9.3%) |
<0.001 | |
| Non‐SNF users |
2.8% (2.5%–3.1%) |
2.6% (2.3%–2.8%) |
2.3%* (2.0%–2.6%) |
2.3%* (2.0%–2.6%) |
0.021 | |
Risk‐adjusted outcomes of adjusted health care utilization after discharge by SNF use quartiles. Multivariable logistic regression was used to generate risk‐adjusted rates. Data represent Median (Quartile 1, Quartile 3).
SNF indicates skilled nursing facility.
*P<0.05, † P<0.001 for pairwise comparisons relative to quartile 1.
Discussion
This study sought to evaluate the impact of hospital variation in SNF use and its association with postoperative mortality and readmission after cardiac surgery in a national sample of Medicare beneficiaries undergoing CABG surgery with or without concomitant valve operation. Our results yielded 3 principal findings. First, we found wide variation in SNF use among hospitals. Second, we identified significant, patient factors (increasing age, increasing comorbidity burden, female sex, Black race, Medicare/Medicaid dual eligibility, elective surgery, concomitant valve operation) and complications (acute kidney injury, bleeding, pneumonia, stroke) that predict hospital SNF use, but patient and complication‐specific predictors alone do not fully explain the variation. Lastly, mortality and readmission rates are largely the same across hospital‐SNF use quartiles but differ once stratified by patient SNF use, with lower mortality and readmission rates among high‐SNF–use hospitals for patients discharged to SNF. Taken together, these findings highlight the high variability in SNF use across hospitals along with important factors and outcomes associated with health care utilization of SNF use after cardiac surgery.
Prior studies have found that 20% of patients are admitted to a SNF within 90 days of discharge after CABG. Additionally, Edgerton et al showed that increasing age, female sex, dialysis, and stroke were predictors of discharge to a facility. Our study reinforces these findings and adds to this literature by suggesting that these factors do not fully account for variation in post‐CABG SNF use across hospitals. These findings potentially underscore the importance of evaluating additional factors that were not evaluated here, such as provider style, practice patterns, and supply of PAC. For example, hip replacement surgery PAC use is strongly driven by surgeon endorsement. 14 Potential similar findings may contribute to hospital variation in SNF use after cardiac surgery.
Prior studies have also shown that patients of higher clinical severity tend to be discharged to SNF. 2 , 4 Convention is that hospitals that discharge a large proportion of patients to SNF have a sicker overall patient population that needs the additional support. 15 Our study found similar risk‐adjusted mortality and readmission outcomes across quartiles of hospital SNF use, suggesting that hospital SNF use may not be fully explained by differences in case mix and severity of patients between hospitals. However, when stratifying outcomes by SNF users, we saw a comparative decrease in mortality and readmission rates in high‐SNF–use hospitals. These differences are potentially explained by nonclinical factors, such as proper patient selection and local SNF practice patterns. For instance, Yue et al found that compared with higher volume SNFs, patients admitted to lower volume SNFs were more likely to be hospitalized within the acute period of 30 to 90 days. 16 This relationship was applicable to hospital‐based and freestanding SNFs. These results could potentially reflect a difference in SNF practice patterns with lower thresholds to readmit patients to the hospital. On the other hand, hospitals with low SNF use, and worse mortality, could be inappropriately selecting patients and substituting care with SNF. Additionally, there are potential differences in care coordination strategies between high‐ and low‐SNF–use hospitals. The downstream effects of this can result in the increased need for inpatient care, as well as increased mortality. Lastly, the increased economic burden of SNF care on providers has added pressure on providers to reduce unnecessary PAC spending, while still maintaining quality care. 5 , 6
The results of this study must be considered in light of some important limitations. First, our results may not be widely generalizable given our study population of Medicare beneficiaries who are 65 years and older. However, because the average age for patients undergoing CABG is 69 years old, we believe we included an important sample of patients undergoing the procedure. 17 Second, administrative data sets are not able to account and risk‐adjust for potential confounders such as hospital and provider practice patterns of patient discharge to a SNF, which can influence the ultimate discharge location of a patient. Lastly, a well‐known limitation of administrative data sets is the incomplete ability to capture clinical granularity and reliably identify complications.
Our study highlights the need to better understand the reasons for SNF use after CABG, which can inform decisions around appropriate use. First, qualitative studies, capturing both provider practice patterns and patient influence for SNF discharge, could help in better understanding the decision process around discharging patients to SNF. These findings could help guide better targets around what is considered appropriate levels of SNF use after CABG. Second, our study validated clear patient factors associated with increased odds of SNF discharge after CABG. Leveraging this information to better identify patients ahead of discharge, who are potentially better suited for discharge to a SNF, could be helpful in reducing downstream health care costs. Third, further evaluating more granular SNF‐level factors, such as SNF quality, warrants further work and could reveal more information on surgical outcome differences in this population. For instance, we previously published work evaluating the association of SNF quality on surgical outcomes after CABG and found that patients discharged to lower‐quality SNFs experienced higher 30‐day rates of mortality, readmission, and SNF length of stay. 18 Lastly, policymakers should consider policy reforms to better incentivize health care system users to have better patient selection for SNF use and ultimately reduce the overall volume of SNF use in this population.
Conclusions
There is wide variation in SNF use after cardiac surgery that is partially explained by several patient predictors. Additionally, patients discharged from high‐volume SNF use hospitals had lower 1‐year mortality and readmission rates. Taken together, these findings underscore the need for improved study methods to better understand the underlying provider and hospital‐level factors contributing to this variation.
Sources of Funding
Dr. Thompson received funding from the Frankel Cardiovascular Center McKay Grant fund, the Anderson Heart of a Champion Prize, and the Agency for Healthcare Research and Quality (AHRQ, Grant # 1K01HS027830‐01). Dr. Stewart receives funding from the Veterans Affairs through the National Clinician Scholars Program (NCSP).
Disclosures
Drs. Thompson, Pagani, and Likosky receive partial salary support from Blue Cross Blue Shield of Michigan as part of the Value Partnerships portfolio. Dr. Thompson receives funding from the Agency for Healthcare Research and Quality (K01HS027830, R01HS028397). Dr. Likosky received extramural support from the Agency for Healthcare Research and Quality (R01HS026003) and the National Heart, Lung, and Blood Institute (NHLBI, R01HL146619), and is a consultant to the American Society of ExtraCorporeal Technology. Dr. Pagani is a noncompensated ad hoc scientific advisor for Abbott, CH Biomedical, FineHeart, and Medtronic; noncompensated medical monitor for Abiomed; member of the Data Safety Monitoring Board for Carmat, Inc; member of the Data Safety Monitoring Board for the NHLBI PumpKIN clinical trial; and Chair of The STS Intermacs Task Force. Opinions expressed in this report do not represent those of the NHLBI, the Centers for Medicare and Medicaid Services, the US Food and Drug Administration, the Agency for Healthcare Research and Quality, the Veterans Affairs, or the US Department of Health and Human Services. Dr. Sterling receives funding from the NHLBI (K23HL150160). The remaining authors have no disclosures to report.
Supporting information
Figure S1.
This manuscript was sent to Tazeen H. Jafar, MD, MPH, Associate Editor, for review by expert referees, editorial decision, and final disposition.
Supplemental Material is available at https://www.ahajournals.org/doi/suppl/10.1161/JAHA.123.029833
For Sources of Funding and Disclosures, see page 8.
REFERENCES
- 1. Chen LM, Norton EC, Banerjee M, Regenbogen SE, Cain‐Nielsen AH, Birkmeyer JD. Spending on care after surgery driven by choice of care settings instead of intensity of services. Health Aff. 2017;36:83–90. doi: 10.1377/hlthaff.2016.0668 [DOI] [PMC free article] [PubMed] [Google Scholar]
- 2. Thompson MP, Yost ML, Syrjamaki JD, Norton EC, Nathan H, Theurer P, Prager RL, Pagani FD, Likosky DS. Sources of hospital variation in postacute care spending after cardiac surgery. Circ Cardiovasc Qual Outcomes. 2020;13:e006449. doi: 10.1161/CIRCOUTCOMES.119.006449 [DOI] [PubMed] [Google Scholar]
- 3. Guduguntla V, Syrjamaki JD, Ellimoottil C, Miller DC, Prager RL, Norton EC, Theurer P, Likosky DS, Dupree JM. Drivers of payment variation in 90‐day coronary artery bypass grafting episodes. JAMA Surg. 2018;153:14–19. doi: 10.1001/jamasurg.2017.2881 [DOI] [PMC free article] [PubMed] [Google Scholar]
- 4. Edgerton JR, Herbert MA, Mahoney C, Armstrong D, Dewey TM, Holper E, Roper K, Mack MJ. Long‐term fate of patients discharged to extended care facilities after cardiovascular surgery. Ann Thorac Surg. 2013;96:871–877. doi: 10.1016/j.athoracsur.2013.04.041 [DOI] [PubMed] [Google Scholar]
- 5. Barnett ML, Mehrotra A, Grabowski DC. Postacute care ‐ the piggy bank for savings in alternative payment models? N Engl J Med. 2019;381:302–303. doi: 10.1056/NEJMp1901896 [DOI] [PMC free article] [PubMed] [Google Scholar]
- 6. Bundled Payments for Care Improvement Initiative: General Information. Centers for Medicare & Medicaid Services. 2017. Accessed August 28, 2023. https://www.cms.gov/priorities/innovation/innovation‐models/bundled‐payments
- 7. Chang DC, Joyce DL, Shoher A, Yuh DD. Simple index to predict likelihood of skilled nursing facility admission after coronary artery bypass grafting among older patients. Ann Thorac Surg. 2007;84:829–834; discussion 834–835. doi: 10.1016/j.athoracsur.2007.04.079 [DOI] [PubMed] [Google Scholar]
- 8. Edgerton J, Filardo G, Ryan WH, Brinkman WT, Smith RL, Hebeler RF Jr, Hamman B, Sass DM, Harbor JP, Mack MJ. Risk of not being discharged home after isolated coronary artery bypass graft operations. Ann Thorac Surg. 2013;96:1287–1292. doi: 10.1016/j.athoracsur.2013.05.042 [DOI] [PubMed] [Google Scholar]
- 9. Regenbogen SE, Cain‐Nielsen AH, Syrjamaki JD, Chen LM, Norton EC. Spending on postacute care after hospitalization in commercial insurance and Medicare around age sixty‐five. Health Aff. 2019;38:1505–1513. doi: 10.1377/hlthaff.2018.05445 [DOI] [PMC free article] [PubMed] [Google Scholar]
- 10. Kane RL, Lin W‐C, Blewett LA. Geographic variation in the use of post‐acute care. Health Serv Res. 2002;37:667–682. doi: 10.1111/1475-6773.00043 [DOI] [PMC free article] [PubMed] [Google Scholar]
- 11. Wang Y, Zhang Q, Spatz ES, Gao Y, Eckenrode S, Johnson F, Ho S‐Y, Hu S, Xing C, Krumholz HM. Persistent geographic variations in availability and quality of nursing home care in the United States: 1996 to 2016. BMC Geriatr. 2019;19:103. doi: 10.1186/s12877-019-1117-z [DOI] [PMC free article] [PubMed] [Google Scholar]
- 12. Charlson ME, Pompei P, Ales KL, MacKenzie CR. A new method of classifying prognostic comorbidity in longitudinal studies: development and validation. J Chronic Dis. 1987;40:373–383. doi: 10.1016/0021-9681(87)90171-8 [DOI] [PubMed] [Google Scholar]
- 13. Hirji SA, Percy ED, McGurk S, Malarczyk A, Harloff MT, Yazdchi F, Sabe AA, Bapat VN, Tang GHL, Bhatt DL, et al. Incidence, characteristics, predictors, and outcomes of surgical explantation after transcatheter aortic valve replacement. J Am Coll Cardiol. 2020;76:1848–1859. doi: 10.1016/j.jacc.2020.08.048 [DOI] [PubMed] [Google Scholar]
- 14. Adrados M, Wang K, Deng Y, Bozzo J, Messina T, Stevens A, Moore A, Morris J, O'Connor MI. A simple physical therapy algorithm is successful in decreasing skilled nursing facility length of stay and increasing cost savings after hip fracture with no increase in adverse events. Geriatr Orthop Surg Rehabil. 2021;12:2151459321998615. doi: 10.1177/2151459321998615 [DOI] [PMC free article] [PubMed] [Google Scholar]
- 15. Stoicea N, You T, Eiterman A, Hartwell C, Davila V, Marjoribanks S, Florescu C, Bergese SD, Rogers B. Perspectives of post‐acute transition of care for cardiac surgery patients. Front Cardiovasc Med. 2017;4:70. doi: 10.3389/fcvm.2017.00070 [DOI] [PMC free article] [PubMed] [Google Scholar]
- 16. Li Y, Cai X, Yin J, Glance LG, Mukamel DB. Is higher volume of postacute care patients associated with a lower rehospitalization rate in skilled nursing facilities? Med Care Res Rev. 2012;69:103–118. doi: 10.1177/1077558711414274 [DOI] [PMC free article] [PubMed] [Google Scholar]
- 17. Acinapura AJ, Jacobowitz IJ, Kramer MD, Adkins MS, Zisbrod Z, Cunningham JN Jr. Demographic changes in coronary artery bypass surgery and its effect on mortality and morbidity. Eur J Cardiothorac Surg. 1990;4:175–181. doi: 10.1016/1010-7940(90)90001-G [DOI] [PubMed] [Google Scholar]
- 18. Stewart JW 2nd, Hou H, Wang Y, Bonner SN, Hawkins RB, Pagani FD, Ailawadi G, Likosky DS, Thompson MP. Skilled nursing facility quality rating and surgical outcomes following coronary artery bypass grafting [published online November 17, 2022]. Semin Thorac Cardiovasc Surg. doi: 10.1053/j.semtcvs.2022.11.007. Accessed August 28, 2023. https://www.semthorcardiovascsurg.com/article/S1043‐0679(22)00270‐2/fulltext [DOI] [PubMed] [Google Scholar]
Associated Data
This section collects any data citations, data availability statements, or supplementary materials included in this article.
Supplementary Materials
Figure S1.