

Abstract
Background
There are ≈5 million annual dizziness visits to US emergency departments, of which vestibular strokes account for over 250 000. The head impulse, nystagmus, and test of skew eye examination can accurately distinguish vestibular strokes from peripheral dizziness. However, the eye‐movement signs are subtle, and lack of familiarity and difficulty with recognition of abnormal eye movements are significant barriers to widespread emergency department use. To break this barrier, we sought to assess the accuracy of EyePhone, our smartphone eye‐tracking application, for quantifying nystagmus.
Methods and Results
We prospectively enrolled healthy volunteers and recorded the velocity of induced nystagmus using a smartphone eye‐tracking application (EyePhone) and then compared the results with video oculography (VOG). Following a calibration protocol, the participants viewed optokinetic stimuli with incremental velocities (2–12 degrees/s) in 4 directions. We extracted slow phase velocities from EyePhone data in each direction and compared them with the corresponding slow phase velocities obtained by the VOG. Furthermore, we calculated the area under the receiver operating characteristic curve for nystagmus detection by EyePhone. We enrolled 10 volunteers (90% men) with an average age of 30.2±6 years. EyePhone‐recorded slow phase velocities highly correlated with the VOG recordings (r=0.98 for horizontal and r=0.94 for vertical). The calibration significantly increased the slope of linear regression for horizontal and vertical slow phase velocities. Evaluating the EyePhone's performance using VOG data with a 2 degrees/s threshold showed an area under the receiver operating characteristic curve of 0.87 for horizontal and vertical nystagmus detection.
Conclusions
We demonstrated that EyePhone could accurately detect and quantify optokinetic nystagmus, similar to the VOG goggles.
Keywords: eye movements, health technology, HINTS, nystagmus, vestibular strokes
Subject Categories: Cerebrovascular Disease/Stroke, Digital Health
Nonstandard Abbreviations and Acronyms
- HINTS
head impulse, nystagmus, and test of skew
- OKN
optokinetic nystagmus
- SPV
slow phase velocity
- VOG
video oculography
Research Perspective.
What Is New?
Studies show that strokes are more likely to be missed when they present with nonspecific symptoms like dizziness, highlighting the role of eye movement evaluation in accurate stroke diagnosis.
We developed EyePhone, a smartphone application, to provide an accessible eye‐movement evaluation tool to improve the diagnosis of posterior circulation strokes.
What Question Should Be Addressed Next?
Our testing on healthy volunteers indicated that EyePhone performs with similar accuracy to the current clinical standard devices (video oculography goggles), and the next step would be to evaluate the accuracy of the application in real‐world clinical conditions.
Cerebrovascular accidents are the underlying cause of ≈3% to 5% of >5 million annual dizziness visits in emergency departments. 1 , 2 While comprising only 20% to 25% of all ischemic strokes, posterior circulation strokes pose a unique diagnostic challenge as they are misdiagnosed in up to 40% of cases, almost 4 times that of anterior circulation strokes, due to the nonspecific nature of the symptoms they cause (eg, dizziness, imbalance). 3 , 4
The head impulse, nystagmus, and test of skew (HINTS) eye examination battery has a sensitivity and specificity of 99% and 97%, respectively, in detecting posterior circulation strokes compared with traditional approaches such as vascular risk factor assessment and imaging (computed tomography and magnetic resonance imaging) in the first 24 hours. 5 Nystagmus detection is an integral part of the HINTS examination as direction‐changing gaze‐evoked nystagmus strongly indicates central dizziness (eg, stroke). Moreover, diagnosing a vestibular stroke by a negative head impulse test is valuable only in the presence of spontaneous nystagmus. 6 , 7 Therefore, detecting nystagmus in patients with acute dizziness and vertigo and differentiating between the central and peripheral forms of nystagmus is paramount in diagnosing vestibular strokes. 6 Evaluating nystagmus and accurate classification pose a challenge to nonexpert physicians, which hampers the correct application and interpretation of the HINTS examination. 8 , 9 Furthermore, studies show that the nystagmus caused by vestibular strokes has a significantly lower mean slow phase velocity (SPV) than that of peripheral pathologies, which makes identifying the nystagmus in patients with stroke even more challenging in the absence of a quantified eye movement recording. 10 Video oculography (VOG) goggles can address such issues by quantifying eye movements and providing eye position traces and close‐up recording of the eye movements, which assist clinicians in detecting the presence, direction, and velocity of nystagmus. 11 Nevertheless, the use of these devices is not a common practice in the emergency department, and there are still obstacles to the widespread use of VOG goggles, including the high price, the need for an expert operator, and the limited availability of neurovestibular experts to interpret the findings in the context of the clinical presentation.
On the other hand, smartphones can address some of the barriers in the path of widespread eye movement recording. Smartphones are ubiquitous, and recent technological advances has provided them with the necessary computing power and imaging quality to perform eye movement recordings under visible light conditions. 12 , 13 , 14
Our team has developed a smartphone application, EyePhone, that uses the embedded facial recognition capabilities of the iPhone's (Apple, Cupertino, CA) front camera (FACE ID) to record and quantify eye movements. (Figure 1). We have previously published about the capabilities of our application in performing video head impulse tests and quantifying the vestibulo‐ocular reflex. 15 We aimed to study our application's capabilities in detecting nystagmus in multiple directions and velocities and compare the accuracy of the EyePhone with VOG goggles used as a standard reference to quantify nystagmus.
Figure 1. Overview of EyePhone application environment.
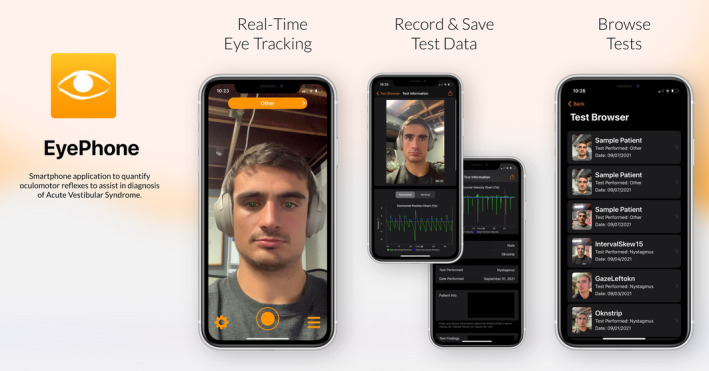
The figure on the left represents the recording environment. The middle figures show how eye‐movement tests are visualized as eye‐position traces. The figure on the right shows the test history browser, where users can access videos and traces of previously performed tests.
Methods
We prospectively enrolled healthy volunteers (n=10) with no known eye movement or vestibular disorders between January and September 2022. The study team used an iPhone 13 ProMax (Apple) with the EyePhone application installed for all the phone recordings. The VOG traces were recorded by ICS Impulse goggles (Natus Medical Incorporated, Middleton, WI) using the OtoSuite Vestibular software provided by the goggles manufacturer.
The inclusion criteria were (1) age >18 years and (2) no current or previous vestibular or ocular motor disorders. The exclusion criteria included (1) severe visual disturbance rendering the participant incapable of following calibration targets and (2) presence of abnormal eye movement before recording.
To obtain optimal and comparable recordings, we performed all the recordings in a well‐lit room with the same set of targets and devices. The recording included an initial calibration protocol and a subsequent recording of the eye movements while the participants were looking at an optokinetic stimulus.
Before the recording, we obtained informed written consent from all participants. The Institutional Review Board at Johns Hopkins reviewed and approved the study protocol (IRB00258938).
The data that support the findings of this study are available from the corresponding author upon reasonable request.
Calibration
A set of targets were placed on a wall spanning 50 degrees of the horizontal visual field (25 degrees to the right and left) and 40 degrees of the vertical visual field (20 degrees above and below the center of the visual field) with fixed distances. Eight horizontal targets were placed at ±5 degrees (8.75 cm), ±10 degrees (17.5 cm), ±15 degrees (26.25 cm), and ±25 degrees (43.75 cm) distance from the central target (positive for the right and negative for the left corresponding to the visual field at 1 m distance). Six vertical targets were placed at ±5° (8.75 cm), ±10° (17.5 cm), and ±20° (35 cm) of the central target (positive for above and negative for below). The participants were seated on a chair with its center 1 m away from the wall, and the chair's height was adjusted so the central target would be at the center of the participant's visual field. We did not restrain participants' heads; however, we advised them to limit their head movement to the best of their ability. We obtained 2 separate calibration recordings, 1 for the horizontal and 1 for the vertical calibration. The operator set a timer to beep every 2 seconds and instructed the participants to switch their gaze between the targets with each ring, while the EyePhone application recorded their eye movements. If participants could not perform the calibration as instructed, the operator would discard the recording, reinstruct the participant, and obtain a new recording.
We calibrated the VOG goggles using the OtoSuite V software's automated calibration protocol per the manufacturer's guidelines.
Optokinetic Stimulus Recording
We used an optokinetic stimulus to induce optokinetic nystagmus (OKN) in healthy volunteers with no nystagmus. This method relies on the optokinetic reflex in healthy subjects induced by movements of bars in the visual field, resulting in the slip of the images projected on the fovea (eg, looking at trees from the window of a moving car). 16 To induce the OKN, we used a set of videos that showed moving black‐and‐white strips, hence simulating a movement of the visual field. We aimed to induce nystagmus in 4 directions (right, left, up, and down) with incremental velocity (from 2 degrees/s up to 12 degrees/s). To achieve this, we prepared 2 sets of videos, 1 with stripes moving horizontally 1 one with stripes moving vertically. Each video started with a fixed target in the middle of the screen for 5 seconds, followed by the movement of the stripes in the following order with 5 second pauses between changes in velocity: 10 seconds at 2 degrees/s, 10 seconds at 4 degrees/s, 10 seconds at 8 degrees/s, 10 seconds at 12 degrees/s. This order was consistent across all 4 directions (right, left, up, and down).
The videos were displayed 50 cm from the participant's eyes on a laptop screen. First, we recorded the induced OKN using VOG goggles, followed by EyePhone recording. However, there was at least 10 minutes of rest between VOG and EyePhone recording to prevent any potential remaining effect. For the EyePhone recording, the phone was placed in front of the monitor at 50 cm from the participant's eyes.
Analysis of Eye Movements
We analyzed the data using MATLAB R2022a (MathWorks Inc, Natick, MA).
Preprocessing
Data from the EyePhone and VOG goggles were segmented to remove the gaps between the different OKN stimuli. Furthermore, to reduce any effect of inaccurate cropping, the first and last second of each nystagmus epoch was removed from the analysis.
Calibration
For each sequence of horizontal and vertical calibration, we extracted the samples corresponding to each eye position and used these data to fit the coefficients β i,j of the pair of second‐degree polynomial equations:
We used the Broyden–Fletcher–Goldfarb–Shanno quasi‐Newton method with a cubic line search procedure to minimize the average Euclidean distance between samples and the expected position.
Once we obtained the calibration polynomials, we applied them to the OKN data in 2 ways:
Each participant using their own set of coefficients (individual calibration)
Calculating the average coefficients across all participants and applying the same average polynomials to the data from all participants (average calibration)
Nystagmus Measurements
We calculated the instantaneous velocity using a second‐order finite differences method for each of the horizontal and vertical traces. We then detected and eliminated quick phases using a 2‐step thresholding procedure. First, we identified samples with instantaneous velocities >50 degrees/s (in absolute value) and removed them from the calculations. Then, we calculated a new threshold as twice the SD plus the average velocity of the remaining velocities and removed all samples above the new threshold. At each thresholding step, we removed additional samples before and after (100 ms on the first pass and 50 ms on the second) the samples above the threshold to avoid artifacts due to the initial acceleration of the quick phases. Finally, we defined the SPV as the average velocity of the remaining samples.
Comparison Analysis
Induced Nystagmus Velocity
We compared the velocity measured by both VOG and EyePhone to the velocity of the OKN stimulus. To do so, we fitted a linear equation (y=ax+b) for each participant with the stimulus velocity as an independent variable and the average measured SPV as the dependent variable. The slope of the equation provides the OKN gain, that is, how much of the stimulus velocity is translated into nystagmus velocity. We also took the average SPV as measured by both devices for each trial and calculated the Spearman correlation coefficients. In both instances, we calculated the correlation between the EyePhone and the VOG measurements for each individual, then we calculated the population correlation coefficients by averaging the correlation coefficients of all patients and estimated the SEM.
Presence of Nystagmus
In a clinical setting, one of the main findings of a neurovestibular evaluation is the absence or presence of nystagmus, as opposed to the velocity measured. We evaluated the EyePhone's performance in this regard in 2 ways:
We assessed the presence or absence of nystagmus on the basis of the fact that we knew which traces had been recorded while the patients watched the optokinetic stimuli, and we used it as true positive. We calculated the area under the curve (AUC) for both EyePhone and VOG with this method.
We assessed the EyePhone's ability in detecting clinically relevant nystagmus by using VOG traces with nystagmus >2 degrees/s as the true positive.
The details of each method are as follows: first, we assessed the ability to discriminate between presence of induced nystagmus versus no nystagmus. We used traces of vertical eye position of a participant as the no‐nystagmus control when we evaluated the presence of horizontal induced nystagmus, and vice versa. In this manner, since we opted to induce nystagmus only in 1 plane at a time (ie, either horizontal or vertical), there was always a trace with no nystagmus as the ground truth against which the traces with nystagmus were compared. To measure how well we differentiate the nystagmus and no‐nystagmus signals, we calculated the receiver operating characteristic (ROC) and measured the AUC. We estimated 95% CIs for the AUCs by bootstrapping our sample of individuals 1000 samples.
Additionally, to evaluate the accuracy of the EyePhone's nystagmus detection in a more clinically relevant manner, we repeated the analysis above with a change in the ground truth for true positive defined as presence of nystagmus >2 degrees/s on VOG. In the initial ROC curves, we considered nystagmus to be present whenever it was induced regardless of its actual velocity, while in true clinical practice only nystagmus >2 degrees/s would be considered present. Hence, we repeated the analysis, this time classifying the nystagmus as present when the VOG (ICS goggles) measured the SPV >2 degrees/s. In this manner, any eye recordings with SPV <2 degrees/s threshold on the corresponding VOG was classified as no nystagmus (eg, anywhere a participant's VOG traces showed nystagmus of 1 degree/s, the ground truth was considered as no nystagmus, and the corresponding EyePhone trace of the same participant was judged based on that).
Nystagmus Direction
Another clinically relevant finding is the direction of the measured nystagmus. We estimated the direction of the SPV using the inverse tangent function θ=arctan (y/x), where x and y are the horizontal and vertical velocities, respectively. We considered that the direction of the nystagmus was appropriately measured when this direction fell within a ±45‐degree range from the direction of the corresponding stimulus.
Results
We enrolled 10 healthy volunteers with normal eye movements. The average age of participants was 30.2±6 years, and 10% were women. Figure 2 depicts a trace obtained by EyePhone and the VOG goggles for 2 velocities.
Figure 2. Sample traces for 2 different velocities.
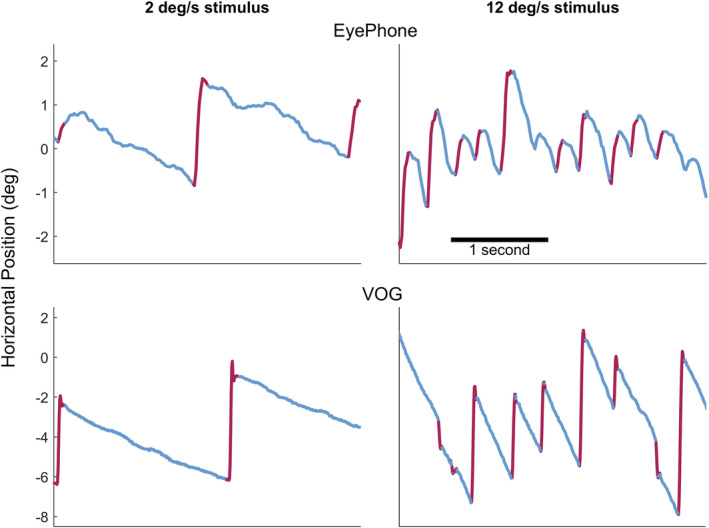
The top 2 graphs depict traces obtained by the EyePhone application when the participant was looking at an optokinetic strip with 2 degrees/s (deg/s) velocity (left) and 12 deg/s (right). The red lines are the quick phases of the optokinetic nystagmus (OKN), and the blue portions are the slow phases of the OKN. The bottom 2 graphs depict traces obtained by the video oculography (VOG) goggles (OtoSuite software) while the participant was looking at an optokinetic strip with 2 deg/s velocity (left) and 12 deg/s (right).
Comparison With Optokinetic Stimulus Velocity
Linear regression analysis of the slow phase velocity as a function of stimulus velocity (optokinetic strip velocity) showed 0.36±0.04 and 0.13±0.04 linear slopes for the uncalibrated horizontal and vertical EyePhone eye position values, respectively. Applying average calibration to EyePhone data increased these values to 0.58±0.07 for horizontal and 0.25±0.06 for vertical measurements. The same analysis of the VOG data yielded slopes of 0.73±0.04 for horizontal and 0.52±0.03 for vertical slow phase velocity (Figure 3, Table S1).
Figure 3. Visualization of recorded velocities on the EyePhone application and the video oculography (video oculography) goggles.
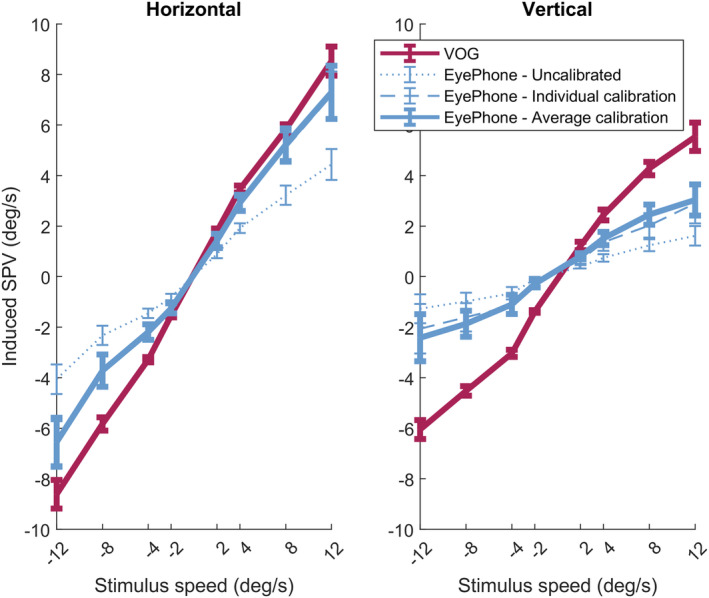
Each bar indicates the 95% CI for the mean slow phase velocity of the optokinetic nystagmus (OKN) recorded for different optokinetic stimulus velocities (horizontal axis). The left plot shows the values for the horizontal OKN where negative values indicate the leftward, and the positive values indicate the rightward slow phases of nystagmus. The right plot shows the recorded values for the vertical OKN, where the negative values indicate downward, and the positive values indicate upward slow phase velocities. The solid red line corresponds to the values recorded by the VOG goggles. The dotted blue line represents the slow phase velocity values obtained by the EyePhone application before applying the calibration data. The dashed blue line represents the same EyePhone values after applying individual calibration, and the solid blue line after applying the average calibration. deg/s indicates degrees/s; and SPV, slow phase velocity.
Moreover, ANOVA of EyePhone velocities showed a significant difference before and after calibration in terms of the regression slope (calib: F=5.346, df=2, P=0.008) that was not affected by the direction of the eye movement (dir×calib: F=0.466, df=2, P=0.630). Post hoc analysis showed no significant difference between individual and average calibration (mean difference=− 0.009; adjusted P=0.985) (Figure S1, Tables S2 and S3).
Correlation Between EyePhone and VOG
The Spearman correlation between the EyePhone‐recorded and VOG‐recorded slow phase velocities for corresponding optokinetic stimulus velocities indicated a 0.98±0.01 correlation coefficient for the horizontal OKN with a linear slope of 0.49 (95% CI, 0.45–53) and a 0.94±0.02 correlation coefficient for the vertical OKN with a linear slope of 0.26 (95% CI, 0.21–0.3) before calibration. Average calibration increased the linear slope to 0.79 and 0.47 for the horizontal and vertical OKN, respectively. However, the correlation coefficient remained unchanged after applying calibration (Table 1, Figure 4).
Table 1.
The Spearman Correlation Between the SPV Values Measured by the EyePhone and the VOG Goggles
| Variable | No calibration | Individual calibration | Average calibration | |||
|---|---|---|---|---|---|---|
| Estimate | 95% CI | Estimate | 95% CI | Estimate | 95% CI | |
| Horizontal SPV correlation | 0.98 | 0.97–0.99 | 1.00 | 0.99–1.00 | 0.98 | 0.97–0.99 |
| Horizontal linear slope | 0.49 | 0.45–0.53 | 0.78 | 0.71–0.85 | 0.79 | 0.73–0.86 |
| Vertical SPV correlation | 0.94 | 0.92–0.96 | 0.93 | 0.91–0.95 | 0.95 | 0.93–0.97 |
| Vertical linear slope | 0.26 | 0.21–0.3 | 0.39 | 0.29–0.5 | 0.47 | 0.4–0.55 |
Each estimate is calculated by averaging all the individual correlations between EyePhone and VOG. SPV indicates slow phase velocity; and VOG, video oculography.
Figure 4. Strong correlation between the EyePhone and video oculography (VOG) recording velocity.
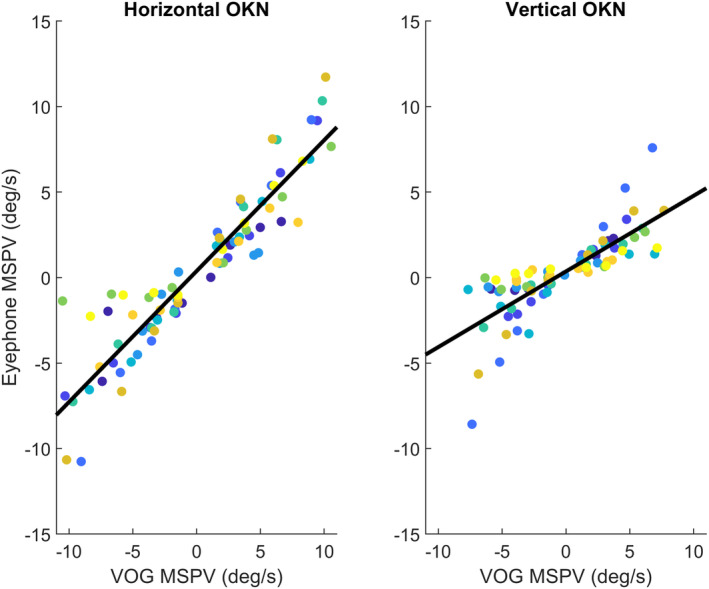
Dot plot of recorded velocities for different optokinetic stimulus velocities from 2 degrees/s (deg/s) up to 12 deg/s for every individual. Every color depicts a unique participant, and every dot is the mean slow phase velocity (MSPV) for a given optokinetic stimulus velocity. The vertical axis corresponds to the velocities recorded by the EyePhone application, and the horizontal axis to the velocities recorded by the video oculography goggles (measured by the OtoSuite software). The left plot depicts the values for the horizontal optokinetic stimulus, and the right plot for the vertical. The black lines are the linear model fit to the data. MSPV indicates mean slow phase velocity; and OKN, optokinetic nystagmus.
We also plotted the differences between EyePhone and VOG measurements in different OKN velocities based on the Bland–Altman method (Figure S3). Our analysis of the horizontal eye movement measurement plots before calibration revealed an error pattern that increased in higher velocities. However, calibration reduced the average difference and eliminated the systemic error at higher velocities. When looking at vertical eye movements, we observed a similar increasing difference between EyePhone and VOG measurements as velocity increased in either direction (upward or downward). While vertical calibration decreased the range of the difference between the 2 methods, it did not sufficiently eliminate this velocity‐dependent error.
Nystagmus Detection ROC AUCs
Comparison With No‐Nystagmus Traces
The EyePhone was able to discriminate between the horizontal nystagmus versus no‐nystagmus (true negative) traces (ROC AUC, 0.95 [95% CI, 0.90–0.98]) with a performance level on par with the VOG goggles (ROC AUC, 1.00 [95% CI, 0.99–1.0]), but the performance was lower for the vertical nystagmus (EyePhone ROC AUC, 0.79 [95% CI, 0.73–0.84]; VOG ROC AUC, 0.99 [95% CI, 0.97–1.0]) (Table 2).
Table 2.
AUC Estimates for the Differentiating Nystagmus vs No Nystagmus When the Traces With No Induced Nystagmus Are Considered True Negative and Traces Where Participants Were Shown Optokinetic Stimulus Were Considered as True Positive
| Variable | EyePhone | VOG | ||||||
|---|---|---|---|---|---|---|---|---|
| No calibration | Individual calibration | Average calibration | Self‐calibration | |||||
| Estimate | 95% CI | Estimate | 95% CI | Estimate | 95% CI | Estimate | 95% CI | |
| Horizontal AUC | 0.95 | 0.90–0.98 | 0.91 | 0.85–0.97 | 0.95 | 0.90–0.98 | 1.00 | 0.99–1 |
| Vertical AUC | 0.79 | 0.73–0.84 | 0.67 | 0.59–0.78 | 0.77 | 0.71–0.82 | 0.99 | 0.97–1 |
AUC indicates area under the curve; and VOG, video oculography.
Comparison With VOG
When assessing the performance of EyePhone for discriminating between the presence or absence of clinically evident nystagmus using a slow phase velocity of 2 degrees/s threshold on the VOG Eyephone, the performance is similar in both the horizontal and vertical components (ROC AUC, 0.87 [95% CI, 0.83–0.91] for horizontal; ROC AUC, 0.87 [95% CI,0.83–0.91] for vertical). Discrimination performance is barely affected by calibration (Table 3).
Table 3.
AUC Estimates for the Clinically Relevant Detection of Nystagmus by the EyePhone When VOG Traces With a Nystagmus of at Least 2 Degrees/s Are Considered as Clinical True Positive, and the Rest as Clinical True Negative.
| Variable | No calibration | Individual calibration | Average calibration | |||
|---|---|---|---|---|---|---|
| Estimate | 95% CI | Estimate | 95% CI | Estimate | 95% CI | |
| Horizontal AUC | 0.87 | 0.83–0.91 | 0.86 | 0.80–0.91 | 0.87 | 0.82–0.91 |
| Vertical AUC | 0.87 | 0.83–0.91 | 0.86 | 0.81–0.91 | 0.88 | 0.82–0.92 |
AUC, indicates area under the curve; and VOG, video oculography.
Discussion
In this study, we compared the accuracy of the EyePhone application to the VOG goggles in identifying and quantifying optokinetic nystagmus in healthy volunteers. As VOG has previously been validated by the gold‐standard scleral magnetic search coils, we sought to use the VOG as a surrogate gold standard for establishing the accuracy of our application. 17 By using stimuli with incremental velocity in 4 different directions, we were able to elicit consistent nystagmus in our volunteers and minimize possible confounders (eg, variability in induced nystagmus as a result of different stimulus velocity) that would have rendered comparison between the 2 devices challenging. We found comparable results in nystagmus detection between these 2 tools.
The presence of direction‐changing nystagmus is a critical indicator of a central pathology in patients with acute vestibular syndrome. 6 Hence, the first step in evaluating the EyePhone application's performance would be its ability to correctly identify the presence and direction of the nystagmus. After applying average calibration, the ROC AUC for horizontal nystagmus detection was 0.95 for the EyePhone application, which indicates a high performance similar to the VOG goggles in discriminating the presence (AUC for VOG, 1.00). The application's performance for detecting vertical nystagmus was lower (ROC AUC, 0.77 after average calibration compared with VOG, 0.99). This discrepancy between horizontal and vertical detection can be potentially explained by how eyelids might affect accurate detection of the pupils' position, especially in downgaze. These issues are mitigated in VOG recordings by having a very close image of the eye, providing higher spatial resolution, and the use of infrared light for pupil detection. Furthermore, as evident from Tables S1–S3, the linear regression slopes for the vertical slow phases were lower in both the VOG and EyePhone, but more so in the EyePhone. This indicates a combination of a slower OKN response to a vertical stimulus 18 and lower performance of vertical eye movement detection compared with the horizontal, at least in the case of the EyePhone.
The issue of EyePhone's underperformance in vertical measurements is also evident in Bland–Altman plots. Moreover, the performance seems to follow a velocity‐dependent pattern as the difference between the EyePhone and VOG measurements increases in higher velocities. While this is an important caveat that needs to be addressed, one has to consider that EyePhone's performance in detecting the presence (rather than the velocity) of vertical nystagmus is what eventually helps in diagnosing strokes. Moreover, the presence of horizontal gaze–evoked nystagmus is more valuable in diagnosing vestibular strokes. 6
To evaluate data in a more clinically relevant context, we measured the Eyephone's nystagmus detection capabilities while using the VOG goggles as a standard reference with a 2 degrees/s cutoff point for presence of the nystagmus. We chose this cutoff point as nystagmus slower than 2 degrees/s has a low clinical diagnostic yield and usually is not clinically detectable by the naked eye. This distinction yields a bigger ROC AUC for the vertical component, since slow nystagmus trials that are hard to detect in the vertical component are now considered as no nystagmus in our reference measurement. The ROC AUC for the horizontal component is, however, slightly lower due to, again, slow nystagmus trials that the EyePhone detects but are now considered as no nystagmus. Appropriate changes in horizontal thresholding or improved nystagmus detection algorithms should improve this performance. To further elaborate, it is essential to consider interpersonal variabilities in response to an optokinetic stimulus. 19 Since our slowest optokinetic strip moved at a 2 degrees/s velocity, it might have induced a nystagmus slower than 2 degrees/s. Moreover, the angular velocity of the optokinetic stimulus depends on the distance from the screen, which explains slight variations of the induced nystagmus' velocity due to the head movements. Therefore, as variations in slower velocities could result in a greater discrepancy than higher velocities, we excluded the velocities below 2 degrees/s to minimize the effect of such variations.
In addition to a high performance in detecting the presence of nystagmus, the EyePhone application also showed a high correlation with the VOG goggles in estimating the velocity of horizontal and vertical nystagmuses (Spearman correlation: horizontal, 0.98 [95% CI, 0.97–0.99]; vertical, 0.95 [95% CI, 0.93–0.97]). This is proof that the EyePhone application could be used beyond mere detection of nystagmus to quantify the SPV of the nystagmus accurately. Therefore, it can potentially aid in monitoring the treatment response in various conditions with nystagmus. Furthermore, changing the velocity of nystagmus in different eye positions could be a meaningful clinical sign, such as in vestibular neuritis, where nystagmus intensifies when looking to the affected side (ie, Alexander's law), and the EyePhone application could aid clinicians in detecting such changes. 20
In addition to evaluating the nystagmus, the data from this study provide much needed information regarding the calibration process of our application. While in our previous study we emphasized the need for a calibration process to improve the accuracy of the application, we needed further data to determine whether we needed to calibrate the application for every individual separately or if we could use an average calibration for everyone. 21 The analysis of the current data confirms our previous findings that the calibration significantly improves the accuracy of the EyePhone application (Table 1, Table S2). However, the post hoc analysis shows no significant difference between individual calibration compared with the average calibration. Therefore, by using an average calibration, we would be able to improve the accuracy of the EyePhone's output without having to perform a separate calibration process for every individual.
Nonetheless, the current calibration method has room for improvement, especially in slower nystagmus SPVs, as it occasionally mistakes slower velocities with noise. This accounts for observed decrements in horizontal and vertical AUCs (Table 2). However, average calibration is more robust against this error than individual calibration, making it more desirable for routine use.
Limitations of the Study
Our study was limited by a small sample size and enrolling only healthy volunteers. We used a laptop screen for displaying the optokinetic stimuli inducing a foveal motion, which is less potent than a full visual field motion. Moreover, in this study, we evaluated the nystagmus in 4 major directions; however, we did not include torsional (or multidirectional) nystagmus. Furthermore, we could not record the eye movements simultaneously with the EyePhone and the VOG goggles, as placing goggles on the face can increase the noise in EyePhone recording. While this would not be an important issue in higher nystagmus velocities, in slower velocities (<2 degrees/s) even the slightest changes in head position and the visual system's response to the optokinetic stimuli could potentially result in greater variation ratio between the consecutive recordings.
While there is a high correlation between EyePhone and VOG measurements, EyePhone's performance in detecting vertical SPVs needs further improvement to meet the clinical standards set by VOG. Furthermore, we conducted our research in a controlled environment, inducing nystagmus by a strong stimulus known to elicit strong, regularly shaped nystagmus, and then we assessed the presence or absence of the same induced nystagmus by using 2 devices (EyePhone versus VOG), which explains the high calculated AUC for nystagmus detection. However, it would be reasonable to expect these values to decrease when recording patients with pathological nystagmus. Finally, it is imperative to mention that this study never intended to evaluate EyePhone as a replacement for VOG, but rather as an alternative method in poor‐resource settings to improve access to care.
Conclusions
The results of this study indicate that the EyePhone application can be used to accurately identify OKN of different velocities and directions and to quantify their velocity.
Sources of Funding
This project received funding from the American Heart Association as a part of American Heart Association Strategically Focused Research Network Health Technologies and Innovation.
Disclosures
Drs Newman‐Toker, Otero‐Millan, and Parker and N. Farrell have a provisional patent application undergoing evaluation regarding the use of smartphone‐based diagnosis of disease via physiologic measurements. The remaining authors have no disclosures to report.
Supporting information
Tables S1–S3
Figures S1–S3
Acknowledgments
The authors extend our sincere gratitude to Dr David S. Zee, who provided us with valuable insight into different aspects of eye movement evaluation.
This manuscript was sent to Francoise A. Marvel, MD, Guest Editor, for review by expert referees, editorial decision, and final disposition.
Supplemental Material is available at https://www.ahajournals.org/doi/suppl/10.1161/JAHA.123.030927
For Sources of Funding and Disclosures, see page 10.
References
- 1. Navi BB, Kamel H, Shah MP, Grossman AW, Wong C, Poisson SN, Whetstone WD, Josephson SA, Johnston SC, Kim AS. Rate and predictors of serious neurologic causes of dizziness in the emergency department. Mayo Clin Proc. 2012;87:1080–1088. doi: 10.1016/j.mayocp.2012.05.023 [DOI] [PMC free article] [PubMed] [Google Scholar]
- 2. Newman‐Toker DE, Hsieh Y‐H, Camargo CA, Pelletier AJ, Butchy GT, Edlow JA. Spectrum of dizziness visits to US emergency departments: cross‐sectional analysis from a nationally representative sample. Mayo Clin Proc. 2008;83:765–775. doi: 10.4065/83.7.765 [DOI] [PMC free article] [PubMed] [Google Scholar]
- 3. Newman‐Toker DE, Peterson SM, Badihian S, Hassoon A, Nassery N, Parizadeh D, Wilson LM, Jia Y, Omron R, Tharmarajah S, et al. Diagnostic Errors in the Emergency Department: A Systematic Review. Comparative Effectiveness Review No. 258. (Prepared by the Johns Hopkins University Evidence‐based Practice Center under Contract No. 75Q80120D00003.) AHRQ Publication No. 22(23)‐EHC043. Rockville, MD: Agency for Healthcare Research and Quality; December 2022. doi: 10.23970/AHRQEPCCER258 [DOI] [PubMed]
- 4. Tarnutzer AA, Lee S‐H, Robinson KA, Wang Z, Edlow JA, Newman‐Toker DE. ED misdiagnosis of cerebrovascular events in the era of modern neuroimaging. Neurology. 2017;88:1468–1477. doi: 10.1212/WNL.0000000000003814 [DOI] [PMC free article] [PubMed] [Google Scholar]
- 5. Newman‐Toker DE, Kerber KA, Hsieh YH, Pula JH, Omron R, Saber Tehrani AS, Mantokoudis G, Hanley DF, Zee DS, Kattah JC. HINTS outperforms ABCD2 to screen for stroke in acute continuous vertigo and dizziness. Acad Emerg Med. 2013;20:986–996. doi: 10.1111/acem.12223 [DOI] [PubMed] [Google Scholar]
- 6. Kattah JC, Talkad AV, Wang DZ, Hsieh YH, Newman‐Toker DE. HINTS to diagnose stroke in the acute vestibular syndrome: three‐step bedside oculomotor examination more sensitive than early MRI diffusion‐weighted imaging. Stroke. 2009;40:3504–3510. doi: 10.1161/STROKEAHA.109.551234 [DOI] [PMC free article] [PubMed] [Google Scholar]
- 7. Kattah JC. Use of HINTS in the acute vestibular syndrome. An Overview. Stroke Vasc Neurol. 2018;3:190–196. doi: 10.1136/svn-2018-000160 [DOI] [PMC free article] [PubMed] [Google Scholar]
- 8. Kerber KA, Morgenstern LB, Meurer WJ, McLaughlin T, Hall PA, Forman J, Mark Fendrick A, Newman‐Toker DE. Nystagmus assessments documented by emergency physicians in acute dizziness presentations: a target for decision support? Acad Emerg Med. 2011;18:619–626. doi: 10.1111/j.1553-2712.2011.01093.x [DOI] [PMC free article] [PubMed] [Google Scholar]
- 9. Tarnutzer AA, Gold D, Wang Z, Robinson KA, Kattah JC, Mantokoudis G, Saber Tehrani AS, Zee DS, Edlow JA, Newman‐Toker DE. Impact of clinician training background and stroke location on bedside diagnostic accuracy in the acute vestibular syndrome–a meta‐analysis. Ann Neurol. 2023;94:295–308. doi: 10.1002/ana.26661 [DOI] [PMC free article] [PubMed] [Google Scholar]
- 10. Mantokoudis G, Wyss T, Zamaro E, Korda A, Wagner F, Sauter TC, Kerkeni H, Kalla R, Morrison M, Caversaccio MD. Stroke prediction based on the spontaneous nystagmus suppression test in dizzy patients: a diagnostic accuracy study. Neurology. 2021;97:e42–e51. doi: 10.1212/WNL.0000000000012176 [DOI] [PMC free article] [PubMed] [Google Scholar]
- 11. Mantokoudis G, Korda A, Zee DS, Zamaro E, Sauter TC, Wagner F, Caversaccio MD. Bruns' nystagmus revisited: a sign of stroke in patients with the acute vestibular syndrome. Eur J Neurol. 2021;28:2971–2979. doi: 10.1111/ene.14997 [DOI] [PMC free article] [PubMed] [Google Scholar]
- 12. Otero‐Millan J, Parker T, Badihian S, Hassoon A, Saber Tehrani A, Farrell N, Newman‐Toker D. Eye and head movement recordings using smartphone: measurements of accuracy and precision. J Vis. 2022;22:3239. doi: 10.1167/jov.22.14.3239 [DOI] [PMC free article] [PubMed] [Google Scholar]
- 13. Reinhardt S, Schmidt J, Schneider J, Leuschel M, Schüle C, Schipper J. VertiGo‐App–Smartphone‐based video nystagmography using artificial intelligence. Laryngo Rhino Otol. 2022;101:243–244. [Google Scholar]
- 14. Friedrich M, Taeger J, Bürklein M, Hartig J, Volkmann J, Ip CW, Peach R, Zeller D. P 56 deep learning derived quantitative video‐nystagmography using smartphone cameras: DeepVNG. Clin Neurophysiol. 2022;137:e47–e48. doi: 10.1016/j.clinph.2022.01.087 [DOI] [Google Scholar]
- 15. Parker TM, Farrell N, Otero‐Millan J, Kheradmand A, McClenney A, Newman‐Toker DE. Proof of concept for an “eyePhone” app to measure video head impulses. Digital Biomark. 2021;5:1–8. doi: 10.1159/000511287 [DOI] [PMC free article] [PubMed] [Google Scholar]
- 16. Roelofs CO. Optokinetic nystagmus. Doc Ophthalmol. 1954;7‐8:7–8. doi: 10.1007/BF00238148 [DOI] [PubMed] [Google Scholar]
- 17. Imai T, Sekine K, Hattori K, Takeda N, Koizuka I, Nakamae K, Miura K, Fujioka H, Kubo T. Comparing the accuracy of video‐oculography and the scleral search coil system in human eye movement analysis. Auris Nasus Larynx. 2005;32:3–9. doi: 10.1016/j.anl.2004.11.009 [DOI] [PubMed] [Google Scholar]
- 18. Van Den Berg AV, Collewijn H. Directional asymmetries of human optokinetic nystagmus. Exp Brain Res. 1988;70:597–604. doi: 10.1007/BF00247608 [DOI] [PubMed] [Google Scholar]
- 19. Holm‐Jensen S, Peitersen E. The significance of the target frequency and the target speed in optokinetic nystagmus (OKN). Acta Otolaryngol. 1979;88:110–116. doi: 10.3109/00016487909137147 [DOI] [PubMed] [Google Scholar]
- 20. Robinson DA, Zee DS, Hain TC, Holmes A, Rosenberg LF. Alexander's law: its behavior and origin in the human vestibulo‐ocular reflex. Ann Neurol. 1984;16:714–722. doi: 10.1002/ana.410160614 [DOI] [PubMed] [Google Scholar]
- 21. Parker TM, Badihian S, Hassoon A, Saber Tehrani AS, Farrell N, Newman‐Toker DE, Otero‐Millan J. Eye and head movement recordings using smartphones for telemedicine applications: measurements of accuracy and precision. Front Neurol. 2022;13:789581. doi: 10.3389/fneur.2022.789581 [DOI] [PMC free article] [PubMed] [Google Scholar]
Associated Data
This section collects any data citations, data availability statements, or supplementary materials included in this article.
Supplementary Materials
Tables S1–S3
Figures S1–S3