

Abstract
Glossina species are known to transmit African Trypanosomiasis, one of the most important infectious diseases for both livestock and humans in sub-Saharan Africa. Therefore, the aim of this study was to characterize trapped Glossina spp. from The Gambia using morphological and molecular techniques in relation to the vegetation cover types. A line transect survey was carried out in all the administrative regions of The Gambia. Tsetse fly trapping was carried out for 14 days during each season using line transect. A total of 220 Glossina spp. specimens (117 F and 103 M) were captured, and DNA was extracted from the legs of 100 randomly selected Glossina spp. Further, DNA samples were tested by a conventional PCR assay. A total of 135/220 (61%; 95% CI: 54.6-67.8%) and 85/220 (39%; 95% CI: 32.2-45.4%) flies were identified as Glossina morsitans submorsitans and Glossina palpalis gambiensis, respectively, with most caught during wet season (53.6%) and more females (53.2%) than males. Results of the morphological identification agreed with those of molecular identification. The type of vegetation cover significantly influenced the caught of tsetse flies. Animals and humans at the various trapping sites are at risk of being bitten by tsetse flies.
Keywords: Glossina morsitans submorsitans, Glossina palpalis gambiensis, Trypanosomiasis, The Gambia, sub-Saharan Africa
Resumo
Espécies de Glossina são conhecidas por transmitirem a Tripanossomíase Africana, uma das doenças infecciosas mais importantes para animais de produção e humanos na África subsaariana. Portanto, o objetivo deste estudo foi caracterizar Glossina spp. de Gâmbia, usando técnicas morfológicas e moleculares em relação aos tipos de cobertura vegetal. Um transecto linear foi realizado em todas as regiões administrativas de Gâmbia. A coleta de moscas tsé-tsé foi realizada durante 14 dias e em cada estação. Um total de 220 espécimes de Glossina (117 F e 103 M) foram capturados e o DNA foi extraído das patas de 100 Glossina spp. de forma aleatória. Posteriormente, as amostras de DNA foram testadas por um ensaio de PCR convencional. Um total de 135/220 (61%; 95% CI: 54,6%-67,8%) e 85/220 (39%; 95% CI: 32,2%-45,4%) moscas foram identificadas como Glossina morsitans submorsitans e Glossina palpalis gambiensis, respectivamente, com mais capturas durante a estação chuvosa (53,6%) e mais fêmeas (53,2%) do que machos. Os resultados da identificação morfológica concordaram com os da identificação molecular. O tipo de cobertura vegetal influenciou significativamente a captura de moscas tsé-tsé. Os animais e humanos nos vários locais de captura correm o risco de serem picados por moscas tsé-tsé.
Palavras-chave: Glossina morsitans submorsitans, Glossina palpalis gambiensis, Tripanosomíases, Gâmbia, África Subsaariana
Introduction
Tsetse flies are biological vectors of trypanosomes that cause Animal African Trypanosomiasis (AAT) or nagana in cattle, and Human African Trypanosomiasis (HAT) known as sleeping sickness in humans (Losos, 1986). Trypanosomiasis is a substantial productivity-limiting livestock disease in sub-Saharan Africa, contributing to poverty and food insecurity in the region (Holt et al., 2016; Abro et al., 2021).
According to the most recent estimates, 3 million cattle die annually in Africa, costing the continent's Gross Domestic Product (GDP) losses of 4.5 billion US dollars annually (Angara et al., 2014; Oluwafemi et al., 2007; Hassan-Kadle et al., 2019), because of direct (mortality, production losses, costs of prophylactic and curative trypanocidal drugs) and indirect losses due to crop production decline and deficiency of animal protein diets (WOAH, 2013).
HAT is a neglected tropical disease of public health importance. It has been responsible for a considerable degree of suffering within the distributional limits of the vector in sub-Saharan Africa, where it puts about 70 million people at risk and it is generally lethal if left untreated or inadequately treated (Büscher et al., 2017; Franco et al., 2022; Papagni et al., 2023).
Tsetse flies (Diptera: Glossinidae) are large biting and blood-feeding insects comprising 31 species and subspecies from a single genus, Glossina (Abd-Alla et al., 2018). Glossina species are classified into three groups: palpalis (Nemorhina), morsitans (Glossina), and fusca (Austenina) (Gooding & Krafsur, 2005). All tsetse species can spread trypanosomes, but their relative significance depends on the strength of their contacts with vulnerable hosts (Gooding & Krafsur, 2005; Bouyer et al., 2019). Glossina morsitans and G. palpalis groups are mainly found in natural savannahs and riverine forest vegetation, respectively. As species of the savannah (Morsitans groups of tsetse) and riverine (Palpalis group) groups occupy different habitats, they have different host preference, use different cues to identify their hosts and are implicated in the transmission of Trypanosoma species (Bouyer et al., 2019).
In The Gambia, the Central River (CRR) and the Lower River (LRR) regions are primarily infested with the tsetse fly G. m. submorsitans, the primary vector of AAT in the country (Kargbo & Kuye, 2020; Snow et al., 1996). The fly is mainly found in dry, canopied savannah woodland (Kargbo & Kuye, 2020; Snow et al., 1996). G. palpalis is also present, although more restricted to riverine vegetation, a region ranked as an area of low to moderate tsetse challenge (Kargbo & Kuye, 2020). In this area, the incidence of trypanosomes in the country has been reported to be higher between October and December (Kargbo et al., 2022a; Olaniyan et al., 2022). A complete understanding of the patterns and factors contributing to Glossina distribution can be instrumental in making decisions for better tsetse and trypanosomiasis control measures but requires accurate vector identification. Vector identification is often based on examining genital morphology, wing, and the body color of the flies (Abd-Alla et al., 2018). The hypervariable nature of many of these phenotypic characteristics and body color changes during sample storage may lead to misidentification (Odeniran et al., 2021; Armstrong & Ball, 2005). Although the information on livestock trypanosomiasis in The Gambia has been reported (Rawlings et al., 1993; ITC, 2015; Kargbo et al., 2022a, b), the impact of vegetation on biting flies such as tsetse flies, Tabanus and Stomoxys species has for long been studied in many countries in Africa. Many researchers have associated higher infestation of biting flies with the dense vegetation (Rayaisse et al., 2015; Lendzele et al., 2017; Keita et al., 2020; Malele et al., 2011; Lydie et al., 2017). However, the present study differs from other studies in that traps were set in all regions of the country to determine the population prevalence of Glossina species, unlike other studies that were based on provincial prevalence, such as in Western Cameroon (Kamdem et al., 2020) and Southern Kaduna Nigeria (Ahmed et al., 2005). Furthermore, the country's climate, landscape, and specific flora along the Gambia River create an environment conducive to various bloodmeal hosts for tsetse flies. Among these factors, the substantial population of warthogs (Phacochoerus africanus) throughout the country is noteworthy. This phenomenon is partly attributed to the warthogs being inedible for the majority of the Muslim population (Claxton et al., 1992; Kargbo & Kuye, 2020).
Accordingly, this study aimed to determine the tsetse fauna in selected areas of The Gambia using morphological and molecular techniques to identify the flies, to show their abundance in relation to the vegetation cover type and to further validate the performance of Biconical, NGU and Vavoua traps in catching Glossina species in The Gambia.
Materials and Methods
Description of trapping sites
This study was conducted in The Gambia, located in West Africa (Figure 1). Three different traps were set in all the country's regions in October and December 2020 and April and July 2021, based on the wet and dry seasons of the country. A line transect survey was carried out using three traps: the Vavoua, Biconical, and NGU (Kargbo et al., 2021). Traps were set 100 m apart in each of the 11 villages in the rural areas, and five wards in the urban areas were randomly selected for this survey (Figure 1). Figure 1B shows the exact points at which each trap was set in one of the villages. The characteristics at the various trapping sites and the animals at risk of being bitten by tsetse flies are summarized in Table 1. Biconical, NGU, and Vavoua traps were made locally using a regular white mosquito net, phthalogen blue and black fabric (Figure 2). The geographical coordinates for each trapping site were recorded using a Garmin device (GPSMAP GARMIN 65S, United Kingdom). The trapping of tsetse flies took 14 days in each of the following months: October 2020, December 2020, April 2021, and July 2021. The comparative performance of these traps has been previously described (Kargbo et al., 2022b).
Figure 1. Location of The Gambia in West Africa showing the points where traps were set (A) on a transect of 100 m at village Kalagi in The Gambia (B).
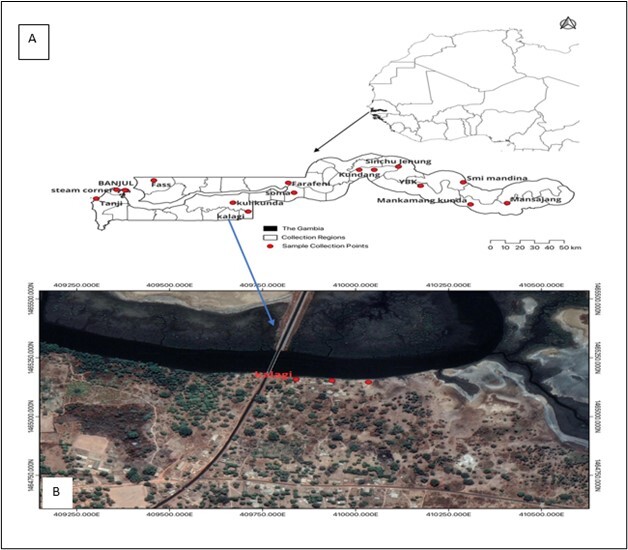
Figure 2. Traps used in seasonal monitoring of tsetse flies: (A) Vavoua trap, (B) Biconical trap, and (C) NGU trap, in The Gambia.

Fly identification and preservation
The morphological identification of tsetse flies was conducted following published morphological identification keys (Service, 2012; Smith, 1973). All specimens were conserved in ethanol and identified using light microscopy (Olympus, Hamburg, Germany). Morphologically, G. morsitans and G. palpalis were identified (Figure 3), and they were inferred to be G. m. submorsitans and G. p. gambiensis based on published data (Service, 2012; Smith, 1973). Trapped flies were stored in pools based on the village's catch and seasons. They were kept in 2 mL Eppendorf® Seal-Rite tubes containing 70% ethanol and stored at -20 0C before molecular analysis to authenticate the identification of these specimens.
Figure 3. Specimen of the tsetse flies caught: (A) G. m. submorsitans and (B) G. p. gambiensis in The Gambia.

Genomic DNA extraction
The flies were placed into 16 pools, with one pool allocated for each species in each region. For the molecular analysis, a random sample was selected, encompassing approximately 30-50% of the specimens from each pool, resulting in a total of 100 specimens G. m. submorsitans were obtained from: Upper River Region (URR) = 8, North Bank Region (NBR; n = 5), Banjul (BJL; n = 2), West Coast Region (WCR; n = 3), Kanifing Municipal Council (KMC; n = 10), Lower River Region (LRR; n = 25), Central River Region South (CRR-S; n = 7) and Central River Region North (CRR-N, n = 10), while G. p. gambiensis specimens were also from NBR (n = 5), WCR (n = 7), LRR (n = 3), CRR-S (n = 7), CRR-N (n = 10). The preserved flies were taken to the National Public Health Laboratory for DNA extraction using commercial kits (Quick-DNATM Miniprep Plus Kit, Tustin, California, USA), according to the manufacturer’s instructions. The procedures were as follows: one leg of the fly was crushed in a microcentrifuge tube, and 95 µL of distilled water and solid tissue buffer was added. After, 10 µL of proteinase K was then added. This was mixed thoroughly and then incubated at 55 oC for about 1-3 hours. The content was centrifugated at ≥ 12000 x g for one min. The aqueous supernatant was transferred to a clean tube, and 400 µL of genomic buffer binding buffer was added to the 200 µL supernatant. The mixture was transferred to a Zymo-spinTM IIC-XLR Column in the collection tube. Centrifuge (≥ 12000 x g) for one min. The collection tube with the flow through was discarded. A total of 400 µL DNA pre-wash buffer was added to the column in a new collection tube and centrifuged for 1 min. The collection tube was again emptied, and 700 µL genomic wash buffer was added to the collection tube, which was centrifuged for one minute before emptying it again. Afterward, 200 µL genomic wash buffer was added and centrifuged for one minute. This was discarded with the flow through. It was again transferred to a clean microcentrifuge tube. Finally, ≥ 50 µL of DNA elution buffer was added to the eluate, incubated for 5 min, and then centrifuged for one minute. The DNA concentration ranged between 39 and 90 ng/µL, and the purity index, the ratio of absorbance values obtained at 260 nm and 280 nm (A260/A280), were 1.86-1.97, respectively.
PCR based identification of tsetse flies
DNA samples were tested by a conventional Polymerase Chain Reaction (PCR) assay targeting a fragment of the ITS1 region, as previously described (Abd-Alla et al., 2018; Bouyer et al., 2006). PCR identification method was carried out as follows. A total of 1.5 uL of the extracted DNA from each sample was placed in a 25 uL PCR reaction tube. The first PCR was conducted using Glossina ITS1-specific primers, forward 5ʹ-GTGATCCACCGCTTAGAGTGA-3ʹ, and reverse 5ʹ-GCAAAAGTTGACCGAACTTGA-3ʹ. The following PCR condition was used: 95 °C for 5 min, 30 cycles of 94 °C for 1 min, 62 °C for 1 min, and 72 °C for 90 sec, then 72 °C for 7 min. The second PCR method was used for the Wolbachia detection primers as previously described by (Abd-Alla et al., 2018), which were 16S rRNA NI-J-12585 5ʹ-GGTCCCTTACGAATTTGAATATATCCT-3ʹ, and LR-N-12866 5ʹ-ACATGATCTGAGTTCAAACCGG-3ʹ with negative control (no DNA template) and positive DNA samples (DNA of known Wolbachia-infected tsetse species). The following PCR program: 94 oC for 5 min, 35 cycles of 94 °C for 45 sec, 55 °C for 45 sec and 72 °C for 30 sec, then 72 °C for 7 min (Dyer et al., 2008). The PCR product was visualized on Agilent TapeStation 4200 capillary electrophoresis instrument.
Gel electrophoresis
The PCR product was visualized on Agilent TapeStation 4200 capillary electrophoresis instrument. Lane M is the DNA ladder/ marker. The signal size was calculated by comparing its mobility to that of the standards’ bands in the marker lane, as demonstrated by Augustinos et al. (2018). Glossina palpalis gambiensis was amplified at 543 bp, while G. m. centralis and G. m. submorsitans were not amplified using the ITS 1 primer (Figures 4 and 5). However, an additional PCR was conducted to determine the presence/absence of the Wolbachia-specific 16S rRNA amplicons for confirming the identification of tsetse species.
Figure 4. Molecular identification of Glossina palpalis gambiensis (543 bp) and G. m. centralis or G. m. submorsitans (150 bp) caught in The Gambia.

Figure 5. Molecular identification of G. m. centralis or G. m. submorsitans (150 bp) species caught in The Gambia.

Determination tsetse abundance
The abundance of trapped tsetse was defined as their apparent density (ADT), shown as the amount of tsetse per trap per day (t/t/d), and calculated using the Formula 1 below.
| (1) |
where: ADT: Apparent density; NTC: Number of tsetse flies captured; NT: Number of traps; NTD: Number of trapping days.
Data collection from vegetation
The Normalized Difference Vegetation Index (NDVI) of The Gambia in October 2020
The NDVI index is appropriate technique for detecting the vegetation vigor in a region (Farias et al., 2023). This work unravels different types of land cover in the wet season (2020) in The Gambia through the utilization of NDVI algorithm. Landsat 8 OLI TIRS data was acquired from the 6th to 12th, October 2020. Bands 3 and 6 were utilized to generate the NDVI. The images were pre-possessed (mosaic, extracted and masked) with the help of ArcGIS 10.8 software and Erdas Imagine 2015.
Normalized Difference Vegetation Index-3rd generation (NDVI3g)
The Normalized Difference Vegetation Index-3rd generation (NDVI3g) using the Global Inventory Monitoring and Modeling System (GIMMS) for Vegetation indices were radiometric measures of photosynthetically active radiation absorbed by chlorophyll in the green leaves of vegetation canopies. The NDVI3g data was downloaded from 2012 to 2021 and it was used in the modeling of the impact of vegetation cover on the flies in The Gambia. This data was obtained for the 10th October, 2020 (NCEI, 2020).
Data analysis
Collected data were entered into the Microsoft Excel software® and later transferred and analyzed with SPSS Statistics software® (IBM Corp, Armonk, NY, USA, version 26). A Paired sample t-test was used to determine the species and the region caught, differences were considered to be significant when P-values < 0.05. Generalized Addictive Model was used to determine the impact of vegetation cover type on the Glossina species flies caught. R version 4.2.1 (R Core Team, 2022) software package was used to carry out the modeling. Generalized Addictive Model was used to determine the impact of NDVI3g on the various flies caught. The models were built to determine the impact of vegetation cover types on Glossina species, Stomoxys calcitrans and Atylotus agrestis. Models were fitted using the observed number of vectors as the outcomes and Generalized Addictive Models (GAM) were used to model the impact of vegetation cover type on the abundance of Glossinidae species, Stomoxys calcitran and Atylotus agrestis. This model offers a middle ground between simple models, such as linear regression model and more compound machine learning models such as neural networks (Aljoumani et al., 2022). They can be fitted to complex, nonlinear relationships and produce good predictions, while still being able to produce inferential statistics and comprehend and elucidate the underlying model structure. As for the model assessment, only models with least generalized cross validation (GCV) score were chosen. The lower the values of GCV, the better the models fit (Liu et al., 2022).
Results
Species diversity and distribution of tsetse flies in The Gambia
A total of 220 Glossina spp. specimens (117 F and 103 M) were captured using the NGU (n= 36), Vavoua (n= 41), and Biconical traps (n= 143). The morphological method was used to identify all the 220 specimens caught, while 100 flies were randomly chosen for the molecular analysis. Results of the molecular identification of tsetse flies confirmed those of morphological identification, showing that all trapped tsetse flies belonged to G. m. submorsitans and G. p. gambiensis.
The seasonal abundance showed that in April 2021, the highest number of G. m. submorsitans species (57/135; 34 F and 23 M) were caught, followed by July 2021 (44/135; 26 F and 18 M), October 2020 (22/135; 10 F and 12 M), and December 2020 (12/135; 4 F and 8 M). The highest number of G. p. gambiensis was captured in October 2020 (34/85; 14 F and 20 M), followed by July 2021 (18/85; 12 F and 6 M), December 2020 (17/85, 10 F and 7 M), and April 2021 (16/85; 7 F and 9 M). A total of 135/220 (61%; 95% CI: 54.6-67.8%) and 85/220 (39%; 95% CI: 32.2-45.4%) flies were identified as G. m. submorsitans (74 F and 61M) and G. p. gambiensis (43 F and 42M), respectively. The apparent density of those flies in The Gambia (Table 2) showed that CRR-N (0.19 t/t/d) and LRR (0.18 t/t/d) had the highest density of tsetse flies in this study. G. m. submorsitans was caught in all the regions of The Gambia. However, G. p. gambiensis was also captured in almost all the regions except in the country's urban rears (Banjul and Kanifing) (Table 2). The highest catches of those flies were from CRR-N, followed by LRR, and the lowest catches were recorded from BJL, with a mean of 28, 26, and 2.5 flies respectively, with no significance difference (Table 3).
Gel electrophoresis result
The signal/band in lanes 1, 3, 4, 5, 6, 7, 8, and 10 corresponds to 550 bp, which implies that the sample is positive for both G. p. gambiensis. The signal band in lanes 9, 11, and 12 correspond to 150 bp, which shows that the specimen was G. m. submorsitans (Figure 4). The signal band in lanes 1, 2, 3, 4, 5, 6, 7, and 8 corresponds to 150 bp, which shows that it was G. m. submorsitans (Figure 5).
Impact of vegetation cover and host presence on the distribution of tsetse flies among regions of The Gambia
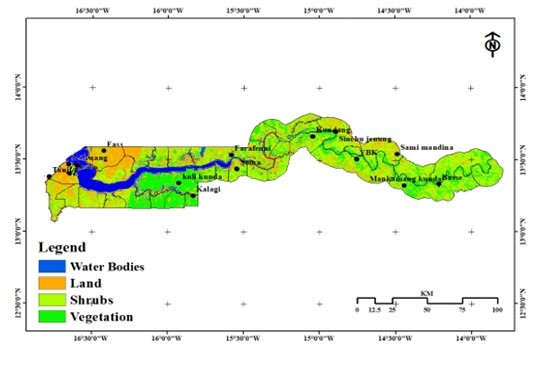
The image from the NDVI algorithm shows four categories: water bodies, land, shrubs, and vegetation (Figure 6). Light green colors denote vegetation, whereas brown colors depict bare ground. The river Gambia and its tributaries can be seen in blue together with thick green coloring that depicts extensive vegetation. In the eastern part of the country, particularly in the Foni area and in the interior, dense wooded land is most prevalent. In the interior of the country as well as in the western Niumi region, there were isolated shrubs. Despite the fact that all the administrative regions in The Gambia had the same number of classifications of vegetation, the WCR (Kalagi) and LRR (Kuli kunda) showed the thickest vegetation, although all other areas also had slightly thick and scattered vegetation. Table 3 shows a significant statistical relationship between fly abundance and type of vegetation cover. Table 4 demonstrates how the trapping locations were perfect niches and environments for capturing these insects. It also has a good probability of at least finding a suitable host for the Glossina species, since it has the correct vegetation that they require to survive.
Figure 6. Normalized Difference Vegetation Index (NDVI) of The Gambia in October 2020.
Predicting the relative abundance of flies using NDVI3g from 2012 to 2021
The results from the predictive mapping of Glossina spp. in Figure 7 and 8 shows the predicted values ranged from 0.011 to 1.94. The hotspots areas for G. m. submorsitan were located WCR, NBR, URR and some parts of LRR of The Gambia (Figure 7). The hotspots area for G. p. gambiensis were in WCR and the western part of CRR-N and CRR-S of The Gambia (Figure 8).
Figure 7. Predictive map of G. m. submorsitans abundance in The Gambia.

Figure 8. Predictive map of G. p. gambiensis abundance in The Gambia.

Discussion
The aim of this study was to use both morphological and molecular methods to identify tsetse flies in Gambia. During the current entomological survey conducted in 16 communities, 220 Glossina spp. were captured. Results of the morphological identification of tsetse flies agreed with those of molecular identification, showing that all the caught tsetse flies belonged to G. m. submorsitans and G. p. gambiensis. The data showed that G. m. submorsitansis widely distributed in all regions of Gambia. G. palpalis gambiensis was primarily found in areas close to rivers as it prefers dense evergreen vegetation, heavier shade, and humid habitats near riverine thickets.
Most flies (53.6%) were trapped in July and October, which represents the wet season in The Gambia, compared with low catches observed in April and December (46.4%), which represent the dry season in the country, as reported in previous studies from Nigeria (Orji et al., 2015; Ahmed et al., 2005). The scarce of Glossina spp. during the dry season may be characterized by environmental factors unfavorable to tsetse flies' ability to reproduce, grow, and survive, such as dry soil, high temperatures, and low humidity (Pagabeleguem et al., 2016).
The majority of the captured flies were females (53.2%), as reported in previous studies in Nigeria and Cameroon (Orji et al., 2015; Kamdem et al., 2020), and this might be explained by trapping bias, in addition to the common movements of females and males for blood meals, females also search for places to deposit their larvae.
In the present study, regional variations in the distribution of Glossina species were observed. G. m. submorsitans was the most prevalent in LRR (47), followed by CRR-N (20), while G. p. gambiensis in CRR-N (36) and CRR-S (17) showed the highest capture rates, respectively. Moreover, G. p. gambiensis were not caught in URR, KMC, and BJL. This difference may be influenced by underlying regional climatic parameters, rainfall, temperature, humidity, wind speed, and vegetation type. Additionally, a previous study has failed on finding G. m. submorsitans in the southern region of the country (Kargbo & Kuye 2020; Rawlings et al., 1993). Changes in the climate conditions of those settlements may have driven the spread of G. m. submorsitan to the southern region of The Gambia.
Findings obtained herein are consistent with those of Rawlings et al. (1993), who reported G. p. gambiensis in evergreen forests and woodlands near the shore and riparian habitats along the river Gambia and its main tributaries. The general rule is that tsetse densities decrease as one moves away from the water. However, Banjul and Kanifing municipal council areas had riverine vegetation, but no G. p. gambiensis was caught. This fact may be due to the lack of enough livestock activities, the saltiness of the river water, or the level of urbanization in those areas.
Even though this disease is underreported in the country, as noted by Kargbo et al. (2022b), the consequence of the presence of tsetse flies in all of The Gambia's rural areas provides higher hazard to the rural populace. These results are consistent with the World Health Organization (WHO) reports (WHO, 2023). They explained that tsetse flies expose humans who lived in rural regions to HAT, and Cecchi et al. (2015) stated that tsetse flies may represent veterinary and medical risks.
Mapping entomological data enabled the specification of suitable places for an effective control program. In this light, vector control in The Gambia should be focused on the forest, around water points, along the rivers, and farmlands, because of livestock and wildlife activities and trypanosome infection rates are higher within and around these biotopes.
It is acknowledged that this study has certain limitations, including the small sample size obtained during fieldwork and the inability to obtain high-quality DNA sequencing for phylogenetic analysis. Additionally, it is important to note that PCR was not performed with blood meals of Glossina spp. for Trypanosoma spp., which could have provided valuable insights into the transmission dynamics of this protozoa. Despite these limitations, the present study provides insights into the prevention and control measures for trypanosomiasis and lays the foundation for further research in this field.
Conclusions
This study revealed the presence of G. m. submorsitans and G. p. gambiensis in The Gambia. To the best of the author’s knowledge, this is the first report of G. m. submorsitans in the southern part the country. Their presence may pose a significant risk to animals and public health. Further studies on transmission patterns of Glossina spp. to livestock and humans will be necessary to comprehend the epidemiology and management of AAT and HAT in the country.
Acknowledgements
This work was funded by the fellowship Ph.D. from the West African Climate Change and Adapted Land Use program through the German Federal Ministry for Education and Research. We acknowledge the support from the Medical Research Council, The Gambia, for the molecular analysis of the data, the University of The Gambia, the Department of Livestock Services, and the West Africa Livestock Innovative Centre in The Gambia for their invaluable contribution to this work. Finally, we are also grateful to Mr. Ansumana Jarjur from the West Africa Livestock Innovative Centre in The Gambia for his immense contribution during the data collection and identification of the Glossinidae species in this study. We also acknowledge the excellent assistance provided by Mrs. Jarra Manneh of the Medical Research Council throughout the laboratory analysis. We would also like to express our gratitude to Stella Dafka from Heidelberg Institute of Global Health and Interdisciplinary Center for Scientific Computing Heidelberg University in Heidelberg, Germany, for her assistance with the prediction maps. The authors sincerely thank the reviewers for their insightful feedback and comments.
Supplementary Material
Supplementary material accompanies this paper.
This material is available as part of the online article from https://doi.org/10.1590/S1984-29612024010
Footnotes
How to cite: Kargbo A, Jallow M, Vieira TSWJ, Amoutchi AI, Koua HK, Osman AM, et al. Diversity of Glossinidae (Diptera) species in The Gambia in relation to vegetation. Braz J Vet Parasitol 2024; 33(1): e012623. https://doi.org/10.1590/S1984-29612024010
References
- Abd-Alla A, Meki I, Bourtzis K, Argilés Herrero R, Parker A. Standard operating procedures for identification of tsetse species from wild populations and laboratory colonies, version 1.0. Vienna: FAO/IAEA; 2018. [Google Scholar]
- Abro Z, Kassie M, Muriithi B, Okal M, Masiga D, Wanda G, et al. The potential economic benefits of controlling trypanosomiasis using waterbuck repellent blend in sub-Saharan Africa. PLoS One. 2021;16(7):e0254558. doi: 10.1371/journal.pone.0254558. [DOI] [PMC free article] [PubMed] [Google Scholar]
- Ahmed AB, Okiwelu SN, Samdi SM. Species diversity, abundance and seasonal occurrence of some biting flies in Southern Kaduna, Nigeria. Afr J Biomed Res. 2005;8(2):113–118. [Google Scholar]
- Aljoumani B, Sanchez-Espigares JA, Kluge B, Wessolek G, Kleinschmit B. Analyzing temporal trends of urban evaporation using generalized additive models. Land. 2022;11(4):508. doi: 10.3390/land11040508. [DOI] [Google Scholar]
- Angara T-EE, Ismail AA, Ibrahim AM. An overview on the economic impacts of animal trypanosomiasis. Glob J Res Anal. 2014;3(7):275–276. doi: 10.15373/22778160/July2014/99. [DOI] [Google Scholar]
- Armstrong KF, Ball SL. DNA barcodes for biosecurity: invasive species identification. Philos Trans R Soc Lond B Biol Sci. 2005;360(1462):1813–1823. doi: 10.1098/rstb.2005.1713. [DOI] [PMC free article] [PubMed] [Google Scholar]
- Augustinos AA, Meki IK, Demirbas-Uzel G, Ouédraogo GMS, Saridaki A, Tsiamis G, et al. Nuclear and Wolbachia-based multimarker approach for the rapid and accurate identification of tsetse species. BMC Microbiol. 2018;18(1) Suppl 1:147. doi: 10.1186/s12866-018-1295-4. [DOI] [PMC free article] [PubMed] [Google Scholar]
- Bouyer J, Carter NH, Batavia C, Nelson MP. The ethics of eliminating harmful species: the case of the tsetse Fly. Bioscience. 2019;69(2):125–135. doi: 10.1093/biosci/biy155. [DOI] [PMC free article] [PubMed] [Google Scholar]
- Bouyer J, Guerrini L, Desquesnes M, de La Rocque S, Cuisance D. Mapping African Animal Trypanosomosis risk from the sky. Vet Res. 2006;37(5):633–645. doi: 10.1051/vetres:2006025. [DOI] [PubMed] [Google Scholar]
- Büscher P, Cecchi G, Jamonneau V, Priotto G. Human African trypanosomiasis. Lancet. 2017;390(10110):2397–2409. doi: 10.1016/S0140-6736(17)31510-6. [DOI] [PubMed] [Google Scholar]
- Cecchi G, Paone M, Argilés Herrero R, Vreysen MJB, Mattioli RC. Developing a continental atlas of the distribution and trypanosomal infection of tsetse flies (Glossina species) Parasit Vectors. 2015;8(1):284. doi: 10.1186/s13071-015-0898-y. [DOI] [PMC free article] [PubMed] [Google Scholar]
- Claxton JR, Faye JA, Rawlings P. Trypanosome infections in warthogs (Phacochoerus aethiopicus) in The Gambia. Vet Parasitol. 1992;41(3-4):179–187. doi: 10.1016/0304-4017(92)90077-M. [DOI] [PubMed] [Google Scholar]
- Dyer NA, Lawton SP, Ravel S, Choi KS, Lehane MJ, Robinson AS, et al. Molecular phylogenetics of tsetse flies (Diptera: Glossinidae) based on mitochondrial (COI, 16S, ND2) and nuclear ribosomal DNA sequences, with an emphasis on the palpalis group. Mol Phylogenet Evol. 2008;49(1):227–239. doi: 10.1016/j.ympev.2008.07.011. [DOI] [PubMed] [Google Scholar]
- Farias GD, Bremm C, Bredemeier C, Lima Menezes J, Alves LA, Tiecher T, et al. Normalized Difference Vegetation Index (NDVI) for soybean biomass and nutrient uptake estimation in response to production systems and fertilization strategies. Front Sustain Food Syst. 2023;6:959681. doi: 10.3389/fsufs.2022.959681. [DOI] [Google Scholar]
- Franco JR, Cecchi G, Paone M, Diarra A, Grout L, Kadima Ebeja A, et al. The elimination of human African trypanosomiasis: achievements in relation to WHO road map targets for 2020. PLoS Negl Trop Dis. 2022;16(1):e0010047. doi: 10.1371/journal.pntd.0010047. [DOI] [PMC free article] [PubMed] [Google Scholar]
- Gooding RH, Krafsur ES. Tsetse genetics: contributions to biology, systematics, and control of tsetse flies. Annu Rev Entomol. 2005;50(1):101–123. doi: 10.1146/annurev.ento.50.071803.130443. [DOI] [PMC free article] [PubMed] [Google Scholar]
- Hassan-Kadle AA, Ibrahim AM, Nyingilili HS, Yusuf AA, Vieira TSWJ, Vieira RFC. Parasitological, serological and molecular survey of camel trypanosomiasis in Somalia. Parasit Vectors. 2019;12(1):598. doi: 10.1186/s13071-019-3853-5. [DOI] [PMC free article] [PubMed] [Google Scholar]
- Holt HR, Selby R, Mumba C, Napier GB, Guitian J. Assessment of animal African trypanosomiasis (AAT) vulnerability in cattle-owning communities of sub-Saharan Africa. Parasit Vectors. 2016;9(1):53. doi: 10.1186/s13071-016-1336-5. [DOI] [PMC free article] [PubMed] [Google Scholar]
- ITC . Annual report for 2014 and outlook for 2015. The Gambia: ITC; 2015. [cited 2023 August 27]. International Trypanotolerance Centre. online. Available from: http://walic-wa.org/wp-content/uploads/2015/09/ITC-ANNUAL-REPORT-FOR-2014-AND-OUTLOOK-FOR-2015.pdf . [Google Scholar]
- Kamdem CN, Tiofack AAZ, Mewamba EM, Ofon EA, Gomseu EBD, Simo G. Molecular identification of different trypanosome species in tsetse flies caught in the wildlife reserve of Santchou in the western region of Cameroon. Parasitol Res. 2020;119(3):805–813. doi: 10.1007/s00436-020-06606-6. [DOI] [PubMed] [Google Scholar]
- Kargbo A, Amoutchi AI, Koua H, Kuye R. Seasonal comparison of vavoua, biconical and NGU traps for monitoring of Glossina (Diptera: Glossinidae) and Tabanids (Diptera: Tabanidae) in The Gambia. Biol Res. 2021;19(1):1351–1361. doi: 10.4314/br.v19i2.8. [DOI] [Google Scholar]
- Kargbo A, Ebiloma GU, Ibrahim YKE, Chechet GD, Jeng M, Balogun EO. Epizootiology and molecular identification of trypanosome species in livestock ruminants in the Gambia. Acta Parasitol. 2022;67(1):130–142. doi: 10.1007/s11686-021-00442-z. a. [DOI] [PubMed] [Google Scholar]
- Kargbo A, Jawo E, Dabre Z, Amoutchi AI, Koua H, Kuye R. Assessment of knowledge of the occurrence of vector borne and zoonotic diseases in The Gambia: a need to adopt the one health approach. East Afr Med J. 2022;99(6):4915–4924. b. [Google Scholar]
- Kargbo A, Kuye RA. Epidemiology of tsetse flies in the transmission of trypanosomiasis: technical review of The Gambia experience. Int J Biol Chem Sci. 2020;14(3):1093–1102. doi: 10.4314/ijbcs.v14i3.35. [DOI] [Google Scholar]
- Keita ML, Medkour H, Sambou M, Dahmana H, Mediannikov O. Tabanids as possible pathogen vectors in Senegal (West Africa) Parasit Vectors. 2020;13(1):500. doi: 10.1186/s13071-020-04375-w. [DOI] [PMC free article] [PubMed] [Google Scholar]
- Lendzele SS, Abdoulmoumini M, Lydie AYG. Spatial repartition of tabanids (Diptera: Tabanidae) in different ecological zones of North Cameroon. Biodiversity Int J. 2017;1(2):64–68. doi: 10.15406/bij.2017.01.00010. [DOI] [Google Scholar]
- Liu J, Zhong C, Seltzer M, Rudin C. Fast Sparse Classification for Generalized Linear and Additive Models. Proc Mach Learn Res. 2022;151:9304–9333. [PMC free article] [PubMed] [Google Scholar]
- Losos GJ. Infectious tropical diseases of domestic animals. Essex: Longman Scientific and Technical; 1986. [Google Scholar]
- Lydie A-YG, Lendzele SS, Desquesnes M, Dia ML. An updated list of Tabanidae (Diptera: Insecta) in Ivory Coast. J Insect Biodivers Syst. 2017;3(1):69–79. doi: 10.52547/jibs.3.1.69. [DOI] [Google Scholar]
- Malele II, Magwisha HB, Nyingilili HS, Mamiro KA, Rukambile EJ, Daffa JW, et al. Multiple Trypanosoma infections are common amongst Glossina species in the new farming areas of Rufiji district, Tanzania. Parasit Vectors. 2011;4(1):217. doi: 10.1186/1756-3305-4-217. [DOI] [PMC free article] [PubMed] [Google Scholar]
- NCEI Index of /data/avhrr-land-normalized-difference-vegetation-index/access. 2020. [cited 2023 August 27]. National Centers for Environmental Information. online. Available from: https://www.ncei.noaa.gov/data/avhrr-land-normalized-difference-vegetation-index/access/
- Odeniran PO, Macleod ET, Ademola IO, Ohiolei JA, Majekodunmi AO, Welburn SC. Morphological, molecular identification and distribution of trypanosome-transmitting dipterans from cattle settlements in Southwest Nigeria. Acta Parasitol. 2021;66(1):116–128. doi: 10.1007/s11686-020-00260-9. [DOI] [PubMed] [Google Scholar]
- Olaniyan OF, Secka A, Kaya I. Integrated assessment of trypanosomosis challenge on cow health and milk based on The Gambia’s agropastoralism. Acta Trop. 2022;232:106520. doi: 10.1016/j.actatropica.2022.106520. [DOI] [PubMed] [Google Scholar]
- Oluwafemi RA, Ilemobade AA, Laseinde EAO. The impact of African animal trypanosomosis and tsetse on the livelihood and well-being of cattle and their owners in the BICOT study area of Nigeria. Sci Res Essays. 2007;2(9):380–383. [Google Scholar]
- Orji CU, Onyeocha IO, Shaida SS, Dede PM, Luka PD, Yakubu B, et al. Molecular identification of tsetse fly (Diptera: Glossinidae) species based on mitochondrial DNA (COII and CytB) sequences. Afr J Biotechnol. 2015;14(19):1605–1613. doi: 10.5897/AJB2015.14411. [DOI] [Google Scholar]
- Pagabeleguem S, Ravel S, Dicko AH, Vreysen MJB, Parker A, Takac P, et al. Influence of temperature and relative humidity on survival and fecundity of three tsetse strains. Parasit Vectors. 2016;9(1):520. doi: 10.1186/s13071-016-1805-x. [DOI] [PMC free article] [PubMed] [Google Scholar]
- Papagni R, Novara R, Minardi ML, Frallonardo L, Panico GG, Pallara E, et al. Human African Trypanosomiasis (sleeping sickness): current knowledge and future challenges. Front Trop Dis. 2023;4:1087003. doi: 10.3389/fitd.2023.1087003. [DOI] [Google Scholar]
- R Core Team . R: a language and environment for statistical computing. Version 4.2.1. Vienna: R Foundation for Statistical Computing; 2022. [Google Scholar]
- Rawlings P, Ceesay ML, Wacher TJ, Snow WF. The distribution of tsetse flies Glossina morsitans submorsitans and Glossina palpalis gambiensis (Diptera: Glossinidae) in The Gambia and the application of survey results to tsetse and trypanosomiasis control. Bull Entomol Res. 1993;83(4):625–632. doi: 10.1017/S0007485300040050. [DOI] [Google Scholar]
- Rayaisse JB, Salou E, Kiema S, Akoudjin M, Kaba D, Kagbadouno M, et al. Tsetse diversity and abundance in Southern Burkina Faso in relation with the vegetation. Parasitol Res. 2015;114(9):3357–3363. doi: 10.1007/s00436-015-4560-6. [DOI] [PubMed] [Google Scholar]
- Service M. In: Medical entomology for students. 5th. Service M, editor. Cambridge: Cambridge University Press; 2012. Tsetse flies (Glossinidae). pp. 126–138. [DOI] [Google Scholar]
- Smith KGV. In: Insects and other arthropods of medical importance. Smith KGV, Clay T, editors. London: British Museum (Natural History); 1973. Glossinidae: tsetse-flies. pp. 373–393. [Google Scholar]
- Snow WF, Wacher TJ, Rawlings P. Observations on the prevalence of trypanosomosis in small ruminants, equines and cattle, in relation to tsetse challenge, in The Gambia. Vet Parasitol. 1996;66(1-2):1–11. doi: 10.1016/S0304-4017(96)01003-5. [DOI] [PubMed] [Google Scholar]
- WHO . Trypanosomiasis, human African (sleeping sickness) Geneva: WHO; 2023. World Health Organization. online. Available from: https://www.who.int/news-room/fact-sheets/detail/trypanosomiasis-human-african-(sleeping-sickness) [Google Scholar]
- WOAH . In: Terrestrial manual. World Organisation for Animal Health - WOAH, editor. Paris: WOAH; 2013. Trypanosomosis (tsetse transmitted) pp. 1–11. World Organisation for Animal Health. Chapter 2.4.17. [Google Scholar]
Associated Data
This section collects any data citations, data availability statements, or supplementary materials included in this article.