

Significance
In eukaryotic cells, the translocation of signaling proteins from the cytosol to the cell membrane is a recurring theme in many signaling pathways. Why translocation occurs has been a subject of lively debate, with many theoretical propositions but little experimental evidence. One such hypothesis states that intermolecular encounters are more frequent on membranes than in solution. Although attractive, this idea has been challenged by the fact that membrane diffusion is significantly slower. In this study, we set out to answer this question by experimentally measuring the association rate of an identical reaction in solution and on membranes. The results confirm that association at the membrane is in fact faster, with additional mechanistic insights into the origins of the rate enhancement.
Keywords: receptor signaling, membrane-associated proteins, Ras activation, bimolecular reaction, reduction of dimensionality
Abstract
Translocation of cytoplasmic molecules to the plasma membrane is commonplace in cell signaling. Membrane localization has been hypothesized to increase intermolecular association rates; however, it has also been argued that association should be faster in the cytosol because membrane diffusion is slow. Here, we directly compare an identical association reaction, the binding of complementary DNA strands, in solution and on supported membranes. The measured rate constants show that for a 10-µm-radius spherical cell, association is 22- to 33-fold faster at the membrane than in the cytoplasm. The kinetic advantage depends on cell size and is essentially negligible for typical ~1 µm prokaryotic cells. The rate enhancement is attributable to a combination of higher encounter rates in two dimensions and a higher reaction probability per encounter.
The translocation of signaling molecules from the cytosol to the cell membrane represents a key step in many signaling pathways (1). The process is exemplified by Ras activation in receptor tyrosine kinase (RTK) signaling (Fig. 1A) (2–4). Autophosphorylated transmembrane receptors recruit the nucleotide exchange factor Son of Sevenless (Sos) from the cytosol via one (Grb2) or two (Shc plus Grb2) adaptor proteins. Membrane-associated Sos then activates membrane-bound Ras, which in turn activates the MAP kinase (MAPK) cascade and initiates transcriptional programs for proliferation, differentiation, cell motility, and/or survival. Despite the fact that Sos activation is a complex, multistep process (5), the artificial recruitment of Sos to the membrane in the absence of receptor activation is sufficient to activate Ras, the MAPK pathway, and downstream transcriptional reporters (6, 7). Reconstitution of the Ras-Sos system shows that localizing the reaction to membranes substantially increases the turnover rate of nucleotide exchange (8, 9). Thus, membrane localization promotes greater signal output in this context. A wide variety of other signaling proteins also translocate to the membrane to become activated and/or to find targets, including phospholipase C gamma (PLCγ), phosphatidylinositol 3-kinase (PI3K), and both 3-phosphoinositide-dependent protein kinase 1 (PDK1) and its target Akt (10, 11). This last example is particularly striking: The activation of Akt depends upon the translocation of both its activator, PDK1, and Akt itself, to the plasma membrane. Thus, membrane translocation is a recurring theme in eukaryotic signaling.
Fig. 1.
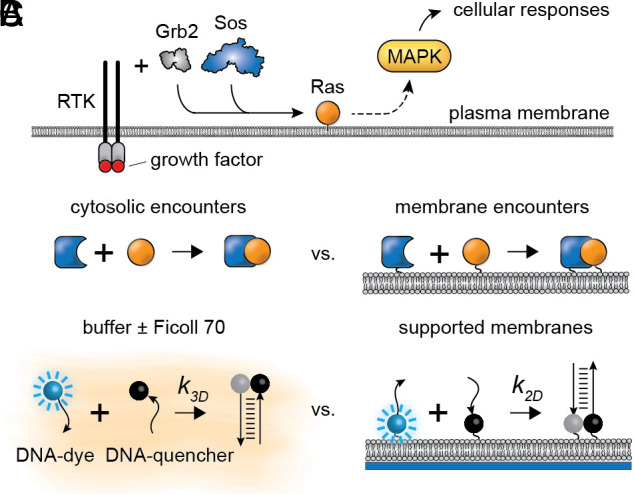
Molecular association in two-dimension (2D) vs. three-dimension (3D) in cellular signaling. (A) Simplified schematic of a RTK signaling pathway. The growth factor brings about dimerization, activation, and intracellular autophosphorylation of the RTK, which recruits cytosolic proteins to the membrane. Sos, a key GEF protein for Ras GTPase activation, is recruited to the cell membrane via the adaptor protein Grb2. Membrane-associated Sos activates Ras, which activates the MAPK cascade. (B) Schematic of association in 3D in the cytosol vs. 2D on a membrane. (C) Our approach to directly compare rates in 2D vs. 3D: a controllable DNA association reaction monitored on supported membranes, and in buffers with or without viscogens.
This raises the fundamental question of how membrane localization promotes signaling. The potential advantages of a 2D search over a 3D search have long been of interest to theoreticians (12–19). For example, Pόlya’s theorem shows that random walks on a grid in 2D will always find a stationary target, but in 3D the probability is less than one (12). Adam and Delbrück further explored the question and showed that translocation of molecules from the cytoplasm to a cell membrane may increase first-encounter rates and association rates (13). This concept has been elaborated on in a large number of subsequent papers (1, 14–17, 19–22). In the framework of Michaelis–Menten kinetics, a faster association rate could directly speed the activation of the target if the process is diffusion-controlled, or increase the steady-state concentration of protein–target complexes and thereby increase the rate of target activation if the process is reaction-controlled.
However, membrane translocation would also be expected to slow diffusion because membranes are more viscous than cytoplasm. Whether or not this slowing would completely counteract the positive effects of membrane translocation is currently a matter of conjecture (Fig. 1B), with some estimating that a membrane-associated 2D search should be quicker than a cytoplasmic 3D search (13, 17, 19, 21), and others predicting the opposite (20, 23, 24). Furthermore, it is not clear to what extent the first encounter rate between two species determines the association rate (20, 22, 24).
Here, we set out to resolve these uncertainties through experiments comparing an identical association reaction in solution and at the membrane, a situation most closely analogous to the PDK1–Akt system. We chose a model system approach to enable quantitation under controlled conditions: buffer solutions supplemented with crowding agents/viscogens to mimic the 3D physical environment of the cytoplasm and supported phospholipid bilayers to represent 2D cell membranes (Fig. 1C). Each of these systems has a long history of generating mechanistic insights into biological processes occurring in cellular environments (4, 25, 26). Supported membranes preserve the hallmark lateral fluidity of cell membranes, with diffusion largely determined by the viscosity of the lipids. Dynamics in buffer solutions can be further benchmarked with undiluted cytosolic extracts, which retain the composition and concentrations of cytosolic molecules. Direct comparison of association on the membrane versus in the cytoplasm unequivocally shows that, under conditions relevant to cellular signaling, association at the membrane is faster than in solution. Detailed kinetic analysis revealed that efficient 2D searches are partly attributable to a faster encounter rate at the membrane, with additional effects originating from slow dissociation and orientation effects. This type of rate enhancement is expected to be especially consequential for membrane-associated enzymes that are highly processive; this applies to the seminal example of Ras activation by SOS.
Results
Measuring the Association Rates of an Identical Reaction in Solution and on Membranes.
The association reaction we chose to study was the association of protein-sized complementary DNA strands to each other (Fig. 1C). By coupling a fluorescent dye to one strand and a fluorescent quencher to its complement, association can be monitored as fluorescence decay in real time (Fig. 1C and SI Appendix, Fig. S1 A–C) (27). Because short DNAs are relatively predictable in terms of structure, thermodynamics, and kinetics (27–29), they are particularly useful for elucidating the dynamical effects of membrane localization. DNA association reactions are also robust and relatively easy to control. In addition, the slow dissociation rates of double-stranded DNA allow association rates to be determined directly, simplifying the analysis. In the following experiments, we monitored association reactions over timescales of 103 s, whereas the average lifetime of the DNA complexes used was 106 s (SI Appendix, Fig. S1D). Although DNA strands differ from proteins in terms of their flexibility and charge, the experimental advantages of the system make it a good choice for these first experiments directly comparing membrane and cytoplasmic association reactions.
The use of DNA enables us to initiate the association reaction through strand-displacement reactions, thereby defining the zero timepoint of the reaction (27–29). Measuring association rates on membranes is potentially problematic because the DNA strands could associate during the coupling of the fluorescent (F) and quencher (Q) strands to membrane lipids. To prevent this, strands were protected with complementary DNAs: a blocker strand (B) for the fluorescent strand, and a quencher anchor (A) for the quencher strand (Fig. 2A), using DNA sequences adapted from previous work on lipid–lipid encounters (27) (SI Appendix, Fig. S1A). The F and A strands were functionalized with sulfhydryl groups to allow them to be covalently coupled to maleimide-derivatized lipids (30). The association reaction of interest, F to Q, was then initiated by the addition of an initiator strand (I) with a higher affinity for the blocker (B) than the blocker had for the fluorescent strand (F). The initiator binds to the toehold region on B and then outcompetes F in a strand displacement process. F is then free to diffuse and bind to its complementary strand Q through a second toehold-mediated strand displacement process. Blocking was found to protect about 80% of strands and the protection remained stable over hours. Although strand-displacement reactions are not necessary to time-resolve reactions in solutions, we followed this identical protocol for consistency.
Fig. 2.

Association reactions in solution and on membranes. (A) Schematic view of the strand displacement reaction. (B–D) Normalized traces of fluorescence as a function of time after initiating the DNA strand-displacement reactions in (B) phosphate-buffered saline, (C) phosphate-buffered saline plus 10% (w/w) Ficoll 70, and (D) on supported membranes. In these titration experiments, the fluorescent complex (B:F) was fixed; the quencher complex (Q:A) in solution titration was {50, 25, 10, 5} and {100, 50, 25, 10} for B and C, respectively; for membrane experiments, the quencher was incubated at {1×, 0.75×, 0.5×, 0.25×} of the fluorescent complex during the coupling reaction. The fitted Qs were {36, 19, 8.1, 4.2} nM, {63, 39, 22, 12} nM, and {28, 31, 25, 9.1} molecules/µm2 for B–D, respectively. Membrane data shown here have been corrected for photobleaching (SI Appendix, Fig. S5). Solid curves are fits of Eq. 3. The rate constants are averages ± SEM with n = 4. (E) Statistics from independent replicates of experiments in B–D. A second set of experiments is shown in SI Appendix, Fig. S6.
Using this approach, we determined the rate constants for association in solution and at the membrane by titration experiments (Fig. 2 B–E). For the solution reactions (Fig. 2 B–D and SI Appendix, Fig. S1), fluorescence was measured in a fluorometer; for the membrane experiments (Fig. 2E), we used epifluorescence microscopy. To generate a family of kinetic traces, we varied the concentration of the quencher complex [Q:A] between 0 and 100% of the fixed total concentration of [B:F]. As a control, we measured the photobleaching rate in the absence of the quencher complex (Q:A), which accounted for less than 5% of total molecules (SI Appendix, Fig. S1F); thus, most of the fluorescent decay was due to quencher–fluorophore association. Because the reaction consists of two sequential strand-displacement reactions (I displacing B and F displacing Q), we simplified the reaction kinetics by conducting these experiments with an excess of the initiator strand (I) as compared with the fluorescent complex (B:F). Under these conditions, the first strand displacement reaction could be regarded as essentially instantaneous, and the rate-liming step was the association of the fluorescent strand (F) with the quencher (Q) (SI Appendix, Fig. S1E) (27). In the simplest case, the association can be described by a bimolecular reaction mechanism:
| [1] |
and the kinetics is given by
| [2] |
where is the concentration of the complex, is the concentration of uncomplexed fluorescent strands, is the total concentration of fluorescent strands, is the concentration of free quencher strands, is the total concentration of quencher strands, and is the bimolecular association rate constant. Note that the units of are concentration−1 time−1 for 3D solution experiments and surface density−1 time−1 for 2D membrane experiments. This equation can be solved in closed form (SI Appendix), with the time course of fluorescence given by
| [3] |
and k were inferred by nonlinear curve fitting. For supported membrane experiments, was measured by fluorescence correlation spectroscopy (FCS) to account for the coupling efficiency (SI Appendix, Fig. S2). The solution experiments did not involve covalent coupling reactions, so was directly known. In a later section, we extend this treatment to a more realistic two-step model; nevertheless, under the experimental conditions, the time course of the two-step model is well-approximated by Eq. 3.
For buffer without Ficoll, fitting Eq. 3 to the data yielded a rate constant k of 2.6 ± 0.2 × 10⁵ M−1 s−1 (mean ± SEM, unless stated otherwise; n = 8; see the statistics method in SI Appendix), or 4.3 ± 0.3 × 10⁻⁴ molecules−1 µm3 s−1 (Fig. 2 B and E). In buffer plus the viscogen Ficoll 70 at a concentration (10% w/w) that yielded diffusion constants similar to those seen in organelle-containing cytoplasm (31) (see below), the data yielded a rate constant k of 1.7 ± 0.2 × 10⁵ M−1 s−1, or 2.8 ± 0.4 × 10⁻⁴ molecules−1 µm3 s−1 (Fig. 2 C and E; n = 8), which is about half of that in buffer without Ficoll.
Next, we measured the association rate on supported membranes (Fig. 2D). The membranes consisted of fluid dioleoylphosphatidylcholine (DOPC) bilayers containing 5% maleimide-derivatized dioleoylphosphatidylethanolamine (DOPE), prepared from sonicated unilamellar vesicles (SI Appendix). We then used thiol-maleimide crosslinking to couple DNA strands to the derivatized DOPE and anchor them in the membrane (30). SI Appendix, Fig. S3 shows the DNAs attached to the bilayers were mostly mobile. We were able to generate a wide range of DNA densities on membranes by this method, from tens to hundreds of molecules per µm2, as quantified by FCS (SI Appendix, Fig. S2). After density determination, strand-displacement reactions were initiated and followed by epifluorescence microscopy. Strand-displacement reactions were verified to be functional on supported membranes by checking that the fluorescence decay was dependent on quenchers (Q) and initiators (I) (SI Appendix, Fig. S4). For these experiments, photobleaching was non-negligible (~25%), so data were corrected for photobleaching prior to fitting (SI Appendix, Fig. S5). We found the reaction to be remarkably fast on membranes (<100 s for ~100 molecules µm−2); therefore, most of our experiments focused on lower DNA densities (<100 µm−2). Titration with a series of Q:A concentrations yielded a rate constant of 2.8 ± 0.7 × 10⁻³ molecules−1 µm2 s−1 (n = 3) (Fig. 2E).
We confirmed that DNA molecules (F:B complexes) diffused more slowly on supported membranes than in buffer, buffer plus Ficoll, and cytosolic extracts using FCS (Fig. 3A). In all cases, a simple diffusion model fit the FCS autocorrelation data satisfactorily, without the need to invoke anomalous diffusion. The membrane diffusion coefficient () was 3.0 ± 0.6 µm2 s−1 (95% CI), which is typical of a molecule anchored to a fluid lipid in supported membranes (32, 33). In solution, the diffusion coefficients were higher: 39.6 ± 1.6 µm2 s−1 in buffer without Ficoll 70; 14.1 ± 2.1 µm2 s−1 (95% CI) in buffer plus Ficoll; and 21.2 ± 3.1 µm2 s−1 in cytosolic extract. We also compared the diffusion of DNA complexes to the 68 kDa protein bovine serum albumin (BSA) (Fig. 2 B–D). In buffer ± Ficoll, diffusion coefficients for DNA and BSA were very similar, suggesting that the DNA construct has a similar length scale (we estimate that the DNA has a long axis of about 11 to 13 nm; BSA has a long axis of about 14 nm, and based on its partial crystal structure, Sos has a long axis of at least 13 nm, PDB: 3KSY). The diffusion coefficients in 10% Ficoll 70 were close to those for protein probes in cytoplasmic Xenopus egg extracts, which contain organelles in addition to cytosolic components (31). Diffusion of DNA in cytosol was slightly slower than expected from the behavior of BSA, possibly because of partial binding to cytosolic proteins. Although diffusion in both membranes and solutions was slightly faster than typical values observed in cells ( ~1 µm2 s−1 and ~10 µm2 s−1, respectively) (26, 34), the buffer, buffer plus Ficoll, and supported membrane model systems were reasonable approximations of diffusion in cells both in terms of the absolute magnitude of the diffusion coefficients and the fold-differences between solutions and membranes.
Fig. 3.

Diffusion characterization in solution and on membranes. (A) Normalized FCS autocorrelation functions of DNA F:B complexes. Diffusion coefficients were obtained from fitting a 3D Brownian model to the data, except in the case of membranes, in which a 2D Brownian model was used. Diffusion coefficients are shown as fitted values ± 95% CI fitting. (B–D) Normalized FCS autocorrelation functions for DNA F:B complexes to BSA-Alexa Flour 488 (black) in (B) buffer, (C) buffer plus 10% Ficoll 70, and (D) cytosolic Xenopus egg extracts.
Association Is Faster at the Membrane than in Solution.
Given that diffusion was 5- to 13-fold slower on membranes than in 3D solutions, we asked whether the association reaction was faster or slower. The rate constants from solutions and membranes cannot be directly compared because of their different units; we therefore calculated total reaction rates. In solution, the reaction rate is given by , where is the 3D rate constant in molecules−1 µm3 s−1, and and are the concentrations of the fluor and the quencher in molecules µm−3. Units for the total reaction rate are molecules µm−3 s−1, so the total number of complexes formed per unit time in a hypothetical cell with a volume is . Likewise, the reaction rate at the membrane is , where is the 2D rate constant in molecules−1 µm2 s−1 and and represent the surface densities of the fluor and quencher in molecules µm−2. Thus, the total reaction rate for a hypothetical cell with a surface area A is . We then define a dimensionless metric R, the rate enhancement factor after translocation to the membrane, as the ratio between total reaction rates at the membrane and in solution:
| [4] |
If , association in 2D at the membrane is faster than association in 3D in the cytosol; if , cytosolic association is faster.
If we assume equal total numbers of associating molecules and in the 2D case and the 3D case (Fig. 4A), then and . For a roughly spherical hypothetical cell, Eq. 4 becomes
| [5] |
Fig. 4.

Association rates in 2D vs. 3D. (A and B) Changes in association rates when the numbers of molecules are kept constant in 2D and 3D. (A) Schematic showing a signaling molecule (blue) and its targets (orange) randomly distributed in the cytoplasm (Left) or on the inner aspect of the plasma membrane (Right). (B) Inferred ratio of the total association rate in 2D divided by the total association rate in 3D (RN) for spherical cells of various sizes. We assumed equal numbers of molecules in the cytoplasm vs. on the membrane. A value of RN greater than 1 means that 2D association is faster than 3D association. The diagonal lines are plots of the relationship using the value of from the supported bilayer experiment and the value of from either the buffer minus Ficoll (purple) or buffer plus Ficoll (orange) data. The radii of one prokaryote and three eukaryotic cells that span a range of sizes are shown. (C–F) Changes in association rates while keeping the mean nearest target distance the same in 2D and 3D. (C) Schematic showing nearest target distances in 2D and 3D. (D) Probability density functions for nearest target distances in 2D (red) and 3D (blue), assuming randomly distributed, non-interacting particles. Concentration (for 3D) and surface density (for 2D) values were chosen so that the average nearest target distance would be 0.1 µm for both cases. (E) The ratio of association rates keeping the mean nearest target molecule equal in 2D and 3D, as given by . (F) The same as E except keeping the linear density ( for 3D and for 2D) the same for 2D and 3D.
where the subscript in reminds us of the assumption of equal numbers of molecules. Note that the volume-to-area ratio, which determines the degree of condensation from 3D to 2D, is maximal for a sphere; other geometries can be accounted for by using the appropriate volume-to-area ratio (SI Appendix, Fig. S7).
Eq. 5 shows that the ratio RN depends upon the size of the cell (Fig. 4B). For a 10-µm-radius spherical cell (4 pL in volume; roughly the volume of a mammalian hepatocyte), association would be 22-times faster (±6) if we used the rate constants for membranes (Fig. 2E) vs. buffer without Ficoll (Fig. 2B) and 33-times faster (±10) for membranes vs. buffer plus 10% Ficoll (Fig. 2C). For a 3-µm-radius budding yeast, RN is 6.5 to 10, and for a 600 µm radius Xenopus egg, it would be 1,300 to 2,000. For a 1-µm-radius spherical bacterium, there would be little advantage (RN = 2 to 3) of 2D association over 3D (Fig. 4B). These findings suggest that for most eukaryotic cells, membrane localization substantially promotes intermolecular association and for many prokaryotic cells it does not.
It has been argued that the advantage of membrane localization is that the protein and its target are closer than they would be in 3D. This idea can be tested by comparing 2D vs. 3D reactions in the condition where the average distance between a molecule and its target is kept constant (Fig. 4C). We used a statistical approach to derive the nearest-neighbor distance distribution for random non-interacting particles in 3D (35) and 2D (Fig. 4D; derivation shown in SI Appendix). In 3D, the mean distance , and in 2D, , where c is target’s concentration in units of molecules µm−3 and is in molecules µm−2. If we set the values of N2 on the membrane and in the cytosol so as to satisfy the relationship and keep N1 in the membrane and the cytosol equal, then the mean distances will be the same in the two cases. The ratio of the 2D to 3D rates is then
| [6] |
Another method of relating 3D concentration to 2D density is to estimate how many molecules are expected in a plane slicing through a volume filled of evenly distributed molecules. This mapping can be achieved using 1D linear density defined as (for example, 1,000 molecules per unit volume on average can be constructed from 10 slabs of 100-molecule planes). The ratio of the 2D to 3D rates at equal linear density is given by
| [7] |
Note that there is less than a 20% difference between and .
Eqs. 6 and 7 show that, for target concentrations of less than ~250 nM, 2D association is faster than 3D association even when the mean distance to the nearest target is the same and even though diffusion is an order of magnitude slower (Fig. 4 E and F). For high-concentration targets, reactions are faster in solution when the distance is identical. Note that many proteins involved in membrane translocation, and their membrane-bound targets, are in fact scarce. For example, Sos is present at a concentration of 2,000 to 12,000 copies per cell in various mammalian cell lines (36), which for an 8.5-µm-radius cell with a volume of 2,600 µm3 and a surface area of 900 µm2 corresponds to a concentration of 1.3 to 8 nM, and if the Sos is confined to the membrane, a surface density of 2.2 to 13 molecules µm2. Thus, for Sos and other scarce signaling molecules, the advantage of membrane localization involves more than just target proximity.
The Rate Enhancement May Arise from a Combination of Efficient 2D Searches, Slowed Dissociation, and Favorable Orientation.
Finally, we turned to the issue of how the advantage of 2D over 3D arises; that is, how much of the advantage is due to a change in the encounter rate, and how much is due to other factors. We began by estimating the diffusion-mediated encounter rate, as opposed to the association rate, for the fluorescent and quencher DNA species, to see how much of the enhanced association is due to more frequent collisions. The collision rate cannot be directly measured experimentally, but we can use the Smoluchowski equation to estimate it, given our experimentally measured diffusion coefficients and the sizes of the DNA molecules. In 3D, the collision rate constant , where is the sum of the diffusion coefficients and is the sum of the molecular radii (14). The value of d is approximately 5 nm for the strand-displacement reactions (27) and the sum of the diffusion coefficients is 79.2 µm2 s−1 in the absence of Ficoll and 28.2 µm2 s−1 in the presence of 10% Ficoll. This yields estimated collision rates of = 3.0 × 10⁹ M−1 s−1 or 5.0 molecules−1 µm3 s−1 in the absence of Ficoll, and 1.1 × 10⁹ or 1.8 molecules−1 µm3 s−1 in the presence of 10% Ficoll. The measured bimolecular rate constants were about 4 orders of magnitude smaller: 4.3 × 10⁻⁴ molecules−1 µm3 s−1 for the no-Ficoll case and 2.8 × 10⁻⁴ molecules−1 µm3 s−1 in the presence of Ficoll, or ~12,000 and ~6,400 slower, respectively. The calculation is more complicated for collision rates in 2D; the rate constants are time-dependent, with where is the Euler’s constant (18). However, with parameters relevant to signaling and on a timescale of seconds, the diffusion-limited rate constant is approximately constant with respective to time (it decreases by 24% from 1 to 60 s) (20), and molecules−1 µm2 s−1 for s. Thus in 2D, collisions are about 1,800-fold faster than the measured association rate. Thus, theoretical collision rates are much faster than the measured association rates in both 2D and 3D, indicating that a one-step bimolecular reaction mechanism (Eq. 1) does not adequately describe the association process. Note that this is also typical for protein–protein interactions in solution, where association rates are typically M−1 s−1, orders of magnitude below the Smoluchowski limit.
This discrepancy can be accommodated by assuming a two-step model (17, 37, 38), where almost all of the collisions are non-productive and reversible, but a small fraction of collisions lead to essentially irreversible complex formation. This is shown schematically in Eq. 8:
| [8] |
where is the diffusion-mediated collision rate constant (either or ), is the association rate constant, and is the rate constant for escape by diffusion. The failure of most of the encounter complexes, denoted , to go on to form the irreversible species could be due to a low probability that the collision complex will be oriented properly (39).
The rate equation for the production and consumption of the encounter complex in this model is
| [9] |
Given that the collision rate constant is large (the Smoluchowski limit) and that is orders of magnitude higher than , we can make the steady-state assumption: . It follows that , throughout the time course, which means that the rate of production of the irreversibly quenched complexes is
| [10] |
Note that under these assumptions, this two-step mechanism is kinetically equivalent to a one-step bimolecular reaction (Eq. 1) with an effective forward rate constant of:
| [11] |
has a simple physical intuition if rearranged into:
| [12] |
where , a quantity between 0 and 1. Eqs. 10–12 describe a pair of molecules that collide at a rate determined by and bind with a probability per collision. This expression can be further simplified to in our case, since .
Accordingly, we can decompose the consequences of membrane localization into two principal effects: changes in the diffusion-mediated encounter rate and changes in the reaction probability per encounter. Inserting Eq. 12 into Eq. 5 yields:
| [13] |
The first parenthetical expression is the advantage of 2D over 3D that arises from changes in the collision rate, which takes into account changes in proximity, search efficiency, and diffusion. It amounts to a net 3.4-fold advantage of when comparing 2D to 3D for a 10-µm spherical cell, given the diffusion coefficients of buffer solution vs. supported membranes; this advantage increases to 9.4-fold when comparing with 10% Ficoll. Thus, the faster collision rate in 2D contributes partly (3.4- to 9.4-fold) to the overall increased association rate (22- to 33-fold) seen experimentally.
The second parenthetical expression in Eq. 13 represents the change in the reaction probability for each encounter. Since overall the experimental value of is 22 to 33 (Fig. 4B) and the diffusion-mediated encounter rate account for 3.4 to 9.4, the reaction probability () for 2D is 6.5- to 3.5-fold higher than for 3D (where the first and second numbers are again referencing to buffers without and with Ficoll, respectively). This result argues that the increased reaction probability is similar in importance to the increased collision rate for promoting association on the membrane.
We can break down the change in reaction probability further. We can estimate ’s contributions to () by calculating the rate at which two molecules in an encounter complex diffuse a critical distance apart () (38). Assuming this critical distance to be twice the reaction radius for both solution and membrane cases (38), s−1 for buffer solution, s−1 for Ficoll solution, and s−1; thus, the retention time of the encounter complex is 16- to 5.6-fold longer on membranes. Given that increases by only 6.5- to 3.5-fold on membranes, apparently decreases by 2.5- to 1.6-fold. Therefore, this estimate suggests that both the escape rate and association rate decrease at the membrane, but the escape rate’s decrease is substantially greater, leading to an increased reaction probability per encounter at the membrane.
One of the various factors that might influence is the likelihood that the encounter complex will be oriented properly to allow successful association. A priori it would seem that in 3D, where there are three degrees of rotational freedom, there would be a much higher proportion of unsuccessful orientations than there would be in 2D, where there is only one axis of rotation. This led us to test whether or not the likelihood of a permissive orientation impacts the association rate. To this end, we examined the association of DNA strands in 2D and 3D using an inverted quencher strand with the thiol coupling site moved to the other end of the DNA molecule (Fig. 5A). The expectation was that association in 2D would be more affected than in 3D because the restriction in two-dimensional orientation makes proper alignment less probable for the inverted configuration, resulting in a decrease in . Note that the inverted strands can still bind by zippering parallel (instead of perpendicular) to the membrane surface. The efficiency of such an orientation has also been demonstrated in previous studies of the association of DNA strands residing in different apposed lipid bilayers (40).
Fig. 5.

Inverting quencher orientation affects membrane advantage. (A) Schematic view of the binding of a fluorophore-containing strand to an inverted quencher on supported membranes. When coupled to the supported membrane, the iQ:iA strand has an inverted orientation compared to the B:F and Q:A strand. This orientation was achieved by moving the thiol coupling site from the end of the A strand to the Q strand. (B and C) Titration experiments of the inverted DNA reaction in (B) buffer and (C) on membranes. The titrated iQ:iA concentration and density were {100, 50, 25, 10} nM and {1×, 0.75×, 0.5×, 0.25×} for B and C, respectively.
Solution measurements showed that inverting the DNA strand decreased its association rate constant by a factor of 2.5, presumably due to a short overhanging linker sequence at the toehold region. In comparison, the association rate on membranes decreased by a factor of 6.8. Hence, the advantage of membrane localization decreased by 2.7-fold though it remained more favorable ( vs. ; Fig. 5 B and C). This result confirms that the physical constraint on orientation provided by membrane localization matters for this reaction, although the magnitude of the orientation effect is modest.
Discussion
In summary, from measurements of association rate constants for complementary DNA strands whose diffusion dynamics are comparable to those of a typical monomeric protein (BSA), we found that association is generally faster when the strands are anchored to a fluid-supported membrane bilayer than when they are free in solution. This study presents direct experimental evidence on this longstanding question. For a 10 µm spherical cell, the increase in association rate would be 22- to 33-fold. The magnitude of the effect depends upon the size of the cell; for most eukaryotic cells, the effect should be substantial, whereas for most prokaryotic cells, it should be minimal. Note that regulated translocation to the membrane appears to be commonplace in mammalian cells, and at least one example is known in budding yeast—the translocation of Ste5 between the plasma membrane and the cytoplasm (41–44). However, we do not know of an example of regulated membrane localization and 2D searches in prokaryotes.
As previously hypothesized, some of the advantage of 2D over 3D can be attributed to an increase in the encounter rate, which arises from increased proximity and the greater efficiency of a 2D search. These findings provide empirical support for the original proposal of Adam and Delbrück (13). In addition, there is an increase in the reaction probability per encounter, and it is comparable to the increased encounter rate. Multiple positive and negative factors may contribute to the overall reaction probability. One is the orientation effect; the loss of two degrees of rotational freedom should dramatically alter the conformational ensemble. Studies with flipped quencher strands did provide evidence for an orientation effect, although the magnitude of the effect was modest. Note that slower diffusion in the viscous membrane environment means that molecules spend more time in the encounter complex, thereby giving them more opportunity to align, which could figure into the relative rates of association vs. dissociation. One caveat here is that although the translational diffusion of the DNA strands being studied here is very similar to that of a BSA-sized protein (Fig. 3), other dynamical properties could be different, and these differences could be critical for the orientation effect.
Some proteins diffusing in cell membranes may have slower diffusion rates (34) than those seen here. This would be expected to decrease the 2D encounter rate but possibly increase the reaction probability (Eq. 13). Furthermore, note that in the current experiment, the membrane is homogeneous. This is not necessarily the case in cells, where restriction of the binding partners to particular regions within the membrane through lateral phase separation or other types of organization could further increase the advantage of 2D over 3D (45–47).
One final question is how the advantage of 2D over 3D would apply to the particular signaling process we started with, the activation of Ras by Sos. If Ras and Sos were both cytoplasmic, there would be only one search involved in the activation of Ras by Sos, a 3D random walk. However, with Ras being constitutively membrane bound, Sos must first find a (scarce) activated RTK and only then perform a 2D random walk to find Ras. A single 3D random walk has been replaced by a 3D random walk plus a 2D random walk. However, Sos is highly processive on membranes: a single activated Sos molecule at the membrane can activate hundreds of Ras molecules before it dissociates (5, 9). Thus, the activation of multiple Ras molecules by membrane-localized Sos instead of cytoplasmic Sos replaces perhaps hundreds of slow 3D searches with one 3D search followed by hundreds of efficient 2D searches. In general, the greater the magnitude amplification generated by a signaling reaction, the greater the advantage of membrane localization.
Note that reduction of dimensionality is implemented differently here than in it is in the interaction of transcription factors with DNA, one of the processes that motivated Adam and Delbrück. In what is now sometimes termed the standard model for the binding of transcription factors to specific enhancer sites on DNA, a combination of 3D searches for a nonspecific DNA strand followed by 1D searches for the enhancer speeds up the target-finding process (48). For membrane-associated proteins, processivity means that there are repeated applications of reduction of dimensionality for each of many target searches, thereby amplifying what may otherwise be a weaker 3D-to-2D effect compared to that of 3D-to-1D. Nevertheless, the conceptual similarity between both cases argues that changes in dimensionality, local concentration, and diffusion coefficients may be trade-offs that evolution has weighed and optimized in a number of different types of biological regulation.
Materials and Methods
DNA Samples.
DNA sequences are shown in SI Appendix, Fig. S1, based on a previous study (27) with the modification of attaching a thiol group at the 5′ end for membrane tethering (30). All DNAs were synthesized and purified by Integrated DNA Technologies (IDT). DNAs were purchased in a single-stranded form and hybridized according to the protocol suggested by IDT. Before each membrane experiment, DNAs were reduced by dithiothreitol (DTT) to enable a thiol-maleimide coupling reaction. Details of each step are described in SI Appendix.
Solution Measurements.
All experiments, including both the solution and membrane version, were performed in standard phosphate buffered saline (PBS) (11.9 mM phosphate, 137 mM NaCl, 2.7 mM KCl, pH 7.4) at room temperature. Buffer mimicking the viscosity of the cytoplasm (49) was prepared with the addition of 10% Ficoll 70 by weight. Fluorescence in solution was measured with a fluorometer (JASCO FP-8300 model). The excitation and emission wavelengths were 496/5 and 524/5 nm, respectively. Data were acquired every 10 s. Additional details are available in SI Appendix.
Membrane Measurements.
Supported membranes were prepared by depositing small unilamellar vesicles (SUVs) on an acid-treated glass substrate, as detailed in SI Appendix. The lipid composition was 5% 18:1 phosphatidylethanolamide-N-[4-(p-maleimidomethyl)cyclohexane-carboxamide] (PE MCC) in DOPC (Avanti Polar Lipids). The DNA density and diffusion on membranes were measured by FCS (50) on an inverted Zeiss LSM 780 scanning confocal microscope. Fluorescence reactions were monitored by epifluorescence on a Nikon TiE inverted microscope. Samples were excited by a 475/28-nm light source that passed through a 474/27-nm bandpass filter and a 493-nm dichroic mirror. Emission signals passed through a 528/38-nm bandpass filter and were collected by an Andor EM-CCD camera (iXon DU-897). Images were acquired every 10 s with an exposure time of 200 ms. To reduce photobleaching, the PBS solution adjacent to supported membranes included 10 mM 2-mercaptoethanol (BME) and 2 mM Trolox. Details regarding all measurements and analyses are described in SI Appendix.
Supplementary Material
Appendix 01 (PDF)
Acknowledgments
We thank Youngbin Lim at the Cell Sciences Imaging Facility for microscopy support, Cheng-Ting Tsai for DNA protocols, and Xianrui Cheng and Julia Kamenz for extract protocols. We thank John Kuriyan, Jeremy Thorner, Dan Herschlag, Daniel Fisher, and Asher Spector for insightful discussions. We thank Yuping Chen, Jo-Hsi Huang, and the rest of the Ferrell lab for helpful discussions and comments on the manuscript. This work is supported by the NIH grant 1R35 GM131792 (J.E.F.) and K99 GM143481 (W.Y.C.H.).
Author contributions
W.Y.C.H. and J.E.F. designed research; W.Y.C.H. performed research; W.Y.C.H., S.G.B., and J.E.F. analyzed data; S.G.B. edited/commented on the paper; and W.Y.C.H. and J.E.F. wrote the paper.
Competing interests
The authors declare no competing interest.
Footnotes
This article is a PNAS Direct Submission.
Contributor Information
William Y. C. Huang, Email: whuang@jhu.edu.
James E. Ferrell, Jr., Email: james.ferrell@stanford.edu.
Data, Materials, and Software Availability
All study data are included in the article and/or SI Appendix.
Supporting Information
References
- 1.Lim W., Mayer B., Pawson T., Cell Signaling (Garland Science, 2014). [Google Scholar]
- 2.Schlessinger J., Cell signaling by receptor tyrosine kinases. Cell 103, 211–225 (2000). [DOI] [PubMed] [Google Scholar]
- 3.Bandaru P., Kondo Y., Kuriyan J., The interdependent activation of Son-of-Sevenless and Ras. Cold Spring Harb. Perspect. Med. 9, a031534 (2019). [DOI] [PMC free article] [PubMed] [Google Scholar]
- 4.Groves J. T., Kuriyan J., Molecular mechanisms in signal transduction at the membrane. Nat. Struct. Mol. Biol. 17, 659–665 (2010). [DOI] [PMC free article] [PubMed] [Google Scholar]
- 5.Huang W. Y. C., et al. , A molecular assembly phase transition and kinetic proofreading modulate Ras activation by SOS. Science 363, 1098–1103 (2019). [DOI] [PMC free article] [PubMed] [Google Scholar]
- 6.Aronheim A., et al. , Membrane targeting of the nucleotide exchange factor Sos is sufficient for activating the Ras signaling pathway. Cell 78, 949–961 (1994). [DOI] [PubMed] [Google Scholar]
- 7.Toettcher J. E., Weiner O. D., Lim W. A., Using optogenetics to interrogate the dynamic control of signal transmission by the Ras/Erk module. Cell 155, 1422–1434 (2013). [DOI] [PMC free article] [PubMed] [Google Scholar]
- 8.Gureasko J., et al. , Membrane-dependent signal integration by the Ras activator Son of sevenless. Nat. Struct. Mol. Biol. 15, 452–461 (2008). [DOI] [PMC free article] [PubMed] [Google Scholar]
- 9.Iversen L., et al. , Molecular kinetics Ras activation by SOS: Allosteric regulation by altered fluctuation dynamics. Science 345, 50–54 (2014). [DOI] [PMC free article] [PubMed] [Google Scholar]
- 10.Marshall A. J., Niiro H., Yun T. J., Clark E. A., Regulation of B-cell activation and differentiation by the phosphatidylinositol 3-kinase and phospholipase Cgamma pathway. Immunol. Rev. 176, 30–46 (2000). [DOI] [PubMed] [Google Scholar]
- 11.Manning B. D., Cantley L. C., AKT/PKB signaling: Navigating downstream. Cell 129, 1261–1274 (2007). [DOI] [PMC free article] [PubMed] [Google Scholar]
- 12.Polya G., Uber eine Aufgabe der Wahrscheinlichkeitsrechnung betreffend die Irrfahrt im Strassennetz. Math. Ann. 84, 149–160 (1921). [Google Scholar]
- 13.Adam G., Delbruck M.. “Reduction of dimensionality in biological diffusion processes” in Structural Chemistry and Molecular Biology, Rich N. D. A., Ed. (W. H. Freeman & Co., New York, NY, 1968), pp. 198–215. [Google Scholar]
- 14.Berg O. G., von Hippel P. H., Diffusion-controlled macromolecular interactions. Annu. Rev. Biophys. Biophys. Chem. 14, 131–160 (1985). [DOI] [PubMed] [Google Scholar]
- 15.Berg H. C., Purcell E. M., Physics of chemoreception. Biophys. J. 20, 193–219 (1977). [DOI] [PMC free article] [PubMed] [Google Scholar]
- 16.Axelrod D., Wang M. D., Reduction-of-dimensionality kinetics at reaction-limited cell-surface receptors. Biophys. J. 66, 588–600 (1994). [DOI] [PMC free article] [PubMed] [Google Scholar]
- 17.Haugh J. M., Lauffenburger D. A., Physical modulation of intracellular signaling processes by locational regulation. Biophys. J. 72, 2014–2031 (1997). [DOI] [PMC free article] [PubMed] [Google Scholar]
- 18.Torney D. C., McConnell H. M., Diffusion-limited reaction rate theory for two-dimensional systems. Proc. R. Soc. Lond. A 387, 147–170 (1983). [Google Scholar]
- 19.Mishra B., Johnson M. E., Speed limits of protein assembly with reversible membrane localization. J. Chem. Phys. 154, 194101 (2021). [DOI] [PMC free article] [PubMed] [Google Scholar]
- 20.Kholodenko B. N., Hoek J. B., Westerhoff H. V., Why cytoplasmic signalling proteins should be recruited to cell membranes. Trends Cell Biol. 10, 173–178 (2000). [DOI] [PubMed] [Google Scholar]
- 21.Schmick M., Bastiaens P. I. H., The interdependence of membrane shape and cellular signal processing. Cell 156, 1132–1138 (2014). [DOI] [PubMed] [Google Scholar]
- 22.Leonard T. A., Loose M., Martens S., The membrane surface as a platform that organizes cellular and biochemical processes. Dev. Cell 58, 1315–1332 (2023). [DOI] [PubMed] [Google Scholar]
- 23.McCloskey M. A., Poo M. M., Rates of membrane-associated reactions: Reduction of dimensionality revisited. J. Cell Biol. 102, 88–96 (1986). [DOI] [PMC free article] [PubMed] [Google Scholar]
- 24.Bray D., Signaling complexes: Biophysical constraints on intracellular communication. Annu. Rev. Biophys. Biomol. Struct. 27, 59–75 (1998). [DOI] [PubMed] [Google Scholar]
- 25.Gibeaux R., Heald R., The use of cell-free Xenopus extracts to investigate cytoplasmic events. Cold Spring Harb. Protoc. 2019, 1–5 (2019). [DOI] [PubMed] [Google Scholar]
- 26.Dix J. A., Verkman A. S., Crowding effects on diffusion in solutions and cells. Annu. Rev. Biophys. 37, 247–263 (2008). [DOI] [PubMed] [Google Scholar]
- 27.You M., et al. , DNA probes for monitoring dynamic and transient molecular encounters on live cell membranes. Nat. Nanotechnol. 12, 453–459 (2017). [DOI] [PMC free article] [PubMed] [Google Scholar]
- 28.Zhang D. Y., Winfree E., Control of DNA strand displacement kinetics using toehold exchange. J. Am. Chem. Soc. 131, 17303–17314 (2009). [DOI] [PubMed] [Google Scholar]
- 29.Zhang D. Y., Seelig G., Dynamic DNA nanotechnology using strand-displacement reactions. Nat. Chem. 3, 103–113 (2011). [DOI] [PubMed] [Google Scholar]
- 30.Coyle M. P., Xu Q., Chiang S., Francis M. B., Groves J. T., DNA-mediated assembly of protein heterodimers on membrane surfaces. J. Am. Chem. Soc. 135, 5012–5016 (2013). [DOI] [PMC free article] [PubMed] [Google Scholar]
- 31.Huang W. Y. C., Cheng X., Ferrell J. E. Jr., Cytoplasmic organization promotes protein diffusion in Xenopus extracts. Nat. Commun. 13, 5599 (2022). [DOI] [PMC free article] [PubMed] [Google Scholar]
- 32.Chung J. K., Lee Y. K., Lam H. Y., Groves J. T., Covalent Ras dimerization on membrane surfaces through photosensitized oxidation. J. Am. Chem. Soc. 138, 1800–1803 (2016). [DOI] [PMC free article] [PubMed] [Google Scholar]
- 33.Ziemba B. P., Falke J. J., Lateral diffusion of peripheral membrane proteins on supported lipid bilayers is controlled by the additive frictional drags of (1) bound lipids and (2) protein domains penetrating into the bilayer hydrocarbon core. Chem. Phys. Lipids 172–173, 67–77 (2013). [DOI] [PMC free article] [PubMed] [Google Scholar]
- 34.Saxton M. J., Jacobson K., Single-particle tracking: Applications to membrane dynamics. Annu. Rev. Biophys. Biomol. Struct. 26, 373–399 (1997). [DOI] [PubMed] [Google Scholar]
- 35.Chandrasekhar S., Stochastic problems in physics and astronomy. Rev. Modern Phys. 15, 1–89 (1943). [Google Scholar]
- 36.Shi T., et al. , Conservation of protein abundance patterns reveals the regulatory architecture of the EGFR-MAPK pathway. Sci. Signal. 9, rs6 (2016). [DOI] [PMC free article] [PubMed] [Google Scholar]
- 37.Shoup D., Szabo A., Role of diffusion in ligand binding to macromolecules and cell-bound receptors. Biophys. J. 40, 33–39 (1982). [DOI] [PMC free article] [PubMed] [Google Scholar]
- 38.DeLisi C., The biophysics of ligand-receptor interactions. Q. Rev. Biophys. 13, 201–230 (1980). [DOI] [PubMed] [Google Scholar]
- 39.Northrup S. H., Erickson H. P., Kinetics of protein-protein association explained by Brownian dynamics computer simulation. Proc. Natl. Acad. Sci. U.S.A. 89, 3338–3342 (1992). [DOI] [PMC free article] [PubMed] [Google Scholar]
- 40.Rawle R. J., van Lengerich B., Chung M., Bendix P. M., Boxer S. G., Vesicle fusion observed by content transfer across a tethered lipid bilayer. Biophys. J. 101, L37–39 (2011). [DOI] [PMC free article] [PubMed] [Google Scholar]
- 41.Strickfaden S. C., et al. , A mechanism for cell-cycle regulation of MAP kinase signaling in a yeast differentiation pathway. Cell 128, 519–531 (2007). [DOI] [PMC free article] [PubMed] [Google Scholar]
- 42.Hasson M. S., Blinder D., Thorner J., Jenness D. D., Mutational activation of the STE5 gene product bypasses the requirement for G protein beta and gamma subunits in the yeast pheromone response pathway. Mol. Cell. Biol. 14, 1054–1065 (1994). [DOI] [PMC free article] [PubMed] [Google Scholar]
- 43.Sette C., Inouye C. J., Stroschein S. L., Iaquinta P. J., Thorner J., Mutational analysis suggests that activation of the yeast pheromone response mitogen-activated protein kinase pathway involves conformational changes in the Ste5 scaffold protein. Mol. Biol. Cell 11, 4033–4049 (2000). [DOI] [PMC free article] [PubMed] [Google Scholar]
- 44.Winters M. J., Lamson R. E., Nakanishi H., Neiman A. M., Pryciak P. M., A membrane binding domain in the ste5 scaffold synergizes with gbetagamma binding to control localization and signaling in pheromone response. Mol. Cell 20, 21–32 (2005). [DOI] [PubMed] [Google Scholar]
- 45.Case L. B., Ditlev J. A., Rosen M. K., Regulation of transmembrane signaling by phase separation. Annu. Rev. Biophys. 48, 465–494 (2019). [DOI] [PMC free article] [PubMed] [Google Scholar]
- 46.Chung J. K., et al. , Coupled membrane lipid miscibility and phosphotyrosine-driven protein condensation phase transitions. Biophys. J. 120, 1257–1265 (2021). [DOI] [PMC free article] [PubMed] [Google Scholar]
- 47.Veatch S. L., Keller S. L., Separation of liquid phases in giant vesicles of ternary mixtures of phospholipids and cholesterol. Biophys. J. 85, 3074–3083 (2003). [DOI] [PMC free article] [PubMed] [Google Scholar]
- 48.Halford S. E., Marko J. F., How do site-specific DNA-binding proteins find their targets? Nucleic Acids Res. 32, 3040–3052 (2004). [DOI] [PMC free article] [PubMed] [Google Scholar]
- 49.Deming P., Kornbluth S., Study of apoptosis in vitro using the Xenopus egg extract reconstitution system. Methods Mol. Biol. 322, 379–393 (2006). [DOI] [PubMed] [Google Scholar]
- 50.Krichevsky O., Bonnet G., Fluorescence correlation spectroscopy: The technique and its applications. Rep. Prog. Phys. 65, 251–297 (2002). [Google Scholar]
Associated Data
This section collects any data citations, data availability statements, or supplementary materials included in this article.
Supplementary Materials
Appendix 01 (PDF)
Data Availability Statement
All study data are included in the article and/or SI Appendix.