



Abstract
Purpose
In the context of in vitro fertilization–embryo transfer (IVF–ET), factors other than egg quality may be key determinants of treatment success, in particular, maternal factors related to uterine endometrial receptivity and unidentified factors. We therefore aimed to analyze the metabolome and microbiome in IVF–ET patients who did and did not achieve pregnancy.
Methods
Cervicovaginal mucus was collected from patients undergoing IVF–ET. Metabolite analysis was conducted by liquid chromatography‐mass spectrometry and the microbiota were determined by the polymerase chain reaction using universal 16S‐rRNA gene bacterial primers by MiSeq sequencing. Patients were classified as pregnant (N = 10) or nonpregnant (N = 13). Metabolic pathways were examined by MetaboAnalyst.
Results
Three metabolic pathways, including alanine‐aspartate–glutamate metabolism, arginine biosynthesis, and cysteine‐methionine metabolism, were commonly decreased at the time of embryo transfer irrespective pregnant outcomes. Notably, pyruvate was decreased in the pregnant group. Amino acid metabolites showed inverse correlations with the presence of anaerobic microbiota in the nonpregnant group.
Conclusions
Metabolism decreased during embryo transplantation, with a notable decrease in pyruvate metabolism, particularly in patients who became pregnant. The behavior of metabolites in the pregnant and nonpregnant groups suggests that metabolome analysis in the cervicovaginal mucus may be a diagnostic marker for predicting pregnancy.
Keywords: in vitro fertilization–embryo transfer, metabolome, microbiome, mucus, pyruvate
1. INTRODUCTION
It is estimated that approximately one in 13.9 births in Japan is achieved through in vitro fertilization–embryo transfer (IVF–ET), which has become a widely recognized technology among the Japanese population. 1 Even when the quality of the fertilized embryos is high, successful pregnancy is likely to depend on the condition of the mother's endometrium and other factors; however, the detailed mechanisms remain unclear. The receptivity of the endometrium, especially during embryo transfer, is a crucial factor affecting pregnancy success. 2 Recent metabolomic and microbiome analyses have been employed to analyze the factors involved in achieving a successful pregnancy. For instance, Handelman et al. conducted a metabolomic analysis using serum samples from pregnant and nonpregnant patients, 3 while McMillan et al. reported on the characteristics of the vaginal microbiome in pregnant patients. 4 Both prospective and retrospective studies found that patients with abundant Lactobacillus in endometrial fluid and endometrial tissue samples tended to have successful live births compared with patients with bacteria, such as Streptococcus, and Staphylococcus. 5 Ichiyama et al. reported on the characteristics of the microbiota of the uterine cavity and vagina in cases of recurrent implantation failure (RIF), 6 and Tsai et al. found that a decrease in vaginal Lactobacilli and relative increase in Gardnerella were related to pregnancy failure. 7 It has been reported that microbiota present in the vagina have a pathway through the cervix and uterine cavity to the abdominal cavity, and indeed a high similarity between vaginal and intra‐abdominal microbiota has been reported. 8 , 9 On the other hand, the biological significance of microbiota may vary greatly depending on the anatomical localization of microbiota. There have been many discussions on the vaginal and uterine cavity in past papers, but there are few discussions on the microbiota in the cervicovaginal region, which is located in the middle of the vaginal and uterine cavity. Therefore, we analyzed cervicovaginal mucus specimens in this study. Obtaining cervicovaginal mucus samples is thus a less burdensome and painful way of collecting samples. We therefore conducted a comprehensive analysis of microbiomes and metabolites using cervicovaginal mucus, and compared the findings between IVF patients who did and did not become pregnant.
2. MATERIALS AND METHODS
2.1. Sample collection
We collected cervicovaginal mucus from patients undergoing fertility treatment who attended the outpatient clinic of Fujita Health University Hospital, Aichi Prefecture, Japan, from February 2020 to December 2020 (Figure 1). Cervicovaginal mucus was collected twice from the same patient: at the time of oocyte retrieval and at the time of embryo transfer. The anatomic site of sampling was fixed. The samples were collected using BD BBL Culture Swabs (Becton, Dickinson and Company, Franklin Lakes, NJ, USA) for microbial analysis, and with a 1‐cm diameter cotton swab for metabolomic analysis. All samples were taken by an identical physician in order to prevent inter‐physician bias. The samples were immediately stored at −20°C at the outpatient ward, then transferred into a deep freezer at −80°C. The patient's pregnancy status during sample collection was unknown, and confirmation of pregnancy/nonpregnancy was determined at a later date. The patients/samples were therefore classified later into pregnant (N = 10) and nonpregnant (N = 13) groups, and the analyses were conducted based on these groups.
FIGURE 1.
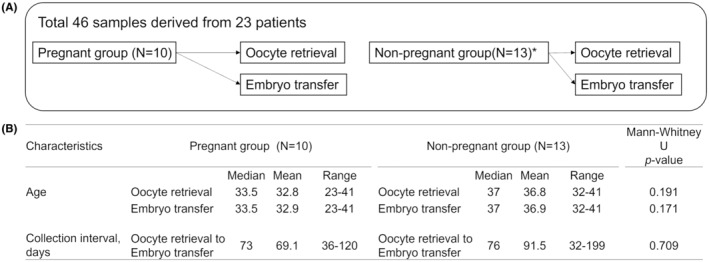
Details of sample collections. (A) Cervicovaginal mucus samples were collected twice from the same patient, at the time of oocyte retrieval and at the time of embryo transfer, from pregnant (N = 10) and nonpregnant (N = 13) patients. *Metabolome analysis was carried out in 12 patients in the nonpregnant group because of improper sampling in one patient. (B) Information on age at time of sample collection and number of days between oocyte retrieval and transplantation.
Fertility treatment was conducted according to the following protocol. Ovarian stimulation was performed with recombinant or urinary follicle‐stimulating hormone. When follicles reached at least 18 mm, human chorionic gonadotropin was administered. Oocyte retrieval was performed 36 h later. The remaining blastocysts were cryopreserved on day 5 or 6. Transdermal estrogen was administered for 35 days from day 2 or 3 after the onset of period until the day of the pregnancy test or until the end of the first trimester of pregnancy. Once the endometrial stripe thickness on ultrasound examination was ≥8 mm with a proliferative pattern, daily progesterone was administered via vaginal suppositories and oral tablets for 6 days. Frozen–thawed embryo transfer was then performed on day 6 of progesterone support, and patients were advised to use progesterone until the end of the first trimester of pregnancy or when they obtained a second negative pregnancy blood test.
We estimated blastcyst before transfer according to a three‐part scoring system based on blastocyst expansion, inner cell mass, and trophectoderm development by Gardner and Schoolcraft. 10 Briefly, the inner cell mass was assessed as follows: A, tightly packed, many cells; B, loosely grouped, several cells; or C, very few cells. The trophectoderm was assessed as follows: A, many cells forming a cohesive epithelium; B, few cells forming a loose epithelium; or C, very few large cells. The patients having the development of very few cells of inner cell mass and very few large cells of the trophectoderm were eliminated from this study. This study was approved by the Institutional Review Board of Fujita Health University, Japan. All procedures were performed in accordance with relevant guidelines and regulations. Written informed consent was obtained from all patients prior to specimen collection.
2.2. Sample preparation for cervical metabolomics
Swabs with cervicovaginal mucus were immersed in 500 μL of ice‐cold methanol containing 10 μM internal standard (2‐morpholinoethanesulfonic acid) solution and vortexed at high speed, and 200 μL of ice‐cold chloroform and 125 μL of water were then added to 200 μL of the extract. The mixture was vortexed and centrifuged at 13 500 g for 10 min at 4°C. The supernatant was then filtered through a 10 kDa molecular filter (Merck, Darmstadt, Germany) and the filtrate was dried in a centrifuge.
2.3. Metabolite profiling and quantification
Extracts for cervical metabolomics were diluted with 50 μL of water and used for liquid chromatography‐mass spectrometry (LC–MS/MS) using a LCMS‐8060 (Shimadzu Scientific, Japan) accompanied by the LC/MS/MS Method Package for Primary Metabolites Ver. 3, which provides optimized analytical conditions including chromatogram acquisition, detection of mass spectral peaks using an incorporated mass spectral library, and method files that specify the analytical conditions. A Supelco Discovery HS F5‐3 reversed‐phase column (2.0 mm × 150 mm, 3 μm) (Merck) was used as the analytical column. The Liquid chromatography parameters were as follows: mobile phase A, 0.1% (v/v) formic acid in water; mobile phase B, 0.1% (v/v) formic acid in acetonitrile; and gradient profile, t = 0 min, 0% B; t = 2.0 min, 0% B; t = 5.0 min, 25% B; t = 11.0 min, 35% B; t = 15.0 min, 95% B; t = 20.0 min, 95% B; t = 20.1 min, 0% B; and t = 25 min, 0% B. The columns were maintained at 40°C, the mobile phase flow rate was 250 μL/min, and the sample injection volume was 1 μL. The analytical conditions were determined according to Shimadzu Manufacturing's method package primary metabolite ver.2. Peak intensities for primary metabolites were estimated using LabSolutions software (Shimadzu Scientific). The method of evaluation using volcano plots was carried out following the approach of Liu et al. and Jia et al. 11 , 12
2.4. Pathway analysis
Pathway analysis was performed using the Metabolomic Pathway Analysis (MetPA) web‐based tool embedded in the MetaboAnalyst 5.0 platform (https://www.metaboanalyst.ca/), to identify pathways that were significantly altered between samples. Metabolites that differed significantly in abundance between nonpregnant and pregnant groups and between embryo transfer and oocyte retrieval were imported into the Pathway Analysis function of MetaboAnalyst to perform pathway enrichment and topology analysis. Metabolite identifiers were converted as necessary, according to the synonyms listed in the Kyoto Encyclopedia of Genes and Genomes (KEGG). The pathway impact value was calculated as the sum of importance measures of the metabolites generated by topology analysis, normalized by the sum of importance measures of all metabolites in the relevant pathway.
2.5. DNA extraction for microbial analysis
DNA was extracted from cervicovaginal mucus collected using a BD BBL Culture Swab Plus with a ChargeSwitch Forensic DNA Purification Kit (Thermo Fisher Scientific, Waltham, MA, USA) according to the manufacturer's instructions. DNA concentrations were measured using a Synergy H1 microplate reader (BioTek, Winooski, VT) and a QuantiFluor dsDNA system (Promega, Madison, WI, USA) according to the manufacturer's instructions.
2.6. Library preparation and sequencing
Cervicovaginal microbiota were determined from extracted genomic DNA by the polymerase chain reaction (PCR) using universal 16S rRNA gene (rDNA) bacterial primers for the V3/4 region, followed by MiSeq sequencing. 13 Libraries were prepared using a two‐step tailed PCR method. First, two PCR analyses were performed using Bakt_341F and Bakt_805R primers and index primers. Library concentrations were measured using a Synergy H1 microplate reader (BioTek Instruments Inc., Winooski, VT, USA) and a QuantiFluor dsDNA System (Promega), and library quality was assessed using a Fragment Analyzer (Advanced Analytical Technologies, Ankeny, IA, USA) and a dsDNA 915 Reagent Kit (Agilent, Santa Clara, CA, USA) according to the manufacturer's instructions. Paired‐end sequencing (2 × 300 bp) was performed on the Illumina MiSeq platform (Illumina, San Diego, CA, USA) using a MiSeq Reagent Kit v3 (Illumina).
2.7. Microbial data analysis
Reads that started with a sequence that completely matched the primer were extracted using the fastx_barcode_splitter tool in the FASTX‐Toolkit, and the primer sequence was then trimmed. The Sickle tool was then used with a quality of 20 to trim and filter the reads, and trimmed reads and paired‐end reads with <150 bases were discarded. Paired‐end reads were merged using FLASH program to merge the remaining reads with the following conditions: fragment length after merge, 420 bases; read fragment length, 280 bases; and minimum overlap length, 10 bases. All merged sequences were used for further analysis. QIIME2.0 (2019.4) with default parameter values was used for sequence denoising using the Divisive Amplicon Denoising Algorithm 2 (DADA2) method, chimera checking, and for taxonomic assignments using the Greengenes database (13_8), clustered at 97% identity. Alpha diversity estimators observed species richness (Sobs) − the observed operational taxonomic units (OTUs) were calculated for the entire bacterial community using QIIME2.0. The Ribosomal Database Project (RDP) classifier was used for taxonomic assignments for the genus Lactobacillus, and the merged sequences (reads) were used as the input to the RDP classifier. Because the region of the gene to be analyzed was different and a new database had to be created, the 16S rRNA gene sequences of 12 species of Lactobacillus (L. coleohominis, L. crispatus, L. gasseri, L. iners, L. jensenii, L. mucosae, L. paracasei, L. paraplantarum, L. plantarum, L. reuteri, L. rhamnosus, and L. vaginalis) included in the database attached to SpeciateIT (https://sourceforge.net/projects/speciateit/) were downloaded from the RDP website (http://rdp.cme.msu.edu/hierarchy/hb_intro.jspusing) the following options: strain = both; source = isolates, size ≥1200 bases; quality = good, and taxonomy = nomenclatural. Following SpeciateIT instructions, a database for species discrimination analysis was created from the 16S rRNA gene sequences, and a species discrimination analysis was performed using SpeciateIT, using the created database and the output sequences of RDP classifier classified as the genus Lactobacillus.
2.8. Statistical analyses
Statistical analyses were performed using SPSS for Windows (ver. 22.0.0.0; IBM Corp, Armonk, NY, USA) and MetaboAnalyst 5.0 free web analysis software. Mann–Whitney U‐tests were used to compare relative abundances of continuous data between the pregnant and nonpregnant groups, and results for oocyte retrieval and embryo transplantation in the same patient were compared using Wilcoxon's signed‐rank test. Values of p < 0.05 were considered statistically significant. Volcano plots were created by MetaboAnalyst to visualize all variables, showing the fold change between the two groups on the horizontal axis (on a log scale) and the p‐value of the differences between samples on the vertical axis (on a negative log scale), and presenting important variables with p < 0.05 and fold change of 2. Spearman's rank correlation for multiple comparisons was estimated for the association between bacteria and metabolites.
3. RESULTS
3.1. Identification of metabolite sets in patients undergoing IVF
LC–MS/MS used with the LC/MS/MS Method Package for Primary Metabolites Ver. 3 identified 86 primary metabolites in patients undergoing IVF. In the volcano plot, the significance of metabolic changes was determined using the following criteria: −log10(p‐value) > 1.3 (i.e., p < 0.05) and absolute log2(fold change) > 1 (i.e., fold change >2) (Figure 2; Tables S1 and S2). 4‐Hydroxyproline was increased and spermine was decreased in the pregnant group compared with the nonpregnant group at the time of oocyte retrieval (Figure 2A), but only orotic acid was decreased in the pregnant group at the time of embryo transfer (Figure 2B). Comparing samples from the same patient at oocyte retrieval and embryo transfer, 52 metabolites were downregulated and one was upregulated in the pregnant group, and 33 were down‐regulated in the nonpregnant group (Figure 2C,D). Among the downregulated metabolites, 32 were common between the pregnant and nonpregnant groups and 20 metabolites were significantly reduced at the time of embryo transfer in the pregnant group (Table S2). The results of metabolome analysis revealed that the metabolic changes in the pregnant group, which were actively fluctuating during oocyte retrieval, were subdued during embryo transfer. As for amino acids or nucleic acids, there were no significant differences between the pregnant and nonpregnant groups. Metabolite analysis validation involved assessing the precision of the methods through intra‐day and inter‐day tests, utilizing the Relative Standard Deviation (RSD) as a measure. In these tests, peak areas of components were calculated. The %RSD values for peak areas were determined to be within acceptable limits, ranging from 2.88% to 14.71% for intra‐day precision and from 2.33% to 17.06% for interday precision. Notably, all calculated values for individual components met the criteria of <30%RSD, demonstrating the methods' accuracy and reproducibility.
FIGURE 2.

Volcano plot showing differential metabolites in patients undergoing IVF. (A) At oocyte retrieval in nonpregnant group versus pregnant group; (B) at embryo transfer in nonpregnant group vs. pregnant group; (C) at embryo transfer vs. oocyte retrieval in pregnant group; (D) at embryo transfer vs. oocyte retrieval in nonpregnant group. Up or down in the pregnant group relative to the nonpregnant group (A, B) and at the time of embryo transfer relative to the time of oocyte retrieval (C, D). Results were plotted with a p‐value < 0.05 and a fold change > 2. Significantly increased metabolites are shown in red and significantly decreased metabolites are shown in blue. FC, fold change.
3.2. Metabolic pathway and network analyses
Based on the MetaboAnalyst platform, pathway set enrichment analysis was employed to elucidate metabolic pathways affected by differences among 86 identified metabolites. To identify pathways that were reduced at the time of embryo transfer relative to the time of oocyte retrieval, we performed pathway analysis on significantly changed metabolites in Figure 3A (false discovery rate‐adjusted p < 0.05 and pathway impact >0.40). Among these metabolic pathways, three were reduced more strongly in the pregnant group than in the nonpregnant group (Figure 3B). Pathways linked with altered metabolites by p‐value or impact included alanine, aspartate, and glutamate metabolism, arginine biosynthesis, and cysteine and methionine metabolism (Figure 3B–E; Table S2). These three metabolic pathways included metabolites that were commonly decreased in the pregnant and nonpregnant groups at the time of embryo transfer, as well as metabolites that were specifically decreased in the pregnant group. Characteristically, pyruvate was decreased at embryo transfer in the pregnant group, in common with these three metabolic pathways.
FIGURE 3.

Pathway analysis by MetaboAnalyst. (A) Plots depicting several metabolic pathways that were reduced at the time of embryo transfer relative to the time of oocyte retrieval. Pathways represented as circles according to their pathway impact values from pathway topology analysis (x‐axis) and log p‐value obtained from pathway enrichment analysis (y‐axis). Each dot represents a metabolic pathway, and label corresponds to pathway number in (B). (B) Overlapping results with MetaboAnalyst analysis in (A) identified five pathways (bold) that were more strongly reduced in the pregnant group (false discovery rate p < 0.05, pathway impact >0.40). These included three pathways with large differences (highlighted orange) in impact values (C–E). Metabolites that were commonly decreased in the pregnant and nonpregnant groups at the time of embryo transfer are shown in blue, metabolites that were significantly lower in the pregnant group only are shown in red, and metabolites that were significantly lower in the nonpregnant group only are shown in green. (C) Alanine, aspartate, and glutamate metabolism; (D) arginine biosynthesis; (E) cysteine and methionine metabolism. S‐Adenosylhomocysteine was decreased in the nonpregnant group.
3.3. Characteristics of cervicovaginal microbiota in patients with infertility
The cervicovaginal microbiota was investigated in extracted genomic DNA using PCR with universal 16S rRNA gene (rDNA) bacterial primers for the V3/4 region followed by MiSeq sequencing. A total of 3 567 507 reads (average 775 54.5 reads per sample) and 364 OTUs (average 17 OTUs per sample) were obtained from 46 samples (Table 1). The dominant phyla in the vaginal microbiota in the 46 samples were Firmicutes and Actinobacteria, which accounted for 67.9% and 16.7% of the total abundance, respectively, and the top four dominant orders were Lactobacillales (62.3%), Bifidobacteriales (15.4%), Enterobacteriales (9.5%), and Bacillales (3.7%).
TABLE 1.
Relative abundance of cervicovaginal microbiota in pregnant and nonpregnant groups at oocyte retrieval and embryo transfer.
| Pregnant group (N = 10) | Nonpregnant group (N = 13) | Total | |||
|---|---|---|---|---|---|
| At oocyte retrieval | At embryo transfer | At oocyte retrieval | At embryo transfer | ||
| N = 10 | N = 10 | N = 13 | N = 13 | N = 46 | |
| Phylum, % | |||||
| Firmicutes | 66.4 | 58.2 | 75.7 | 71.2 | 67.9 |
| Actinobacteria | 19.7 | 17.9 | 19.0 | 10.3 | 16.7 |
| Proteobacteria | 1.4 | 20.8 | 0.1 | 17.4 | 9.9 |
| Tenericutes | 3.6 | 2.2 | 2.2 | 0.8 | 2.2 |
| Class, % | |||||
| Bacilli | 62.4 | 57.2 | 74.3 | 69.9 | 65.9 |
| Actinobacteria | 18.4 | 17.0 | 17.8 | 9.2 | 15.6 |
| Gammaproteobacteria | 1.3 | 20.7 | 0.0 | 17.4 | 9.8 |
| Mollicutes | 3.6 | 2.2 | 2.2 | 0.8 | 2.2 |
| Order, % | |||||
| Lactobacillales | 60.5 | 51.4 | 71.8 | 65.4 | 62.3 |
| Bifidobacteriales | 18.4 | 17.0 | 17.8 | 8.6 | 15.4 |
| Enterobacteriales | 0.0 | 20.7 | 0.0 | 17.3 | 9.5 |
| Bacillales | 1.9 | 5.7 | 2.5 | 4.5 | 3.7 |
| Family, % | |||||
| Lactobacillaceae | 46.1 | 37.8 | 54.4 | 43.8 | 45.5 |
| Streptococcaceae | 13.0 | 13.6 | 17.0 | 21.1 | 16.2 |
| Bifidobacteriaceae | 18.4 | 17.0 | 17.8 | 8.6 | 15.4 |
| Enterobacteriaceae | 0.0 | 20.7 | 0.0 | 17.3 | 9.5 |
| Genus, % | |||||
| Lactobacillus | 46.1 | 37.8 | 54.4 | 43.8 | 45.5 |
| Streptococcus | 13.0 | 13.6 | 17.0 | 21.1 | 16.2 |
| Gardnerella | 11.7 | 17.0 | 6.0 | 8.4 | 10.8 |
| Escherichia | 0.0 | 12.9 | 0.0 | 14.8 | 6.9 |
| Bifidobacterium | 6.7 | 0.0 | 11.7 | 0.1 | 4.6 |
| Total reads | 745 263 | 741 094 | 1 005 598 | 1 075 552 | 3 567 507 |
| Average reads/specimen | 74526.3 | 74109.4 | 77353.7 | 82734.8 | 77554.5 |
| Average OTU/specimen | 16 | 17.9 | 12.9 | 21.2 | 17 |
Abbreviation: OTU, operational taxonomic unit.
The relative abundances of representative microbiota in the pregnant and nonpregnant groups at the time of oocyte retrieval and embryo transfer, respectively, are shown in Figure 4 and Table 1. The composition of the cervicovaginal community was as expected: Lactobacillus predominated in both groups and was detected in 34 samples (74%), with no significant difference among all groups (Table 2). In addition to Lactobacillus, other bacteria, including Streptococcus and Gardnerella, were also detected, representing the diversity of the vaginal flora.
FIGURE 4.

Heatmap of relative abundance of representative microbiota. Cervicovaginal microbiota were collected from 23 patients undergoing oocyte retrieval and embryo transfer. A total of 46 samples were identified by 16S rRNA V3/4 sequencing. Color gradient indicates relative abundance of microbial groups (scale indicated at bottom). Number of microbial species qualified by observed species richness indicated as α‐diversity in each sample.
TABLE 2.
Relative abundance of microbiota in patients undergoing IVF.
| Pregnant group (N = 10) | Nonpregnant group (N = 13) | Pregnant vs | ||||||||||
|---|---|---|---|---|---|---|---|---|---|---|---|---|
| Nonpregnant group | ||||||||||||
| At oocyte retrieval | At embryo transfer | Wilcoxon's signed‐rank | At oocyte retrieval | At embryo transfer | Wilcoxon's signed‐rank | Mann–Whitney U | ||||||
| Mean (SD) | Number of specimens observed | Mean (SD) | Number of specimens observed | p‐Value | Mean (SD) | Number of specimens observed | Mean (SD) | Number of specimens observed | p‐Value | p‐Value | ||
| Oocyte retrieval | Embryo transfer | |||||||||||
| Lactobacillus | 46.1 (41.7) | 9 | 37.8 (43.1) | 7 | 0.173 | 54.4 (46.1) | 9 | 43.8 (42.5) | 9 | 0.139 | 0.575 | 0.706 |
| Streptococcus_anginosus | 2.1 (6.8) | 1 | 5.7 (12.7) | 5 | 0.043* | 4.5 (15.8) | 3 | 3.7 (9.3) | 5 | 0.463 | 0.453 | 0.632 |
| Staphylococcus | 1.9 (5.9) | 3 | 5.7 (15) | 6 | 0.249 | 2.5 (6.8) | 2 | 4.5 (12.1) | 9 | 0.285 | 0.519 | 0.704 |
| Ureaplasma | 3.6 (7.8) | 6 | 2.1 (3.7) | 7 | 0.612 | 2.2 (4.8) | 3 | 0.8 (2.1) | 4 | 0.144 | 0.159 | 0.088 |
| Gardnerella | 11.7 (16.1) | 5 | 17 (25.4) | 5 | 0.225 | 6 (13.2) | 3 | 8.4 (19.3) | 4 | 0.715 | 0.243 | 0.342 |
| Finegoldia | 0.003 (0.01) | 1 | 0.04 (0.1) | 4 | 0.080 | 0.1 (0.2) | 5 | 0.1 (0.4) | 4 | >0.95 | 0.108 | 0.466 |
| Anaerococcus | 0.04 (0.1) | 2 | 0.1 (0.3) | 4 | 0.138 | 0.02 (0.1) | 2 | 0.04 (0.1) | 5 | 0.463 | 0.778 | 0.725 |
| Escherichia_coli | 0.01 (0.02) | 2 | 12.9 (28.7) | 6 | 0.128 | 0 (0) | 0 | 14.8 (28.2) | 5 | 0.043* | 0.099 | 0.503 |
| Corynebacterium | 0 (0) | 0 | 0.02 (0.05) | 2 | 0.180 | 0.1 (0.2) | 2 | 0.5 (1.2) | 8 | 0.173 | 0.205 | 0.047* |
| Peptoniphilus | 0.02 (0.05) | 3 | 0.002 (0.01) | 1 | 0.144 | 0 (0.02) | 4 | 0.01 (0.01) | 4 | 0.463 | 0.909 | 0.283 |
| Cellulomonadaceae | 0.002 (0.01) | 1 | 0.02 (0.03) | 3 | 0.109 | 0 (0.01) | 3 | 0.03 (0.1) | 4 | 0.398 | 0.453 | 0.970 |
| Prevotella | 6.2 (12.8) | 3 | 0.3 (1) | 2 | 0.144 | 0.5 (1.4) | 5 | 0.002 (0.01) | 1 | 0.046* | 0.942 | 0.397 |
| Bifidobacterium | 6.7 (16.2) | 4 | 0.04 (0.1) | 2 | 0.273 | 11.7 (28) | 3 | 0.1 (0.3) | 1 | 0.144 | 0.543 | 0.458 |
| Dialister | 0.4 (0.8) | 3 | 0.01 (0.01) | 2 | 0.144 | 0.5 (1.3) | 4 | 0.001 (0.003) | 1 | 0.068 | 0.970 | 0.340 |
| Ralstonia | 0.002 (0.01) | 1 | 0.1 (0.2) | 5 | 0.116 | 0.01 (0.05) | 1 | 0.02 (0.1) | 3 | 0.109 | 0.899 | 0.145 |
| Atopobium | 1.2 (3.1) | 2 | 0.7 (2) | 2 | 0.180 | 1 (3.7) | 1 | 1 (3.2) | 3 | >0.95 | 0.458 | 0.864 |
| Enterobacteriaceae | 0 (0) | 0 | 7.7 (19) | 3 | 0.109 | 0.01 (0.03) | 1 | 2.5 (5.3) | 4 | 0.068 | 0.380 | 0.909 |
| Clostridiales | 0.01 (0.02) | 4 | 0 (0) | 0 | 0.068 | 0.01 (0.02) | 2 | 0.003 (0.01) | 1 | 0.180 | 0.261 | 0.380 |
| Bradyrhizobium | 0 (0) | 0 | 0 (0.1) | 2 | 0.180 | 0.03 (0.1) | 2 | 0.02 (0.04) | 3 | 0.715 | 0.205 | >0.95 |
| Aerococcus | 1.4 (4.4) | 2 | 0 (0.1) | 1 | 0.655 | 0.1 (0.3) | 1 | 0.04 (0.1) | 2 | 0.655 | 0.397 | 0.711 |
| Megasphaera | 2.3 (5.9) | 2 | 0.7 (2.1) | 2 | 0.655 | 0.7 (2.6) | 1 | 1.1 (3.9) | 1 | 0.317 | 0.397 | 0.458 |
| Actinomyces | 0 (0) | 0 | 0 (0.003) | 1 | 0.317 | 0.01 (0.02) | 2 | 0.01 (0.02) | 2 | >0.95 | 0.205 | 0.634 |
| Bacteroides | 0 (0) | 0 | 0.1 (0.2) | 3 | 0.109 | 0 (0) | 0 | 0.1 (0.3) | 2 | 0.180 | >0.95 | 0.465 |
| Pseudomonas | 0 (0) | 0 | 0 (0) | 0 | >0.95 | 0 (0) | 0 | 0.02 (0.02) | 5 | 0.043* | >0.95 | 0.032* |
Note: Mean relative abundance of microbiota observed in five or more patients. Taxonomy included genus and species.
Abbreviation: SD, standard deviation.
p < 0.05.
We compared the microbiota compositions between groups by compiling the data using α‐diversity, which reflects species richness and evenness within bacterial populations. Alpha diversity observed species richness and diversity index, calculated using Chao1, faith_PD, and Shannon indices, did not differ significantly between the groups at the genus level (Figure 4; Figure S1). Principal coordinate analysis of weighted and unweighted UniFrac distances showed no clear difference in β‐diversity of the cervicovaginal microbial communities between the pregnant and nonpregnant groups at the time of oocyte retrieval or embryo transfer.
3.4. Change in microbiota between oocyte retrieval and embryo transfer
To identify significant differences in relative abundance at the species and genus levels, we further analyzed the abundance of taxa in the pregnant and nonpregnant groups at the times of oocyte retrieval and embryo transfer. There was no significant difference in the relative abundance of Lactobacillus in either group (Table 2, Figure S2). Streptococcus anginosus was significantly increased in the pregnant group at embryo transfer compared with oocyte retrieval, and Escherichia coli, Prevotella, and Pseudomonas were significantly increased in the nonpregnant group at embryo transfer compared with oocyte retrieval. At the genus level, Corynebacterium and Pseudomonas were significantly increased at embryo transfer in the nonpregnant group compared with the pregnant group. Pseudomonas was not detected in the pregnant group and was only detected at embryo transfer in the nonpregnant group.
3.5. Correlation of microbiome and metabolites during oocyte retrieval
For the genus Lactobacillus, we further classified the genera of interest to species level using SpeciateIT. Correlation analysis was performed in the pregnant and nonpregnant groups at oocyte retrieval, between the six Lactobacillus species found to be present and the dominant bacteria at genus level and 86 metabolites (Figure 5; Figure S3). Lactobacillus showed completely different behaviors in the pregnant and nonpregnant groups during oocyte retrieval (Figure 5A). 4‐Hydroxyproline, whose expression was reduced in the nonpregnant group at oocyte retrieval (Figure 2) was positively correlated with L. coleohominis and L. crispatus in the nonpregnant group, while spermine, whose expression was reduced in the pregnant group, was positively correlated with L. coleohominis in the pregnant group. Notably, L. iners and 2‐ketoglutaric acid were positively correlated in the pregnant group but negatively correlated in the nonpregnant group. There were no significant differences in amino acids or nucleic acids between the pregnant and nonpregnant groups; however, correlation analysis with Lactobacillus and the microbiota (Figure 5B) showed that L. coleohominis and L. crispatus were positively correlated with many amino acids in the nonpregnant group, while Finegoldia, Peptoniphilus, and other anaerobic microbe showed negative correlations. In contrast, there was no characteristic correlation in the pregnant group.
FIGURE 5.

Spearman's correlation coefficients between Lactobacillus species or other microbes and metabolites at the time of oocyte retrieval. Heatmap showing Spearman's correlation coefficients between (A) Lactobacillus species and metabolites other than amino acids and nucleic acids, and (B) Lactobacillus species or other microbes and amino acids and nucleic acids. Microbiota present in three or more patients were selected. Color corresponds to Spearman's correlation coefficient distribution: dark yellow indicates strong positive correlation (correlation coefficient 0.6–1.0); pale yellow indicates weak positive correlation (correlation coefficient 0.2–0.6); pale blue indicates weak negative correlation (correlation coefficient −0.2 to −0.6); and dark blue indicates strong negative correlation (correlation coefficient −0.6 to −1.0). *p < 0.05.
4. DISCUSSION
When analyzing the metabolome and microbiome of the female genitalia, it is essential to recognize the differences in data interpretation based on the collection sites. This study does not deny the importance of analyzing the metabolome and microbiome of the uterine cavity or endometrium. Rather, it examines biological phenomena in the cervicovaginal region as part of investigating the physiological changes associated with the movement of microbiota from the vagina to the endometrium by way of the cervicovaginal area. We examined the cervicovaginal metabolome and microbiome in women who did and did not become pregnant through IVF–ET. Comparing the results for the two groups revealed distinctive cervicovaginal metabolome and microbiome characteristics in the group that achieved pregnancy. To minimize the burden on patients, sample collection was limited to the times of oocyte retrieval and embryo transfer. We observed that 4‐hydroxyproline metabolism was increased while spermine was decreased in the pregnant group at the time of oocyte retrieval. 4‐Hydroxyproline is known to be present in follicular fluid, and its metabolism increases with age. 14 The median age of women in the pregnancy group in the current study was 33.5 years compared with 37 years in the nonpregnancy group, but the relationship with age was not clear. 4‐Hydroxyproline is also known to be degraded by enzymes produced by the vaginal microbiota, especially Clostridioides difficile 15 , 16 , 17 ; given that C. difficile was not detected in the pregnancy group in this study, the accelerated metabolism of 4‐hydroxyproline in this group may indicate the absence of this microbe. Spermine is known to have anti‐inflammatory properties, 18 and the decreased spermine metabolism in the pregnant group suggests the potential for creating an environment conducive to inflammation or suppressing microbiota activity. Previous studies reported that spermine production by microbiota in the intestines was six times higher than that produced from dietary intake, 19 and spermine in the vagina is believed to be produced by the vaginal microbiota. Orotic acid is produced by the microbiota 20 and was decreased in samples taken at the time of embryo transfer. The reduced metabolism of orotic acid in the pregnant group suggests either fewer relevant microbes or decreased activity of microbes in this group. Analyzing the metabolites produced by the microbiota may shed light on the relationship between the microbiome and pregnancy.
To elucidate the crucial factors related to uterine receptivity during embryo implantation, we also investigated specific metabolic changes during implantation, by comparing samples collected at the time of implantation with samples collected at oocyte retrieval. We found that pyruvate metabolism, which plays a fundamental role in human metabolism, 21 was decreased in the pregnancy group. It has been suggested that the metabolism of fertilized eggs at the preimplantation stage decreases, referred to as metabolic “quiet”, 22 , 23 , 24 , 25 to avoid exposing fertilized eggs to various stresses due to metabolic overactivity. Notably, our data indicated that a similar metabolic “quiet” phenomenon occurred on the maternal side, with a particular decrease in pyruvate metabolism, in accord with reports for fertilized eggs. 24 , 26 , 27 Pyruvate undergoes decreased metabolism in multiple pathways and may play a pivotal role in successful pregnancy. A previous study reported the disappearance of glutamate and aspartate from the uterine fluid of rabbits during the implantation period, suggesting that metabolic decline may be a common phenomenon in mammals. 28 Alanine, aspartate, and glutamate metabolism has been reported to increase during early miscarriage (EM), recurrent miscarriage (RM), and RIF. 29 Further studies are needed to investigate the relationship between the current results and these previous data, suggesting a link between miscarriage and enhanced amino acid metabolism, to determine if a decrease in metabolism is a necessary condition for a successful pregnancy outcome.
The current analysis found no significant difference in cervicovaginal microbial diversity between the pregnant and nonpregnant groups. A previous study of individual bacteria showed increases in Gardnerella and decreases in Lactobacillus in cervical mucus from nonpregnant patients, 7 while another study showed that Streptococcus was more prevalent in nonpregnant patients 30 ; however, the current analysis found no significant difference. In contrast, Pseudomonas and Corynebacterium were not detected at oocyte retrieval but were detected at implantation in nonpregnant patients. Pseudomonas is known to be a causative agent of pelvic inflammatory disease and low pregnancy rates. 31 The use of vaginal suppositories before embryo transfer might have introduced microbes artificially or disrupted the bacterial community, and the possibility that this interference might have affected the success of pregnancy cannot be ruled out. Given the potential for contamination during embryo transplantation, we analyzed the relationship between the microbiota and metabolites using samples collected at the time of egg retrieval. L. iners showed a positive correlation with 2‐ketoglutaric acid in pregnant patients and a negative correlation in nonpregnant patients. 2‐Ketoglutaric acid has been reported to play a role in active oxygen removal in the citric acid cycle, 32 as well as improving the quality of mouse oocytes. 33 The metabolic enhancement of 2‐ketoglutaric acid appears to have a positive effect on the establishment of pregnancy. Although there were no obvious trends for nonamino acid metabolites in either group, we examined the associations of amino acids with the microbiome, and found a positive correlation with Lactobacillus, while many metabolites showed inverse correlations with mainly anaerobic microbes in the nonpregnant group, suggesting deep involvements of amino acid metabolism and anaerobic microbes. The presence of Lactobacillus has been positively correlated with amino acids and negatively correlated with bacterial vaginosis. 34 In addition, an increase in amino acids in uterine secretions at the peri‐implantation stage has been reported in cattle, but the relationship in humans remains unclear. 35 While we have discussed the correlation between the microbiome and metabolome, providing direct evidence for this relationship is challenging. However, Laniewski et al. were analyzing the association with the metabolome by infecting clinical isolates of cervicalvaginal bacteria into a 3D epithelial cell model that replicates human cervical epithelium. 36 They discovered that as a result of Prevolleta infection, asparagine is completely depleted from the 3D cell culture supernatant. Considering that the breakdown of asparagine catalyzed by bacterial asparaginase is occurring, and as shown in our Figure 5 results, asparagine is negatively correlated with the presence of Prevolleta, supporting their findings.
This study had several limitations. In this study, egg quality assessment is based on morphological features under a microscope. However, this does not guarantee egg quality in a strict sense. Actually, pregnant and nonpregnant group had five and eight AA class of blastcysts, respectively (Table S3). It was not possible in the present study to analyze egg quality uniformly for all AAs. While AB and BA were seen in cases of pregnancy but miscarriage, there were also cases of full‐term delivery with a similar evaluation, so the egg evaluation was not always directly related to whether or not a pregnancy was achieved. Similarly, in the nonpregnant group, the quality of the eggs by morphology did not appear to have a direct link with the quality of the pregnancy. The relationship among previous miscarriages, nonpregnancy outcomes and egg quality in the present study is also unclear. In the future, it would be better to compare those who get pregnant with those who cannot under the euploid embryo transfer by PGT‐A.
We compared the relationship between metabolites and the microbiota between the times of egg retrieval and embryo transfer in the same patients, to eliminate potential inter‐individual bias; however, in the comparison between the pregnancy and nonpregnancy groups, the limited number of patients may have introduced patient‐specific biases. Notably, the nonpregnant group included seven patients with EM (7/13, 53.8%), one with RM (1/13, 7.6%), and one with RIF (1/13, 7.6%), and the pregnant group included three patients with miscarriages (3/10, 30%), no preterm births, and seven patients with full‐term deliveries (7/10, 70%), and not all pregnancies necessarily resulted in live births. Regarding the association between RIF and the vaginal microbiota, previous studies have reported a decrease in Lactobacillus 6 , 37 ; however, the limited number of samples in our study meant that we could not carry out a similar subanalysis. RoyChoudhury et al. reported a distinction at metabolomic level between RIF and repeated implantation success, 38 and Zhang et al. noted that one pathway containing alanine, aspartate, glutamate metabolism was shared in patients with EM and RM. 29 These data were in accordance with one of the pathways identified in the current study. The previous study used blood, urine, and follicular fluid samples and discussed the divergence of results due to sample differences. In contrast, we used cervicovaginal secretions, and hope that these will continue to be used as an additional sample source in the future. To investigate uterine receptivity, it is crucial to examine samples collected from the uterus, and in the future, it is important to analyze the correlation using large number of samples collected from both the vagina and the uterine cavity.
Notably, it is difficult to eliminate bias due to vaginal agent administration when conducting vaginal microbiome analysis, and a separate control group should be included to investigate the association between the cervicovaginal microbiome and metabolites in relation to vaginally administered drugs. The microbiome and metabolome are thought to be influenced by diet, 3 and the concentration of amino acids in uterine secretions was shown to be influenced by diet 39 ; however, we did not investigate diet in this study. When using fresh fertilized eggs, the interval between egg retrieval and embryo transfer is estimated to be about 6 days, and the time intervals for specimen collection were consistent. However, this study used frozen fertilized eggs, and the interval between specimen collections at egg retrieval and transfer varied among individual patients. There may also be differences in metabolic mechanisms between natural and IVF cycles, suggesting the need for further analyses in natural cycles. 26
In conclusion, metabolism becomes “quiet” during IVF embryo transfer, and pyruvate metabolism may play a crucial role. Nucleic acid and amino acid metabolism showed inverse correlations with the microbiota in the nonpregnant group, which differed from the pregnant group. The distinct metabolic behaviors of cervicovaginal metabolites in the pregnant and nonpregnant groups suggests that use of cervicovaginal secretions may be a potential diagnostic marker for predicting pregnancy success. We hope that the current analytical method will support the establishment of biomarkers for successful embryo implantation in IVF. 40 , 41 We aim to extract candidate molecules using the approach demonstrated in this study, and in the future, we hope to employ simpler methods, for instance, measuring target molecules with ELISA.
CONFLICT OF INTEREST STATEMENT
The authors declare no conflict of interest.
HUMAN RIGHTS STATEMENT AND INFORMED CONSENT
The Ethical Committee of the Institutional Review Board of Fujita Health University, Aichi, Japan, approved this study in October 2018 (No. 18‐193). All procedures followed were in accordance with the ethical standards of the responsible committee on human experimentation (institutional and national) and with the Helsinki Declaration of 1964 and its later amendments. All recruited women provided written informed consent. The data that support the findings of this study are available on request from the corresponding author. The data are not publicly available due to privacy or ethical restrictions.
ANIMAL STUDIES
This article does not contain any study with animal participants that have been performed by any of the authors.
Supporting information
Figure S1
Figure S2
Figure S3
Table S1
Table S2
Table S3
ACKNOWLEDGMENTS
This work was partly supported by KAKENHI from the Ministry of Education, Culture, Sports, Science and Technology, Japan (Grant no. 23K08812) and a Fujita Health University Research Grant‐in‐Aid. We thank Ms. Yuko Nakagawa, Department of Gynecology, Fujita Health University, for editing the manuscript. We also thank Susan Furness, PhD, from Edanz (https://jp.edanz.com/ac) for editing a draft of this manuscript.
We thank Prof. Takumi Tochio, Department of Medical Research on Prebiotics and Probiotics, Fujita Health University for analyzing bacterial diversity.
Nishio E, Iwata A, Kawasaki R, Iwao K, Nishizawa H, Fujii T. Metabolomic and microbiome analysis of cervicovaginal mucus in in vitro fertilization–embryo transfer: Toward predicting pregnancy success. Reprod Med Biol. 2024;23:e12568. 10.1002/rmb2.12568
Eiji Nishio and Takuma Fujii contributed equally to this work.
REFERENCES
- 1. Katagiri Y, Jwa SC, Kuwahara A, Iwasa T, Ono M, Kato K, et al. Assisted reproductive technology in Japan: a summary report for 2020 by the ethics Committee of the Japan Society of obstetrics and gynecology. Reprod Med Biol. 2023;22(1):e12494. [DOI] [PMC free article] [PubMed] [Google Scholar]
- 2. Idelevich A, Vilella F. Mother and embryo cross‐communication. Genes (Basel). 2020;11(4):376. [DOI] [PMC free article] [PubMed] [Google Scholar]
- 3. Handelman SK, Romero R, Tarca AL, Pacora P, Ingram B, Maymon E, et al. The plasma metabolome of women in early pregnancy differs from that of non‐pregnant women. PLoS One. 2019;14(11):e0224682. [DOI] [PMC free article] [PubMed] [Google Scholar]
- 4. McMillan A, Rulisa S, Sumarah M, Macklaim JM, Renaud J, Bisanz JE, et al. A multi‐platform metabolomics approach identifies highly specific biomarkers of bacterial diversity in the vagina of pregnant and non‐pregnant women. Sci Rep. 2015;5:14174. [DOI] [PMC free article] [PubMed] [Google Scholar]
- 5. Simón C. Endometrial factor testing is a useful tool in clinical infertility management. Reprod Biomed Online. 2022;44(6):953–960. [DOI] [PubMed] [Google Scholar]
- 6. Ichiyama T, Kuroda K, Nagai Y, Urushiyama D, Ohno M, Yamaguchi T, et al. Analysis of vaginal and endometrial microbiota communities in infertile women with a history of repeated implantation failure. Reprod Med Biol. 2021;20(3):334–344. [DOI] [PMC free article] [PubMed] [Google Scholar]
- 7. Tsai HW, Tsui KH, Chiu YC, Wang LC. Adverse effect of lactobacilli‐depauperate cervicovaginal microbiota on pregnancy outcomes in women undergoing frozen‐thawed embryo transfer. Reprod Med Biol. 2023;22(1):e12495. [DOI] [PMC free article] [PubMed] [Google Scholar]
- 8. Gao X, Louwers YV, Laven JSE, Schoenmakers S. Clinical relevance of vaginal and endometrial microbiome investigation in women with repeated implantation failure and recurrent pregnancy loss. Int J Mol Sci. 2024;25(1):622. [DOI] [PMC free article] [PubMed] [Google Scholar]
- 9. Ľupták M, Hroudová J. Important role of mitochondria and the effect of mood stabilizers on mitochondrial function. Physiol Res. 2019;68(Suppl 1):S3–S15. [DOI] [PubMed] [Google Scholar]
- 10. Gardner DK, Lane M, Calderon I, Leeton J. Environment of the preimplantation human embryo in vivo: metabolite analysis of oviduct and uterine fluids and metabolism of cumulus cells. Fertil Steril. 1996;65(2):349–353. [DOI] [PubMed] [Google Scholar]
- 11. Liu Y, Zu L, Cai W, Cheng Q, Hua T, Peng L, et al. Metabolomics revealed decreased level of omega‐3 PUFA‐derived protective eicosanoids in pregnant women with pre‐eclampsia. Clin Exp Pharmacol Physiol. 2019;46(8):705–710. [DOI] [PubMed] [Google Scholar]
- 12. Xia J, Wishart DS. Web‐based inference of biological patterns, functions and pathways from metabolomic data using MetaboAnalyst. Nat Protoc. 2011;6(6):743–760. [DOI] [PubMed] [Google Scholar]
- 13. Tsutsumi R, Yamasaki Y, Takeo J, Miyahara H, Sebe M, Bando M, et al. Long‐chain monounsaturated fatty acids improve endothelial function with altering microbial flora. Transl Res. 2021;237:16–30. [DOI] [PubMed] [Google Scholar]
- 14. MacDonald JA, Takai Y, Ishihara O, Seki H, Woods DC, Tilly JL. Extracellular matrix signaling activates differentiation of adult ovary‐derived oogonial stem cells in a species‐specific manner. Fertil Steril. 2019;111(4):794–805. [DOI] [PMC free article] [PubMed] [Google Scholar]
- 15. Reed AD, Fletcher JR, Huang YY, Thanissery R, Rivera AJ, Parsons RJ, et al. The stickland reaction precursor trans‐4‐hydroxy‐l‐proline differentially impacts the metabolism of Clostridioides difficile and commensal Clostridia . mSphere. 2022;7(2):e0092621. [DOI] [PMC free article] [PubMed] [Google Scholar]
- 16. Backman LR, Huang YY, Andorfer MC, Gold B, Raines RT, Balskus EP, et al. Molecular basis for catabolism of the abundant metabolite trans‐4‐hydroxy‐L‐proline by a microbial glycyl radical enzyme. elife. 2020;9:e51420. [DOI] [PMC free article] [PubMed] [Google Scholar]
- 17. Huang YY, Martínez‐Del Campo A, Balskus EP. Anaerobic 4‐hydroxyproline utilization: discovery of a new glycyl radical enzyme in the human gut microbiome uncovers a widespread microbial metabolic activity. Gut Microbes. 2018;9(5):437–451. [DOI] [PMC free article] [PubMed] [Google Scholar]
- 18. Levy M, Thaiss CA, Zeevi D, Dohnalová L, Zilberman‐Schapira G, Mahdi JA, et al. Microbiota‐modulated metabolites shape the intestinal microenvironment by regulating NLRP6 inflammasome signaling. Cell. 2015;163(6):1428–1443. [DOI] [PMC free article] [PubMed] [Google Scholar]
- 19. Matsumoto M. Prevention of atherosclerosis by the induction of microbial polyamine production in the intestinal lumen. Biol Pharm Bull. 2020;43(2):221–229. [DOI] [PubMed] [Google Scholar]
- 20. Oh Y, Mun S, Choi YB, Jo H, Lee DG, Han K. Genome‐wide pathway exploration of the Epidermidibacterium keratini EPI‐7(T). Microorganisms. 2023;11(4):870. [DOI] [PMC free article] [PubMed] [Google Scholar]
- 21. Gray LR, Tompkins SC, Taylor EB. Regulation of pyruvate metabolism and human disease. Cell Mol Life Sci. 2014;71(14):2577–2604. [DOI] [PMC free article] [PubMed] [Google Scholar]
- 22. Leese HJ, Sturmey RG, Baumann CG, McEvoy TG. Embryo viability and metabolism: obeying the quiet rules. Hum Reprod. 2007;22(12):3047–3050. [DOI] [PubMed] [Google Scholar]
- 23. Leese HJ. Quiet please, do not disturb: a hypothesis of embryo metabolism and viability. BioEssays. 2002;24(9):845–849. [DOI] [PubMed] [Google Scholar]
- 24. Leese HJ, Brison DR, Sturmey RG. The quiet embryo hypothesis: 20 years on. Front Physiol. 2022;13:899485. [DOI] [PMC free article] [PubMed] [Google Scholar]
- 25. de Souza DK, Salles LP, Rosa e Silva AA. Aspects of energetic substrate metabolism of in vitro and in vivo bovine embryos. Braz J Med Biol Res. 2015;48(3):191–197. [DOI] [PMC free article] [PubMed] [Google Scholar]
- 26. Turner K, Martin KL, Woodward BJ, Lenton EA, Leese HJ. Comparison of pyruvate uptake by embryos derived from conception and non‐conception natural cycles. Hum Reprod. 1994;9(12):2362–2366. [DOI] [PubMed] [Google Scholar]
- 27. Conaghan J, Hardy K, Handyside AH, Winston RM, Leese HJ. Selection criteria for human embryo transfer: a comparison of pyruvate uptake and morphology. J Assist Reprod Genet. 1993;10(1):21–30. [DOI] [PubMed] [Google Scholar]
- 28. Calderari S, Daniel N, Mourier E, Richard C, Dahirel M, Lager F, et al. Metabolomic differences in blastocoel and uterine fluids collected in vivo by ultrasound biomicroscopy on rabbit embryos†. Biol Reprod. 2021;104(4):794–805. [DOI] [PubMed] [Google Scholar]
- 29. Zhang Y, Zhang T, Wu L, Li TC, Wang CC, Chung JPW. Metabolomic markers of biological fluid in women with reproductive failure: a systematic review of current literatures. Biol Reprod. 2022;106(6):1049–1058. [DOI] [PubMed] [Google Scholar]
- 30. Karaer A, Doğan B, Günal S, Tuncay G, Arda Düz S, Ünver T, et al. The vaginal microbiota composition of women undergoing assisted reproduction: a prospective cohort study. BJOG. 2021;128(13):2101–2109. [DOI] [PubMed] [Google Scholar]
- 31. Singh H, Brar PS, Honparkhe M, Arora AK, Dhindsa SS. Subclinical endometritis in estrual buffaloes: diagnosis, prevalence and impact on reproductive performance. Trop Anim Health Prod. 2020;52(1):357–363. [DOI] [PubMed] [Google Scholar]
- 32. Mailloux RJ, Bériault R, Lemire J, Singh R, Chénier DR, Hamel RD, et al. The tricarboxylic acid cycle, an ancient metabolic network with a novel twist. PLoS One. 2007;2(8):e690. [DOI] [PMC free article] [PubMed] [Google Scholar]
- 33. Zhang Z, He C, Gao Y, Zhang L, Song Y, Zhu T, et al. α‐Ketoglutarate delays age‐related fertility decline in mammals. Aging Cell. 2021;20(2):e13291. [DOI] [PMC free article] [PubMed] [Google Scholar]
- 34. Srinivasan S, Morgan MT, Fiedler TL, Djukovic D, Hoffman NG, Raftery D, et al. Metabolic signatures of bacterial vaginosis. MBio. 2015;6(2):e00204‐15. [DOI] [PMC free article] [PubMed] [Google Scholar]
- 35. Gao H. Amino acids in reproductive nutrition and health. Adv Exp Med Biol. 2020;1265:111–131. [DOI] [PMC free article] [PubMed] [Google Scholar]
- 36. Łaniewski P, Herbst‐Kralovetz MM. Bacterial vaginosis and health‐associated bacteria modulate the immunometabolic landscape in 3D model of human cervix. NPJ Biofilms Microbiomes. 2021;7(1):88. [DOI] [PMC free article] [PubMed] [Google Scholar]
- 37. Fu M, Zhang X, Liang Y, Lin S, Qian W, Fan S. Alterations in vaginal microbiota and associated metabolome in women with recurrent implantation failure. MBio. 2020;11(3):e03242‐19. [DOI] [PMC free article] [PubMed] [Google Scholar]
- 38. RoyChoudhury S, Singh A, Gupta NJ, Srivastava S, Joshi MV, Chakravarty B, et al. Repeated implantation failure versus repeated implantation success: discrimination at a metabolomic level. Hum Reprod. 2016;31(6):1265–1274. [DOI] [PubMed] [Google Scholar]
- 39. Kermack AJ, Finn‐Sell S, Cheong YC, Brook N, Eckert JJ, Macklon NS, et al. Amino acid composition of human uterine fluid: association with age, lifestyle and gynaecological pathology. Hum Reprod. 2015;30(4):917–924. [DOI] [PMC free article] [PubMed] [Google Scholar]
- 40. Hernández‐Vargas P, Muñoz M, Domínguez F. Identifying biomarkers for predicting successful embryo implantation: applying single to multi‐OMICs to improve reproductive outcomes. Hum Reprod Update. 2020;26(2):264–301. [DOI] [PubMed] [Google Scholar]
- 41. Bracewell‐Milnes T, Saso S, Abdalla H, Nikolau D, Norman‐Taylor J, Johnson M, et al. Metabolomics as a tool to identify biomarkers to predict and improve outcomes in reproductive medicine: a systematic review. Hum Reprod Update. 2017;23(6):723–736. [DOI] [PubMed] [Google Scholar]
Associated Data
This section collects any data citations, data availability statements, or supplementary materials included in this article.
Supplementary Materials
Figure S1
Figure S2
Figure S3
Table S1
Table S2
Table S3