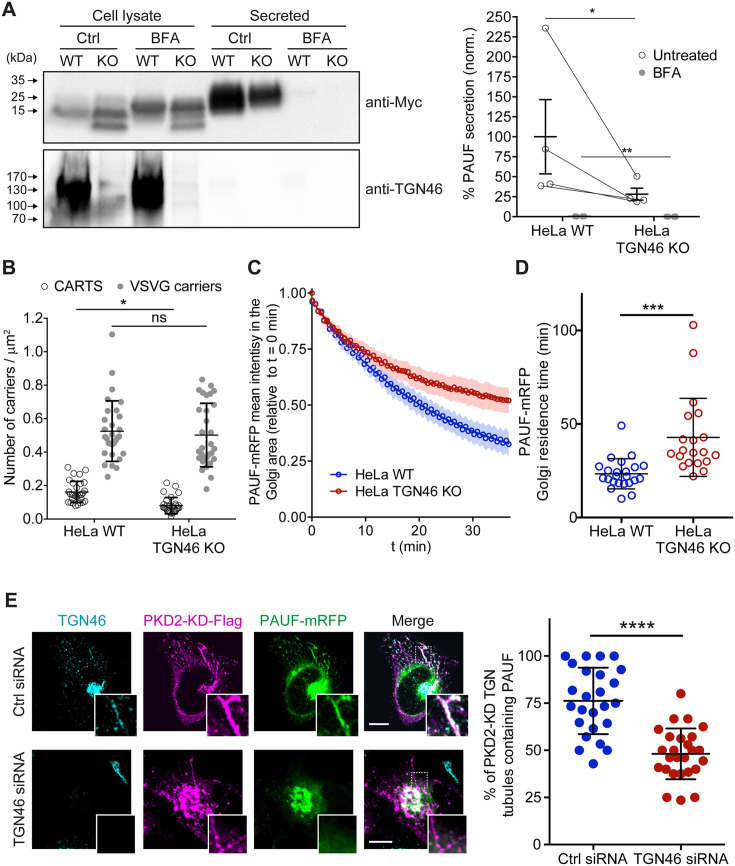
Figure 1. TGN46 is required for cargo sorting and loading into CARTS.
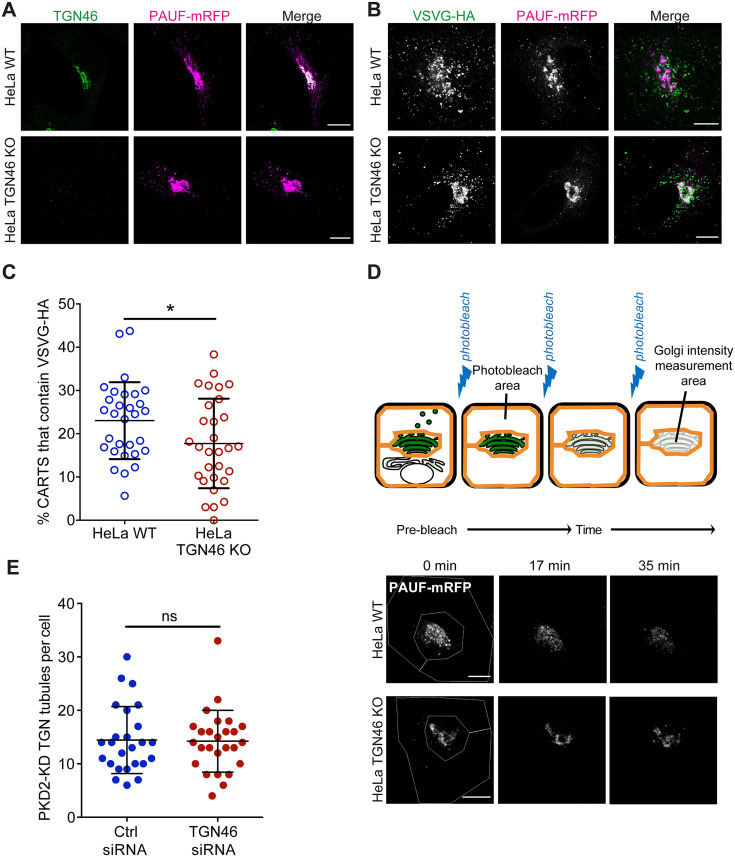
(A) Pancreatic adenocarcinoma upregulated factor (PAUF) secretion assay in parental (WT) and CRISPR/Cas9-mediated TGN46 knockout (KO) HeLa cells. Cells expressing PAUF-MycHis were incubated for 4 hr in fresh medium without serum in the absence (Ctrl) or presence of Brefeldin A (BFA), after which the cells were lysed. Equal amounts of cell lysates and their corresponding secreted fraction (medium) were analyzed by Western blotting (left) using an anti-Myc antibody (top blot) and anti-TGN46 antibody (bottom blot). BFA was included as a positive control of secretion inhibition. Quantification (right) of the ratio of secreted/internal PAUF signal normalized (norm.) as a percentage to the average value of the WT, Ctrl condition. n = 4 independent experiments. Individual values shown with connecting lines between paired datasets (shown only for untreated condition, for clarity), with mean ± stdev. Paired t test (*p ≤ 0.05; **p ≤ 0.01). (B) Number of carriers (CARTS, empty circles; VSVG carriers, gray circles) per unit area observed in WT or TGN46-KO HeLa cells expressing either PAUF-mRFP (CARTS marker) and VSVG-HA (VSVG carrier marker). At least 10 cells from each of n = 3 independent experiments were quantified. Individual values shown, with mean ± stdev. Unpaired two-tailed t test (ns, p > 0.05; *p ≤ 0.05). (C) Relative fluorescence intensity average time trace (mean ± standard error of the mean [s.e.m.]) of fluorescence loss in photobleaching (FLIP) experiments performed in WT or TGN46-KO HeLa cells expressing PAUF-mRFP. (D) Quantification of the PAUF-mRFP Golgi residence time as obtained from the FLIP experiments, as the one shown in (C). Between 7 and 12 cells from each of n = 3 independent experiments were quantified. Individual values shown, with mean ± stdev. Unpaired two-tailed t test (***p ≤ 0.001). (E) Left panels are confocal fluorescence microscopy images of HeLa cells transfected with control (Ctrl) or TGN46 siRNA, which were also transfected with PKD2-KD-Flag and PAUF-mRFP. Cells were fixed at steady state and labeled with anti-TGN46 (cyan) and anti-Flag (magenta) antibodies. PAUF-mRFP fluorescence signal is shown in green. Scale bars are 10 µm, magnifications of the boxed regions are shown. In the right panel, the quantification of the percentage of PKD2-KD-induced tubules that containing PAUF-mRFP in control (Ctrl) or TGN46 siRNA-treated cells. At least 10 cells from each of n = 3 independent experiments. Individual values shown, with mean ± stdev. Unpaired two-tailed t test (****p ≤ 0.0001).


