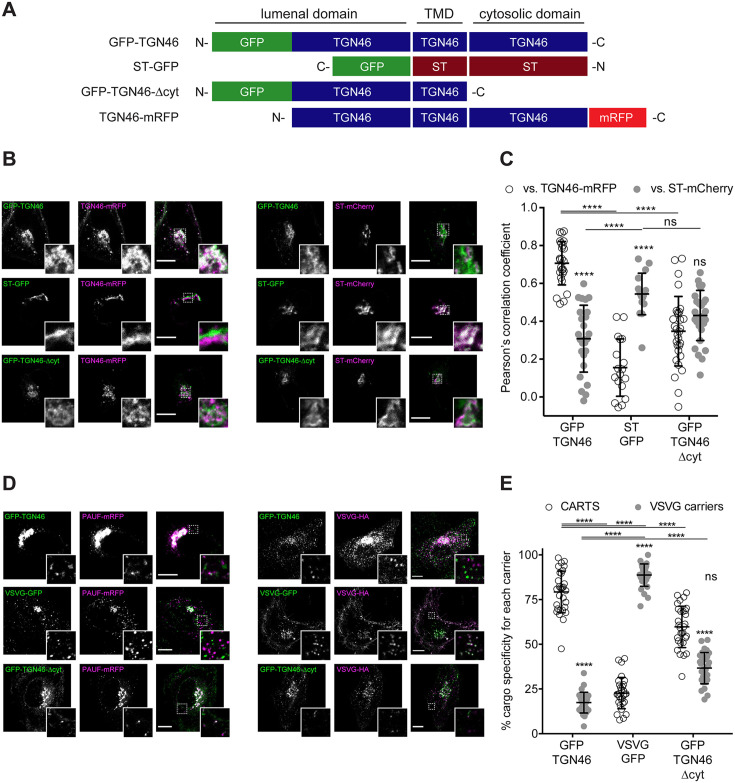
Figure 2. TGN46 export in CARTS is not dependent on cytosolic tail signals.
(A) Schematic representation of construct domain topology. Notice that type-I proteins (e.g., GFP-TGN46) have a lumenal N-terminal domain, whereas type-II proteins (e.g., ST-GFP) have a cytosolic N-terminal domain. TMD: transmembrane domain. (B) HeLa cells co-expressing the different indicated proteins (green and magenta channels) were fixed, and the localization of those proteins was monitored by fluorescence confocal microscopy. Insets correspond to zoom-in areas of the dashed, white boxed areas. (C) Pearson’s correlation coefficient between the perinuclear fluorescence signal of the x-axis indicated proteins with respect to TGN46-mRFP (empty circles) or ST-mCherry (gray circles), measured from confocal micrographs in (B). Results are from at least 10 cells from each of n = 3 independent experiments (individual values shown, with mean ± stdev; ns, p > 0.05; ****p ≤ 0.0001). (D) HeLa cells co-expressing the different indicated proteins (green and magenta channels) were fixed, processed for immunostaining when required, and the localization of those proteins was monitored by fluorescence confocal microscopy. Insets correspond to zoom-in areas of the dashed, white boxed areas. (E) Percentage of transport carriers containing each of the cargoes described on the x-axis that are also positive for pancreatic adenocarcinoma upregulated factor (PAUF; CARTS, empty circles) or VSVG (VSVG carriers, gray circles), as measured from confocal micrographs in (D). Results are from at least 10 cells from each of n = 3 independent experiments (individual values shown, with mean ± stdev; ns, p > 0.05; ****p ≤ 0.0001). Scale bars in (B, D) are 10 µm.

