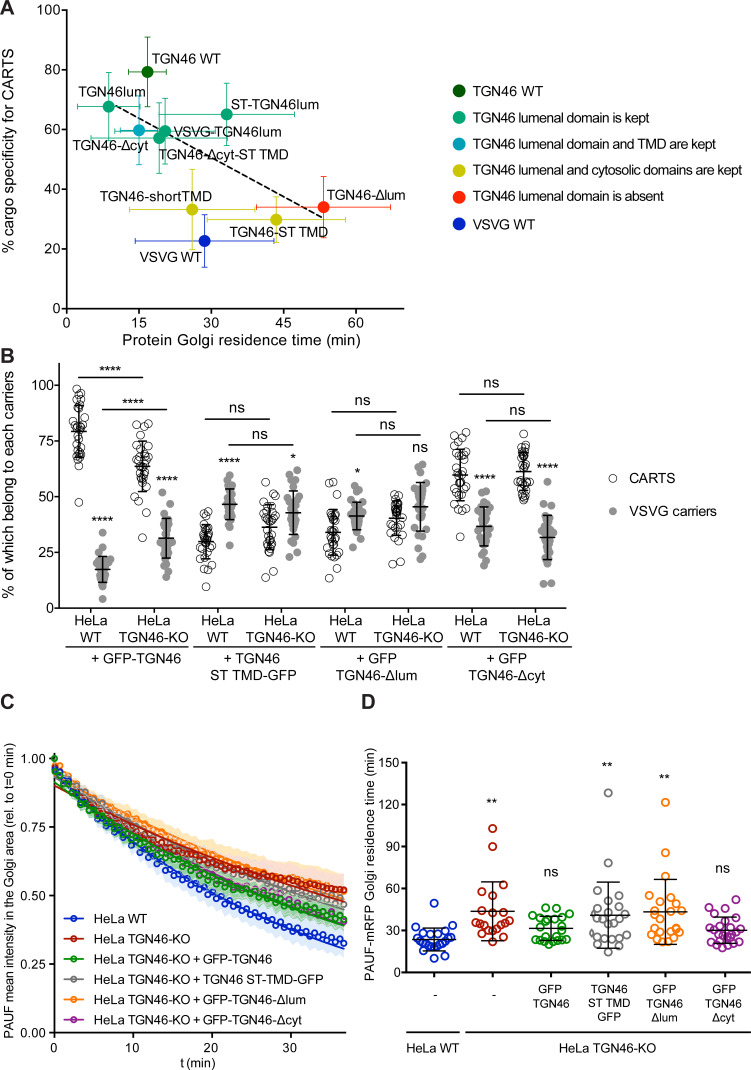
Figure 7. The cargo sorting function of TGN46 is mediated by its lumenal domain.
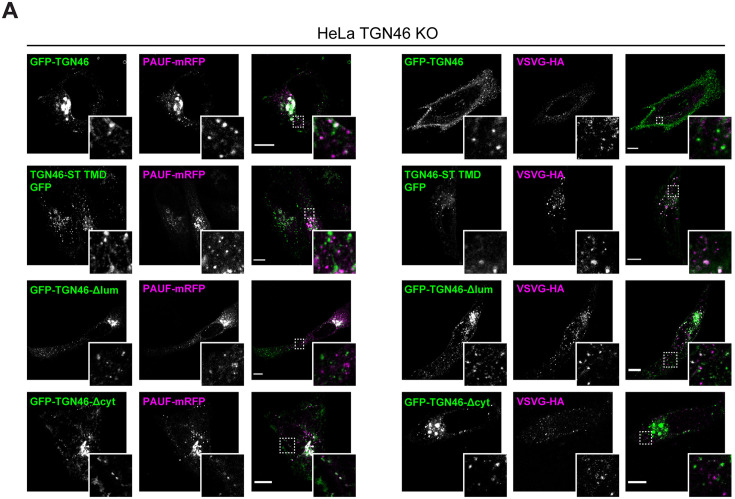
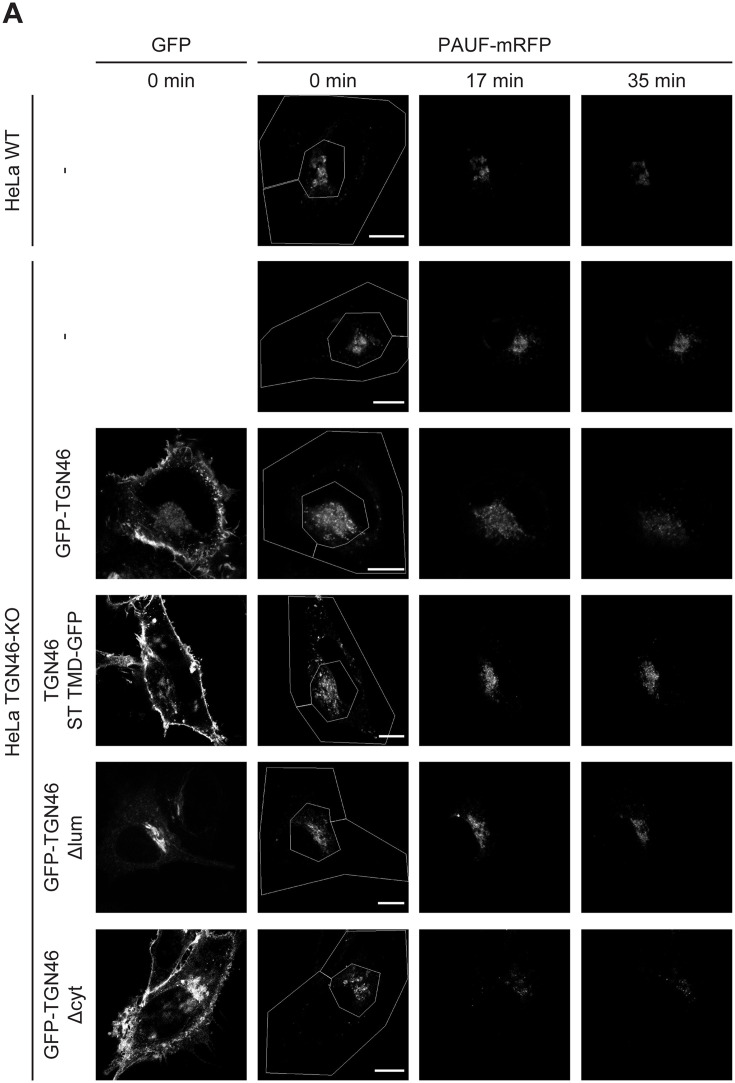
(A) CARTS specificity of cargo proteins correlates with their Golgi export rate. Plot of the percentage of cargo-positive vesicles that are also positive for pancreatic adenocarcinoma upregulated factor (PAUF; CARTS marker) as a function of the Golgi residence time as measured from fluorescence loss in photobleaching (FLIP) experiments, for the different indicated cargo proteins (color coding explained in the legend on the right). Dashed black line represents a linear fit of the data points (shown as mean ± standard error of the mean [s.e.m.]), where the slope is statistically different from zero (extra sum-of-squares F test, p-value = 0.04). (B) Percentage of transport carriers containing each of the cargoes described on the x-axis that are also positive for PAUF (CARTS, empty circles) or VSVG (VSVG carriers, gray circles), as measured from confocal micrographs of HeLa cells (either WT or TGN46-KO cell lines) expressing the indicated proteins. Results are at least 10 cells from each of n = 3 independent experiment (individual values shown, with mean ± stdev; ns, p > 0.05; *p ≤ 0.05; ****p ≤ 0.0001). (C) Relative fluorescence intensity average time trace (mean ± s.e.m.) of FLIP experiments for the indicated proteins expressed in HeLa WT or HeLa TGN46-KO cells, as detailed in the legend. Symbols correspond to actual measurements, solid lines to the fitted exponential decays. (D) Residence time of PAUF-mRFP in the perinuclear area of HeLa cells (WT or KO), expressing the different proteins as labeled in the x-axis, and measured as the half time of the FLIP curves. Results are from 7 to 12 cells from each of n = 3 independent experiments (individual values shown, with mean ± stdev; ns, p > 0.05; **p ≤ 0.01).


