

This cohort study examines data from 2 prospective multiple sclerosis cohorts to identify cerebrospinal fluid measures associated with relapsing and nonrelapsing progressive multiple sclerosis pathobiology.
Key Points
Question
What cerebrospinal fluid (CSF) measures are associated with relapsing vs nonrelapsing progressive multiple sclerosis (MS) disease biology?
Findings
This cohort study found that elevated glial fibrillary acid protein (GFAP) and neurofilament heavy chain were associated with nonrelapsing progression and lymphocyte measures were associated with relapsing biology in patients with both relapsing and primary progressive clinical phenotypes. Elevated neurofilament light chain reflected both processes.
Meaning
Activated glial measures, and GFAP in particular, may be CSF biomarkers of nonrelapsing progressive MS biology and demonstrate the commonalities of relapsing and nonrelapsing progressive disease mechanisms across the MS clinical spectrum.
Abstract
Importance
Biomarkers distinguishing nonrelapsing progressive disease biology from relapsing biology in multiple sclerosis (MS) are lacking. Cerebrospinal fluid (CSF) is an accessible fluid that most closely reflects central nervous system biology.
Objective
To identify CSF biological measures associated with progressive MS pathobiology.
Design, Setting, and Participants
This cohort study assessed data from 2 prospective MS cohorts: a test cohort provided serial CSF, clinical, and imaging assessments in a multicenter study of patients with relapsing MS (RMS) or primary progressive MS (PPMS) who were initiating anti-CD20 treatment (recruitment: 2016-2018; analysis: 2020-2023). A single-site confirmation cohort was used to assess CSF at baseline and long-term (>10 year) clinical follow-up (analysis: 2022-2023).
Exposures
Test-cohort participants initiated standard-of-care ocrelizumab treatment. Confirmation-cohort participants were untreated or received standard-of-care disease-modifying MS therapies.
Main Outcomes and Measures
Twenty-five CSF markers, including neurofilament light chain, neurofilament heavy chain, and glial fibrillary acid protein (GFAP); 24-week confirmed disability progression (CDP24); and brain magnetic resonance imaging measures reflecting focal injury, tissue loss, and progressive biology (slowly expanding lesions [SELs]).
Results
The test cohort (n = 131) included 100 patients with RMS (mean [SD] age, 36.6 [10.4] years; 68 [68%] female and 32 [32%] male; Expanded Disability Status Scale [EDSS] score, 0-5.5), and 31 patients with PPMS (mean [SD] age, 44.9 [7.4] years; 15 [48%] female and 16 [52%] male; EDSS score, 3.0-6.5). The confirmation cohort (n = 68) included 41 patients with RMS and 27 with PPMS enrolled at diagnosis (age, 40 years [range, 20-61 years]; 47 [69%] female and 21 [31%] male). In the test cohort, GFAP was correlated with SEL count (r = 0.33), greater proportion of T2 lesion volume from SELs (r = 0.24), and lower T1-weighted intensity within SELs (r = –0.33) but not with acute inflammatory measures. Neurofilament heavy chain was correlated with SEL count (r = 0.25) and lower T1-weighted intensity within SELs (r = –0.28). Immune markers correlated with measures of acute inflammation and, unlike GFAP, were impacted by anti-CD20. In the confirmation cohort, higher baseline CSF GFAP levels were associated with long-term CDP24 (hazard ratio, 2.1; 95% CI, 1.3-3.4; P = .002).
Conclusions and Relevance
In this study, activated glial markers (in particular GFAP) and neurofilament heavy chain were associated specifically with nonrelapsing progressive disease outcomes (independent of acute inflammatory activity). Elevated CSF GFAP was associated with long-term MS disease progression.
Introduction
Identifying biological markers that reflect risk for disease progression in multiple sclerosis (MS) remains an unmet need. Relapsing MS biology is driven by the activation and migration of peripheral immune cells into the central nervous system (CNS), leading to perivascular inflammatory (ie, T1-weighted, gadolinium-enhanced [T1w/Gd+]) lesions with or without clinically evident relapses.1,2,3 In contrast, nonrelapsing progressive MS biology relates to insidious injury from neurodegeneration and/or smoldering CNS compartmentalized inflammation.4 Progressive biology mechanisms appear active throughout the disease continuum, including subclinically in early MS.5,6,7,8,9,10,11,12,13 Slowly expanding lesions (SELs) may represent a subset of chronic active lesions that are thought to contribute to nonrelapsing progressive biology.14,15 Molecular phenotyping of chronic active lesions has implicated glial cells interacting with activated immune cells in smoldering CNS damage.3,16,17
Disentangling the contributions of acute focal inflammation from progressive biology in MS has been challenging. Here, we aimed to identify and distinguish markers of nonrelapsing progressive biology from markers of acute inflammatory relapse biology in cerebrospinal fluid (CSF) from patients with MS, which represents the closest accessible compartment to CNS tissue. For a test cohort, we leveraged the anti-CD20 Ocrelizumab Biomarker Outcome Evaluation (OBOE) study18 in which patients with MS underwent pretreatment and posttreatment serial CSF and blood sampling in addition to structured clinical and brain magnetic resonance imaging (MRI) outcome assessments of relapsing and progressive disease. An attractive feature of this test cohort is the a priori knowledge that ocrelizumab robustly affects relapsing biology-related outcomes while more modestly affecting progressive outcomes, such that differential treatment effects on candidate biomarkers could provide a unique opportunity to distinguish measures that reflect nonrelapsing progressive biology. The test dataset implicated activated glial markers and, in particular, elevated levels of glial fibrillary acidic protein (GFAP) in nonrelapsing progressive disease, an observation that was reinforced in an independent real-world confirmation cohort.
Methods
The test dataset was derived from the multiarm, multicenter, clinical OBOE study, which assessed serial CSF and blood fluid phase and cellular measures in patients with relapsing MS (RMS) or primary progressive MS (PPMS) who initiated open-label treatment with the approved anti-CD20 B-cell–depleting therapy ocrelizumab.18 Study sites received local institutional review board approval, and written informed consent was obtained per International Council for Harmonisation E6 Guidelines for Good Clinical Practice and principles of the Declaration of Helsinki.
Patients with RMS or PPMS were diagnosed using 2010 revised McDonald criteria (inclusion/exclusion criteria in the eMethods in Supplement 1).19 Patients with RMS underwent baseline lumbar puncture (LP) prior to ocrelizumab initiation (eFigure 1 in Supplement 1) and were then randomized based on history of disease-modifying therapy into 3 arms designating the timing of their second LP (week 12, week 24, or week 52) to allow longitudinal collection while limiting the burden to 2 LPs per participant. A separate comparator arm of patients with RMS received 2 LPs 12 weeks before and immediately before ocrelizumab initiation to assess for biological regression to the mean without treatment. After the pretreatment LPs, the comparator arm received ocrelizumab as per the other RMS arms. Patients with PPMS underwent LPs at baseline and week 52. Ocrelizumab was administered as described.20,21 Participants underwent neurological examinations, blood sampling, and Expanded Disability Status Scale (EDSS) assessment at screening, baseline, and weeks 12, 24, 48, and 52. SEL determination was performed using brain MRI from baseline compared with week 52 as described (eMethods in Supplement 1).15
In addition to the study’s formal primary end points (changes from treatment baseline in CSF neurofilament light chain [NfL] levels, CD19+ B-cell numbers, and CD3+ T-cell numbers), 25 CSF markers reflecting lymphocytes, microglia, astrocytes, cytokines, chemokines, and neuroaxonal injury were measured (Table and eTable 1 in Supplement 1).22,23,24,25,26,27,28,29,30,31 Qualified assays were used to assess levels of NfL (Quanterix Simoa), neurofilament heavy chain (NfH; Protein Simple), GFAP (Protein Simple), and other analytes (eMethods in Supplement 1). Levels of NfL, NfH, and GFAP were subsequently also measured in serum (eTable 1 in Supplement 1).
Table. Baseline Cerebrospinal Fluid Biological Measures in the Test Cohorta.
| Measure | All patients | Patients without Gd+ lesions at baseline and without relapse in prior 3 mo | Model adjusted for age, BMI, RMS, and PPMS (n = 131) | |||||
|---|---|---|---|---|---|---|---|---|
| Median (IQR) | P value | Median (IQR) | P value | Coefficient for PPMS vs RMS | P value | |||
| RMS (n = 100) | PPMS (n = 31) | RMS (n = 45) | PPMS (n = 24) | |||||
| Lymphocyte markers | ||||||||
| CD19+ B-cell count, cells/μL | 0.056 (0.01-0.13) | 0.077 (0.01-0.10) | .90 | 0.04 (0.01-0.11) | 0.09 (0.01-0.19) | .51 | −0.006 | .93 |
| CD3+ T-cell count, cells/μL | 2.19 (0.94-4.40) | 3.46 (1.29-7.04) | .18 | 1.81 (0.94-3.89) | 3.45 (1.22-7.69) | .22 | 1.37 | .33 |
| sTACI, pg/mL | 39.2 (21.1-84.0) | 92.8 (31.9-130.0) | .008b | 36.3 (14.9-72.3) | 85.0 (30.0-119.0) | .01b | −22.1 | .71 |
| sCD27, pg/mL | 891 (443-1755) | 1723 (894-2064) | .02b | 668 (392-1562) | 1676 (894-1966) | .008b | 10.7 | .98 |
| sBCMA, pg/mL | 717 (492-1159) | 1168 (809-1481) | .01b | 713 (438-1046) | 1160 (809-1301) | .02 | 28.2 | .93 |
| Cytokines and chemokines, pg/mL | ||||||||
| IL-6 | 1.70 (1.25-2.40) | 1.70 (1.30-2.10) | .77 | 1.7 (1.25-2.30) | 1.55 (1.3-2.0) | .73 | −0.582 | .79 |
| CXCL10 | 187 (107-344) | 288 (198-432) | .02b | 179 (100-282) | 279 (173-389) | .02b | 103.9 | .26 |
| CXCL12 | 598 (465-832) | 1045 (853-1297) | <.001b | 598 (499-819) | 1025 (868-1246) | <.001b | 493.6 | <.001 |
| CXCL13 | 9.68 (3.91-27.4) | 3.91 (3.91-9.66) | .02b | 3.91 (3.91-16.2) | 3.91 (3.91-8.62) | .11 | −3.20 | .70 |
| CCL19 | 47.0 (31.7-67.5) | 58.9 (36.4-68.2) | .35 | 48.0 (32.3-64.0) | 58.9 (36.4-68.2) | .35 | −0.498 | .37 |
| Neuroaxonal injury, pg/mL | ||||||||
| NfL | 1244 (701.5-2564) | 741.0 (606.9-1166) | .01b | 994 (545-1364) | 711 (581.6-983.9) | .22 | −600.7 | .26 |
| NfH | 637 (430-896) | 621 (489-913) | .80 | 581 (411-805) | 621 (508-885) | .35 | −16.2 | .89 |
| Microglial activity, sTREM2, ng/mL | 7.72 (6.54-9.19) | 8.81 (7.78-10.92) | .03b | 7.23 (6.37-9.11) | 8.84 (8.43-11.1) | .008b | 0.931 | .15 |
| Innate inflammation and astrocyte activation | ||||||||
| LCN2, pg/mL | 803 (482-1038) | 1359 (1115-1932) | <.001b | 693 (479-990) | 1432 (1115-1932) | <.001b | 804.0 | <.001 |
| YKL-40, ng/mL | 148 (113-194) | 172 (135-257) | .08 | 140 (116-191) | 179 (135-248) | .06 | 37.9 | .29 |
| GFAP, pg/mL | 665 (515-964) | 1269 (942-1578) | <.001b | 665 (484-998) | 1256 (966-1525) | <.001b | 636.0 | <.001 |
Abbreviations: BMI, body mass index; CCL19, chemokine C-C motif chemokine 19; CXCL10, C-X-C motif chemokine 10; CXCL12, C-X-C motif chemokine 12; CXCL13, C-X-C motif chemokine 13; Gd+, gadolinium enhancing; GFAP, glial fibrillary acidic protein; IL-6, interleukin 6; LCN2, lipocalin 2; NfH, neurofilament heavy chain; NfL, neurofilament light chain; PPMS, primary progressive multiple sclerosis; RMS, relapsing multiple sclerosis; sBCMA, soluble B-cell maturation antigen; sCD27, soluble CD27; sTACI, soluble transmembrane activator and CAML interactor; sTREM2, soluble triggering receptor expressed on myeloid cells 2; YKL-40, chitinase-3-like protein 1.
Levels of baseline cerebrospinal fluid biological measures within the test-cohort RMS and PPMS subgroups; P values reported from Kruskal-Wallis analysis of variance test and unadjusted.
Comparisons with false discovery rate correction.
Correlations between baseline CSF protein levels with clinical and MRI metrics were assessed. A public single-nucleus RNA sequencing (snRNA-seq) dataset of MS brain tissue32 was analyzed to infer cell and regional specificities of the candidate biomarkers implicated in the test cohort. Proteomic analysis of the same CSF samples using a data-independent acquisition mass spectrometry (DIA-MS)–based approach (eMethods in Supplement 1) was performed for internal validation of the test-cohort observations. As a focused independent external confirmation of the test-cohort finding relating to CSF GFAP, we used a collection of cryopreserved paired serum-CSF samples obtained from an external cohort of patients with RMS and PPMS to assess the association between GFAP levels (Quanterix Simoa) and long-term prospectively ascertained 24-week confirmed disability progression (CDP24).
Statistical Analysis
Within each arm of the test cohort, changes in levels of CSF biomarkers between the first and second LP were summarized using median values, and the associated P value was computed using the Wilcoxon signed rank test. Correlations between baseline CSF biological measures and MRI or clinical measures were calculated using Spearman rank correlation in the separate RMS and PPMS subgroups and in the entire test cohort. For key measures, linear-regression analysis adjusting for age, sex, and body mass index (BMI) was performed to confirm Spearman correlations. The Kruskal-Wallis analysis-of-variance test was used to compare baseline distributions of CSF measures between the RMS and PPMS subgroups. Adjusted P values were computed using Benjamini-Hochberg false discovery rate (FDR) with a threshold of .05. All statistical tests were 2-sided. Analyses were performed in R version 3.6.3 (R Foundation). Internal validation of the test-cohort baseline CSF glial-measure associations was performed by assessing Spearman rank correlation between DIA-MS protein levels and SEL metrics (FDR threshold .05).
Confirmation of the test-cohort findings related to CSF GFAP was performed with the confirmation cohort using a log-rank test to examine subgroups defined by median GFAP levels and using Cox proportional hazards regression to examine GFAP as a dichotomous (stratified by median) or continuous (log-GFAP) variable adjusted for age, sex, and treatment for association with CDP24.
Results
Association of CSF Biological Measures With MRI and Clinical Parameters
The test cohort comprised all participants in the OBOE study (Figure 1 and eFigure 1 in Supplement 1) who qualified for the intention-to-treat analysis (individuals receiving ≥1 ocrelizumab dose) and included 100 patients with RMS (mean [SD] age, 36.6 [10.4] years; 68 [68%] female and 32 [32%] male) and 31 with PPMS (mean [SD] age, 44.9 [7.4] years; 15 [48%] female and 16 [52%] male) (eTable 2 in Supplement 1).
Figure 1. Profile of Study of Test Cohort.

IRB indicates institutional review board; PPMS, primary progressive multiple sclerosis; RMS, relapsing multiple sclerosis.
We first compared levels of candidate biomarkers in baseline (pretreatment) CSF samples from patients with RMS and PPMS (Table). Median (IQR) CSF B-cell levels (0.056/μL [0.01-0.13] vs 0.077/μL [0.01-0.10] cells/μL) and T-cell levels (2.19/μL [0.94-4.40] vs 3.46/μL [1.29-7.04]) were similar in the RMS vs PPMS subgroups, respectively. Patients with RMS exhibited elevated CSF NfL and C-X-C motif chemokine 13 (CXCL13) levels vs PPMS. Comparisons focusing on only patients without acute disease activity at baseline (no T1w/Gd+ lesions or relapses within prior 3 months) in the RMS (n = 45) and PPMS (n = 24) subgroups no longer showed significant differences, suggesting that NfL and CXCL13 elevations were driven by acute disease activity.
Patients with PPMS had significantly elevated baseline levels of soluble transmembrane activator and CAML interactor (sTACI), soluble CD27 (sCD27), soluble B-cell maturation antigen (sBCMA), CXCL10, CXCL12, soluble triggering receptor expressed on myeloid cells 2 (sTREM2), lipocalin 2 (LCN2), and GFAP and a trend toward greater chitinase-3-like protein 1 (YKL-40) levels vs RMS (Table). Values for sTACI, sCD27, sBCMA, CXCL10, CXCL12, sTREM2, LCN2, and GFAP remained significantly elevated in patients with PPMS vs RMS without acute disease activity at baseline, indicating that these markers may be independent of acute inflammatory activity. Following adjustment for age and BMI, CXCL12, LCN2, and GFAP remained significantly elevated in patients with PPMS vs RMS.
We next assessed the association between candidate biomarkers and imaging measures at baseline (Figure 2). CSF measures reflecting T-cell and B-cell activity (sCD27, sTACI), plasmablasts and plasma cells (sBCMA), and chemokines (CXCL10, CXCL13) were correlated with greater T1w/Gd+ lesions. Higher CSF NfL level was associated with more T1w/Gd+ lesions (r = 0.49) and less time from last relapse (r = −0.25).25 In the RMS subgroup, CSF CD19+ B cells and CD3+ T cells were associated with greater Gd+ lesions (eFigure 2A in Supplement 1). Naive B cells (IgD+CD27−CD19+, r = 0.28), transitional naive B cells (CD38+IgD+CD27−CD19+, r = 0.24), and switched memory B cells (CD138−CD38−IgD−CD27+CD19+, r = 0.23) were all associated with T2-weighted lesion volume (T2LV) (eFigure 3B in Supplement 1). Associations in the entire test cohort (Figure 2) largely reflected associations in the RMS subgroup (eFigure 2A in Supplement 1); some but not all associations were observed in the PPMS subgroup, possibly because of limited sample size (eFigure 2B in Supplement 1). Overall, these findings support that CNS B cells and T cells play a key role in mechanisms underlying the acute inflammatory activity and injury related to MS relapses.
Figure 2. Correlations Between Baseline Cerebrospinal Fluid (CSF) Biological, Magnetic Resonance Imaging (MRI), and Clinical Measures in the Combined Relapsing Multiple Sclerosis (RMS) and Primary Progressive Multiple Sclerosis (PPMS) Test Cohort.
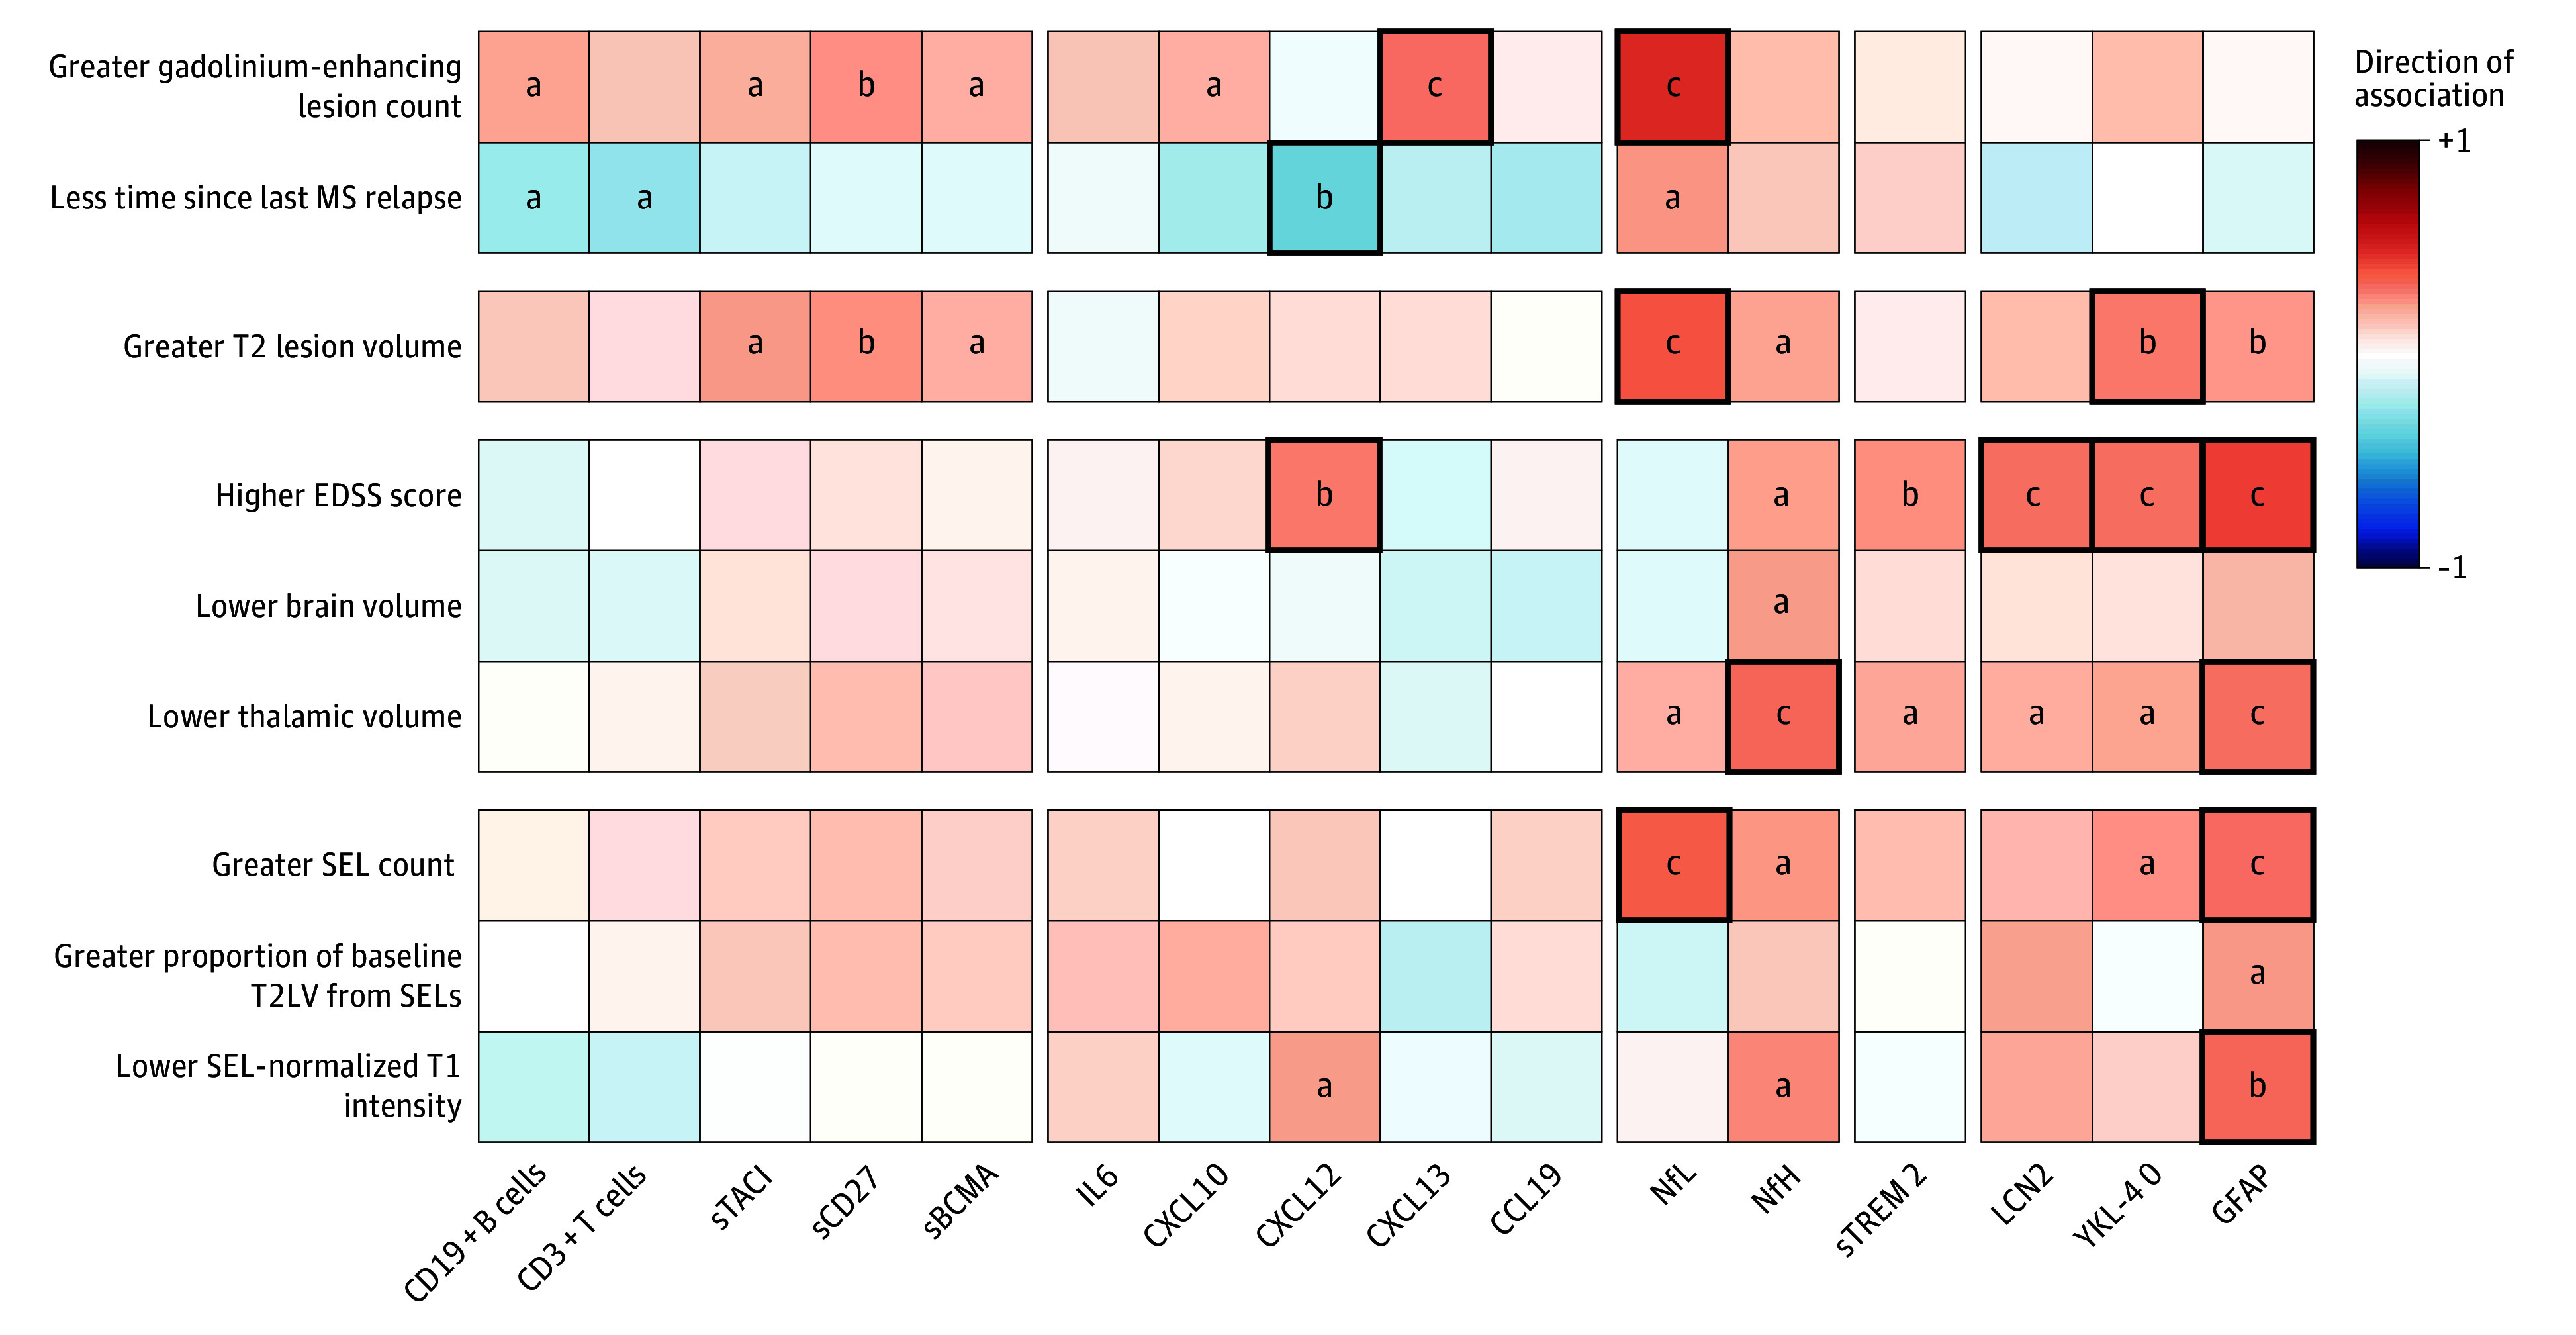
Spearman correlations between baseline biological measures and baseline MRI and clinical measures in the test cohort (combined RMS and PPMS subgroups). Less time since last MS relapse parameter only includes RMS cohorts. Red and blue shading represents positive and negative Spearman correlation, respectively (<.05). Bold squares denote significant Spearman correlations corrected for false discovery rate. CCL19 indicates chemokine C-C motif chemokine 19; CXCL10, C-X-C motif chemokine 10; CXCL12, C-X-C motif chemokine 12; CXCL13, C-X-C motif chemokine 13; EDSS, Expanded Disability Status Scale; Gd+, gadolinium enhancing; GFAP, glial fibrillary acidic protein; IL6, interleukin 6; LCN2, lipocalin 2; NfH, neurofilament heavy chain; NfL, neurofilament light chain; sBCMA, soluble B-cell maturation antigen; sCD27, soluble CD27; SEL, slowly expanding lesion; sTACI, soluble transmembrane activator and CAML interactor; sTREM2, soluble triggering receptor expressed on myeloid cells 2; T2LV, T2 lesion volume; YKL-40, chitinase-3-like protein 1.
aP < .05.
bP < .01.
cP < .001.
Despite their strong association with acute disease activity, CSF measures of lymphocytes and related cytokines/chemokines were not associated with MS disease burden (T2LV) or severity (EDSS score), except for CXCL12 levels that were correlated with EDSS scores (r = 0.30, P = .001). In contrast, CSF measures of neuroaxonal injury (NfL, NfH) and astrocyte activity (YKL-40, GFAP) were associated with MS lesion burden (T2LV) (r = 0.40, r = 0.22, r = 0.29, and r = 0.25, respectively) (Figure 2). Levels of NfH, the microglia marker sTREM2, and astrocyte activity markers LCN2, YKL-40, and GFAP showed consistent associations with overall disease burden (higher EDSS score [r = 0.23, r = 0.26, r = 0.32, r = 0.32, r = 0.44, respectively] and lower thalamic volume [r = −0.34, r = −0.21, r = −0.20, r = −0.22, r = −0.32, respectively]) (Figure 2). CSF measures of glial biology (sTREM2, LCN2, and GFAP) were also elevated in patients with PPMS, supporting the concept that CNS glial activity plays a role in progressive disease biology.
CSF Astroglial Markers Implicated in Progressive MS Biology
Baseline CSF measures reflecting neuroaxonal injury (NfL [r = 0.37, P < .001], NfH [r = 0.25, P = .01]) or glial activity (YKL-40 [r = 0.26, P = .01], GFAP [r = 0.33, P < .001]) were associated with greater numbers of SELs identified at week 52 (Figure 2). Elevated GFAP levels were correlated with a greater proportion of T2LV from SELs (r = 0.24) and lower T1w intensity within SELs (r = −0.33), and elevated NfH levels were correlated with lower T1w intensity within SELs (r = −0.28). In contrast, markers associated with lymphocyte biology or microglial activity were not associated with SELs. Sensitivity analysis confirmed key CSF biomarkers NfL, NfH, and GFAP, with GFAP remaining associated with more lesions subsequently identified as SELs after adjustments for age, sex, BMI, and T2LV (eTables 3 and 4 in Supplement 1). Baseline levels of CSF biomarkers in the overall test cohort did not significantly differ between individuals with or without week 52 CDP24 (eTable 5 in Supplement 1), possibly limited by the follow-up duration and low proportion of individuals with CDP24.
We next leveraged a public snRNA-seq dataset of lesional and nonlesional MS brain tissue32 to assess which CNS cells express the CSF proteins associated with SELs in our dataset. After classifying cell types, GFAP and YKL-40 were found to be expressed by a greater proportion of astrocytes from chronic active MS lesions compared with inactive lesions or control white matter (eFigure 4A in Supplement 1). sTREM2, which in the test dataset was correlated with EDSS score and reduced thalamic volume (Figure 2), was expressed by microglia but was not specific to microglia at the lesional rim (eFigure 4B in Supplement 1).
To complement the candidate-biomarker approach, and as an internal validation of the observation that elevated CSF markers of astroglial activity and neuroaxonal injury may reflect underlying progressive MS biology, we performed an unbiased proteomic analysis of the same CSF samples using DIA-MS to assess which proteins would be most strongly associated with SELs. With this orthogonal approach, we quantified the relative abundance of CSF proteins across 245 samples obtained from 131 patients with MS. While GFAP could not be successfully measured using the DIA-MS method, baseline levels of 5 CSF proteins were significantly correlated with the total volume of lesions subsequently identified as SELs (FDR <.05): CHIT1 (R = 0.36), YKL-40 (R = 0.34), B2M (R = 0.4), CD44 (R = 0.38), and SERPINA3 (R = 0.36) (eTable 6 in Supplement 1). Among 3 of these proteins that could be mapped onto the public MS snRNA-seq dataset meeting criteria for inferred cell specificity, YKL-40 and CD44 were enriched in astrocyte populations. While SERPINA3 could not be mapped onto the MS snRNA-seq dataset, it is known to be primarily expressed by astrocytes in the brain,33 and CSF levels of SERPINA3 have been reportedly elevated in progressive MS.34
Association Between Anti-CD20 Treatment and Blood and CSF Measures
Ocrelizumab treatment was associated with reduced circulating B-cell counts (eFigure 5 in Supplement 1) and imaging measures of acute focal inflammation (eFigure 6 in Supplement 1), in keeping with previous clinical trials.20,21 Few patients (5 with RMS [5%] and 3 with PPMS [9.7%]) experienced CDP24 over 52 weeks (eTable 7 in Supplement 1). Given the known robust effect of ocrelizumab treatment on relapsing biology and more modest effect on progression in MS, we hypothesized that ocrelizumab treatment would result in substantial reductions in CSF measures of acute inflammation while having a lesser impact on the glial markers that we associated with SEL measures. Serial CSF analyses in patients with RMS indicated that NfL and B-cell levels (which were correlated with measures of acute inflammation) were lowered after treatment (NfL: week 12, −25.2%; week 24, −39.1%; week 52, −54.7%; CD19+ B cells: week 12, −87.5%; week 24, −85.4%; week 52, −94.0%) (Figure 3A and B and eTable 8 in Supplement 1). CSF CD3+ T-cell levels (which were also correlated with acute inflammation) were also partially reduced in patients with RMS (week 12, −69.3%; week 24, −57.8%; week 52, −57.6%) (Figure 3C). In patients with PPMS, a significant reduction in CSF CD19+ B cells (−94.3%) and CD3+ T cells (−67.6%), and a CSF NfL reduction (−24.5%) were observed at week 52.
Figure 3. Association of Ocrelizumab Treatment With Individual Patient Changes From Baseline in Primary and Exploratory Cerebrospinal Fluid (CSF) Biological Measure End Points in the Test Cohort During the 1-Year Treatment Period.
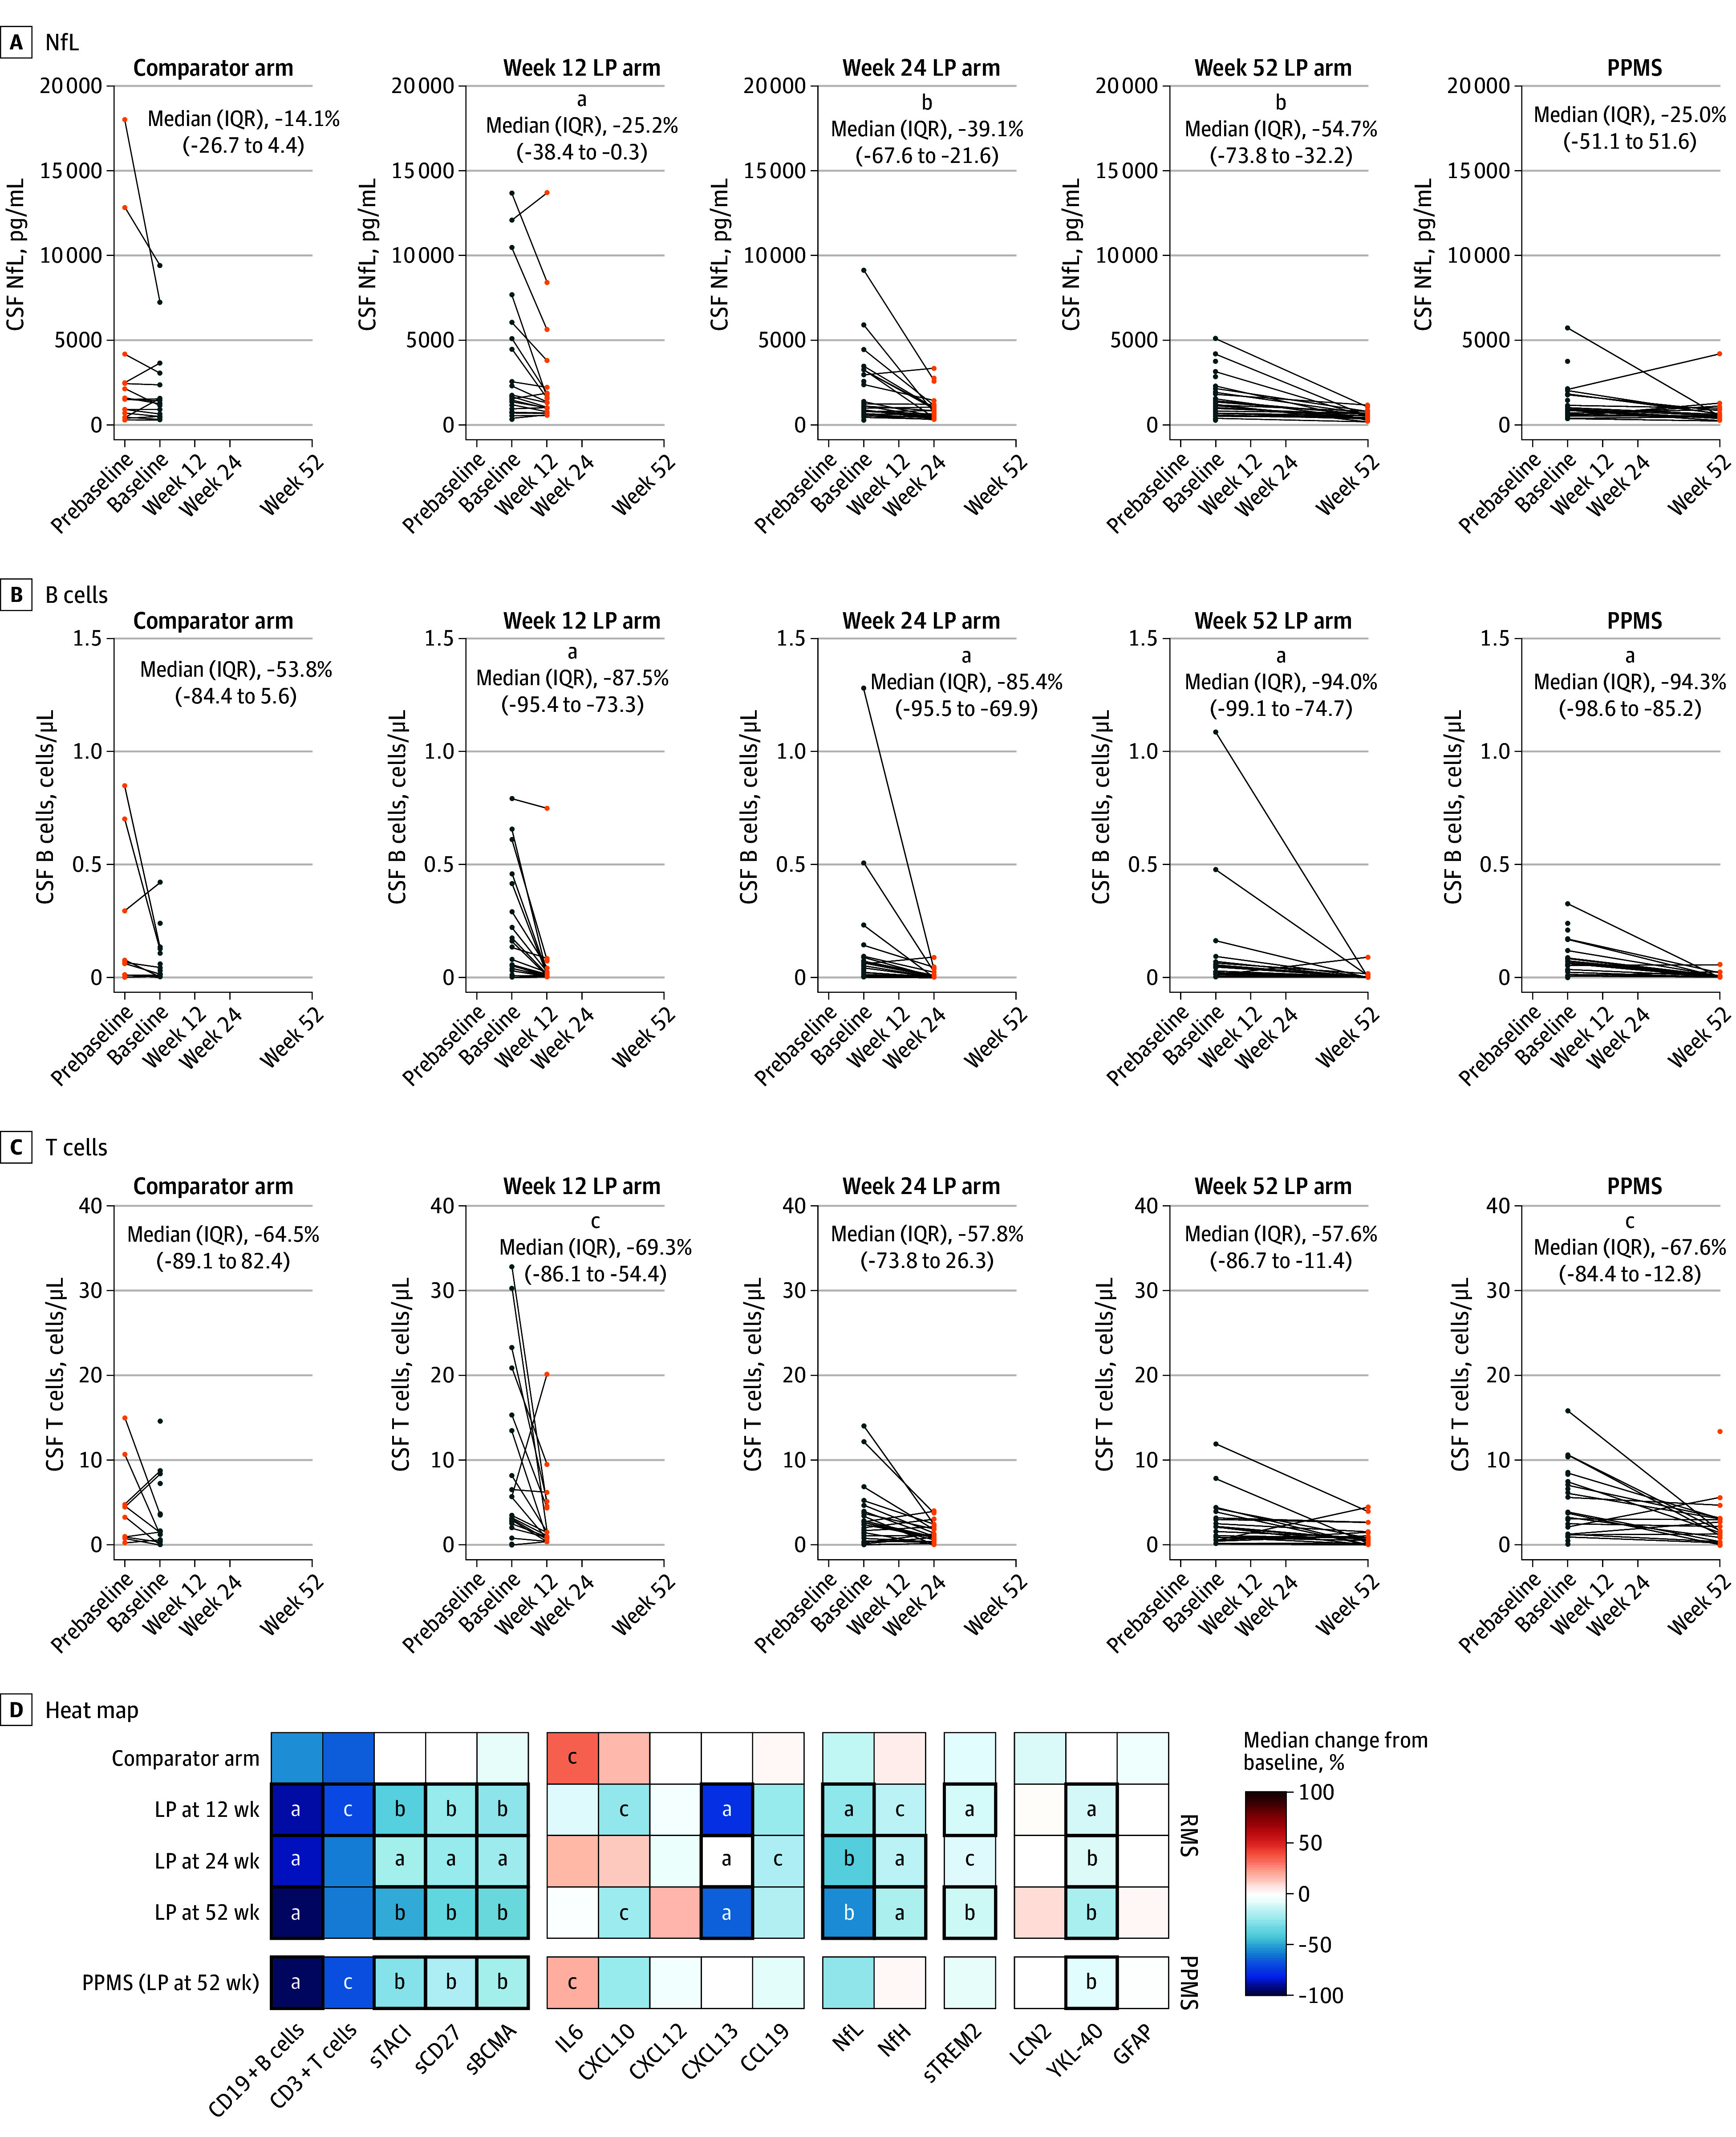
A, B, and C, The 4 left graphs are the relapsing multiple sclerosis subgroup; the far right graph is the primary progressive multiple sclerosis (PPMS) subgroup. D, Red and blue shading represents increase and decrease, respectively. Bold squares denote comparisons with false discovery rate <.05. P values were computed using Wilcoxon signed rank test. LP indicates lumbar puncture; NfL, neurofilament light chain.
aP < .01.
bP < .001.
cP < .05.
Ocrelizumab reduced additional CSF measures of acute inflammation by week 52, including lymphocyte measures sTACI (RMS: −47.6%; PPMS: −27.8%), sCD27 (RMS: −35.3%; PPMS: −19.2%), and sBCMA (RMS: −33.6%; PPMS: −21.3%), and chemokine/cytokine measures CXCL13 (RMS: −63.2%) and CXCL10 (RMS: −22.8%) while more modestly reducing the neuroaxonal injury measure NfH (RMS: −19.6%) and glial measures sTREM2 (RMS: −12.1%) and YKL-40 (RMS: −19.9%; PPMS: −7.7%) (Figure 3D and eFigure 7 in Supplement 1). CSF LCN2 and GFAP that our data had identified as associated with progressive MS and disease burden were not affected by treatment (Figure 3D and eTable 8 in Supplement 1).
Associations Between Serum and CSF Levels of NfL, NfH, and GFAP
To assess the degree to which CSF measures were reflected in serum, we assessed NfL, NfH, and GFAP in both fluids at baseline and at week 52 of treatment. Baseline serum NfL levels were highly correlated with CSF levels (R = 0.75; P < .001); while NfH (R = 0.32; P < .001) and GFAP (R = 0.32; P < .001) exhibited more modest serum-CSF correlations (eFigure 8A in Supplement 1). Serum-CSF correlations remained significant after adjustment for age, sex, and BMI (eTable 9 in Supplement 1). Serum-CSF correlations for NfH (R = 0.17, P = .24) and GFAP (R = 0.37, P = .01) remained low to moderate at week 52 (eFigure 8B in Supplement 1). In contrast to CSF levels, serum NfH and GFAP levels were not meaningfully correlated with measures of disease burden or progressive MS biology at baseline (eFigure 8C in Supplement 1) or at week 52 (eFigure 8D in Supplement 1). Longitudinal trajectories of serial serum sampling in patients with RMS and PPMS showed a decrease in serum NfL; however, serum GFAP and NfH levels were not significantly reduced with treatment (eFigure 9 in Supplement 1).
Association of Elevated CSF GFAP With MS Disease Progression
To provide independent external confirmation of our primary finding that astroglial activity markers, in particular elevated CSF GFAP, were correlated with nonrelapsing progressive biology and may predict MS disease progression, we identified a well-characterized cohort of patients who underwent a single LP and long-term prospective clinical follow-up. This confirmation cohort comprised 41 patients with RMS (median age, 35 years [range, 20-55 years]; 31 [76%] female and 10 [24%] male) and 27 with PPMS (median age, 45 years [range, 26-54 years]; 16 [59%] female and 11 [41%] male), had baseline characteristics (eTable 10 in Supplement 1) similar to those of the test cohort (eTable 2 in Supplement 1), and were closely monitored for a median of 11.5 years after paired serum-CSF collection. A higher level of baseline CSF GFAP, assessed as either a dichotomous variable (levels above median: hazard ratio [HR], 2.3; 95% CI, 1.1-5.3; Cox proportional hazards P = .04, log-rank P = .02) or as a continuous variable (HR, 2.1; 95% CI, 1.3-3.4; Cox proportional hazards P = .002), was associated with greater risk for future CDP24 based on EDSS score (Figure 4B and eTable 11 in Supplement 1), adjusted for age, sex, and treatment. Serum GFAP was not associated with future CDP24, although CSF and serum GFAP levels were moderately correlated in the confirmation cohort (R = 0.43, P = .004) (Figure 4A and C). The confirmation-cohort findings provided real-world corroboration that elevated CSF GFAP was associated with subsequent MS clinical progression.
Figure 4. Association of Cerebrospinal Fluid (CSF) Glial Fibrillary Acid Protein (GFAP) Levels With Long-Term Disability Progression in an Independent Confirmation Cohort.
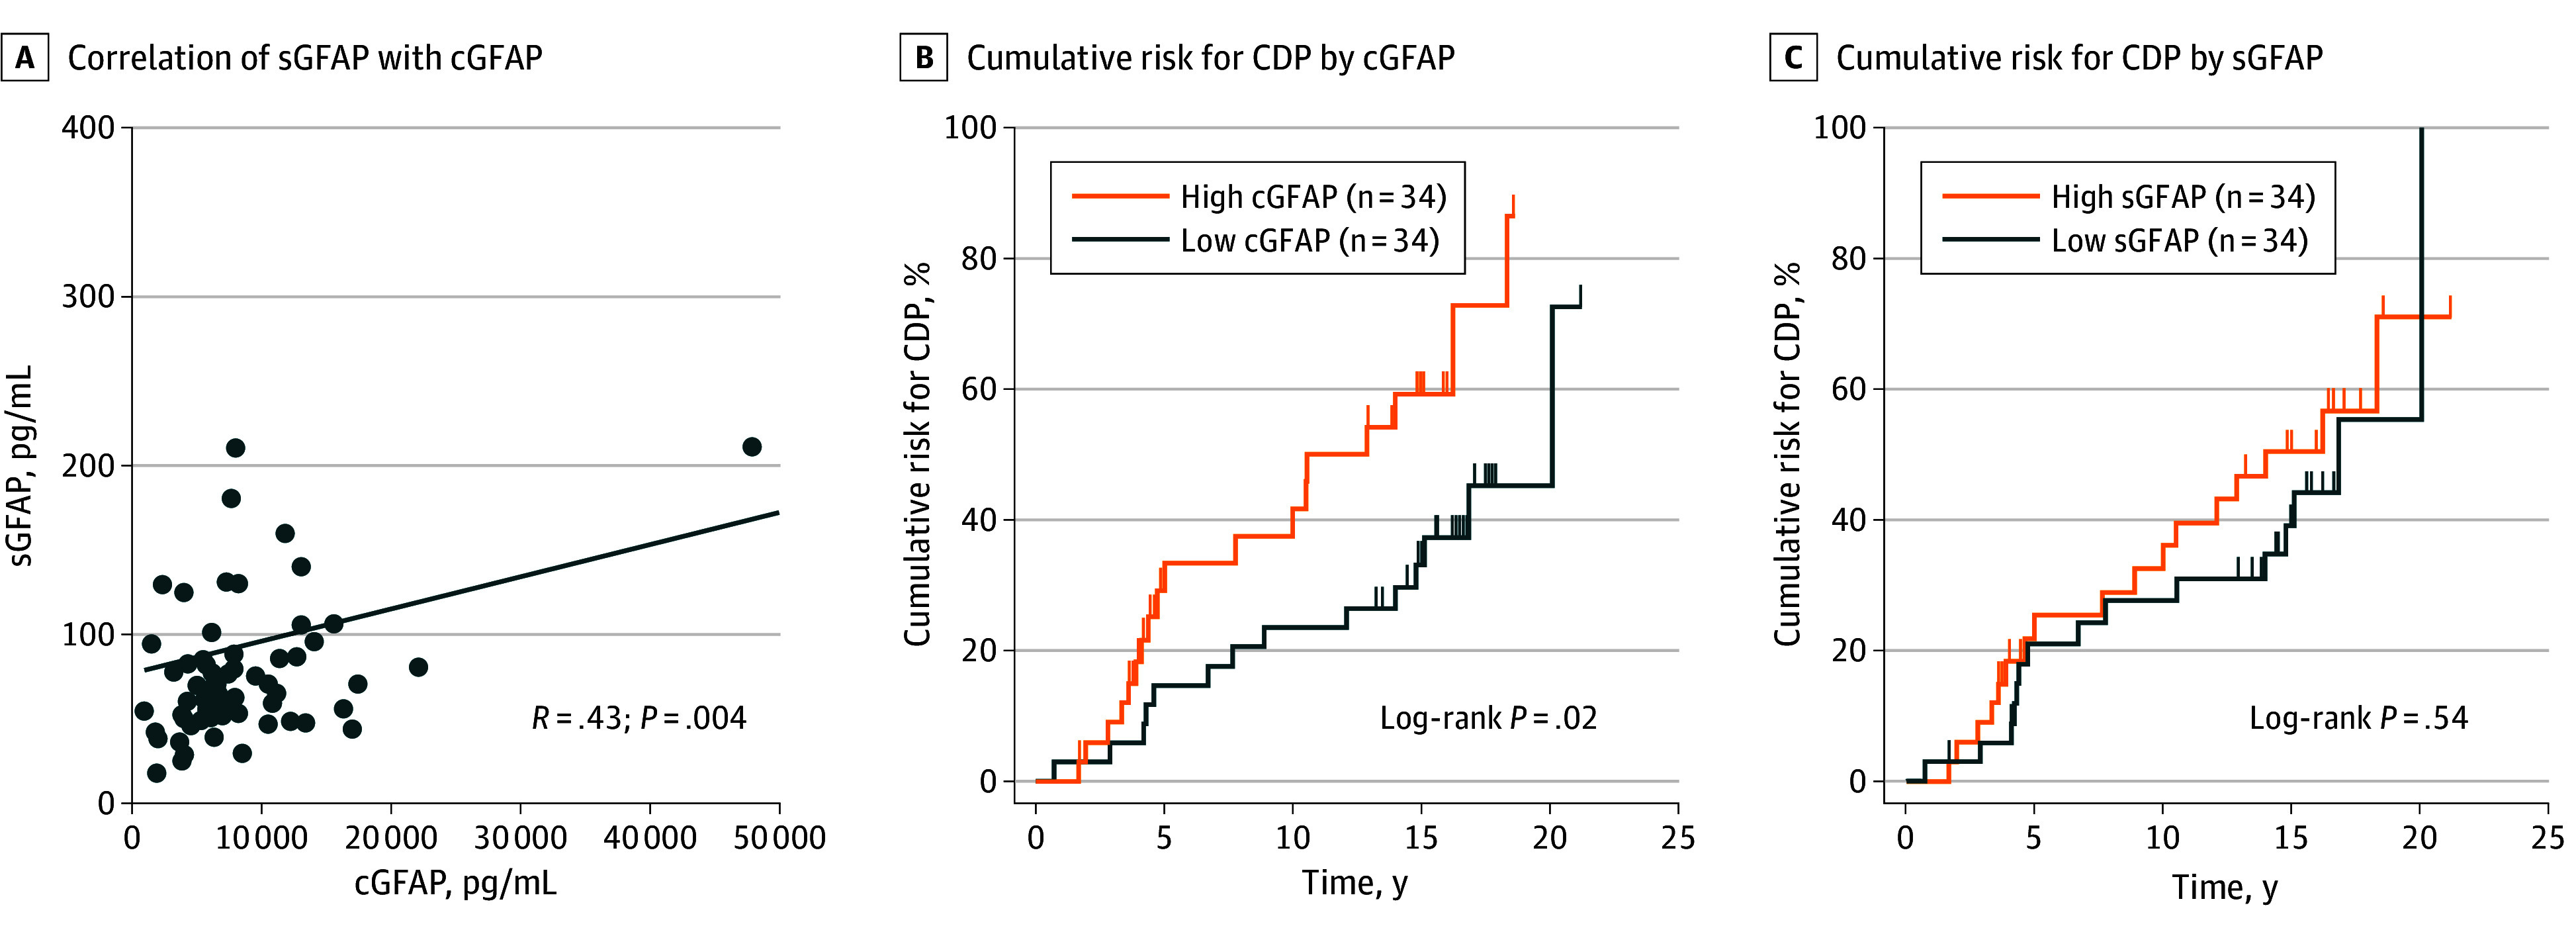
A, Correlation between paired serum GFAP (sGFAP) and CSF GFAP (cGFAP) in the combined relapsing multiple sclerosis and primary progressive multiple sclerosis confirmation cohort (n = 68). B, Patients with high baseline median CSF GFP levels (>7200 pg/mL) were at greater risk for confirmed disability progression (CDP) on Expanded Disability Status Scale score over a median 15 years of follow-up compared with those with low baseline cGFAP levels. C, High baseline sGFAP was not associated with increased risk for subsequent CDP in the same cohort.
Discussion
We leveraged an initial test cohort of patients with relapsing or primary progressive MS who were prospectively followed up before and after anti-CD20 treatment initiation with serial CSF, clinical, and imaging assessments to explore overlapping and distinct mechanisms underlying relapsing and progressive MS biology. CSF GFAP was identified as a putative biological measure of progressive MS biology associated with SELs (an MRI measure reflecting a subset of chronic active lesions14,15) and independent of acute relapse biology. CSF NfH was identified as a neuroaxonal injury biomarker that may complement both NfL and GFAP for assessing disease severity. Unbiased mass-spectrometry proteomic analysis of the same CSF samples provided internal confirmation and reinforced the test-cohort implication of glial biology in nonrelapsing progressive disease. This was further reinforced by the differential association of anti-CD20 treatment with CSF immune vs glial markers, in keeping with its known robust effect on relapsing biology and relatively modest impact on progressive disease. An independent real-world confirmatory cohort of patients with clinical characteristics similar to the test cohort demonstrated that elevated CSF GFAP levels were prognostic of future MS disability progression over more than 10 years, supporting the prognostic utility of GFAP across MS clinical phenotypes and treatments. Together, these findings provide novel insights into the relationships of immune and glial cells in both relapsing and progressive MS pathophysiology.
The similarities observed in CSF biomarkers of patients with clinical phenotypes of RMS or PPMS are consistent with growing evidence that both peripherally mediated inflammation and smoldering CNS-compartmentalized inflammation are characteristics of MS across its clinical spectrum. We first noted that CSF measures of lymphocyte biology (sTACI, sCD27, sBCMA) and chemokines (CXCL10, CXCL12) were elevated in patients with PPMS and responded to anti-CD20 treatment (despite the lack of overt clinical relapses). Similarly, ocrelizumab treatment significantly reduced levels of CSF CD19+ B cells and CD3+ T cells not only in RMS (as previously reported35,36) but also in PPMS as demonstrated here, providing in vivo evidence of subclinical acute inflammatory activity in patients with PPMS.
We confirmed that NfL is strongly associated with both acute inflammatory disease activity as well as with SELs,37 reinforcing the concept that elevated NfL levels can reflect neuroaxonal injury from both relapsing and nonrelapsing progressive biology.25,38,39 We further noted that elevation of NfH was significantly associated with higher EDSS score, lower brain and thalamic volume, higher SEL count, and lower T1w intensity within SELs. This aligns with prior studies showing elevated NfH in patients with MS with greater disease burden and disability.26,40,41 Compared with NfL, NfH appears less affected by acute disease activity, displaying potential as a biomarker of ongoing insidious neuroaxonal injury. The meaning of these differences in NfH vs NfL remains to be elucidated. The modest correlation of serum NfH with CSF NfH suggests that NfH measured in CSF may be of greater utility.42,43
The role of glial activity in nonrelapsing progressive biology was indicated by elevation of several CSF measures associated with astrocytes (GFAP, LCN2, YKL-40 trend) and microglia (sTREM2) in patients with PPMS vs RMS. Importantly, GFAP and YKL-40 were associated with SEL burden, MS lesion burden, and disease severity. Importantly, no association between CSF GFAP and acute inflammatory activity was detected, and GFAP levels were not significantly impacted by anti-CD20 treatment, making it a more specific candidate biomarker for nonrelapsing progressive MS biology. GFAP was also the only CSF biomarker that showed a correlation with the proportion of focal lesion volume attributed to SELs and remained associated with SEL count after adjustment for T2LV, suggesting that GFAP elevations may capture an aspect of chronic smoldering compartmentalized inflammation. Although astrocytes support CNS homeostasis and neurovascular integrity, reactive astrogliosis may contribute to ongoing inflammation and injury including neuronal loss.44,45 Astrocytes at the edge of MS chronic active lesions as well as in the glia limitans and ependyma show high expression of GFAP32,46 and may reflect sources of increased levels associated with smoldering injury in the context of focal lesions, as well as in the subpial cortex and periventricular regions, respectively. Elevated CSF GFAP has also been reported in early MS, supporting its potential utility across the disease continuum.47 We identified only a moderate correlation between serum and CSF GFAP levels and did not detect an association between serum GFAP levels and progressive disease outcomes (consistent with other similarly sized studies48,49). In contrast, prior work,50,51 including 2 recent large studies by Barro et al52 and Meier et al,53 did identify an association between serum GFAP and MS progression. This discrepancy could reflect differences in cohort size, pre-analytical variables, assay platform/matrix effects, and/or different methodologies ascertaining disease outcomes.
Limitations
A limitation of the study’s test and confirmation cohorts is the relatively smaller size of their PPMS subgroups, although the overall similarities observed in CSF biomarkers in RMS and PPMS in both cohorts supported growing evidence that inflammatory processes contribute to both relapsing and nonrelapsing progressive biology. Another potential limitation relates to some imbalances in baseline demographics and disease status of the cohort subgroups (eTable 2 and eTable 10 in Supplement 1), and larger studies could help clarify the potential effect of age and BMI on the different markers. We also note that the independent confirmation cohort does not provide a direct validation of all of the test-cohort findings. When analyzing our initial test dataset, we explored multiple fluid-phase and cellular CSF measures and identified distinct families of immune markers that preferentially tracked with acute inflammatory disease measures vs glial markers (in particular GFAP) that preferentially tracked with progressive disease measures. In our independent confirmation dataset, we opted to focus on GFAP and confirmed its association with (and prognostication of) long-term clinical disease progression in a real-world setting across clinical MS phenotypes and with multiple different treatments, although we did not assess additional biological measures or their relation to imaging outcomes.
Conclusions
In this study, activated glial markers (in particular GFAP) and NfH were associated specifically with nonrelapsing progressive disease outcomes (independent of acute inflammatory activity). Elevated CSF GFAP was associated with long-term MS disease progression. Overall, our study revealed shared mechanisms in RMS and PPMS, bolstering the concept that a biological disease continuum exists across MS clinical phenotypes. The findings underscore a role for glial activity and chronic inflammation in nonrelapsing progressive pathobiology and identify GFAP and NfH as more specific candidate biomarkers for progressive biology, potentially improving on NfL, which reflects both injury from acute disease activity and from insidious injury. Future clinical trials should incorporate combined measurement of these markers (and, once validated, potentially also clinical practice), which could be useful for assessing the effect of emerging therapies (or combinations of therapies) on subclinical relapsing and progressive disease mechanisms.
eMethods
eTable 1. Summary of Biological Measures Assessed in the Test-Cohort
eTable 2. Baseline Characteristics of Test-Cohort RMS and PPMS Patients in the Different LP Study Arms
eTable 3. CSF and Serum NfL, NfH and GFAP Associations With Clinical/MRI Measures Adjusted for Age, Sex, and BMI in the Test-Cohort.
eTable 4. Associations of CSF NfL, NfH, GFAP, and YKL-40 with SEL Count Adjusted for Demographics and T2LV in the Test-Cohort
eTable 5. Baseline CSF Biomarker Levels in Patients With and Without CDP24 in the Test-Cohort
eTable 6. Correlation of CSF Proteins Derived From Data-Independent Acquisition-Mass Spectrometry With SEL Volume in the Test-Cohort
eTable 7. Clinical Outcomes Across 52 Weeks of Ocrelizumab Treatment in the Test-Cohort
eTable 8. Median Percentage Change From Baseline in Levels of CSF Biological Measures in Test-Cohort by LP Arm
eTable 9. Relationships Between CSF and Serum Levels of NfL, NfH, and GFAP in the Test-Cohort
eTable 10. Baseline Demographics and Clinical Characteristics of the Confirmation-Cohort
eTable 11. CSF and Serum GFAP Levels and Association With CDP, Adjusted for Age, Sex, and Treatment, in the Confirmation-Cohort
eFigure 1. Design of Test-Cohort Study
eFigure 2. Correlations Between Baseline CSF Biological Measures and MRI/Clinical Measures in the RMS and PPMS Subgroups of the Test-Cohort
eFigure 3. Correlations Between Baseline CSF T-Cell or B-Cell Subsets and MRI/Clinical Measures in the Test-Cohort
eFigure 4. Expression of (A) GFAP and YKL-40 in Astrocytes, and (B) TREM2 in Myeloid Cells, in a Published snRNA-Seq Data Set
eFigure 5. Ocrelizumab Treatment Effect on Circulating B cells and T Cells
eFigure 6. MRI Outcomes in the Test-Cohort
eFigure 7. Ocrelizumab Treatment Effect on Individual CSF Biological Measures in the Test-Cohort
eFigure 8. Serum NfL, NfH, and GFAP Levels and Correlation with CSF and Disease Measures in the Test-Cohort
eFigure 9. Longitudinal Trajectories of Serial Sampling for Serum NfL, NfH and GFAP in the RMS and PPMS Subgroups of Test-Cohort
eReferences
Data sharing statement
References
- 1.Lassmann H. Pathogenic mechanisms associated with different clinical courses of multiple sclerosis. Front Immunol. 2019;9:3116-3116. doi: 10.3389/fimmu.2018.03116 [DOI] [PMC free article] [PubMed] [Google Scholar]
- 2.Vollmer TL, Nair KV, Williams IM, Alvarez E. Multiple sclerosis phenotypes as a continuum: the role of neurologic reserve. Neurol Clin Pract. 2021;11(4):342-351. doi: 10.1212/CPJ.0000000000001045 [DOI] [PMC free article] [PubMed] [Google Scholar]
- 3.Bar-Or A, Li R. Cellular immunology of relapsing multiple sclerosis: interactions, checks, and balances. Lancet Neurol. 2021;20(6):470-483. doi: 10.1016/S1474-4422(21)00063-6 [DOI] [PubMed] [Google Scholar]
- 4.Absinta M, Sati P, Masuzzo F, et al. Association of chronic active multiple sclerosis lesions with disability in vivo. JAMA Neurol. 2019;76(12):1474-1483. doi: 10.1001/jamaneurol.2019.2399 [DOI] [PMC free article] [PubMed] [Google Scholar]
- 5.Antel J, Antel S, Caramanos Z, Arnold DL, Kuhlmann T. Primary progressive multiple sclerosis: part of the MS disease spectrum or separate disease entity? Acta Neuropathol. 2012;123(5):627-638. doi: 10.1007/s00401-012-0953-0 [DOI] [PubMed] [Google Scholar]
- 6.Frischer JM, Weigand SD, Guo Y, et al. Clinical and pathological insights into the dynamic nature of the white matter multiple sclerosis plaque. Ann Neurol. 2015;78(5):710-721. doi: 10.1002/ana.24497 [DOI] [PMC free article] [PubMed] [Google Scholar]
- 7.Bramow S, Frischer JM, Lassmann H, et al. Demyelination versus remyelination in progressive multiple sclerosis. Brain. 2010;133(10):2983-2998. doi: 10.1093/brain/awq250 [DOI] [PubMed] [Google Scholar]
- 8.Frischer JM, Bramow S, Dal-Bianco A, et al. The relation between inflammation and neurodegeneration in multiple sclerosis brains. Brain. 2009;132(Pt 5):1175-1189. doi: 10.1093/brain/awp070 [DOI] [PMC free article] [PubMed] [Google Scholar]
- 9.Dal-Bianco A, Grabner G, Kronnerwetter C, et al. Slow expansion of multiple sclerosis iron rim lesions: pathology and 7 T magnetic resonance imaging. Acta Neuropathol. 2017;133(1):25-42. doi: 10.1007/s00401-016-1636-z [DOI] [PMC free article] [PubMed] [Google Scholar]
- 10.Absinta M, Sati P, Schindler M, et al. Persistent 7-tesla phase rim predicts poor outcome in new multiple sclerosis patient lesions. J Clin Invest. 2016;126(7):2597-2609. doi: 10.1172/JCI86198 [DOI] [PMC free article] [PubMed] [Google Scholar]
- 11.Rice CM, Cottrell D, Wilkins A, Scolding NJ. Primary progressive multiple sclerosis: progress and challenges. J Neurol Neurosurg Psychiatry. 2013;84(10):1100-1106. doi: 10.1136/jnnp-2012-304140 [DOI] [PubMed] [Google Scholar]
- 12.Thompson AJ, Kermode AG, Wicks D, et al. Major differences in the dynamics of primary and secondary progressive multiple sclerosis. Ann Neurol. 1991;29(1):53-62. doi: 10.1002/ana.410290111 [DOI] [PubMed] [Google Scholar]
- 13.Schumacher AM, Mahler C, Kerschensteiner M. Pathology and pathogenesis of progressive multiple sclerosis: concepts and controversies. Neurol Int Open. 2017;01(03):E171-E181. doi: 10.1055/s-0043-106704 [DOI] [Google Scholar]
- 14.Elliott C, Belachew S, Wolinsky JS, et al. Chronic white matter lesion activity predicts clinical progression in primary progressive multiple sclerosis. Brain. 2019;142(9):2787-2799. doi: 10.1093/brain/awz212 [DOI] [PMC free article] [PubMed] [Google Scholar]
- 15.Elliott C, Wolinsky JS, Hauser SL, et al. Slowly expanding/evolving lesions as a magnetic resonance imaging marker of chronic active multiple sclerosis lesions. Mult Scler. 2019;25(14):1915-1925. doi: 10.1177/1352458518814117 [DOI] [PMC free article] [PubMed] [Google Scholar]
- 16.Magliozzi R, Howell OW, Reeves C, et al. A gradient of neuronal loss and meningeal inflammation in multiple sclerosis. Ann Neurol. 2010;68(4):477-493. doi: 10.1002/ana.22230 [DOI] [PubMed] [Google Scholar]
- 17.Weber MS, Hemmer B, Cepok S. The role of antibodies in multiple sclerosis. Biochim Biophys Acta. 2011;1812(2):239-245. doi: 10.1016/j.bbadis.2010.06.009 [DOI] [PubMed] [Google Scholar]
- 18.ClinicalTrials.gov . Study to explore the mechanism of action of ocrelizumab and B-cell biology in participants with relapsing multiple sclerosis (RMS) or primary progressive multiple sclerosis (PPMS). ClinicalTrials.gov ID NCT02688985. Accessed February 6, 2024. https://clinicaltrials.gov/study/NCT02688985
- 19.Polman CH, Reingold SC, Banwell B, et al. Diagnostic criteria for multiple sclerosis: 2010 revisions to the McDonald criteria. Ann Neurol. 2011;69(2):292-302. doi: 10.1002/ana.22366 [DOI] [PMC free article] [PubMed] [Google Scholar]
- 20.Hauser SL, Bar-Or A, Comi G, et al. ; OPERA I and OPERA II Clinical Investigators . Ocrelizumab versus interferon beta-1a in relapsing multiple sclerosis. N Engl J Med. 2017;376(3):221-234. doi: 10.1056/NEJMoa1601277 [DOI] [PubMed] [Google Scholar]
- 21.Montalban X, Hauser SL, Kappos L, et al. ; ORATORIO Clinical Investigators . Ocrelizumab versus placebo in primary progressive multiple sclerosis. N Engl J Med. 2017;376(3):209-220. doi: 10.1056/NEJMoa1606468 [DOI] [PubMed] [Google Scholar]
- 22.Komori M, Blake A, Greenwood M, et al. Cerebrospinal fluid markers reveal intrathecal inflammation in progressive multiple sclerosis. Ann Neurol. 2015;78(1):3-20. doi: 10.1002/ana.24408 [DOI] [PMC free article] [PubMed] [Google Scholar]
- 23.Laurent SA, Hoffmann FS, Kuhn PH, et al. γ-Secretase directly sheds the survival receptor BCMA from plasma cells. Nat Commun. 2015;6:7333-7333. doi: 10.1038/ncomms8333 [DOI] [PMC free article] [PubMed] [Google Scholar]
- 24.Hoffmann FS, Kuhn PH, Laurent SA, et al. The immunoregulator soluble TACI is released by ADAM10 and reflects B cell activation in autoimmunity. J Immunol. 2015;194(2):542-552. doi: 10.4049/jimmunol.1402070 [DOI] [PMC free article] [PubMed] [Google Scholar]
- 25.Kuhle J, Kropshofer H, Haering DA, et al. Blood neurofilament light chain as a biomarker of MS disease activity and treatment response. Neurology. 2019;92(10):e1007-e1015. doi: 10.1212/WNL.0000000000007032 [DOI] [PMC free article] [PubMed] [Google Scholar]
- 26.Shehab AA, Solima DA, Abdel-Hafeez MA, Mohamed SM. Serum phosphorylated neurofilament heavy chain level in relapsing remitting multiple sclerosis in correlation to disease activity and disability. Egypt J Immunol. 2019;26(1):1-13. [PubMed] [Google Scholar]
- 27.Öhrfelt A, Axelsson M, Malmeström C, et al. Soluble TREM-2 in cerebrospinal fluid from patients with multiple sclerosis treated with natalizumab or mitoxantrone. Mult Scler. 2016;22(12):1587-1595. doi: 10.1177/1352458515624558 [DOI] [PubMed] [Google Scholar]
- 28.Durrant DM, Williams JL, Daniels BP, Klein RS. Chemokines referee inflammation within the central nervous system during infection and disease. Adv Med. 2014;2014:806741. doi: 10.1155/2014/806741 [DOI] [PMC free article] [PubMed] [Google Scholar]
- 29.Al Nimer F, Elliott C, Bergman J, et al. Lipocalin-2 is increased in progressive multiple sclerosis and inhibits remyelination. Neurol Neuroimmunol Neuroinflamm. 2016;3(1):e191. doi: 10.1212/NXI.0000000000000191 [DOI] [PMC free article] [PubMed] [Google Scholar]
- 30.Bielecki B, Jatczak-Pawlik I, Wolinski P, Bednarek A, Glabinski A. Central nervous system and peripheral expression of CCL19, CCL21 and their receptor CCR7 in experimental model of multiple sclerosis. Arch Immunol Ther Exp (Warsz). 2015;63(5):367-376. doi: 10.1007/s00005-015-0339-9 [DOI] [PMC free article] [PubMed] [Google Scholar]
- 31.Abdelhak A, Huss A, Kassubek J, Tumani H, Otto M. Serum GFAP as a biomarker for disease severity in multiple sclerosis. Sci Rep. 2018;8(1):14798. doi: 10.1038/s41598-018-33158-8 [DOI] [PMC free article] [PubMed] [Google Scholar]
- 32.Absinta M, Maric D, Gharagozloo M, et al. A lymphocyte-microglia-astrocyte axis in chronic active multiple sclerosis. Nature. 2021;597(7878):709-714. doi: 10.1038/s41586-021-03892-7 [DOI] [PMC free article] [PubMed] [Google Scholar]
- 33.Karlsson M, Zhang C, Méar L, et al. A single-cell type transcriptomics map of human tissues. Sci Adv. 2021;7(31):eabh2169. doi: 10.1126/sciadv.abh2169 [DOI] [PMC free article] [PubMed] [Google Scholar]
- 34.Fissolo N, Matute-Blanch C, Osman M, et al. CSF SERPINA3 levels are elevated in patients with progressive MS. Neurol Neuroimmunol Neuroinflamm. 2021;8(2):e941. doi: 10.1212/NXI.0000000000000941 [DOI] [PMC free article] [PubMed] [Google Scholar]
- 35.Piccio L, Naismith RT, Trinkaus K, et al. Changes in B- and T-lymphocyte and chemokine levels with rituximab treatment in multiple sclerosis. Arch Neurol. 2010;67(6):707-714. doi: 10.1001/archneurol.2010.99 [DOI] [PMC free article] [PubMed] [Google Scholar]
- 36.Alvarez E, Piccio L, Mikesell RJ, et al. Predicting optimal response to B-cell depletion with rituximab in multiple sclerosis using CXCL13 index, magnetic resonance imaging and clinical measures. Mult Scler J Exp Transl Clin. 2015;1:2055217315623800. doi: 10.1177/2055217315623800 [DOI] [PMC free article] [PubMed] [Google Scholar]
- 37.Maggi P, Kuhle J, Schädelin S, et al. Chronic white matter inflammation and serum neurofilament levels in multiple sclerosis. Neurology. 2021;97(6):e543-e553. doi: 10.1212/WNL.0000000000012326 [DOI] [PMC free article] [PubMed] [Google Scholar]
- 38.Thebault S, Abdoli M, Fereshtehnejad SM, Tessier D, Tabard-Cossa V, Freedman MS. Serum neurofilament light chain predicts long term clinical outcomes in multiple sclerosis. Sci Rep. 2020;10(1):10381. doi: 10.1038/s41598-020-67504-6 [DOI] [PMC free article] [PubMed] [Google Scholar]
- 39.Bar-Or A, Thanei GA, Harp C, et al. Blood neurofilament light levels predict non-relapsing progression following anti-CD20 therapy in relapsing and primary progressive multiple sclerosis: findings from the ocrelizumab randomised, double-blind phase 3 clinical trials. EBioMedicine. 2023;93:104662. doi: 10.1016/j.ebiom.2023.104662 [DOI] [PMC free article] [PubMed] [Google Scholar]
- 40.Kuhle J, Plattner K, Bestwick JP, et al. A comparative study of CSF neurofilament light and heavy chain protein in MS. Mult Scler. 2013;19(12):1597-1603. doi: 10.1177/1352458513482374 [DOI] [PubMed] [Google Scholar]
- 41.Kuhle J, Leppert D, Petzold A, et al. Neurofilament heavy chain in CSF correlates with relapses and disability in multiple sclerosis. Neurology. 2011;76(14):1206-1213. doi: 10.1212/WNL.0b013e31821432ff [DOI] [PubMed] [Google Scholar]
- 42.Ganesalingam J, An J, Shaw CE, Shaw G, Lacomis D, Bowser R. Combination of neurofilament heavy chain and complement C3 as CSF biomarkers for ALS. J Neurochem. 2011;117(3):528-537. doi: 10.1111/j.1471-4159.2011.07224.x [DOI] [PMC free article] [PubMed] [Google Scholar]
- 43.Pujol-Calderón F, Portelius E, Zetterberg H, Blennow K, Rosengren LE, Höglund K. Neurofilament changes in serum and cerebrospinal fluid after acute ischemic stroke. Neurosci Lett. 2019;698:58-63. doi: 10.1016/j.neulet.2018.12.042 [DOI] [PubMed] [Google Scholar]
- 44.Ponath G, Park C, Pitt D. The role of astrocytes in multiple sclerosis. Front Immunol. 2018;9:217-217. doi: 10.3389/fimmu.2018.00217 [DOI] [PMC free article] [PubMed] [Google Scholar]
- 45.Patani R, Hardingham GE, Liddelow SA. Functional roles of reactive astrocytes in neuroinflammation and neurodegeneration. Nat Rev Neurol. 2023;19(7):395-409. doi: 10.1038/s41582-023-00822-1 [DOI] [PubMed] [Google Scholar]
- 46.Hasel P, Cooper ML, Marchildon AE, et al. Defining the molecular identity and morphology of glia limitans superficialis astrocytes in mouse and human. bioRxiv. Published online April 6, 2023. doi: 10.1101/2023.04.06.535893 [DOI]
- 47.Probert F, Yeo T, Zhou Y, et al. Determination of CSF GFAP, CCN5, and vWF levels enhances the diagnostic accuracy of clinically defined MS from non-MS patients with CSF oligoclonal bands. Front Immunol. 2022;12:811351. doi: 10.3389/fimmu.2021.811351 [DOI] [PMC free article] [PubMed] [Google Scholar]
- 48.Pauwels A, Van Schependom J, Devolder L, et al. Plasma glial fibrillary acidic protein and neurofilament light chain in relation to disability worsening in multiple sclerosis. Mult Scler. 2022;28(11):1685-1696. doi: 10.1177/13524585221094224 [DOI] [PubMed] [Google Scholar]
- 49.Barro C, Healy BC, Saxena S, et al. Serum NfL but not GFAP predicts cognitive decline in active progressive multiple sclerosis patients. Mult Scler. 2023;29(2):206-211. doi: 10.1177/13524585221137697 [DOI] [PubMed] [Google Scholar]
- 50.Abdelhak A, Hottenrott T, Morenas-Rodríguez E, et al. Glial activation markers in CSF and serum from patients with primary progressive multiple sclerosis: potential of serum GFAP as disease severity marker? Front Neurol. 2019;10:280. doi: 10.3389/fneur.2019.00280 [DOI] [PMC free article] [PubMed] [Google Scholar]
- 51.Ayrignac X, Le Bars E, Duflos C, et al. Serum GFAP in multiple sclerosis: correlation with disease type and MRI markers of disease severity. Sci Rep. 2020;10(1):10923. doi: 10.1038/s41598-020-67934-2 [DOI] [PMC free article] [PubMed] [Google Scholar]
- 52.Barro C, Healy BC, Liu Y, et al. Serum GFAP and NfL levels differentiate subsequent progression and disease activity in patients with progressive multiple sclerosis. Neurol Neuroimmunol Neuroinflamm. 2022;10(1):e200052. doi: 10.1212/NXI.0000000000200052 [DOI] [PMC free article] [PubMed] [Google Scholar]
- 53.Meier S, Willemse EAJ, Schaedelin S, et al. Serum glial fibrillary acidic protein compared with neurofilament light chain as a biomarker for disease progression in multiple sclerosis. JAMA Neurol. 2023;80(3):287-297. doi: 10.1001/jamaneurol.2022.5250 [DOI] [PMC free article] [PubMed] [Google Scholar]
Associated Data
This section collects any data citations, data availability statements, or supplementary materials included in this article.
Supplementary Materials
eMethods
eTable 1. Summary of Biological Measures Assessed in the Test-Cohort
eTable 2. Baseline Characteristics of Test-Cohort RMS and PPMS Patients in the Different LP Study Arms
eTable 3. CSF and Serum NfL, NfH and GFAP Associations With Clinical/MRI Measures Adjusted for Age, Sex, and BMI in the Test-Cohort.
eTable 4. Associations of CSF NfL, NfH, GFAP, and YKL-40 with SEL Count Adjusted for Demographics and T2LV in the Test-Cohort
eTable 5. Baseline CSF Biomarker Levels in Patients With and Without CDP24 in the Test-Cohort
eTable 6. Correlation of CSF Proteins Derived From Data-Independent Acquisition-Mass Spectrometry With SEL Volume in the Test-Cohort
eTable 7. Clinical Outcomes Across 52 Weeks of Ocrelizumab Treatment in the Test-Cohort
eTable 8. Median Percentage Change From Baseline in Levels of CSF Biological Measures in Test-Cohort by LP Arm
eTable 9. Relationships Between CSF and Serum Levels of NfL, NfH, and GFAP in the Test-Cohort
eTable 10. Baseline Demographics and Clinical Characteristics of the Confirmation-Cohort
eTable 11. CSF and Serum GFAP Levels and Association With CDP, Adjusted for Age, Sex, and Treatment, in the Confirmation-Cohort
eFigure 1. Design of Test-Cohort Study
eFigure 2. Correlations Between Baseline CSF Biological Measures and MRI/Clinical Measures in the RMS and PPMS Subgroups of the Test-Cohort
eFigure 3. Correlations Between Baseline CSF T-Cell or B-Cell Subsets and MRI/Clinical Measures in the Test-Cohort
eFigure 4. Expression of (A) GFAP and YKL-40 in Astrocytes, and (B) TREM2 in Myeloid Cells, in a Published snRNA-Seq Data Set
eFigure 5. Ocrelizumab Treatment Effect on Circulating B cells and T Cells
eFigure 6. MRI Outcomes in the Test-Cohort
eFigure 7. Ocrelizumab Treatment Effect on Individual CSF Biological Measures in the Test-Cohort
eFigure 8. Serum NfL, NfH, and GFAP Levels and Correlation with CSF and Disease Measures in the Test-Cohort
eFigure 9. Longitudinal Trajectories of Serial Sampling for Serum NfL, NfH and GFAP in the RMS and PPMS Subgroups of Test-Cohort
eReferences
Data sharing statement