Abstract
Our previous study using systems vaccinology identified an association between the sterol regulatory binding protein (SREBP) pathway and humoral immune response to vaccination in humans. To investigate the role of SREBP signaling in modulating immune responses, we generated mice with B cell or CD11c+ antigen-presenting cell (APC) specific deletion of SCAP, an essential regulator of SREBP signaling. Ablation of SCAP in CD11c+ APCs had no effect on immune responses. In contrast, SREBP signaling in B cells was critical for antibody responses, and generation of germinal centers (GC) and memory B cells. SREBP signaling was required for metabolic reprogramming in activated B cells. Upon mitogen stimulation, SCAP deficient B cells could not proliferate and had reduced lipid rafts. Deletion of SCAP in GC B cells using AID-Cre reduced lipid raft content and cell cycle progression. These studies provide mechanistic insights coupling sterol metabolism with the quality and longevity of humoral immunity.
Introduction:
Generation of high affinity antibodies and antigen-specific memory B cells (MBCs) is a central feature of the adaptive immune response against pathogens. Antibodies are the primary mechanism of protection induced by vaccination, and durable antibody responses are dependent on the formation of long-lived plasma cells (PCs)1–3. Therefore, a better understanding of the pathways regulating B cell activation and memory formation is critical to develop vaccines that induce robust and sustained protective immunity.
B cells are activated by the antigen induced cross-linking of the B cell receptor (BCR), in concert with additional signals mediated via Toll-like receptors (TLRs) or CD401. A subset of activated B cells form germinal centers (GCs), which are dynamic microenvironments of B-cell selection and differentiation3. Within germinal centers, activated B cells proliferate and accumulate point mutations in the genes encoding their immunoglobulin receptors, leading to affinity maturation and the generation of high affinity MBCs and long-lived PCs1,2. GC B cells reprogram their signaling networks to facilitate affinity-based selection4, during which BCR and CD40 signaling synergize to induce the expression of c-Myc and the activation of mTORC15. Most of the successfully selected GC B cells migrate from the light zone (LZ) to the dark zone (DZ) of GC, where they rapidly divide. GC B cells also reprogram their metabolism and primarily use fatty acids to conduct oxidative phosphorylation (OXPHOS) to meet their energy needs6, which is essential for their clonal expansion and efficient affinity maturation7. A subset of selected GC B cells differentiates into MBCs or LLPCs, providing long lasting immune memory8.
Using systems vaccinology approaches, we previously identified that sterol metabolism controlled by the sterol regulatory element binding protein (SREBP) pathway is tightly correlated with adaptive immunity, including antibody and T follicular cell responses9. The activity of SREBPs is dependent on SREBP cleavage activating protein (SCAP)10. SCAP is a polytopic membrane protein in the ER, that binds SREBPs in the ER and transports them to the Golgi for proteolytic processing. Proteolysis releases the SREBP transcription factor binding domains, which results in entry of SREBPs into the nucleus and transcription of genes involved in lipid synthesis and uptake. When cholesterol in the ER membrane exceeds a given threshold, it binds to SCAP and triggers a conformational change that prevents it from activating SREBP, thus repressing further cholesterol synthesis in a negative feedback loop11. Despite the critical role of the SCAP-SREBP pathway in cholesterol metabolism, its role in the immune system is poorly understood. A previous study suggests that the depletion of SCAP in T cells causes a severe block in CD8 T cell activation12, but the role of SREBP signaling in other cell types, including B cells and dendritic cells (DCs), is unknown. To investigate this, we generated the SCAPfl/fl CD11c-Cre, SCAPfl/fl CD19Cre/+ and SCAPfl/fl AID-Cre R26YFP mouse lines. We found that SREBP signaling in B cells (but not in CD11c+ APCs) is required for an effective humoral immune response to immunization and viral infection. SCAP deficiency did not affect B cell maturation or maintenance at steady state. However, SCAP deficient B cells were blocked in cell cycle progression and metabolic reprogramming and were unable to efficiently form GC or bone marrow PCs in response to immunization. These findings highlight the B cell specific role of sterol metabolism in B cell activation and the generation of immunological memory. Further, this study suggests modulation of the SREBP pathway in B cells as a potential novel avenue in vaccine design and development of treatments for diseases driven by B cell hyper activation.
Results
SREBP signaling in CD11c+ APCs is dispensable for immune responses
SCAP senses cholesterol levels and escorts SREBPs from the endoplasmic reticulum (ER) to the Golgi apparatus, where SREBPs are cleaved and activated10. As SCAP is essential for the activation of SREBPs, SCAP deletion abrogates SREBP signaling, leading to reduced lipid biosynthesis in metabolically active cells12,13. We have previously shown that early sterol metabolism in PBMC correlates with and can predict later humoral and T cell responses9. Based on this result, we aimed to investigate the role of SREBP signaling in CD11c+ APCs and B cells. First, we crossed SCAPfl/fl mice with CD11c-Cre
mice to genetically ablate SCAP in CD11c expressing DCs and other APCs. We found that DC subsets at steady state were not altered in SCAPfl/fl CD11c-Cre mice compared to their littermate controls (Extended Data Fig. 1a). SCAPfl/fl CD11c-Cre mice immunized with ovalbumin (OVA) protein adjuvanted with RIBI (a synthetic TLR4 agonist) or AddaVax (a squalene-based adjuvant), mounted normal antibody responses at day 28 (Extended Data Fig. 1b). CD8 T cell response to the live attenuated yellow fever vaccine (YF-17D, which has previously been shown to signal via multiple TLRs14) in SCAPfl/fl CD11c-Cre mice at day 8 was also comparable to their littermate controls (Extended Data Fig. 1c). These data suggest that SREBP signaling in CD11c+ APCs is dispensable for antibody and CD8 T cell responses to immunization.
SREBP signaling in B cell maturation and homeostasis
To study SREBP signaling in B cells, we generated mice with B cell specific SCAP deletion by crossing SCAPfl/fl mice with CD19Cre/+ mice (SCAPfl/fl CD19Cre/+). To evaluate whether SREBP signaling can affect B cell maturation, we compared SCAPfl/fl CD19Cre/+ mice and control mice (SCAP+/+ CD19Cre/+) for the development of B cell subsets in the spleen. As shown in Extended Data Fig. 2a–c, SREBP signaling was not associated with any developmental defects in splenic B cells. Transitional B cells, marginal zone B cells, mature B2 B cells, and basal plasma cells were found at normal frequencies in SCAPfl/fl CD19Cre/+ mice.
Lipid rafts are enriched in sterols. To determine whether defective sterol synthesis in SCAP deficient B cells can affect their lipid rafts, we took advantage of the ability of cholera toxin subunit B (CT-B) to selectively bind to lipid rafts15,16 and examined lipid rafts with CT-B labeling. As shown in Extended Data Fig. 2d, SCAP deficient B cells have similar CT-B staining pattern compared to the wild type (WT) B cells, suggesting B cell lipid raft synthesis at steady state is not affected by SREBP deficiency. B cell development and maintenance requires tonic B cell receptor (BCR) signaling17. Flow cytometry analysis showed that BCR stimulation by α-IgM treatment induced similar levels of p-SYK and p-BTK in SCAP deficient B cells compared to WT B cells, suggesting SCAP is not required for the propagation of proximal BCR signaling (Extended Data Fig. 2e). Combined, these results indicated that SREBP signaling is dispensable for B cell maturation and maintenance at homeostatic state.
SREBP signaling controls antibody responses
Next, we asked whether SREBP signaling is required for B cell response to immunization. We immunized mice (SCAPfl/fl CD19Cre/+ versus SCAP+/+CD19Cre/+) subcutaneously with RIBI adjuvanted NP-OVA. To stimulate a recall response, we immunized the mice with intravenous injection of soluble NP-OVA six weeks post primary immunization. Serum samples were harvested at different time points and analyzed by ELISA for NP specific antibodies (Fig. 1a). The ratio of NP2-BSA binding titer (high affinity IgG) versus NP14-BSA binding titer (total IgG) was used to evaluate affinity maturation. We found that SCAPfl/fl CD19Cre/+ mice had blunted IgG antibody generation in both primary and recall responses compared to the control mice (Fig. 1b). In addition to impaired IgG production, SCAP B cell deficiency led to significantly reduced efficiency of affinity maturation, as judged by the IgG NP2/NP14 ratios (Fig. 1b). Despite the reduction of antibody responses, the high affinity IgG levels in the recall response in SCAPfl/fl CD19Cre/+ mice did increase compared to the primary response, suggesting B cell memory was impaired, but not absent in these mice. To further elucidate whether SREBP signaling is required for MBC formation, we i.p immunized mice with RIBI adjuvanted NP-OVA and analyzed isotype switched MBCs four weeks later. In line with the results of antibody responses, the formation of isotype switched MBCs was severely impaired in SCAPfl/fl CD19Cre/+ mice (Extended Data Fig. 3a–b). A subset of isotype switched MBCs expressing CD80 and PD-L2 has been shown to quickly differentiate into antibody secreting plasma cells in response to the corresponding antigen18. Interestingly, the remaining isotype switched MBCs in SCAPfl/fl CD19Cre/+ mice had reduced percentage of this subset (Extended Data Fig. 3a–b).
Fig.1 |. B cell SREBP signaling is important for humoral immune response and memory formation.
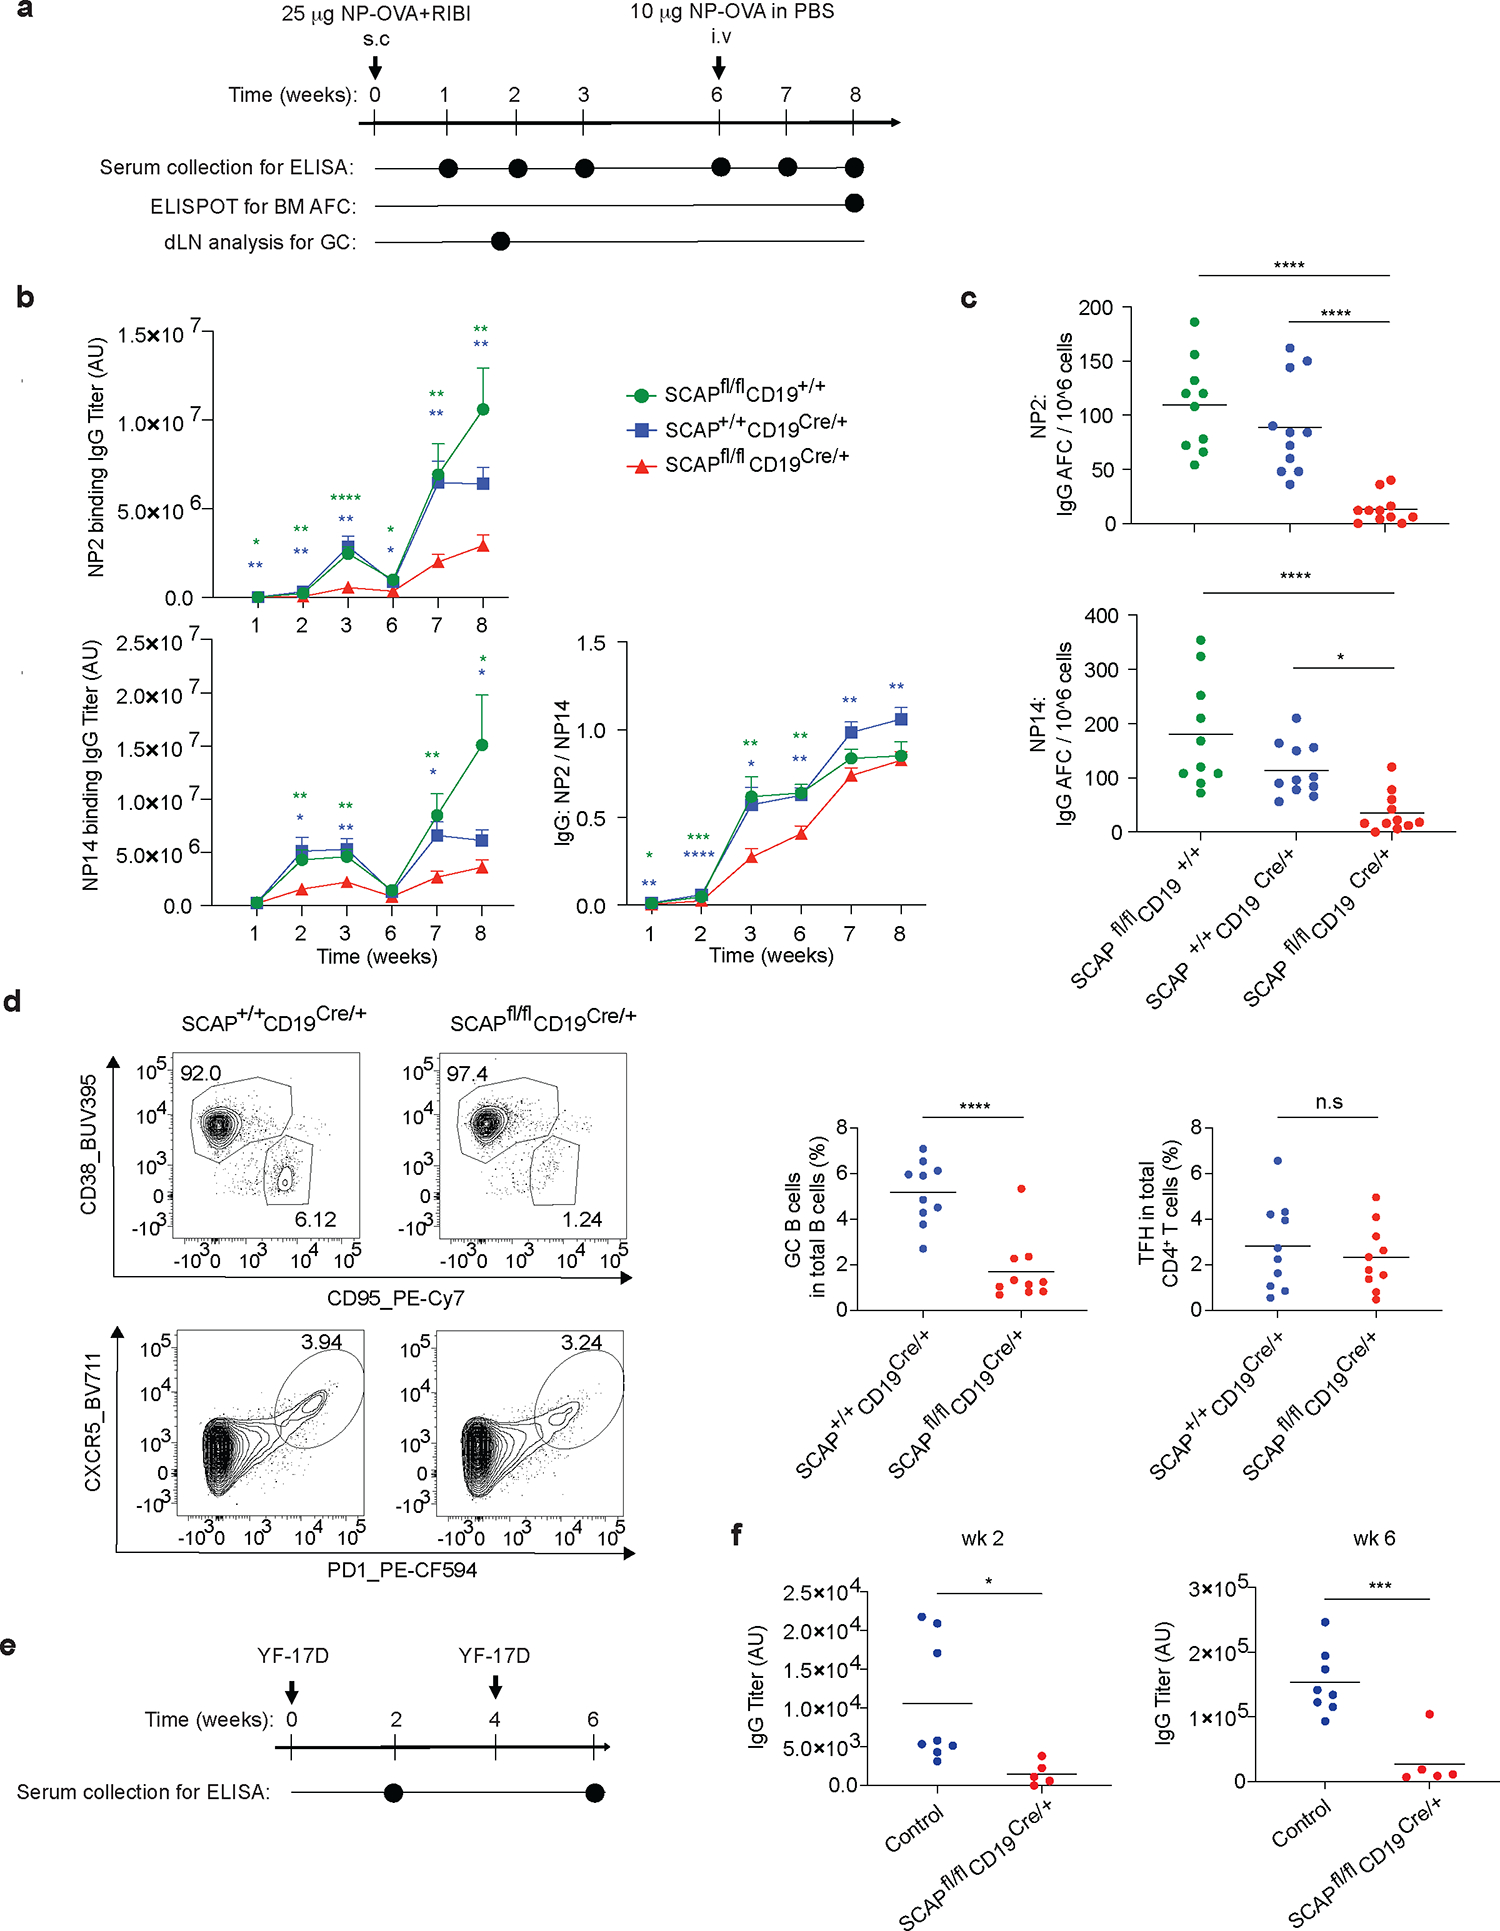
a. Timeline of NP-OVA immunization and analysis. b. ELISA analysis for the kinetics of NP2- and NP14-binding antibody titers (mean ± SEM). c. Antibody forming plasma cells in the bone marrow were analyzed by ELISPOT assay. Data shown in b and c are comparing SCAPfl/fl CD19Cre/+ mice (n=11) with SCAP+/+ CD19Cre/+ (n=11) and SCAPfl/fl CD19+/+ (n=10) mice from 2 independent experiments. d. Mice were subcutaneously immunized with NP-OVA adjuvanted with RIBI. GC B cells and TFH in the draining lymph node were analyzed by FACS day 12 post immunization. Left panel shows the representative FACS plots; right panel shows the statistical analysis of 10 mice from 2 independent experiments. e. Timeline of YF-17D infection and analysis. f. ELISA analysis for the YF-17D binding antibody titer 2 and 6 weeks post YF-17D infection. Shown are data from 2 independent experiments comparing SCAPfl/fl CD19Cre/+ mice (n=5) with control mice (n=8). Control are SCAP+/+ CD19Cre/+ and SCAPfl/fl CD19+/+ mice. d and f, lines in dot plots are means. P values were determined by two-tailed unpaired t-test (b, d, f) or by one-way ANOVA followed by Tukey’s multiple comparisons test (c). P values are *P≤0.05, **P≤0.01, ***P≤0.001, ****P≤0.0001, ns: P>0.05. (blue stars are SCAP+/+ CD19Cre/+ versus SCAPfl/fl CD19Cre/+ and green stars are SCAPfl/fl CD19+/+ versus SCAPfl/fl CD19Cre/+).
Despite reduced IgG antibodies, SCAPfl/fl CD19Cre/+ mice mounted a normal antigen-specific IgM response at week 1 and 2 post immunization, suggesting that the early extrafollicular plasmablast response was not affected by SREBP signaling deficiency (Extended Data Fig. 4).
The durability of antibody responses relies on long-lived PCs in the bone marrow. Therefore, we measured the frequency of antigen specific PCs in the bone marrow by ELISPOT assay. Consistent with the impaired IgG antibody responses in SCAPfl/fl CD19Cre/+ mice, we observed substantially fewer bone marrow plasma cells compared to the control mice (Fig. 1c). GCs play a central role in antibody affinity maturation and the generation of long-lived PCs. The phenotype observed in SCAPfl/fl CD19Cre/+ mice strongly suggested that GC response might be defective in these mice. To test this, we analyzed GC response at peak GC time point (day 12) in mice immunized subcutaneously with NP-OVA adjuvanted by RIBI. Strikingly, there was more than a three-fold reduction of GC B cells in SCAPfl/fl CD19Cre/+ mice compared to WT controls (Fig. 1d). Despite reduced GC B cell numbers, follicular helper T cells (TFH) were present at normal frequencies in SCAPfl/fl CD19Cre/+ mice (Fig. 1d). Although several studies have shown a correlation between the number of GC B cells and the size of the TFH compartment19, our results are consistent with a recent study demonstrating that depletion GC B cells does not affect total CXCR5+PD1hi TFH, but rather leads to reduced frequencies of a small subset of TFH that reside within the GCs20.
To test whether SREBP signaling is also important in antibody response to vaccination with live viral vaccines, we immunized mice with the YF-17D (a live attenuated strain of yellow fever virus, which is one of the most successful vaccines ever developed, having been administered to over 600 million people worldwide14,21) (Fig. 1e). YF-17D is known to stimulate robust innate and adaptive immunity in both humans and mice14,21. Similar to the effects observed with NP-OVA/RIBI vaccination, we found that the antibody response to YF-17D vaccination was significantly reduced in SCAPfl/fl CD19Cre/+ mice, especially after the secondary immunization (Fig. 1f). These data demonstrate a critical role of B cell SREBP signaling in antibody responses in both protein immunization and viral infection.
SREBPs control B cell lipogenesis
Next, we sought to investigate the role of SREBP signaling in regulating B cell activation. B cells can be activated by different signals in response to vaccination or infection. BCR binding to antigen primes B cells, but additional signals are required to achieve optimal activation22. TLR ligands, associated with pathogens or vaccine adjuvants, directly active B cells through TLRs to promote antibody response23,24. CD40L, the major help signal from T cells, binds CD40 on B cells, which is essential for the initiation and maintenance of the GCs5,25. To investigate the role of SREBP signaling in B cells activated by these important signals, we isolated B cells from SCAP deficient mice (SCAPfl/fl CD19Cre/+) and control mice (SCAP+/+ CD19Cre/+). The cells were stimulated for 24 hours with LPS, ⍺-CD40 antibody or ⍺-IgM antibody, which can stimulate TLR4 signaling, CD40 signaling and BCR signaling, respectively. Then RNA sequencing was used to examine the gene expression profile of stimulated and unstimulated (time 0) B cells. Because SREBP signaling is well known to activate the lipogenic genes10, we first focused on the genes involved in sterol (including terpenoid backbone biosynthesis) synthesis and fatty acid metabolism (Fig. 2a and Extended Data Fig. 5). Strikingly, we found that most of the genes involved in sterol biosynthesis were highly upregulated in WT B cells when activated by these signals, suggesting that B cell activation is associated with reprogramed lipid metabolism (Fig. 2a and Extended Data Fig. 5). In contrast to WT B cells, SCAP deficiency profoundly suppressed the regulation of these genes involved in sterol biosynthesis, including genes encoding critical enzymes such as Hmgcr, Hmgcs1, Sqle, and Dhcr24 (Fig. 2a and Extended Data Fig. 5). For fatty acid metabolism, LPS stimulation strongly induced the expression of genes encoding rate-limiting enzymes such as Acaca and Fasn in WT B cells, but not SCAP deficient B cells. Interestingly, all stimulations significantly increased the expression of Acsl3 and Acsl4 in WT but not SCAP deficient B cells (Fig. 2a). Acsl genes encodes long-chain acyl-CoA synthetases (ACSLs), enzymes catalyzing fatty acids to fatty acyl-CoA, which is required for their participation in lipogenesis, β-oxidation, protein fatty acylation, and other biological processes26, suggesting SREBP signaling might regulate these important processes in B cells. Pathway analysis further confirmed that lipid biosynthesis pathways were among the highly impacted pathways associated with SCAP deficiency in B cells (Fig. 2b and Extended Data Fig. 6). In addition to lipid biosynthesis, we found that SCAP deficiency also impacted other pathways that are critical for B cell activation, such as pathways regulating cell cycle progression and energy metabolism (Fig. 2b and Extended Data Fig. 6).
Fig.2 |. RNA-seq analysis for pathways associated with SREBP signaling in B cells.
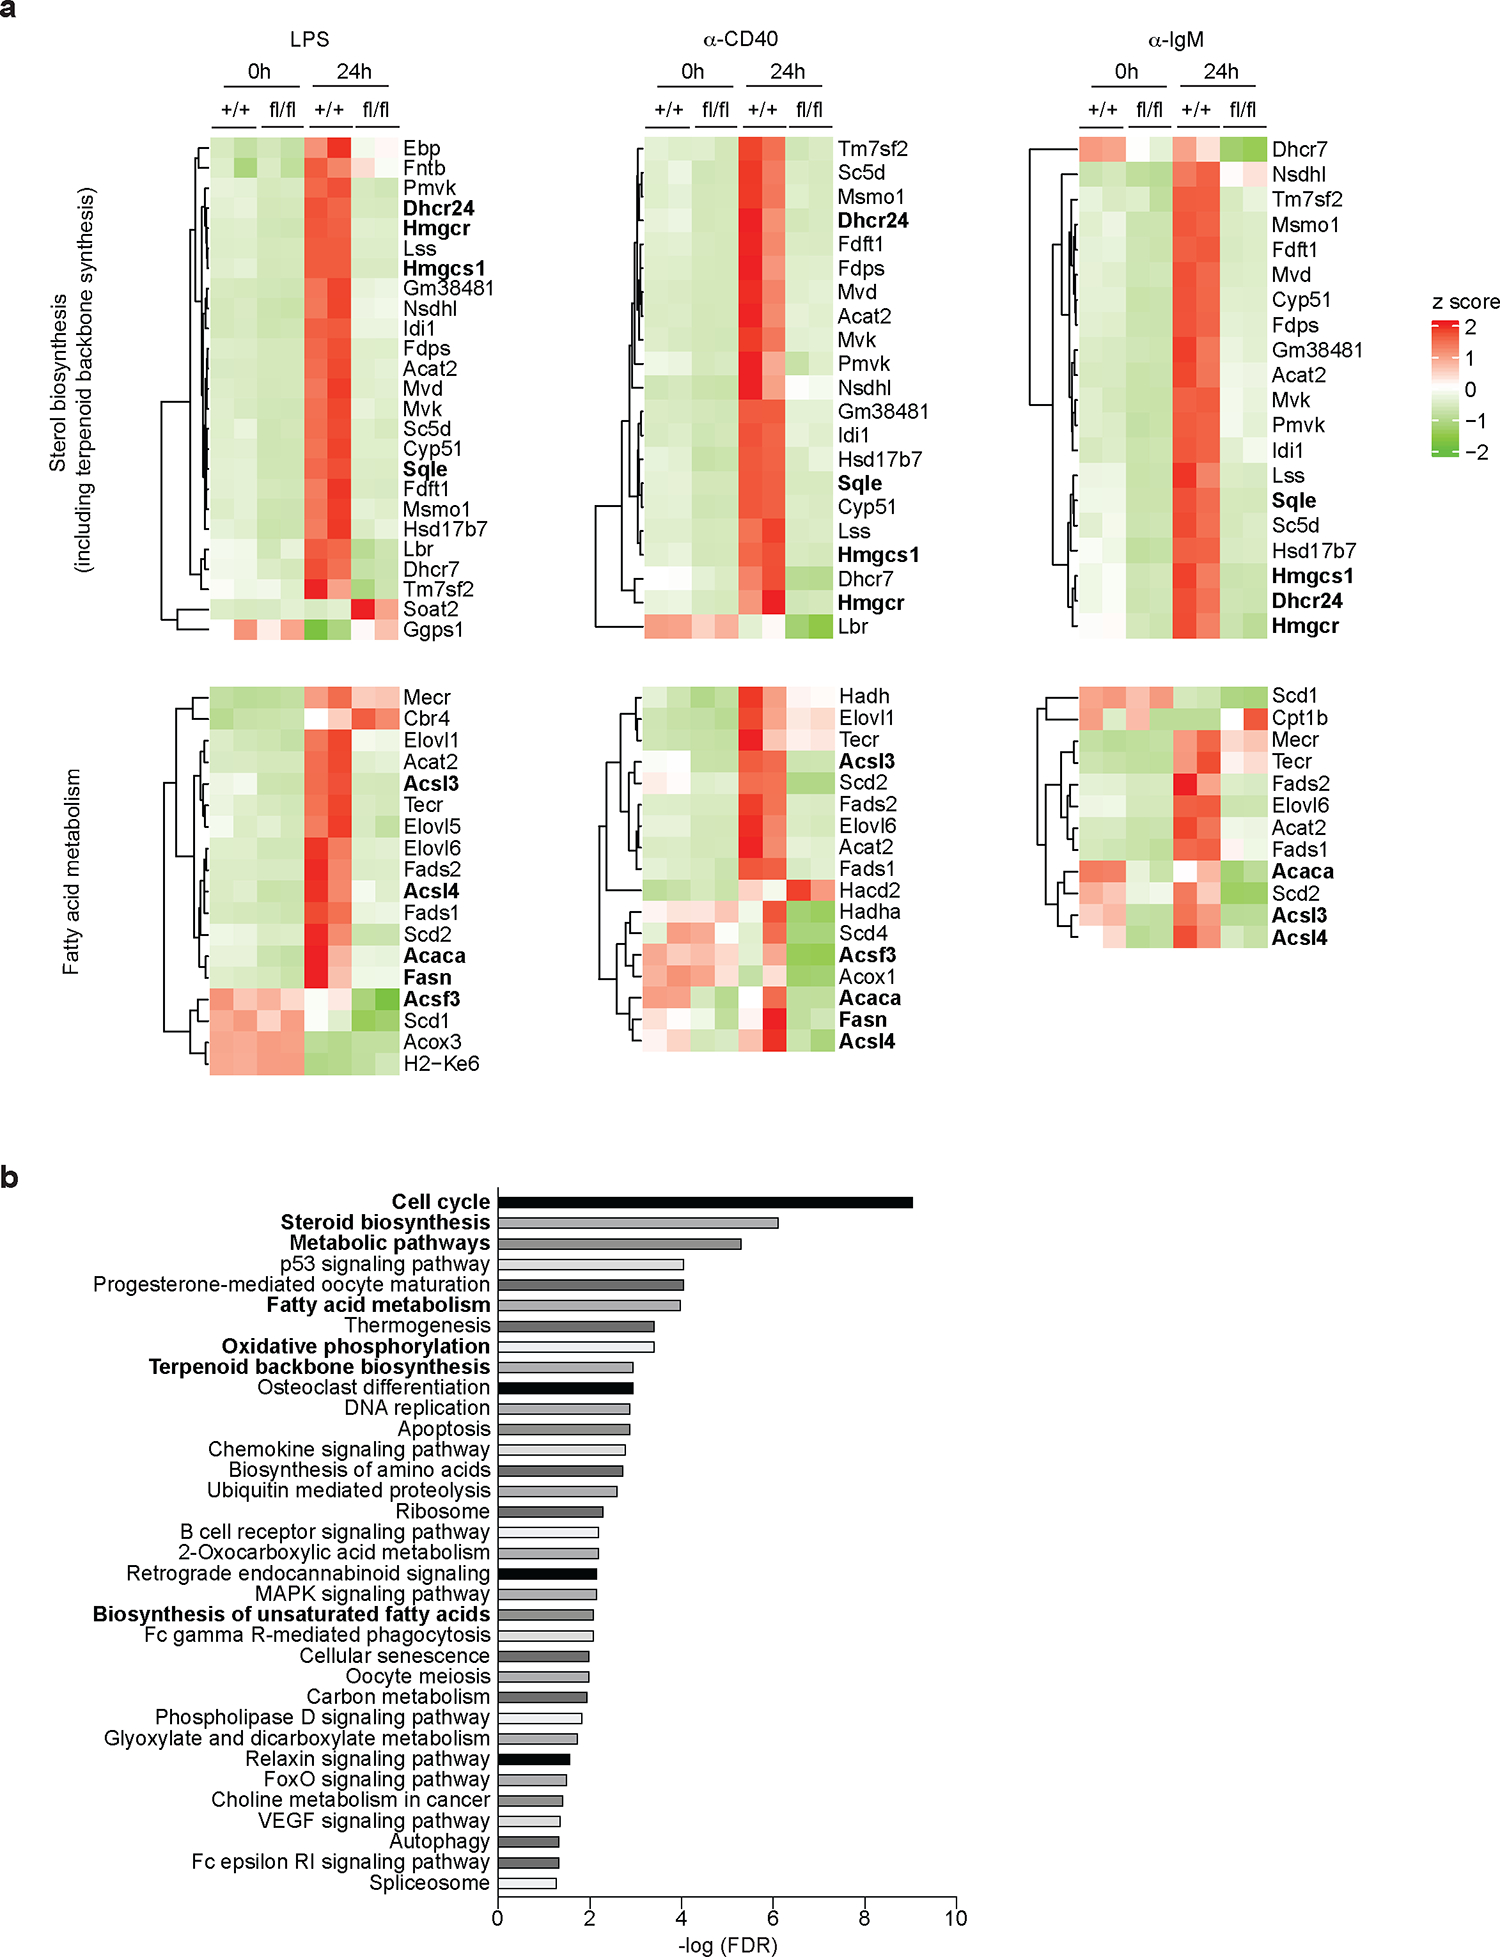
a-b. Splenic B cells were bead-purified from SCAP+/+ CD19Cre/+ (+/+) mice and SCAPfl/fl CD19Cre/+ (fl/fl) mice. Cells were then stimulated with 10μg/ml LPS, 5μg/ml ⍺-CD40 tetramer or 20μg/ml ⍺-IgM for 0 (as control) and 24 hours. RNA was isolated from the cells and analyzed by RNA sequencing. a. Heat map shows the change of genes involved in sterol biosynthesis and fatty acid metabolism. b. Pathways ranked by FDR (<0.05) that were altered in SCAPfl/fl CD19Cre/+ mice compared to SCAP+/+ CD19Cre/+ mice 24 hours post ⍺-CD40 stimulation. RNA samples were from 2 independent experiments with cells pooled from 5 mice in each experiment.
SREBP signaling controls B cell proliferation
To further investigate the role of SREBP signaling in B cells activated by mitogenic signals, we isolated B cells from SCAP deficient mice (SCAPfl/fl CD19Cre/+) and control mice (SCAP+/+ CD19Cre/+) and labeled them with CFSE prior to stimulation with TLR4 ligand (LPS), TLR7/8 agonist (R848), TLR9 agonist (CpG) for 3 days, or ⍺-CD40 for 5 days. Based on CFSE dilution as a measure of proliferation, most WT B cells had divided 2–5 times after different TLR or CD40 stimulation. By contrast, most SCAP deficient B cells were unable to divide at all, suggesting SREBP signaling is required for mitogen induced B cell division (Fig. 3a–b). BCR stimulation with ⍺-IgM alone may induce cell death. The viability of 48h ⍺-IgM stimulated WT B cells is 63% and the viability was significantly reduced to 35% for SCAP deficient B cells (Extended Data Fig. 7), indicating SREBP signaling is important in supporting B cell survival when stimulated with BCR signal. To determine which phases of the cell cycle are affected, we stimulated B cells for 48 hours and then did cell cycle analysis. As shown in Fig. 3c–d, SCAP deficient B cells activated by CD40 or BCR signal were blocked from entering S phase. Interestingly, LPS stimulated SCAP deficient B cells could still enter early S phase, however, they could not progress from early S phase into late S phase (Fig. 3c–d). These findings strongly support the role of the SREBP signaling as a checkpoint regulator for cell cycle progression in activated B cells. To test whether the observed defective cell cycle progression in vitro is dependent on cholesterol homeostasis, we supplemented the culture medium with extra cholesterol during B cell activation by LPS. Strikingly, cholesterol supplementation restored proliferation of SCAP deficient B cells (Fig. 3e–f), suggesting that the shortage of cellular cholesterol was indeed the cause of this phenotype.
Fig.3 |. B cell SREBP signaling is required for mitogen stimulated cell cycle progression.
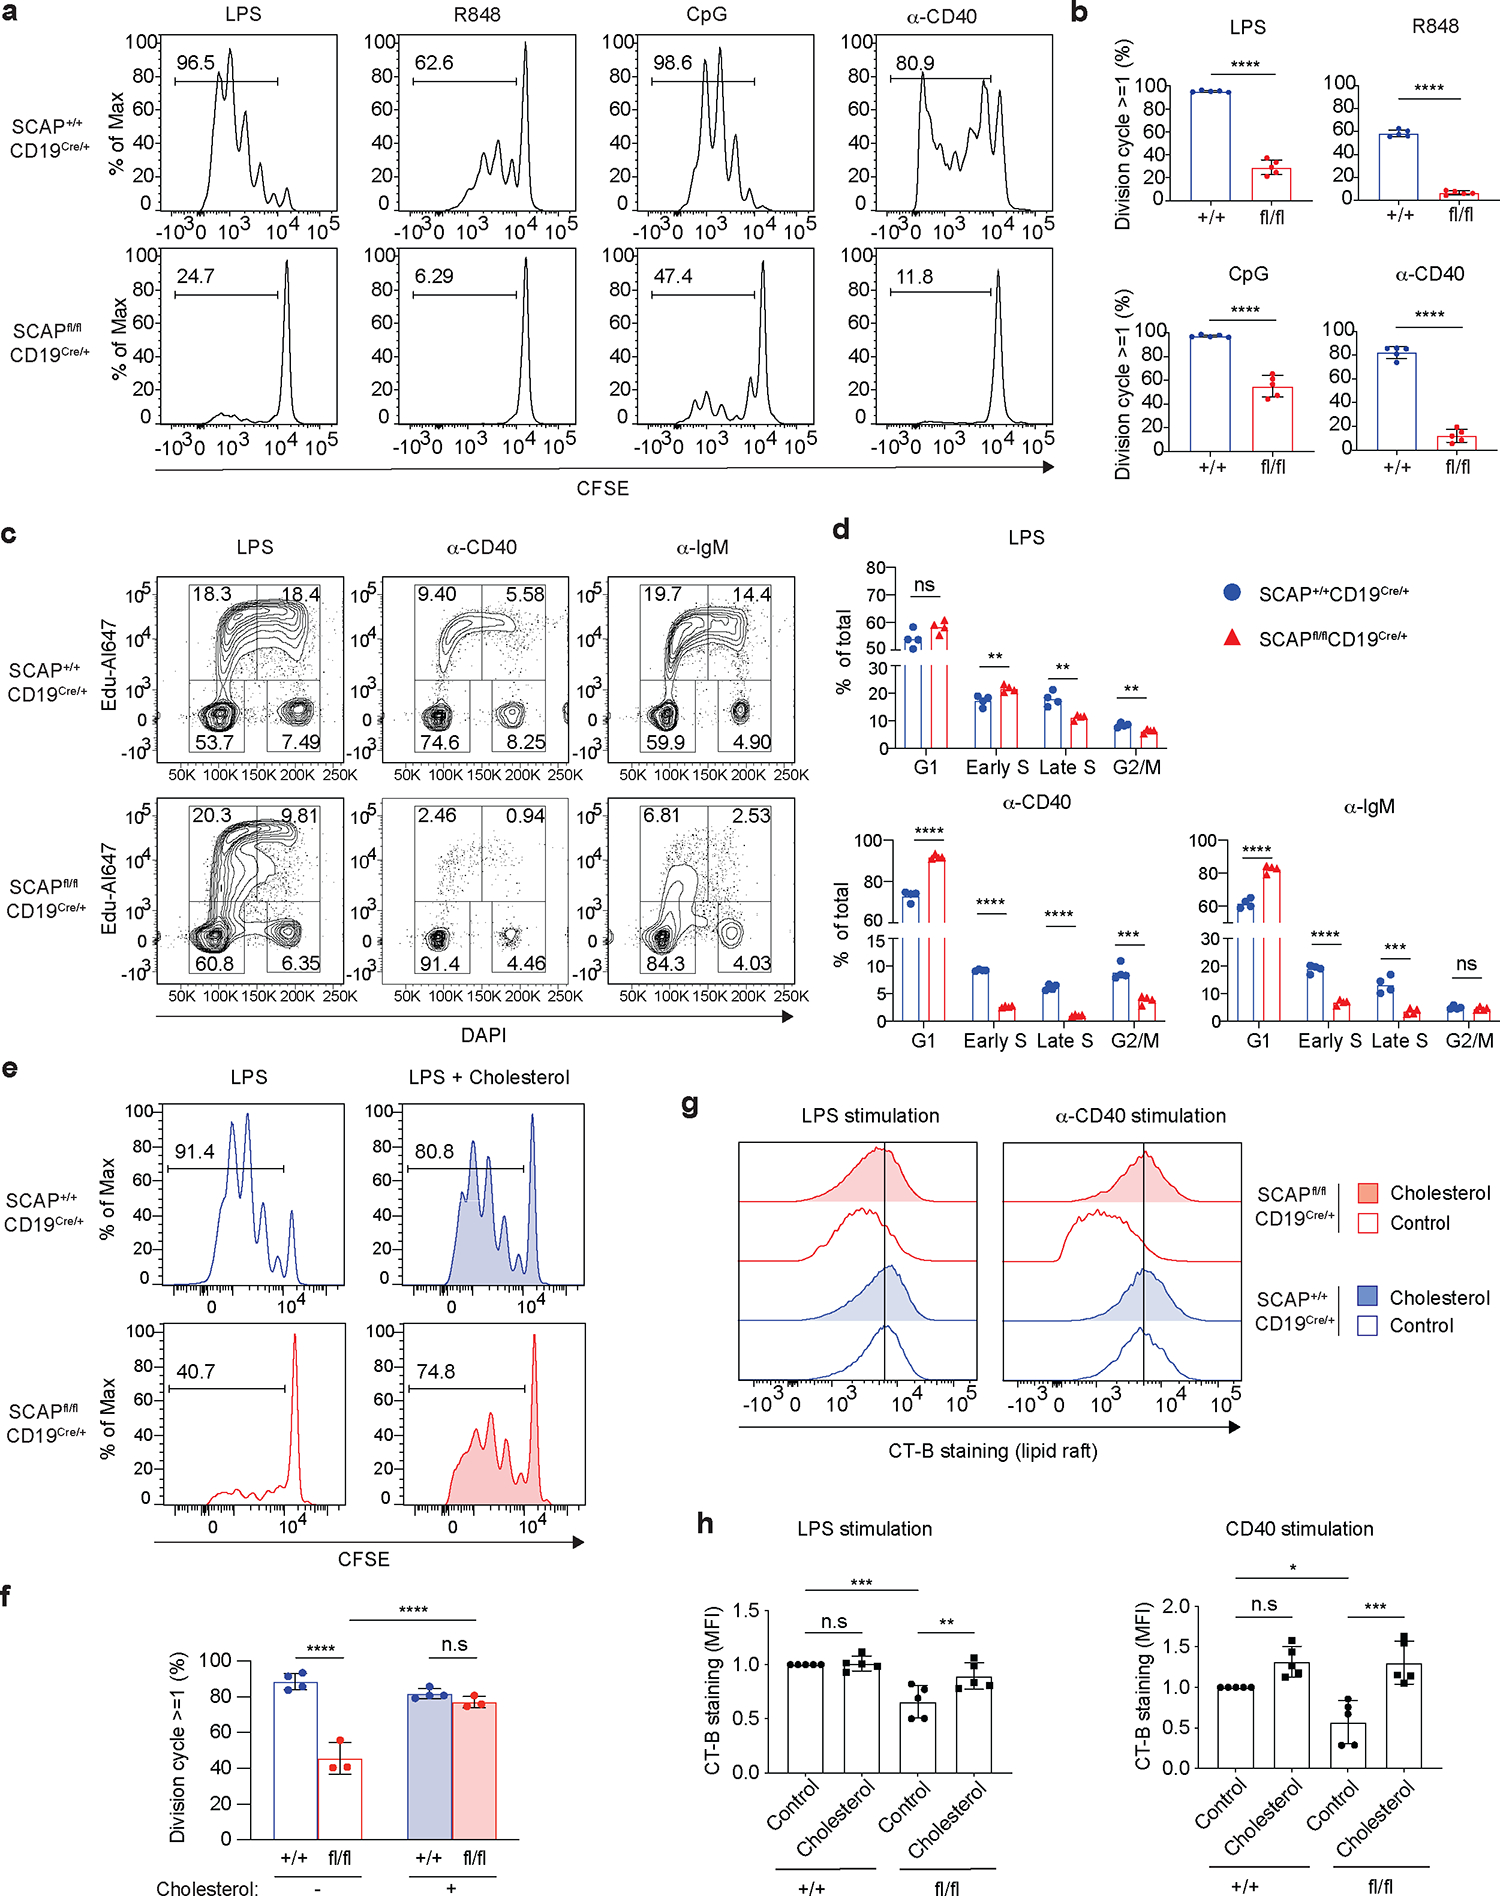
a-b. Splenic B cells isolated from SCAP+/+ CD19Cre/+ (+/+) mice and SCAPfl/fl CD19Cre/+ (fl/fl) mice were labeled with CFSE. Then cells were stimulated with 10μg/ml LPS, 10μg/ml CpG or 10μg/ml R848 for 3 days, or 5μg/ml ⍺-CD40 tetramer for 5 days. Cell proliferation was examined by CFSE dilution using FACS. a. The representative histogram of CFSE dilution; b. The statistical analysis of 5 mice from 2 independent experiments (mean ± SD). c-d. Splenic B cells were stimulated with 10μg/ml LPS, 5μg/ml ⍺-CD40 tetramer or 20μg/ml ⍺-IgM for 48 hours. Cell cycle phases (G1, S, G2/M) were analyzed by FACS with EdU and DAPI. c. The representative FACS plots showing EdU and DAPI staining. d. The statistical analysis of 4 mice from 2 independent experiments (mean). e-f. Splenic B cells were stimulated with 10μg/mL LPS and cultured with or without 5μg/mL MβCD conjugated cholesterol for 3 days. e. The representative histogram of CFSE dye dilution. f. Quantification of B cell division of 4 +/+ and 3 fl/fl mice from 2 independent experiments (mean ± SD). g-h. Splenic B cells were stimulated with 10μg/mL LPS or 5μg/ml α-CD40 tetramer and cultured with or without 5μg/mL MβCD conjugated cholesterol for 48 hours. Lipid raft was analyzed by FACS with CT-B staining. g. The histogram of CT-B staining. h. The statistical analysis of 5 mice from 2 independent experiments (mean ± SD). MFI values were normalized to +/+ samples with control given a value of 1. P values were determined by two-tailed unpaired t-test (b, d) or by one-way ANOVA followed by Tukey’s multiple comparisons test (f, h). *P≤0.05, **P≤0.01, ***P≤0.001, ****P≤0.0001, ns: P>0.05.
Despite that SCAP deficient B cells have normal lipid rafts at resting state (Extended Data Fig. 2d), reduced proliferation of stimulated SCAP deficient B cells promoted us to examine lipid rafts in these cells. Indeed, both LPS and ⍺-CD40 stimulated SCAP deficient B cells had reduced lipid raft content compared to WT B cells as probed by CT-B staining (Fig. 3g–h). Similar to proliferation, this phenotype can also be fully restored by cholesterol supplementation in the culture medium (Fig. 3g–h). These experiments highlight an essential role of SREBP signaling mediated cholesterol homeostasis in regulating lipid rafts and signaling in activated B cells.
SREBP signaling regulates B cell energy metabolism and signaling
B cell activation is accompanied by reprogramed energy metabolism, in which both glycolysis and mitochondrial mediated OXPHOS are elevated to support energy demands as well as cell growth and division6,27. Fatty acids are an important source of carbon fuel used in OXPHOS. Since SREBP signaling controls lipid homeostasis, we asked whether deficiency in SREBP signaling might affect the energy metabolism in activated B cells. Critically, our RNA-seq analysis revealed that in activated B cells, SREBP signaling is essential in the induction of Acyl-CoA synthetases family genes including Acsl3, Acsl4 and Acsf3 (Fig. 2a), which are involved in mitochondrial metabolism26,28. Based on these data, we hypothesized that SREBP signaling might regulate OXPHOS to affect energy metabolism in activated B cells. To test this, we used “Seahorse” technology to assess OXPHOS and glycolysis by measuring Oxygen Consumption Rate (OCR) and Proton Efflux Rate (PER), respectively. Indeed, we found that SCAP deficient B cells had decreased basal OXPHOS activity as compared to WT B cells (Fig. 4a–b). The respiratory capacity (maximal respiration) was also significantly reduced in SCAP deficient B cells activated by CD40 stimulation. Despite a similar trend, this was not statistically significant for LPS or BCR stimulation (Fig. 4a–b). Surprisingly, basal glycolysis was also decreased with SCAP deficiency (Fig. 4a, c). In activated WT B cells, there was a compensatory increase of glycolysis when OXPHOS was inhibited by rotenone (ROT) and antimycin A (AA) (Fig. 4a, c). Notably, we observed this compensatory increase of glycolysis in SCAP deficient B cells; however, it was reduced in magnitude compared to WT B cells (Fig. 4a, c). Taken together, these results highlight a critical connection between SREBP signaling and energy metabolism in activated B cells.
Fig.4 |. SREBP signaling regulates energy metabolism in activated B cells.
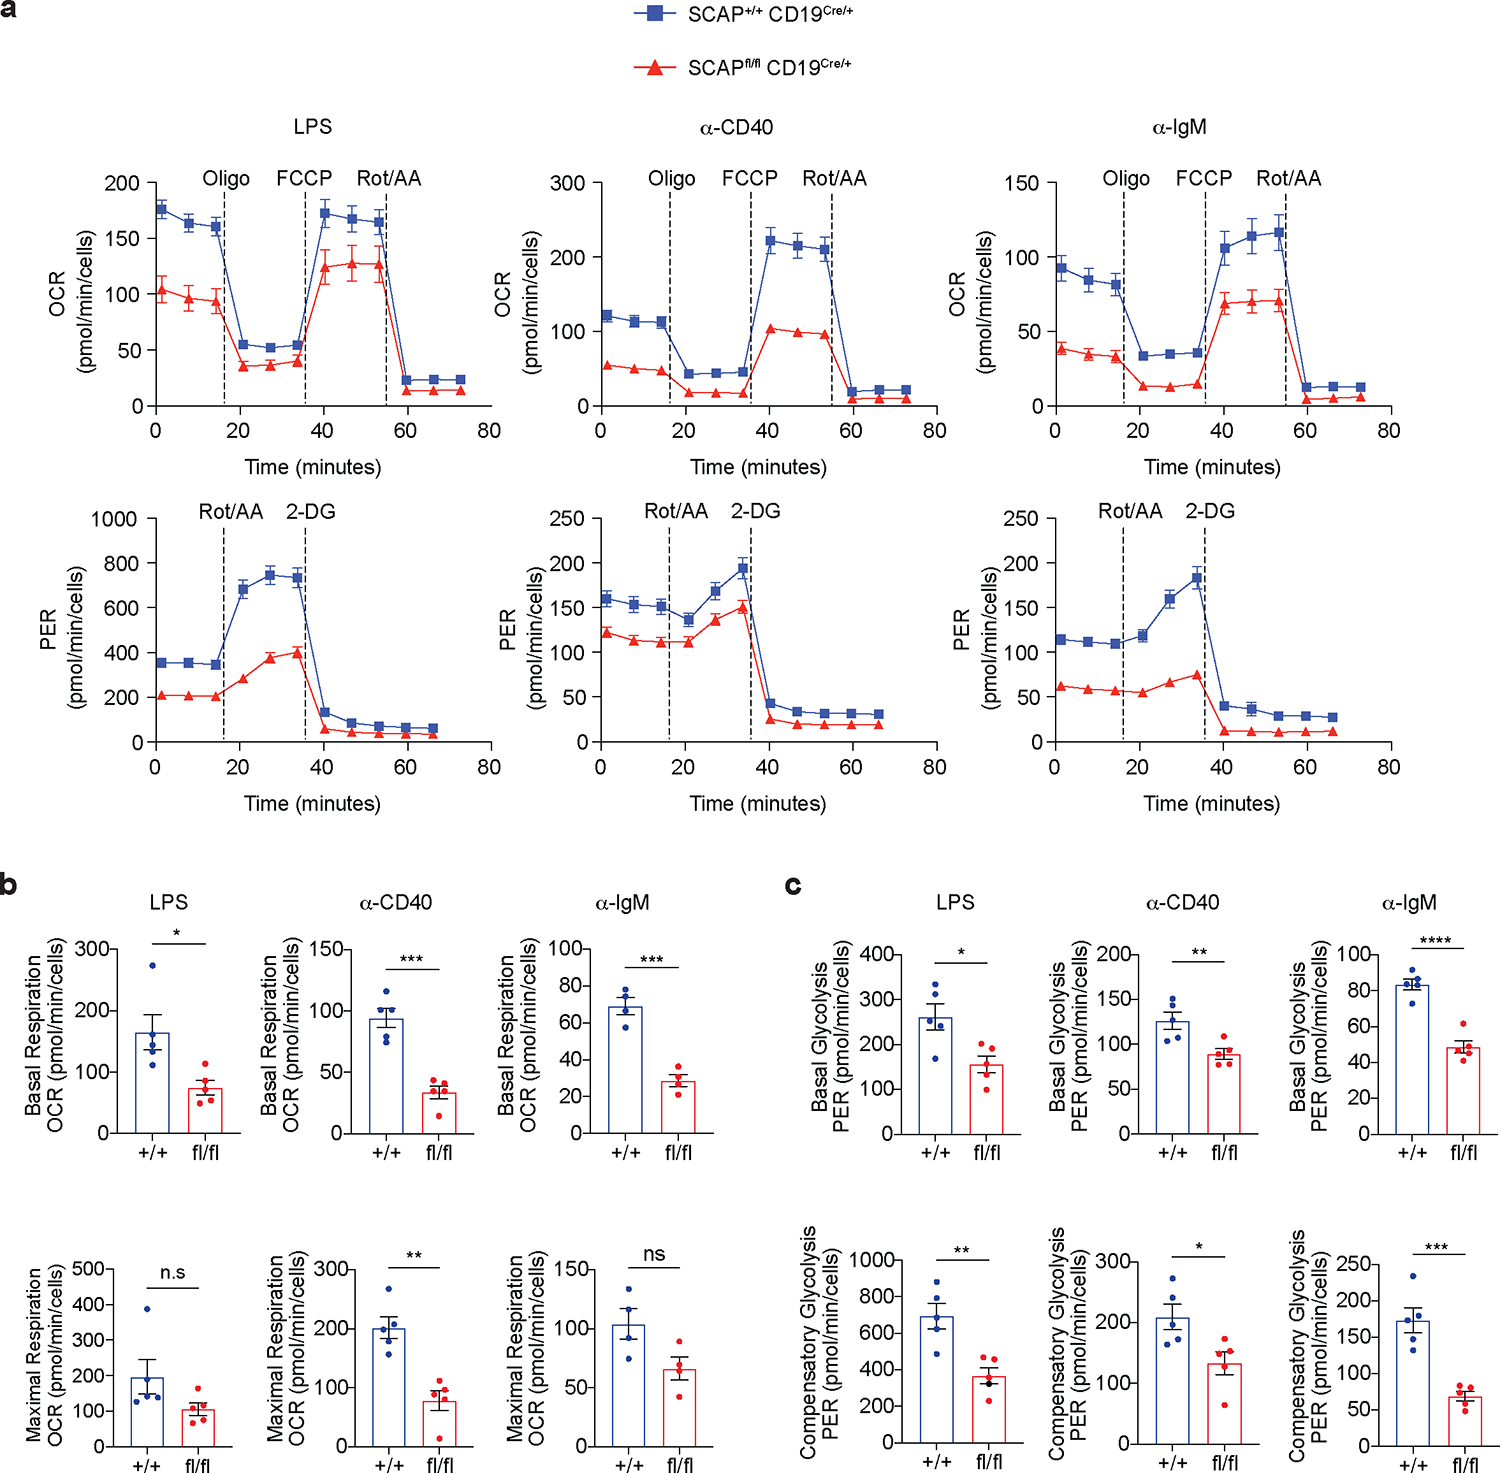
a-c. B cells isolated from SCAP+/+ CD19Cre/+ (+/+) mice and SCAPfl/fl CD19Cre/+ (fl/fl) mice were stimulated with 10μg/ml LPS, 5μg/ml ⍺-CD40 tetramer or 20μg/ml ⍺-IgM for 48 hours. Seahorse technology was used to examine cell energy metabolism. Mitochondrial oxidative phosphorylation and glycolysis were evaluated by oxygen consumption rate (OCR) and proton efflux rate (PER), respectively. a. The representative data of OCR (n=5 for LPS and ⍺-CD40; n=4 for ⍺-IgM) and PER (n=5 for all treatments). Data represents 2 independent experiments. b-c. The statistical analysis. Data are mean ± SEM. P values were determined by two-tailed unpaired t-test. *P≤0.05, **P≤0.01, ***P≤0.001, ****P≤0.0001, ns: P>0.05.
Next, we asked whether the dysregulated cell cycle progression and metabolism observed in SCAP deficient B cells, was linked to altered signaling. mTORC1 signaling plays a pivotal role in regulating cell cycle progression29 and metabolism30. mTORC1 directly phosphorylates of P70S6 kinase (P70S6K), which further phosphorylate S629. To examine mTORC1 signaling, we stimulated B cells for 4 and 24 hours and probed cell lysates for the phosphorylation of P70S6K and S6. As shown in Extended Data Fig. 8a–b, we found that the phosphorylation of P70S6K and S6 were normal in SCAP deficient B cells 4 hours post LPS, ⍺-CD40 or ⍺-IgM stimulation. These results are in line with our findings showing that SCAP deficiency is dispensable for B cell proximal signaling (Extended Data Fig. 2e). However, 24 hours post stimulation, both p-P70S6K and p-S6 were reduced in SCAP deficient B cells compared to WT B cells (Extended Data Fig. 8a–b). mTORC1 has been shown to regulate lipid synthesis by regulating SREBP activity31,32. These findings suggest that SREBP signaling might also provide feedback to regulate mTORC1, which might impact cell cycle progression and metabolism. AKT, ERK and P38 activity can promote mTORC1 signaling33,34. Next, we tested which of these pathways can be affected by SCAP deficiency. We found that AKT phosphorylation was indeed reduced in SCAP deficient B cells after 24-hour stimulation (Extended Data Fig. 8a–b). Surprisingly, SCAP deficient B cells had substantially increased phosphorylation of both ERK and P38 24 hours post stimulation, suggesting that the activity of ERK and P38 might be uncoupled from mTORC1 signaling, cell cycle progression, and metabolic status in SCAP deficient B cells (Extended Data Fig. 8a–b). Since cholesterol supplementation could rescue proliferation and lipid raft defects observed in SCAP deficient B cells (Fig. 3e–h), we asked whether it can also affect cell signaling. Indeed, we found that cholesterol supplementation can partially normalized p-P70S6K, p-ERK and p-P38 in SCAP deficient B cells 24 hours post stimulation (Extended Data Fig. 8c).
Metabolomics reveals global metabolic changes
Cellular metabolism regulates almost all critical cellular activities including cell growth, proliferation, energy homeostasis and signaling transduction35,36. Based on our findings, we hypothesized that the multiple defects observed in SREBP deficient B cells are associated with an altered global metabolic state. To test this hypothesis, we stimulated B cells isolated from SCAP deficient mice (SCAPfl/fl CD19Cre/+) and control mice (SCAP+/+ CD19Cre/+) with ⍺-CD40 or LPS for 24 and 48 hours, followed by targeted metabolomics analysis to evaluate global metabolic changes. Principal component analysis (PCA) demonstrated that stimulated B cells display a unique metabolic profile compared with unstimulated freshly isolated B cells (separated along PC1) (Fig. 5a and Extended Data Fig. 9a). The metabolic profiles of unstimulated SCAP deficient and WT B cells were largely overlapping, corroborating our findings that SCAP deficiency did not affect B cell maturation or their metabolic profile at steady state. In contrast, after stimulation with either LPS or ⍺-CD40, SCAP deficient and WT B cells were clearly separated (primarily along PC2) at 24 hours, with an even more pronounced separation at 48 hours (Fig. 5a and Extended Data Fig. 9a). Interestingly, LPS and ⍺-CD40 stimulated samples differed significantly in PC2, suggesting these signals can induce different cellular metabolic programs. Differential abundance analysis indicated that, compared to controls, SCAP deficiency resulted in 74 and 62 significantly changed metabolites in 48h ⍺-CD40 and LPS stimulated cells respectively (Fig. 5b). Among these changed metabolites, around half (31) were shared between LPS and ⍺-CD40 stimulation. Of the altered metabolites (Fig 5c and Extended Data Fig. 9b–c), many were ceramides and sphingolipids. Ceramides and sphingolipids are known as upstream regulators of SREBP activity37,38. However, these findings suggest that SREBP signaling can also impact the metabolism of many ceramides and sphingolipids. Among these lipids, lactosyl-N-palmitoyl-sphingosine (d18:1/16:0), one of the lactosylceramides (LacCer), is highly accumulated in SCAP deficient B cells activated by either ⍺-CD40 or LPS (Fig. 5c and Extended Data Fig. 9b–c). LacCer has been shown to induce oxidative stress, regulate MAPK signaling and contribute to mitochondrial dysfunction39–42, suggesting the accumulation of LacCer in SCAP deficient B cells might contribute to the altered energy metabolism and cell signaling as shown in Fig. 4 and Extended Data Fig. 8.
Fig.5 |. Metabolomics reveals global metabolic changes in SCAP deficient B cell.
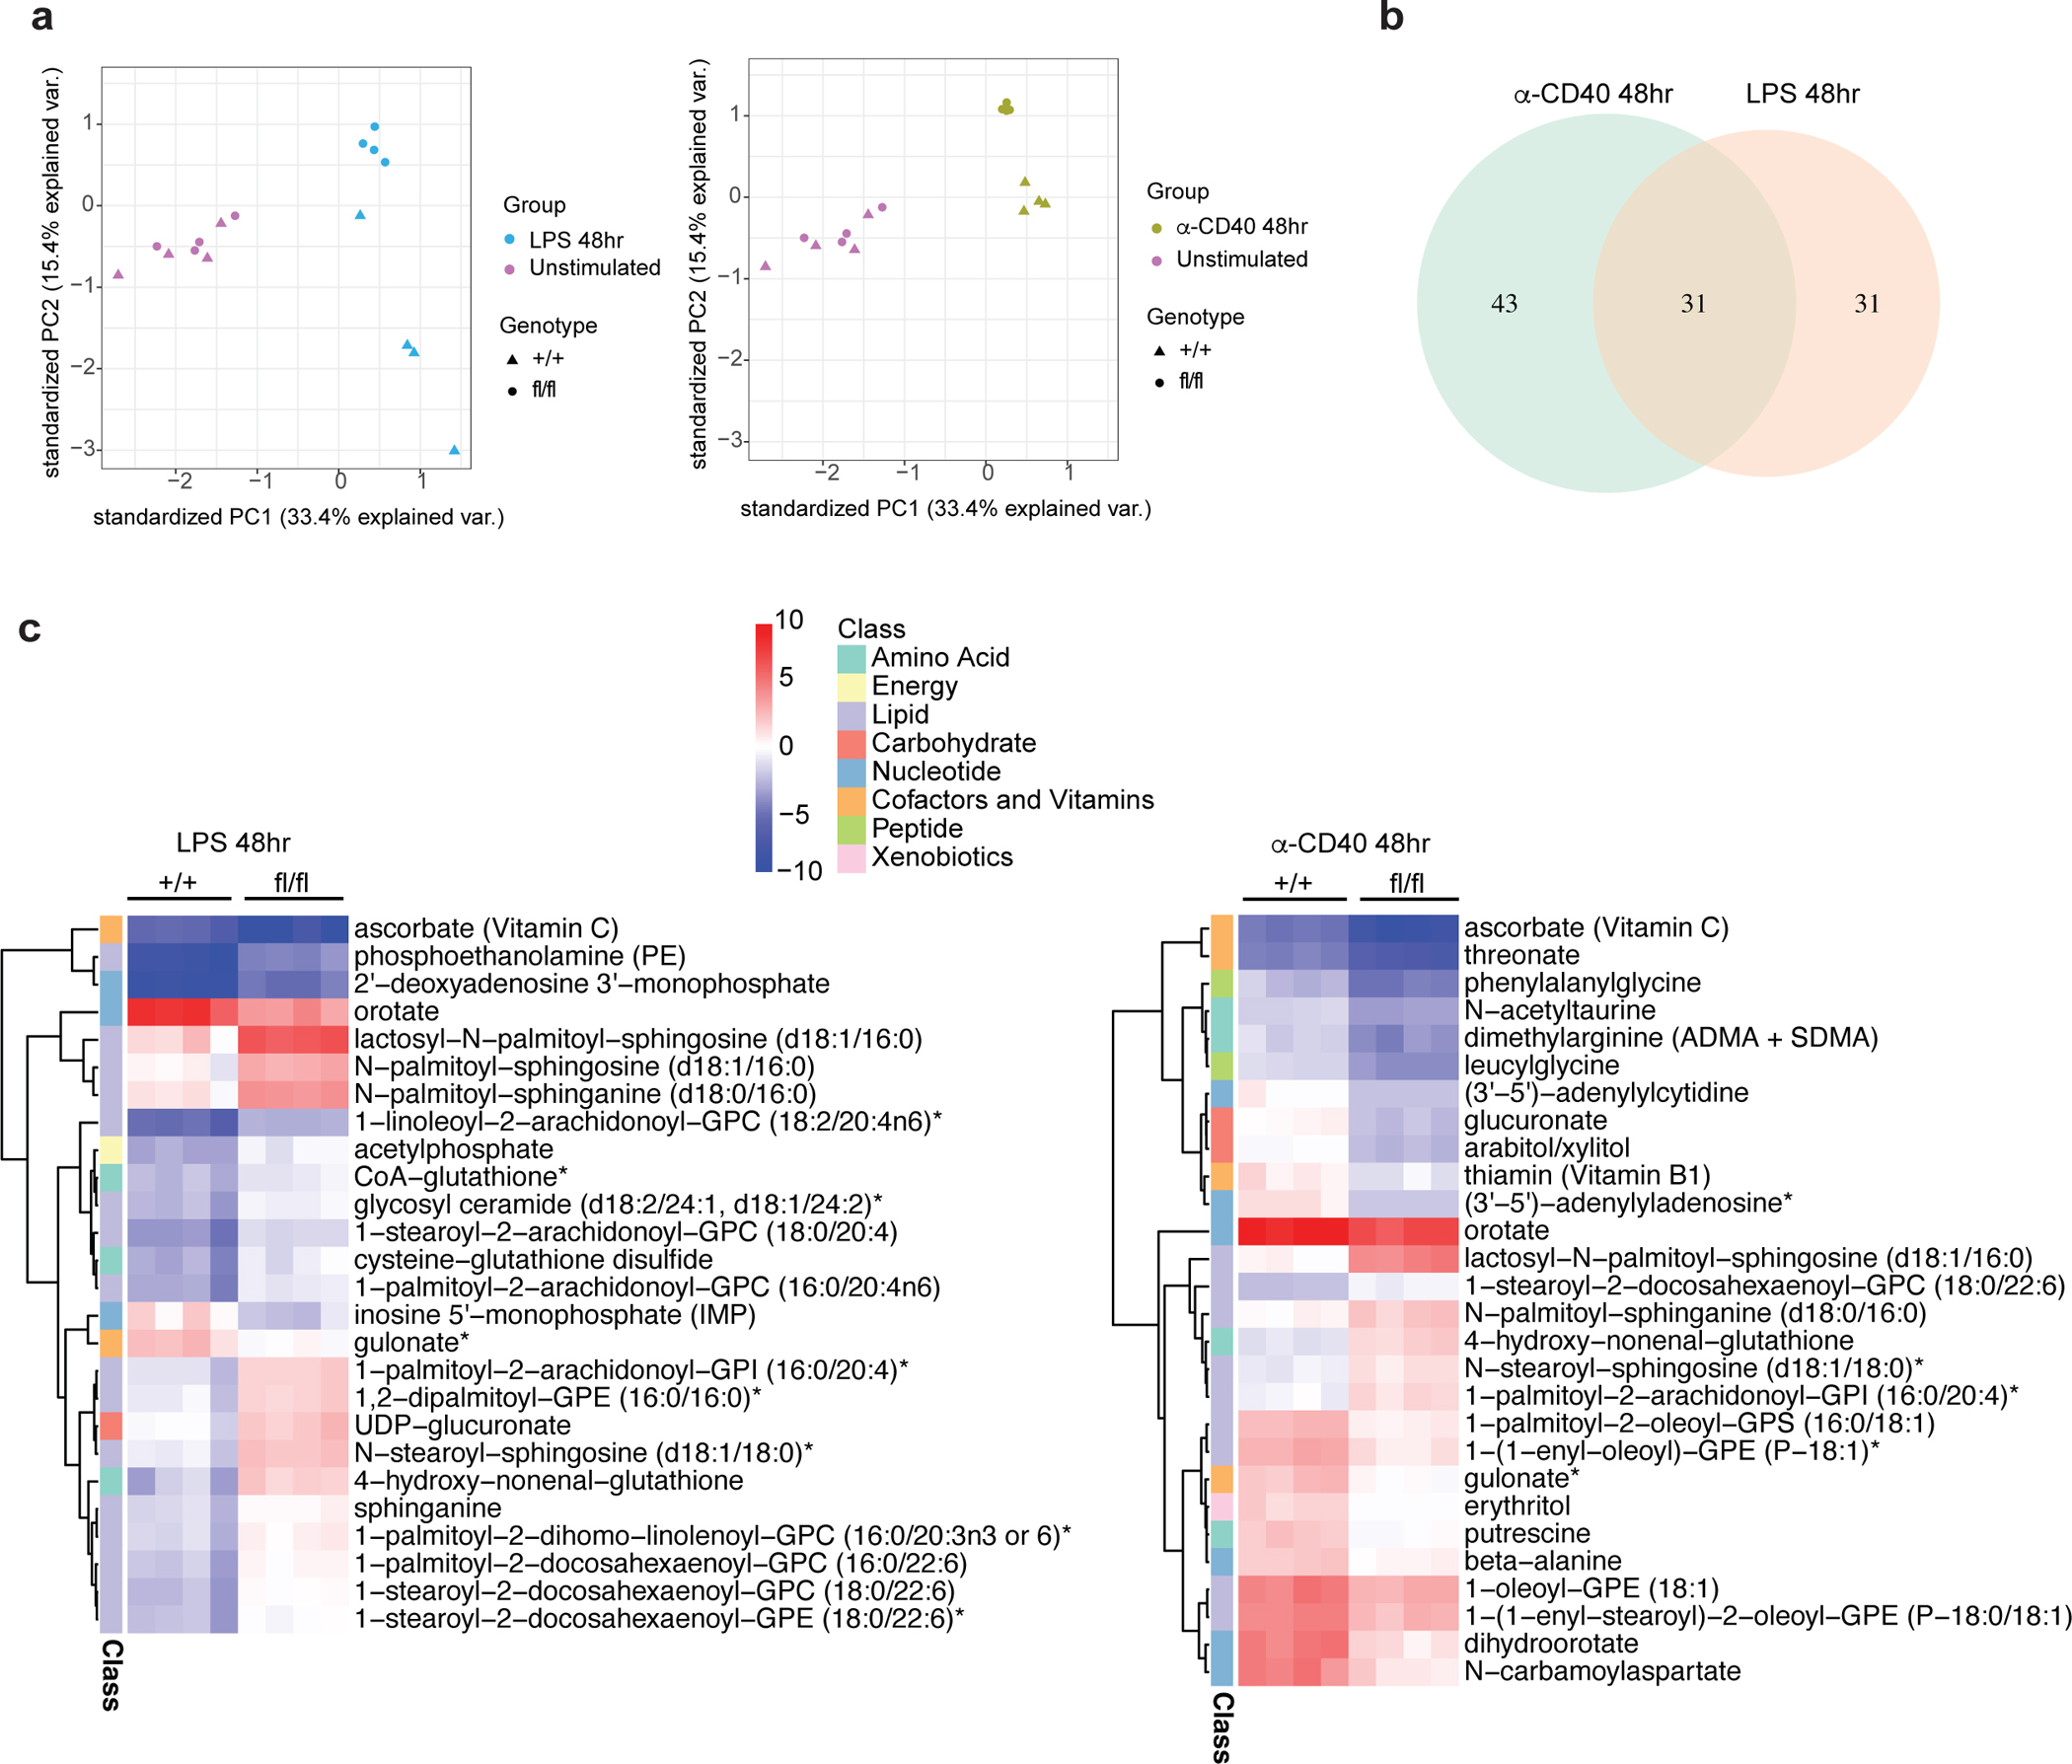
a-c. Splenic B cells isolated from SCAP+/+ CD19Cre/+ (+/+) and SCAPfl/fl CD19Cre/+ (fl/fl) mice were stimulated with 10μg/ml LPS or 5μg/ml α-CD40 tetramer for 24 and 48 hours. Cells were then analyzed by metabolomics. a. PCA plot showing the differences of all replicates between different treatments in different genotypes of unstimulated and 48 hours stimulated samples. b. Venn diagram of unique and common metabolites significantly differentially altered (FDR < 0.05, log2 Fold Change >1) in SCAP deficient B cells compared to WT B cells upon 48 hours stimulation of LPS and ⍺-CD40. c. Heatmap of altered metabolites (FDR < 0.01, log2 Fold Change >1.5) marked by their pathways. Colors represent log2 FC relative to the untreated corresponding genotype samples. Four biological replicates generated from two experiments were used for metabolomics analysis.
Strikingly, besides lipid metabolism, SCAP deficiency also alters many other metabolites that belong to different metabolic pathways such as energy, amino acids, peptide, cofactors and vitamins, nucleotide, carbohydrate, and xenobiotics (Fig. 5c and Extended Data Fig. 9b–c). For example, the activation of SCAP deficient B cells led to the upregulation of 4-hydroxy-nonenal-glutathione, a biomarker of oxidative stress43. Another example is the exhaustion of thiamin (Vitamin B1) in activated SCAP deficient B cells, which might contribute to the compromised energy metabolism in these cells. In addition, SCAP deficient B cells had altered metabolites involved in nucleotide metabolism, and these changes might contribute to their impaired cell cycle progression. Taken together, the metabolomics analysis revealed previously unrecognized roles of SREBP signaling in regulating multiple cellular activities in activated B cells.
SREBP signaling controls GC response
Based on these in vitro studies, we hypothesized that SREBP signaling is important in regulating lipid homeostasis and cell cycle progression in highly proliferative GC B cells in vivo. First, we compared GC B cells with naïve B cells for the expression of key regulators in lipid biosynthesis that are downstream of SREBP signaling, such as 3-hydroxy-3-methylglutaryl coenzyme A reductase (HMGCR), low-density lipoprotein receptor (LDLR) and fatty acid synthase (FASN). Immunoblotting of cell lysates demonstrated that GC B cells express higher levels of HMGCR, LDLR and FASN compared to naïve B cells, highlighting the elevated SREBP signaling in GC B cells (Fig. 6a). To further examine the functions of SREBP signaling in GC B cells, we generated SCAPfl/fl AID-Cre R26YFP mice to ablate SREBP signaling specifically in GC B cells. In these mice, Cre activated expression of YFP can be used to monitor Cre activity. Using YFP as reporter, we found that the majority (~60%) of GC B cells are YFP+. By contrast, very few YPF+ cells were found in the B cell population expressing activation markers CD86 and MHCII (Extended Data Fig. 10a–b). These results confirmed that Cre activity in AID-Cre R26YFP mice shows selectivity to GC B cells. Nevertheless, the potential expression of AID-Cre in pre-germinal center, isotope-switched cells cannot be excluded with the current data, and must await the development of genetic models that can be used to delete genes from GC cells in a highly specific manner. To analyze GC response and generate enough GC B cells for bulk RNA sequencing, we performed i.p immunization of NP-OVA adjuvanted with RIBI. At day 14 post immunization, SCAPfl/fl AID-Cre R26YFP mice had reduced GC B cells compared to SCAP+/+ AID-Cre R26YFP mice (Fig. 6b). As expected, more than 60% of GC B cells in SCAP+/+ AID-Cre R26YFP mice were YFP+. By contrast, we found significantly reduced percentage GC B cells expressing YFP (38.8% in average) in SCAPfl/fl AID-Cre R26YFP mice (Extended Data Fig. 10c), further suggesting that Cre mediation SCAP deletion is detrimental for GC B cells. RNA sequencing with the sorted YFP+ GC B cells from both strains showed that steroid biosynthesis is highly impacted in SCAP deficient GC B cells (Fig. 6c). Sterol is an essential component of lipid rafts on the cell membrane. We performed CT-B staining to test whether SCAP deficiency can impair the biosynthesis of lipid rafts in the highly proliferative GC B cells. Strikingly, GC B cells showed much higher CT-B labeling compared to non-GC B cells, suggesting GC B cells have more lipid rafts compared to naïve B cells (Extended Data Fig. 10d). In contrast to naïve B cells (Extended Data Fig. 2d), SCAP deficiency significantly reduced lipid raft content in GC B cells (Fig. 6d), demonstrating that GC B cells but not resting B cells require SREBP signaling for maintaining lipid raft homeostasis. To address the question whether of SREBP signaling can similarly regulate cell cycle progression of GC B cells in vivo, we injected EdU intravenously into day 14 immunized mice. One hour later, we performed flow cytometry and analyzed cell cycle of GC B cells in these mice by EdU and DAPI staining. As shown in Fig. 6e, SCAP deficiency led to a significant reduction of the percentage of GC B cells in the S phase. Next, we took advantage of lineage tracing by YFP expression to examined whether SREBP signaling is important for GC dependent PC formation. As shown in Fig. 6f, SCAP deficiency led to drastically reduced GC derived PCs that are positive for CD138 and YFP. In line with this, three weeks post s.c immunization, SCAPfl/fl AID-Cre R26YFP mice developed significantly less antigen-specific IgG titers and had reduced affinity maturation compared to SCAP+/+ AID-Cre R26YFP mice (Fig. 6g). Collectively, these data demonstrated that SREBP signaling in GC B cells is critical for maintaining lipid homeostasis, cell cycle progression and PC differentiation.
Fig.6 |. Control of GC B cell functions by SREBP signaling.
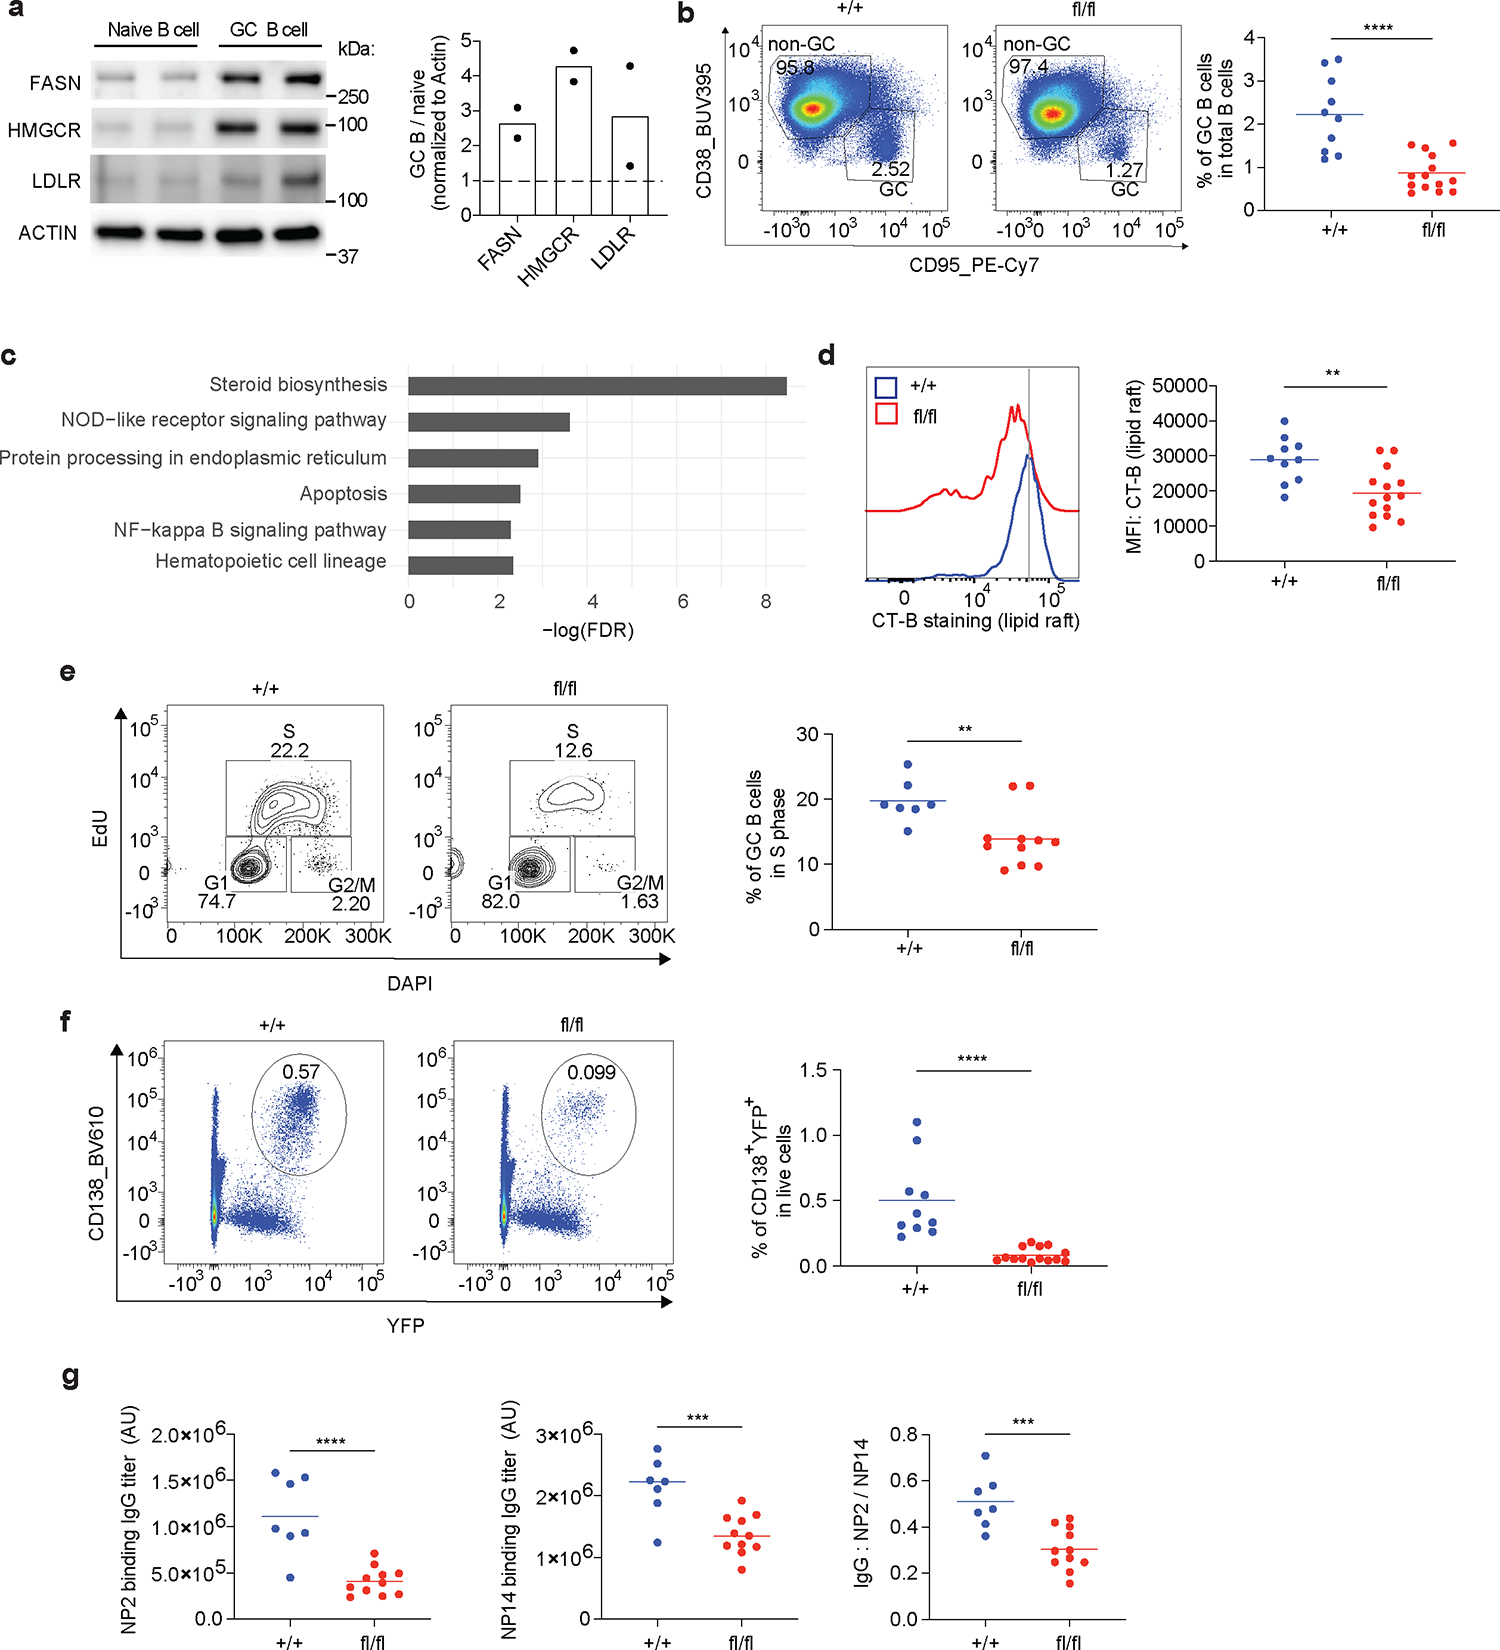
a. Splenic naïve B cells and GC B cells were isolated from naïve mice and day 8 SRBC i.p immunized mice, respectively. Immunoblotting was used for comparing protein expression between naïve B cells and GC B cells. Two experiments were performed with cells combined from 3 and 5 mice in each experiment. Right panel shows the densitometry analysis. Loadings are normalized to ACTIN and ratio of GC/naïve are shown as fold change. b. SCAP+/+ AID-Cre R26YFP (+/+) and SCAPfl/fl AID-Cre R26YFP (fl/fl) mice were i.p immunized with NP-OVA adjuvanted with RIBI. GC B cells in the spleen were analyzed by FACS 14 days post immunization. c. YFP+ splenic GC B cells generated in b were sorted and analyzed by RNA sequencing. Shown are top pathways (ranked by FDR) that were altered in SCAPfl/fl AID-Cre R26YFP GC B cells. d. FACS analysis of Cholera Toxin Subunit B (CT-B) labeling of GC B cells. b and d. 10 +/+ and 14 fl/fl mice from 4 independent experiments were analyzed. e. Day 14 NP-OVA immunized mice were i.v. injected with EdU. One hour post EdU labeling, mice were sacrificed, and GC B cells were analyzed for cell cycle by FACS. Statistical analysis of % of S phase represents 7 +/+ and 11 fl/fl mice from 3 independent experiments. f. Splenic cells from b were analyzed for CD138+ YFP+ plasma cells. Data represent 10 +/+ and 14 fl/fl mice from 4 independent experiments. g. SCAP+/+ AID-Cre R26YFP (+/+) and SCAPfl/fl AID-Cre R26YFP (fl/fl) mice were s.c immunized with RIBI adjuvanted NP-OVA. NP2 and NP14 binding antibody titers and their ratio were analyzed by ELISA. Data represent 7 +/+ and 11 fl/fl mice from 2 independent experiments. P values were determined by two-tailed unpaired t-test. **P≤0.01, ***P≤0.001, ****P≤0.0001.
Discussion:
In this study, we discovered a critical role for B cell SREBP signaling in effective antibody responses, which provides important mechanistic insights into how sterol metabolism is coupled with vaccine efficacy9. Sterol metabolism is a major target for treating and preventing cardiovascular diseases. Statins, one of the most common prescribed medicines in the United States, inhibits HMGCR which is downstream of SREBP signaling. Strikingly, use of statin drugs has been associated with lower antibody response to influenza vaccines44, and statin users vaccinated against influenza are more likely to develop serve respiratory illness from influenza compared to vaccinated people who do not take statins45. Our findings suggest a possible mechanism by which these treatments might interfere with B cell metabolism to reduce vaccine immunity and effectiveness. On the other hand, SREBP signaling can be potentially targeted to treat diseases caused by hyperactivation of humoral responses, such as certain types of autoimmunity and allergy.
Resting naïve lymphocytes are in a quiescent resting state46. Previous findings suggest that T cell development and maintenance at steady state do not require SREBP signaling12. Similarly, we found splenic B cell numbers and subsets at steady state are not affected by SCAP deficiency. By contrast, we discovered that both activated B cells in vitro and GC B cells in vivo require SREBP signaling for lipid homeostasis and rapid clonal expansion. In line with these, RHO-associated coiled-coil-containing protein kinase 2 (ROCK2) was found to regulate GC response through SREBP signaling47. These findings suggest that SREBP pathway is a potential target to manipulate GC B cell response. Here it is important to stress that although Cre activity in AID-Cre R26YFP mice shows selectivity to GC B cells, nevertheless, the potential expression of AID-Cre in pre-germinal center cells cannot be excluded with the current data.
Interestingly, extrafollicular B cell response, as examined by early IgM production, was not affected by SREBP signaling deficiency. Since cholesterol uptake from the environment can restore proliferative defects of SCAP deficient B cells in vitro, we speculate that the initial cholesterol reserve or the uptake of cholesterol from the environment independently of SREBP signaling by some B cells may be sufficient to support extrafollicular response but not GC response. It is also possible that unlike GC B cells, early IgM plasmablast differentiation may not rely on extensive proliferation and thus might be less dependent on SREBP signaling. Therefore, the regulation of B cell response by SREBP can be context dependent, and SREBP signaling is particularly important when cholesterol demand-supply balance cannot be maintained through other pathways. Future studies will be needed to understand the exact mechanism of how lipid homeostasis is regulated during extrafollicular B cell response.
A recent study found that SREBP2 deficiency inhibited intestinal IgA PC differentiation without affecting Peyer’s patch GCs48. Unlike immunization induced de novo GC, gut associated lymphoid tissues (GALT) contain GCs that are chronically present and under antigenic stimulation at steady state49. These findings suggested possible differences regarding the role of SREBP signaling in de novo GC B cells (e.g., through immunization) as compared to chronic GC B cells in GALT. Since SCAP is essential for the activation of both SREBP1 and 2 isoforms, it is also possible that each SREBP isoform may have unique functions in regulating GC responses. In addition, unlike deleting individual SREBP isoforms, SCAP deficiency may affect the availability of its partner protein INSIG, leading to possible different phenotypes. Future investigations will be needed to test these possibilities.
In T cells and NK cells, SREBP signaling is essential for effector function by regulating glycolysis and OXPHOS12,50. Previous studies have shown that for T cells stimulated for 6 hours or NK cells stimulated for 1 hour and 18 hours, mTORC1 signaling probed by S6 kinase activity and S6 phosphorylation was not altered with defective SREBP signaling12,50. We also found that early AKT and p-S6 signals are not altered in SCAP deficient B cells post stimulation. However, both S6K and S6 phosphorylation were reduced at 24 hours post stimulation. Cell type, stimulation, timing, might contribute to these differences. Given that the reduction of mTORC1 signaling only occurs at the later time point, it is likely an indirect effect from SCAP deficiency. Nevertheless, since mTORC1 signaling is highly involved in glycolysis and other aspect of metabolic reprogramming, our findings directly connect mTORC1 signaling to metabolic defects associated with SREBP signaling deficiency in B cells.
SCAP deletion impairs the formation of memory compartments are likely due to defective GC response, as the GC is the major source of these long-lived memory compartments. Further studies using novel mouse models that can deplete SREBP signaling in established memory compartments are needed to investigate how SREBP signaling may affect the maintenance and function of MBCs and PCs. In summary, the results of this paper demonstrate a critical role for cholesterol metabolism in regulating the fate and differentiation of GC B cells and the quality of B cell responses. The genesis of this present study was our previous systems vaccinology study in humans that revealed a correlation between sterol metabolism controlled by the sterol regulatory element binding protein (SREBP) pathway and antibody responses to vaccination9. This highlights the power of the systems vaccinology in providing novel mechanistic insights and suggest that such an approach may be valuable in exploring the impact of statins on immune responses to vaccination in humans.
Methods
Mice and Immunization
SCAPfl/fl mice in C57/B6 background were obtained from Dr. Timothy Osborne. CD19-Cre CD11c-Cre and wild type C57/B6 mice were purchased from Jackson Laboratory. AID-Cre R26YFP mice were obtained from Dr. Rafael Casellas (National Institutes of Health). SCAPfl/fl mice were crossed CD19-Cre mice, CD11c-Cre mice and AID-Cre R26YFP mice to generate SCAPfl/fl CD19Cre/+ mice, SCAPfl/fl CD11c-Cre mice and SCAPfl/fl AID-Cre R26YFP mice, respectively. Litter mate Cre negative mice or mice carrying corresponding Cre were used as controls. All the mice were maintained under specific-pathogen-free conditions supervised by Institutional Animal Care and Use Committee at Stanford University.
Six- to fourteen-week-old, age and sex matched mice were immunized subcutaneously (s.c) at the center of the back skin close to the tail with 25μg 4-hydroxy-3-nitrophenylacetyl (NP) -Ovalbumin (NP-OVA) (LGC Biosearch Technologies, Cat: N-5051–10) or 25μg of OVA (InvivoGen, Cat: vac-pova) adjuvanted by RIBI (Sigma-Aldrich, Cat: S6322–1VL) or AddaVax (InvivoGen, Cat: vac-adx-10) as per manufacturer’s recommendation. In some experiments, mice were intraperitoneally (i.p) immunized with 25μg NP-OVA adjuvanted by RIBI and analyzed 10–14 days later as indicated in the figure legends. For testing recall response to NP-OVA, 6 weeks post primary immunization, mice were intravenously injected with 10μg NP-OVA in PBS. For YF-17D infection, mice were injected subcutaneously at the center of the back skin close to the tail with 2 × 10⁶ FCU YF-17D live virus (prepared in the lab). For harvesting splenic GC B cells for immunoblotting, Eight- to twelve-week-old C57/B6 mice were immunized intraperitoneally with 2×10⁸ sheep red blood cells (Innovative Research, Cat: ISHRBC10P15ML) in 200μl PBS and analyzed at day 8 post immunization.
Cell Preparation and Stimulation
Naïve B cells were purified from spleens with EasySep™ Mouse B Cell Isolation Kit (STEMCELL Technologies, Cat: 19854). Purified B cells were warmed to 37°C with 5% CO2 in culture medium (RPMI 1640 medium supplemented with 10% FBS, penicillin/streptomycin, glutamine, and 50μM 2-mercaptoethanol) for 30 minutes and stimulated with 20μg/mL goat ⍺-mouse IgM (μ-chain specific; Jackson ImmunoResearch, Cat: 115–001-020), 10μg/mL LPS (Sigma-Aldrich, Cat: L2630), 5μg/mL ⍺-CD40 tetramer, 10μg/mL CPG ODN (1826) (InvivoGen, Cat: tlrl-1826), 10μg/mL R848 (InvivoGen, Cat: tlrl-r848), as indicated. To prepare ⍺-CD40 tetramer for stimulation, biotinylated ⍺-CD40 antibody (clone: 1C10, BioLegend, Cat: 102802) was pre-incubated with streptavidin at 5:1 molecular ratio, and then used at 5μg/mL for stimulation. In some experiments, cells were labeled with carboxyfluorescein succinimidyl ester (CFSE) according to manufacturer’s instructions (Invitrogen, Cat: C34554) before stimulation. Cell viability was determined by LUNA-FL Dual Fluorescence Cell Counter (Logos Biosystems) with AO-PI dual staining.
For cholesterol rescue experiments, purified splenic B cells were warmed at 37°C for 30 minutes. Cells were stimulated with 10μg/mL LPS or 5μg/mL ⍺-CD40 tetramer and cultured in cell culture media alone or media supplemented with 5μg/mL methyl-β-cyclodextrin (MβCD) conjugated cholesterol (Sigma, Cat: C4951). Cells were analyzed by flow cytometry and immunoblotting.
For analyzed proximal BCR signaling, splenocytes were warmed at 37°C for 30 minutes. Cells were then stimulated with 20μg/ml Al488 conjugated α-IgM for 1, 5, or 10 minutes and immediately fixed and permeabilized (BD Biosciences, Cat: 554714). Cells were stained for cell surface and intracellular markers including B220, p-SYK Y352 (clone: 17A/P-ZAP70, BD Biosciences, Cat: 557881), p-BTK Y223 (clone: N35–86, BD Biosciences, Cat: 564846)) and analyzed by flow cytometry.
For analyzing dendritic cells and CD8 T cells: to obtain spleen, lung and liver single cell suspensions, mice were sacrificed with CO2 and perfused with 5mL PBS injected into the right ventricle. Spleens were collected in 6 well plates with PBS and were chopped with a scalpel and digested with 1mg/mL collagenase type 4 (Worthington Biochemical Corporation, Cat: LS004210) dissolved in HBSS. Digestion was performed for 30 minutes at 37°C, and reactions were stopped with addition of 2mM EDTA. Digestions were passed through 40μm cell strainers to obtain a homogenous cell suspension. Lungs were dissected into gentleMACS™ C tubes (Miltenyi) and dissociated using a gentleMACS™ octo dissociator using the pre-set program m_lung_01_02. Dissociated lung was digested with 1–1.5mg/mL collagenase type 4 for 30 minutes at 37°C. Lungs were next homogenized with gentleMACS™ octo dissociator program m_lung_02_01, reactions were stopped with 2mM EDTA and digestions passed through 40μm cell strainers. Cells were pelleted (1500–2000rpm/300– 500xg for 5 minutes). Red blood cells were lysed with 1mL Ack lysing buffer (Lonza, Cat: BP10–548E) for 1 minute and lysis was stopped by addition of ≥ 5 volumes of HBSS. Cells were washed once to obtain single cell suspensions. Liver was coarsely chopped with dissection scissors, and digested with collagenase IV 1mg/mL for 30’ at 37°C. The reaction was stopped with addition of 2mM EDTA, digestions were sequentially passed through 70μm and 40μm cell strainers.
Evaluation of YF-17D-specific CD8 T cell responses
For analysis of CD8+ T cells response. Liver and lung were harvested 7 days after YF-17D vaccination. Mononuclear populations for liver and lung were isolated from the interphase of a 70–40% Percoll gradient of single suspension prepared by enzymatic digestion as described in cell preparation section. Cells were plated at 5 × 10⁵ to 1 × 10⁶ cells/well in 96-well plates and re-stimulated with YF-17D specific peptide pools (2 μg/mL of each peptide), for 5 hours in the presence of GolgiPlug (BD Biosciences, Cat: 555029). The peptides used were an H-2Db –restricted epitope (residues 1–15 from the E1 envelope protein, AHCIGITDRDFIEGV), or an H-2Kb –restricted dominant epitope mapped to the NS3 protein (residues 261–275 from the NS3 protein, VIDAMCHATLTYRML).
Seahorse assays
Both mitochondrial stress and glycolytic rate assays were conducted using a Seahorse XFp or XFe96 Extracellular Flux Analyzer (Agilent, CA). The seahorse plates were coated by poly-D-lysine-coated for overnight, and then 2 to 2.5 × 10⁵ live cells were added into the plates and spun down at 1,400 rpm (~400g) for 6 min. Cells were analyzed using Seahorse Cell Mito Stress Test Kit for mitochondrial respiration and Glycolytic Rate Assay Kit for glycolytic analysis, respectively, according to the manufacturer’s protocol. Data were analyzed using “Agilent Seahorse Analytics” online software.
Immunoblotting Analysis
Whole cell lysates were prepared by direct lysing and boiling samples in Laemmli buffer supplemented with 2-mercaptoethanol. The samples were subjected to immunoblotting and membranes were incubated with one of the following antibodies from Cell Signaling Technology: Actin (clone: D18C11, Cat: 8456S), phospho-ERK1/2(Thr202/Tyr204) (clone: D13.14.4E, Cat: 4370S), phospho-p70S6K(Thr389) (clone: 108D2, Cat: 9234S), phospho-p38(Thr180/Tyr182) (clone: D3F9, Cat: 4511S), phospho-S6 (Ser235/236) (clone: D57.2.2E, Cat: 4858S), phospho-AKT (Ser473) (clone: D9E, Cat: 4060S). Polyclonal antibodies from Invitrogen: FASN (Cat: PA5–22061), HMGCR (Cat: PA5–37367) and LDLR (Cat: PA5–20752). The signals on the membranes were captured using a Bio-Rad ChemiDoc Imager and quantitated by Image Lab software V6.1 (Bio-Rad). Loading was normalized by blotting for Actin.
Flow Cytometry
Post stimulation, cells were stained for viability with Ghost Dye Violet 510 (Tonbo Biosciences, Cat: 13–0870-T100) for 5 minutes on ice in 1x PBS-2mM EDTA. After washing out viability dye, cells were blocked with Fc receptor antibody CD16/32 (clone: 2.4G2, BD Biosciences, Cat: 553142) for 5 minutes on ice prior to staining with fluorochrome-conjugated antibodies in FACS staining buffer (1x PBS, 3% FBS, 1mM EDTA, 0.02% Sodium Azide): CD95 (clone: Jo2, BD Biosciences, Cat: 557653), CD19 (clone:1D3/CD19, BioLegend, Cat: 152406), B220 (clone: RA3–6B2, BioLegend, Cat: 103236), CXCR4 (clone: L276F12, BioLegend, Cat: 146511), CD86 (clone: GL1, BioLegend, Cat: 105043), CD38 (clone: 90, BD Biosciences, Cat: 740245), CD44 (clone: IM7, BioLegend, Cat: 103028), CD138 (clone: 281–2; BD Biosciences, Cat: 563147), CD3 (clone: 17A2, BioLegend, Cat: 100216), CD23 (clone: B3B4, BioLegend, Cat: 101612), CD4 (clone: GK1.5 or RM4–5, BioLegend, Cat: 100469 or 100555), CXCR5 (clone: L138D7, BioLegend, Cat: 145529), PD1 (clone: 29F.1A12, BioLegend, Cat: 135228), CD45 (Clone 30-F11, BioLegend, Cat: 103140), CD11c (clone: N418, BioLegend, Cat: 117330), MHCII (clone: M5/114.15.2, BioLegend, Cat: 107622), CD8α (clone: 53–6.7, BioLegend, Cat: 563046 or BD Biosciences, Cat: 612898), CD11b (clone: M1/70, BioLegend, Cat: 101237), PDCA-1 (clone: 927, BD Biosciences, Cat: 747604 or eBioscience, Cat: 46–3172-82), IFNγ (clone: XMG1.2, BioLegend, Cat: 505806), p-Syk Y352 (clone: 17A/P-ZAP70, BD Biosciences, Cat: 557881), p-Btk Y223 (clone: N35–86, BD Biosciences, Cat: 564846), IgM (goat polyclonal, Southern Biotech, Cat: 1021–01), IgD (clone: 11–26c.2a, BioLegend), CD80 (clone: 16–10A1, BD Biosciences, Cat: 104725), PD-L2 (clone: TY25, BioLegend, Cat: 107210), CD93 (clone: AA4.1, BioLegend, Cat: 136504), CD43 (clone: S11, BioLegend, Cat: 143218), CD5 (clone: 53–7.3, Biolgend, Cat: 100639). Surface staining was incubated for 30 minutes on ice followed by fixation. For analysis of CD8 T cells response, BD surface and intracellular staining protocol was followed. Briefly, after staining cells with viability dye, cells were first surface stained for CD45, CD3, CD4, and CD8α followed by fixation and permeabilization in BD Fixation/Perpeabilization solution and then stained intracellularly for IFNγ in BD Perm/ Wash buffer as per manufacturer’s recommendation (BD Biosciences, Cat: 554714). Lipid raft staining was performed using Vybrant™ Lipid Raft Labeling Kit (Invitrogen, Cat: V34404). Cell cycle analyses were performed using Click-iT™ Plus EdU Alexa Fluor™ 647 Flow Cytometry Assay Kit (Invitrogen, Cat: C10634). For in vivo EdU labeling, mice were i.v injected with 0.5mg EdU in 100μL PBS and were analyzed 1 hour later. Flow cytometry data were collected using BD FACS Diva V.8.01 software associated with BD LSRII flow cytometer and analyzed using Flowjo V.10 (BD) software.
Lipid raft staining
Lipid raft staining were performed using Vybrant™ Alexa Fluor™ 555 Lipid Raft Labeling Kit (Invitrogen™, Cat: V34404). Cells were analyzed by confocal microscopy (LSM880) or by FACS.
ELISA
Following vaccination, mice were bled at indicated time points for serological analysis. Serum was obtained by centrifuging whole blood collection in micro sample tube with serum gel (SARSTEDT). ELISA plates were coated with 100μL of 10ug OVA or 5μg/mL NP14-BSA or NP2-BSA for detecting total and high-affinity NP specific antibody respectively. For detecting antibody against YF-17D, YF-17D viruses were heat-inactivated at 56 °C for 30 minutes and ELISA plates were coated overnight at 4 °C with heat-inactivated viral particles (10^4 PFU in 100uL PBS per well). StartingBlock™ (PBS-T) blocking buffer (Thermo Scientific, Cat: 37538) was used for blocking and sample dilution. Specific isotypes were identified using HRP-conjugated, human adsorbed, isotype-specific goat anti-mouse antibodies obtained from SouthernBiotech (IgG Cat: 1031–05, IgM Cat: 1020–05), and developed using Pierce TMB substrate kit. ELISA data was analyzed using an endpoint analysis. Serial dilution of pooled positive control samples was used to produce an assay sensitivity curve (Prism: Asymmetric Sigmoidal, 5PL, X is log), and biological samples were compared to that curve to assign a titer (AU) relative to the assay’s lower threshold (calculated as the average value of 6 blank wells plus 3 times their standard deviation). Groups were then compared by standard statistical testing using Prism statistical analysis software.
ELISPOT assay for bone marrow plasma cells
MultiScreen 96-well plates with Immobilon-P membrane (Millipore, Cat: MAIPS4510 ) were coated with 100μL 5μg/ml NP14-BSA or NP2-BSA for detecting total and high-affinity NP specific plasma cells, respectively. Bone marrow cells were first treated with ACK lysis buffer to deplete red blood cells. Cells were then plated at 0.25 to 1 million cells/well in RPMI-1640 medium supplemented with 10% FBS, penicillin/streptomycin, glutamine and 50μM β-mercaptoethanol. After overnight incubation at 37°C, antigen specific IgG secreting cells were detected by HRP labeled goat anti-mouse IgG secondary antibody (SouthernBiotech, Cat: 1031–05) followed by incubation with 3-Amino-9-ethylcarbazole (AEC) substrate (BD AEC Substrate Set, Cat: 551951). ELISPOT plates were counted manually with magnification glass and normalized as the number of antibody secreting cells/one million bone marrow cells.
Bulk RNA sequencing
Purified B cells were warmed at 37 °C for 30 minutes and then stimulated with 10μg/ml LPS, 20μg/ml α-IgM or 5μg/ml α-CD40 tetramer (prepared as described above) for 0 and 24 hours. After stimulation, cells were homogenized in 350μL of Buffer RLT using QIAshredder columns (Qiagen, Cat: 79654). For Bulk RNA sequencing of germinal center B cells: SCAPfl/fl AID-Cre R26YFP mice and SCAP+/+ AID-Cre R26YFP controls were immunized subcutaneously with 25μg NP-OVA adjuvanted with RIBI. At day 14 post immunization, inguinal lymph nodes were collected, processed into single cell suspensions, and stained with a panel of fluorochrome-conjugated antibodies. 8,000 YFP+ germinal center B cells (CD3-CD19+CD44−CD138−CD38−CD95+) were purified using the Aria II fluorescence activated cell sorter (BD Bioscience) and lysed in 350μL of Buffer RLT with β-ME. RNA was extracted using the RNeasy Mini kit (Qiagen, Cat: 74104) with on-column DNase digestion. RNA quality was assessed using a Fragment Analyzer (Agilent) and ten nanograms of total RNA was used as input for cDNA synthesis using the Clontech SMART-Seq v4 Ultra Low Input RNA kit (Takara Bio, Cat: 634888) according to the manufacturer’s instructions. Amplified cDNA was fragmented and appended with dual-indexed bar codes using the NexteraXT DNA Library Preparation kit (Illumina, Cat: FC-131–1024). Libraries were validated by capillary electrophoresis on a Fragment Analyzer (Agilent), pooled at equimolar concentrations, and sequenced on an Illumina NovaSeq6000 at 100SR, yielding an average of 30 million reads per sample.
RNA-seq data analysis
RNA-seq fastq files were aligned to the Mus Musculus Reference Genome (version GRCm38) and raw gene read counts (Refgene) were generated using the Omicsoft Aligner (OSA) V41. Only the genes with raw read count greater than 10 in any sample were included in further analysis. Raw read counts were normalized and analyzed for differential expression using DESeq22. A gene was called differentially expressed (DE) based on a raw p-value cutoff of 0.05 and a fold change cutoff of 1.3 (up or down). Enrichment analysis was performed using hypergeometric distribution to identify the biological significance of the DE genes. Gene Ontology (GO) and Kyoto Encyclopedia of Genes and Genomes (KEGG) pathways were used to identify overrepresented annotation terms. Benjamini-Hochberg false discovery rate (FDR) was used for multiple comparison correction. Pathview in R V4.1.3 was used to visualize the enriched KEGG pathways3.
Metabolomics
Sample preparation: Proteins were precipitated with methanol under vigorous shaking for 2 min (Glen Mills GenoGrinder 2000) followed by centrifugation. The resulting extract was divided into five fractions: two for analysis by two separate reverse phases (RP)/UPLC-MS/MS methods with positive ion mode electrospray ionization (ESI), one for analysis by RP/UPLC-MS/MS with negative ion mode ESI, one for analysis by HILIC/UPLC-MS/MS with negative ion mode ESI, and one sample was reserved for backup. Samples were placed briefly on a TurboVap® (Zymark) to remove the organic solvent. The sample extracts were stored overnight under nitrogen before preparation for analysis.
Ultrahigh Performance Liquid Chromatography-Tandem Mass Spectroscopy (UPLC-MS/MS): All methods utilized a Waters ACQUITY ultra-performance liquid chromatography (UPLC) and a Thermo Scientific Q-Exactive high resolution/accurate mass spectrometer interfaced with a heated electrospray ionization (HESI-II) source and Orbitrap mass analyzer operated at 35,000 mass resolution. The sample extract was dried then reconstituted in solvents compatible with each of the four methods. Each reconstitution solvent contained a series of standards at fixed concentrations to ensure injection and chromatographic consistency. One aliquot was analyzed using acidic positive ion conditions, chromatographically optimized for more hydrophilic compounds. In this method, the extract was gradient eluted from a C18 column (Waters UPLC BEH C18–2.1×100 mm, 1.7 μm) using water and methanol, containing 0.05% perfluoropentanoic acid (PFPA) and 0.1% formic acid (FA). Another aliquot was also analyzed using acidic positive ion conditions; however it was chromatographically optimized for more hydrophobic compounds. In this method, the extract was gradient eluted from the same aforementioned C18 column using methanol, acetonitrile, water, 0.05% PFPA and 0.01% FA and was operated at an overall higher organic content. Another aliquot was analyzed using basic negative ion optimized conditions using a separate dedicated C18 column. The basic extracts were gradient eluted from the column using methanol and water, however with 6.5mM Ammonium Bicarbonate at pH 8. The fourth aliquot was analyzed via negative ionization following elution from a HILIC column (Waters UPLC BEH Amide 2.1×150 mm, 1.7 μm) using a gradient consisting of water and acetonitrile with 10mM Ammonium Formate, pH 10.8. The MS analysis alternated between MS and data-dependent MSn scans using dynamic exclusion. The scan range varied slightly between methods but covered 70–1000 m/z.
Data Extraction and Compound Identification: Raw data was extracted, peak-identified and QC processed using Metabolon’s hardware and software. Compounds were identified by comparison to library entries of purified standards or recurrent unknown entities. Metabolon maintains a library based on authenticated standards that contain the retention time/index (RI), mass to charge ratio (m/z), and chromatographic data (including MS/MS spectral data) on all molecules present in the library. Furthermore, biochemical identifications are based on three criteria: retention index within a narrow RI window of the proposed identification, accurate mass match to the library +/− 10 ppm, and the MS/MS forward and reverse scores between the experimental data and authentic standards.
Metabolite Quantification and Data Normalization:
Peaks were quantified using area-under-the-curve. Metabolite data were then normalized to total protein (as determined by Bradford assay) to account for differences in the amount of material present in each sample.
Statistical Analysis:
Data was filtered to remove metabolites with 0 variance across all samples. For significance testing, data were log2 transformed and metabolite fold changes relative to the average of the same genotype (SCAP KO or WT) unstimulated samples were computed. Student’s t-tests were then performed on log2 FC data between SCAP KO and WT under each combination of treatment (α-CD40 or LPS) and timepoint (24 or 48 hours), removing invariant features under any comparison. P-values were adjusted for multiple testing via Benjamini-Hochberg procedure, and differential metabolites were identified using FDR<0.05.
Quantification and Statistical Analysis
RNA-seq statistical analysis was described above. All other statistical analysis was performed with GraphPad Prism software V9.4. For comparing two groups, P-values were determined using Student’s t-tests (two-tailed). For comparing more than two groups, One-Way ANOVA followed by Tukey test was applied. Differences between groups were considered significant for P-values < 0.05.
Extended Data
Extended Data Fig. 1. SREBP signaling in CD11c+ antigen presenting cells is dispensable for modulation of antibody and CD8 T cell responses.
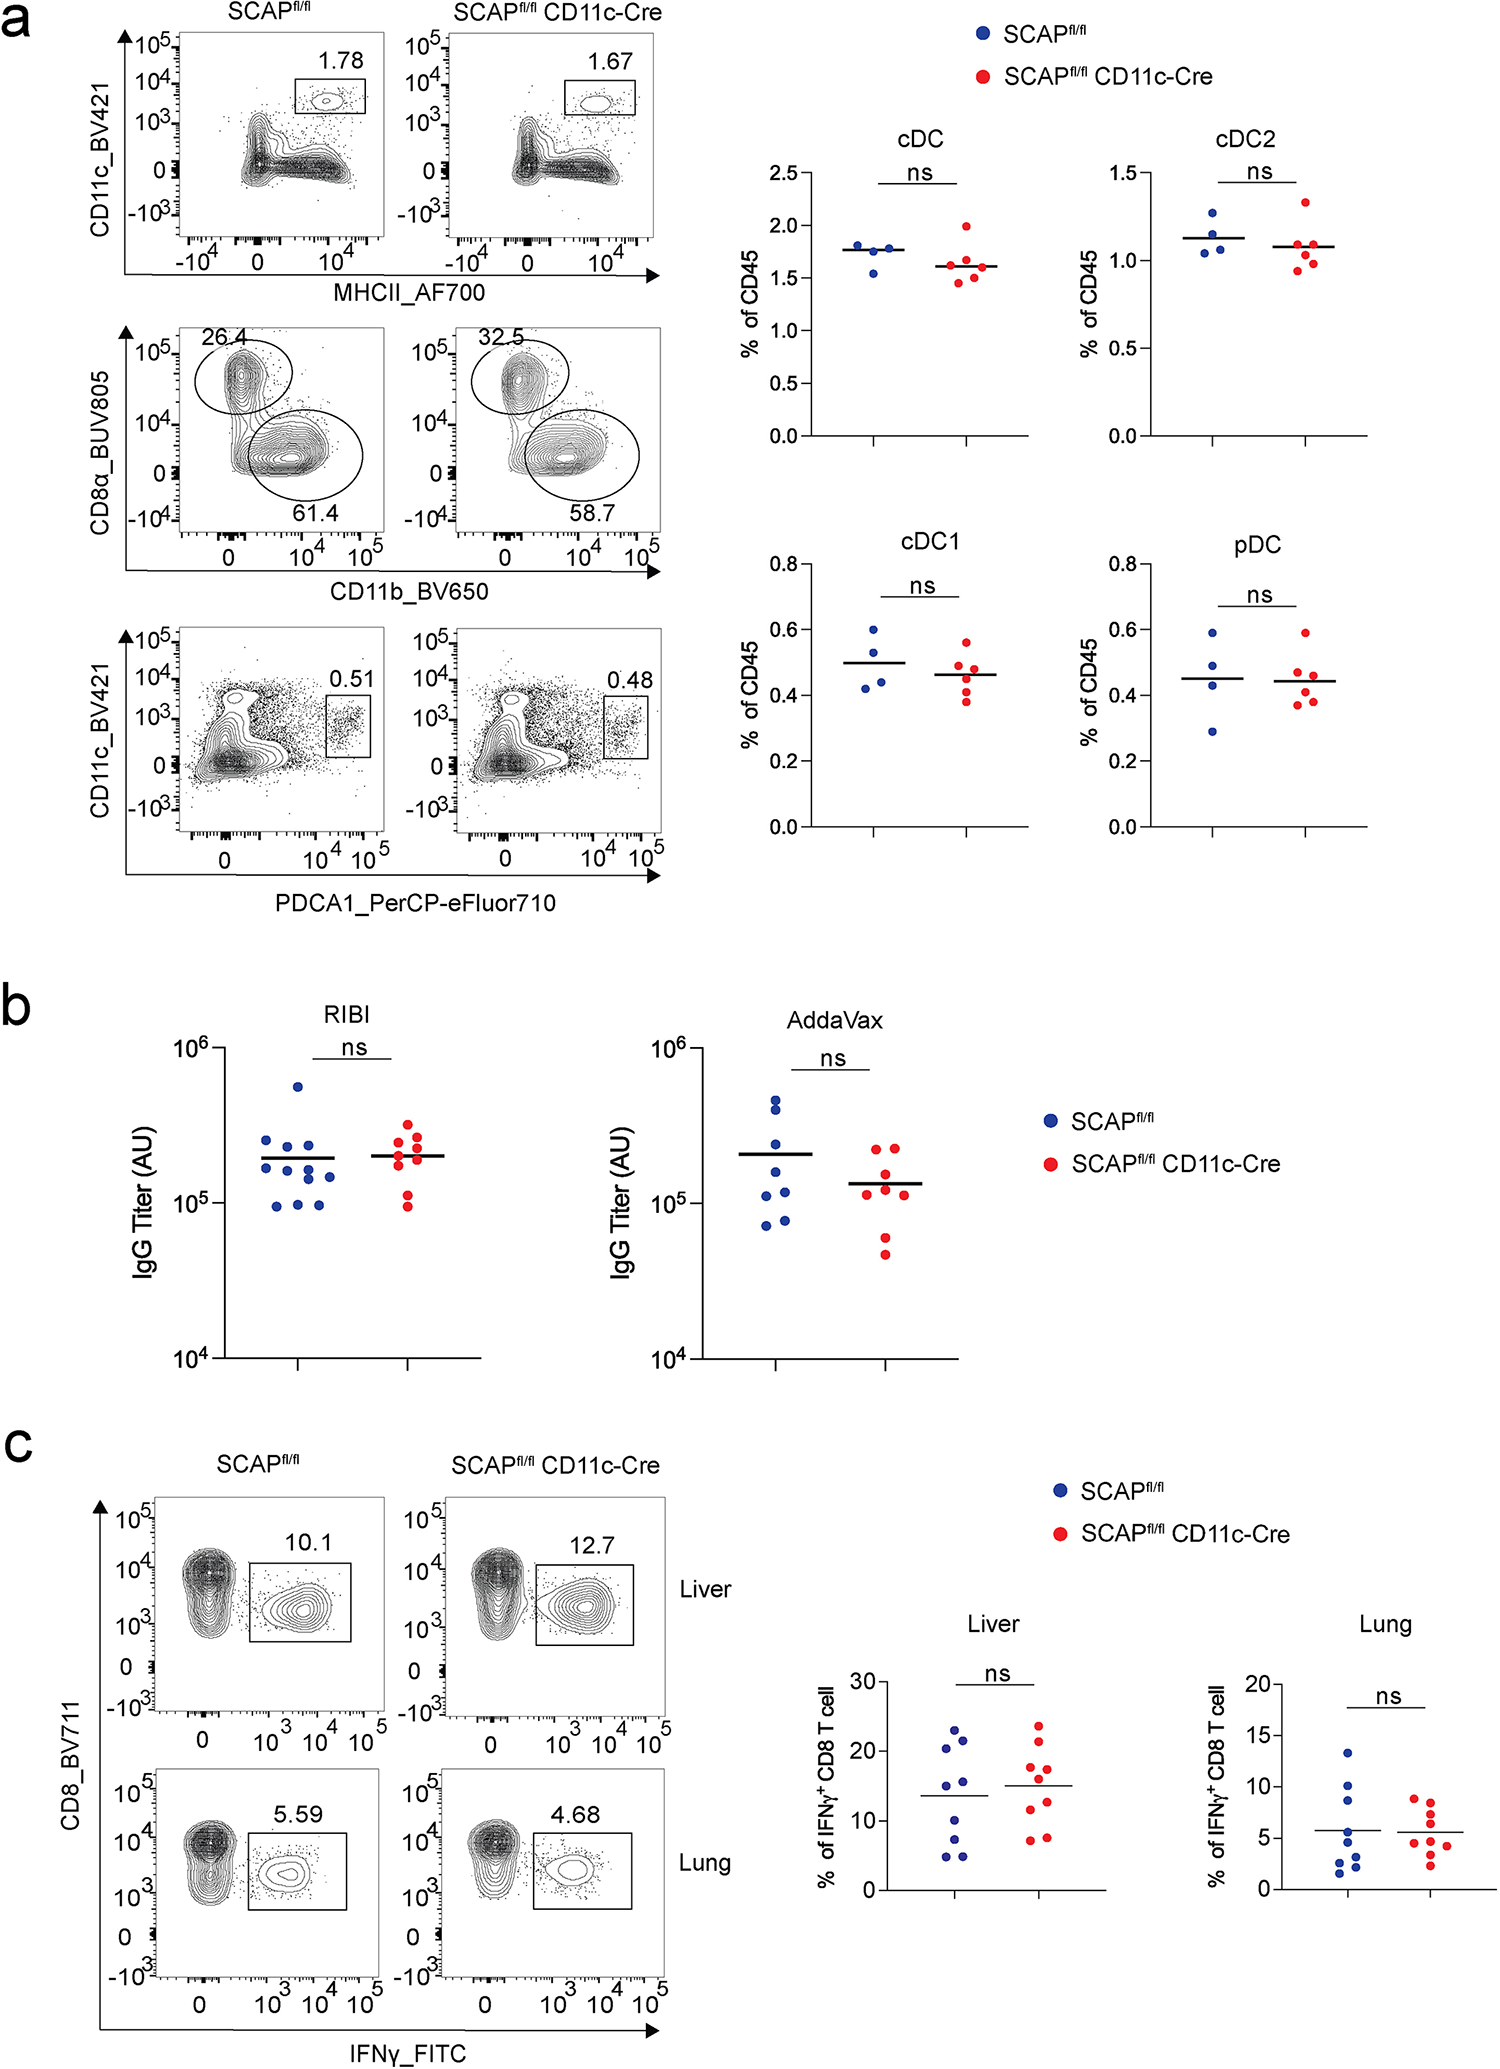
a. Spleen single cell suspension from SCAPfl/fl (n = 4) and SCAPfl/fl CD11c-Cre mice (n = 6) were analyzed by flow cytometry for dendritic cell (DC) subtypes. DC subtypes are gated as cDCs (CD45+CD11c+MHCII+) which include cDC1 (CD8a+CD11b−) and cDC2 (CD8a−CD11b+), pDCs (CD45+CD11cloPDCA1+). Graphs show the representative flow cytometry plots and the statistics for the frequencies of DC subsets. b. SCAPfl/fl and SCAPfl/fl CD11c-Cre mice were immunized subcutaneously with OVA adjuvanted with RIBI (n = 12 for SCAPfl/fl and n = 9 for SCAPfl/fl CD11c-Cre) or AddaVax (n = 8 for each group), and serum antibody titers at day 28 were measured by ELISA. c. SCAPfl/fl and SCAPfl/fl CD11c-Cre mice (n = 9 for each group) were immunized with 2×10⁶ plaque-forming units (PFU) of YF-17D virus, and antigen specific CD8 T cells producing IFN-γ in the lung and liver were analyzed by flow cytometry. Graphs show frequencies of CD8 T cell (gated as CD3+CD8+CD4−) producing IFN-γ in the lung and liver with representative flow cytometry plots. a-c, Data represent two independent experiments, P values are determined by two-tailed unpaired t-test. ns: P > 0.05.
Extended Data Fig. 2. SCAP is not required for B cell development or maintenance at steady state.
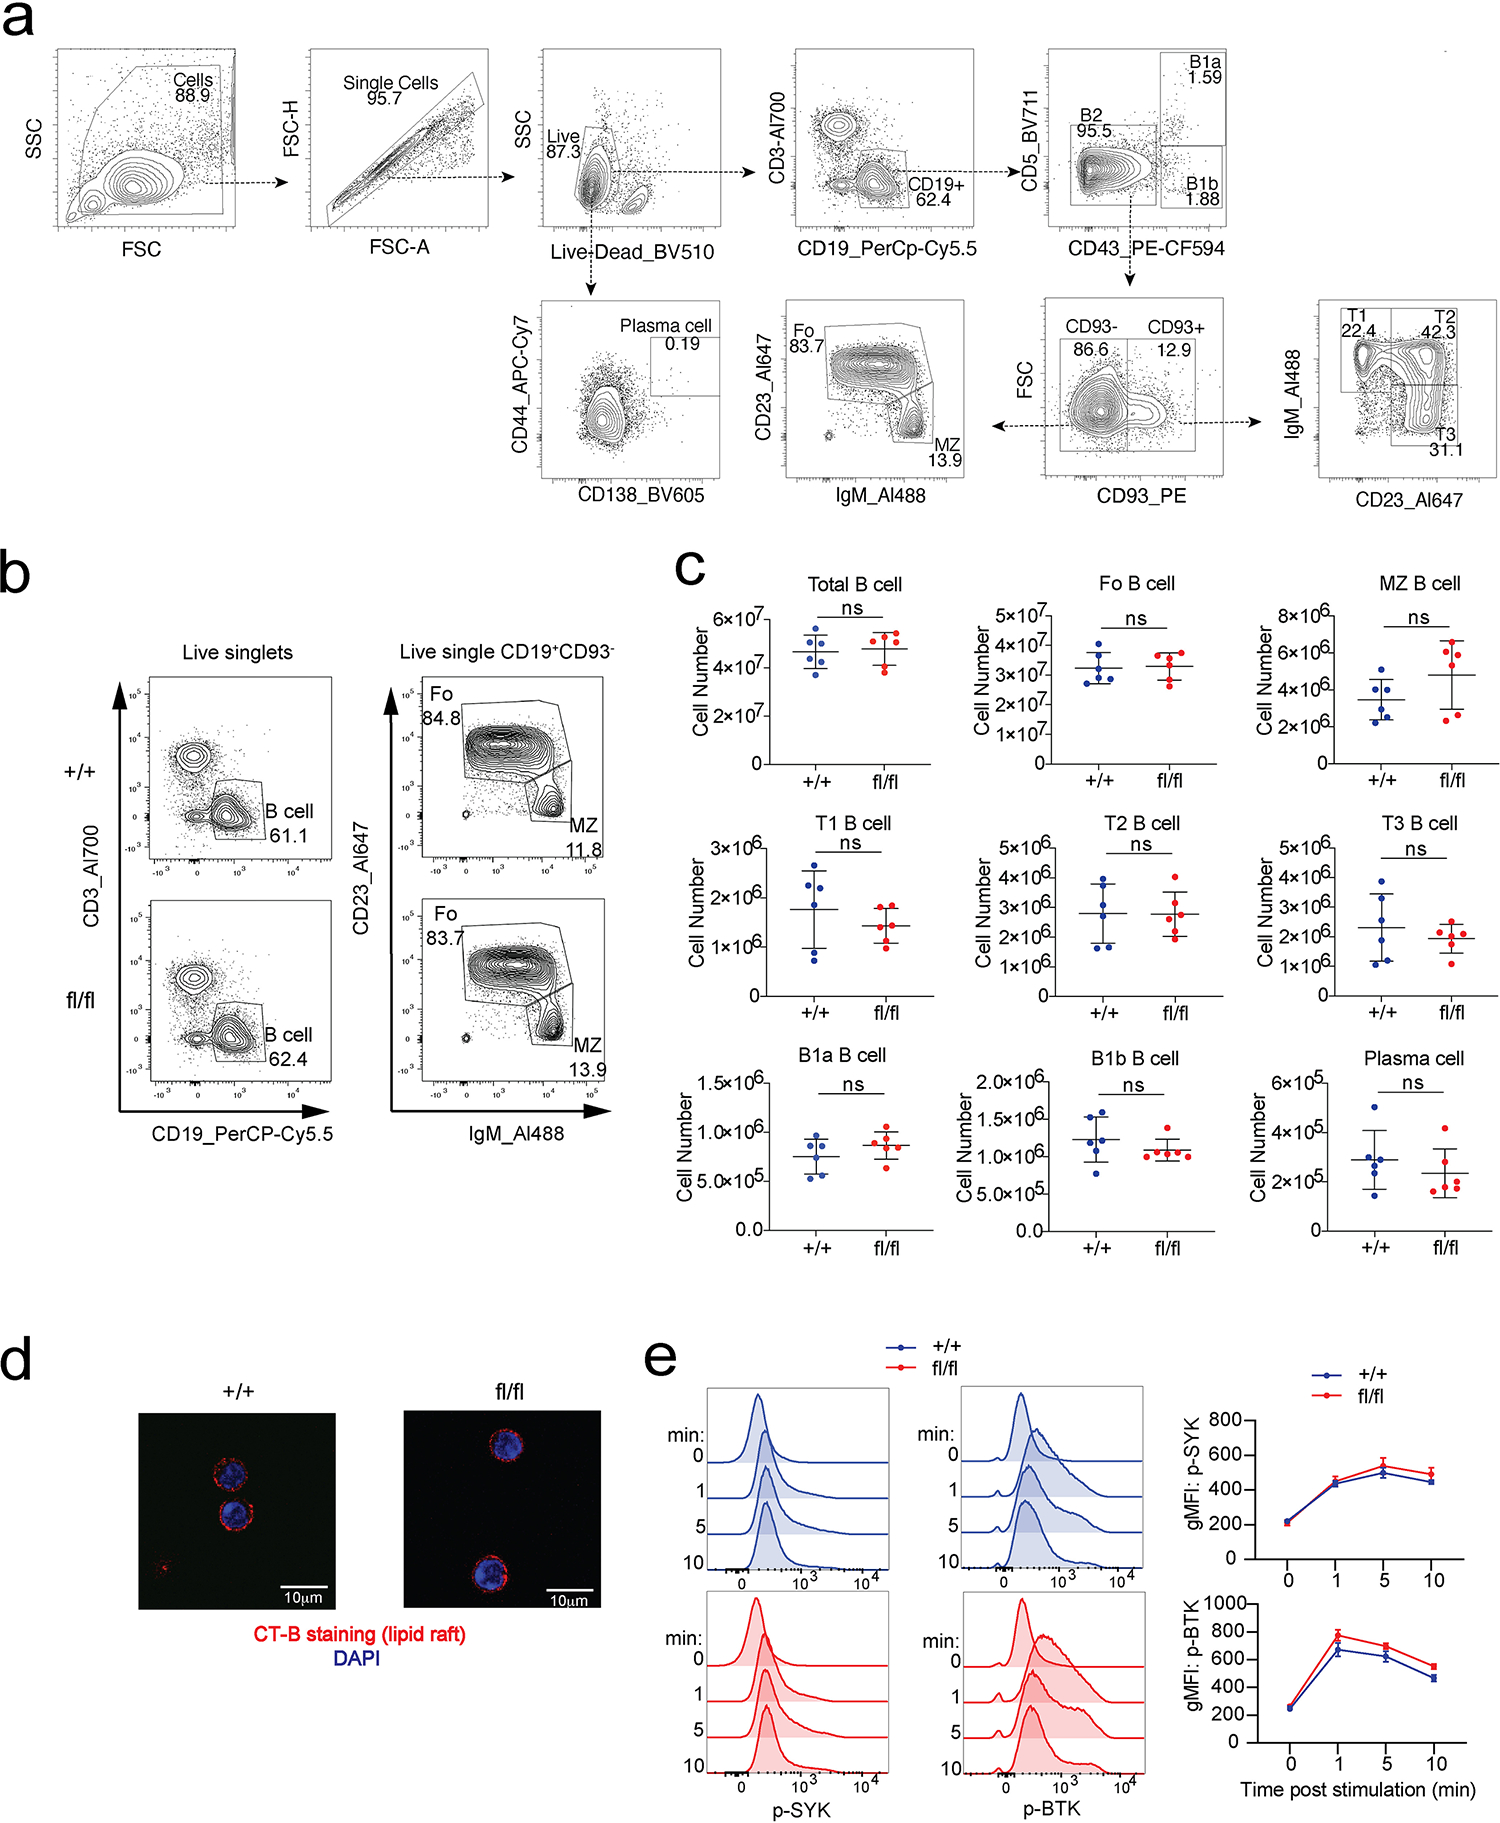
Splenic B cell subsets from SCAP+/+CD19Cre/+ (+/+) mice and SCAPfl/fl CD19Cre/+ (fl/fl) mice were analyzed by FACS. a. Gating strategy. b. Representative FACS plots comparing total B cells, and the follicular and marginal zone B cell subsets. c. Statistical analysis of B cell subsets at steady state. b and c, data are from 2 experiments (n = 6, mean ± SD). P values were determined by two-tailed unpaired t-test. ns, P > 0.05. d. Lipid raft staining by cholera toxin subunit B (CT-B) of purified B cells. Shown are representative images of 4 samples from 2 experiments. e. FACS analysis of purified B cells stimulated with 20 μg/ml anti-IgM antibody for indicated time points. Data represent 5 mice from 2 experiments. ns: P > 0.05.
Extended Data Fig. 3. SREBP signaling is required for MBC formation.
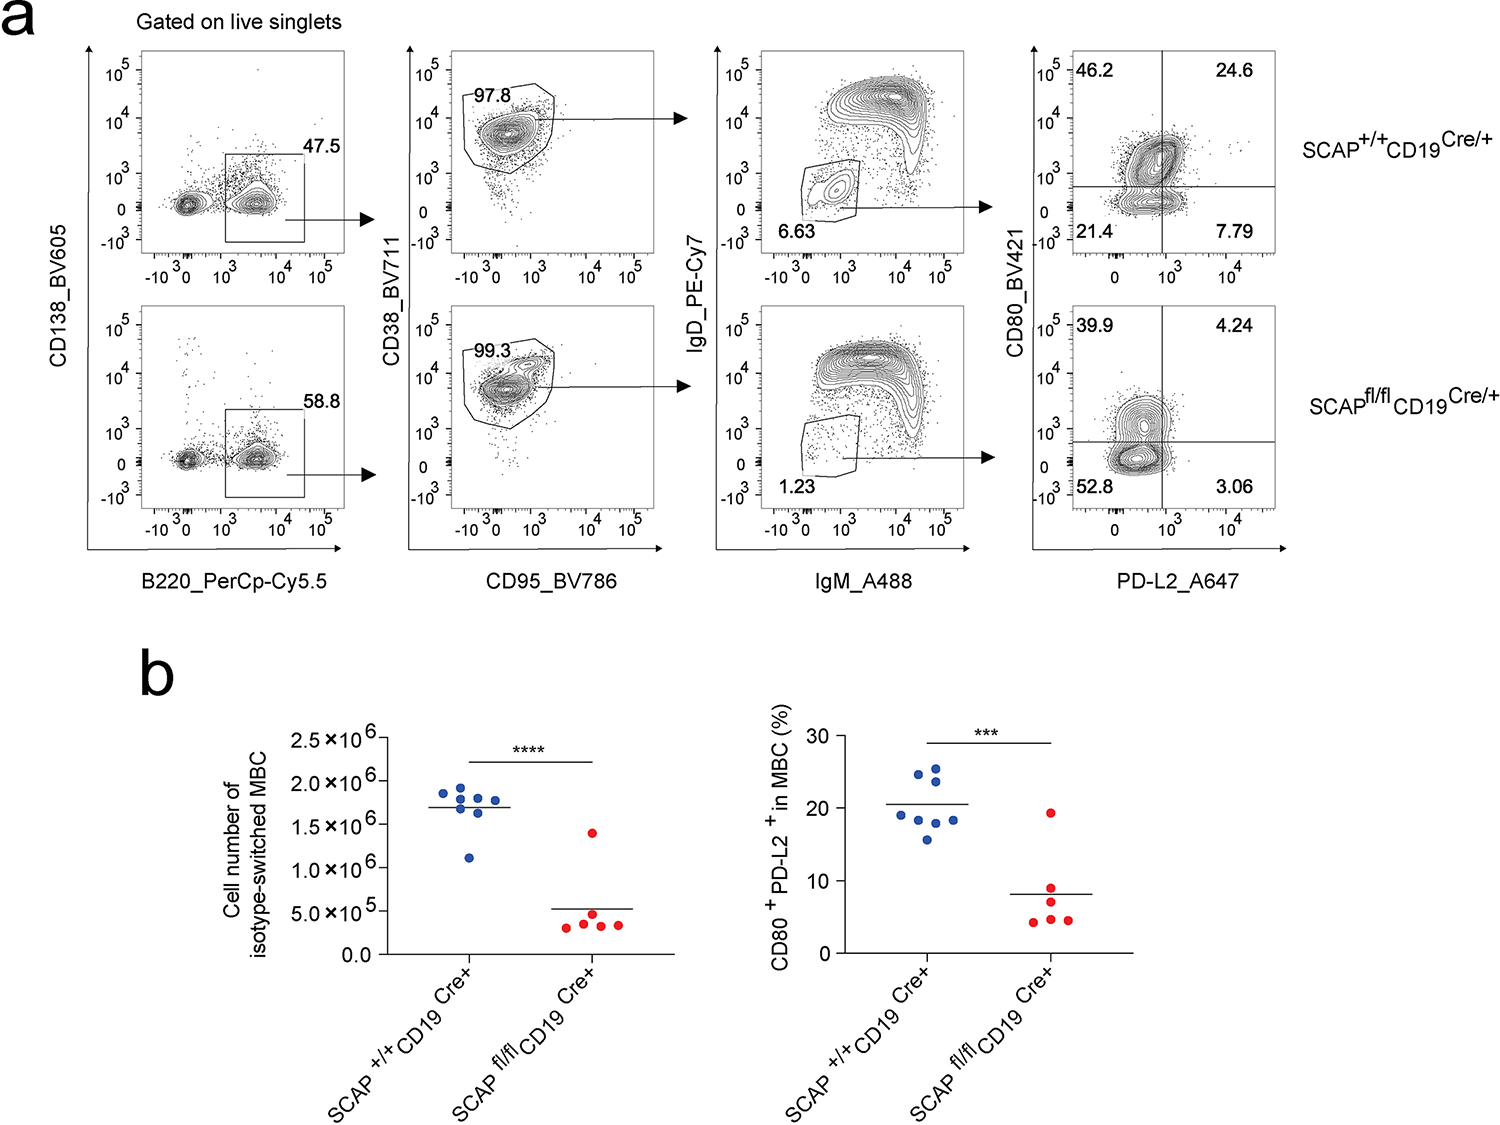
Mice were i.p immunized with NP-OVA adjuvanted by RIBI. Splenocytes were analyzed 4 weeks post immunization. a. Gating strategy to identify isotype switched MBC (B220+CD95−CD38+IgM−IgD−) and subsets of these MBC based on CD80 and PD-L2 expression. b. Dot plots with means are from 2 independent experiments (n = 8 for SCAP+/+ CD19Cre/+ and n = 8 for SCAPfl/fl CD19Cre/+). P values were determined by two-tailed unpaired t-test. ***P ≤ 0.001, ****P ≤ 0.0001.
Extended Data Fig. 4. SREBP signaling does not affect early IgM antibody response.
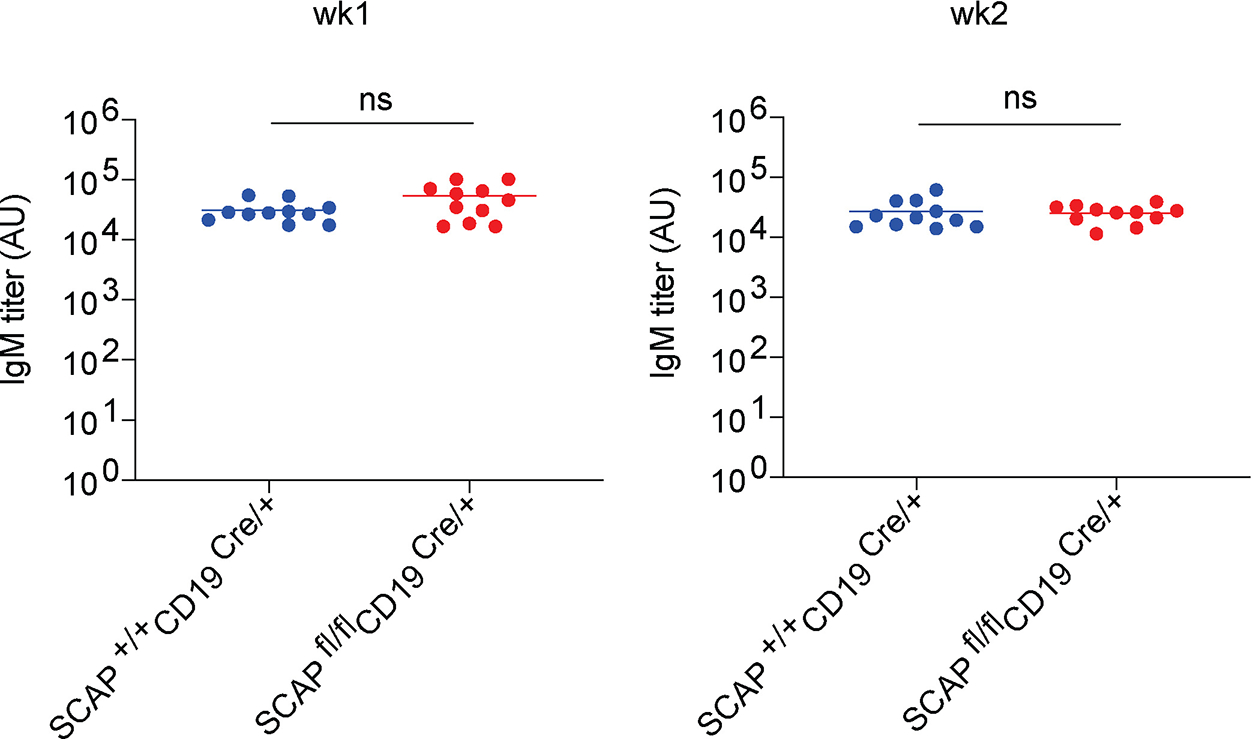
wk1 and wk2 serum samples from Fig. 1a–c were analyzed by ELISA for NP binding IgM antibody titers (n = 11 from two independent experiments). Shown are dot plots with means. P values were determined by two-tailed unpaired t-test. ns: P > 0.05.
Extended Data Fig. 5. Steroid biosynthesis (including terpenoid backbone biosynthesis) KEGG pathway annotated with gene expression.
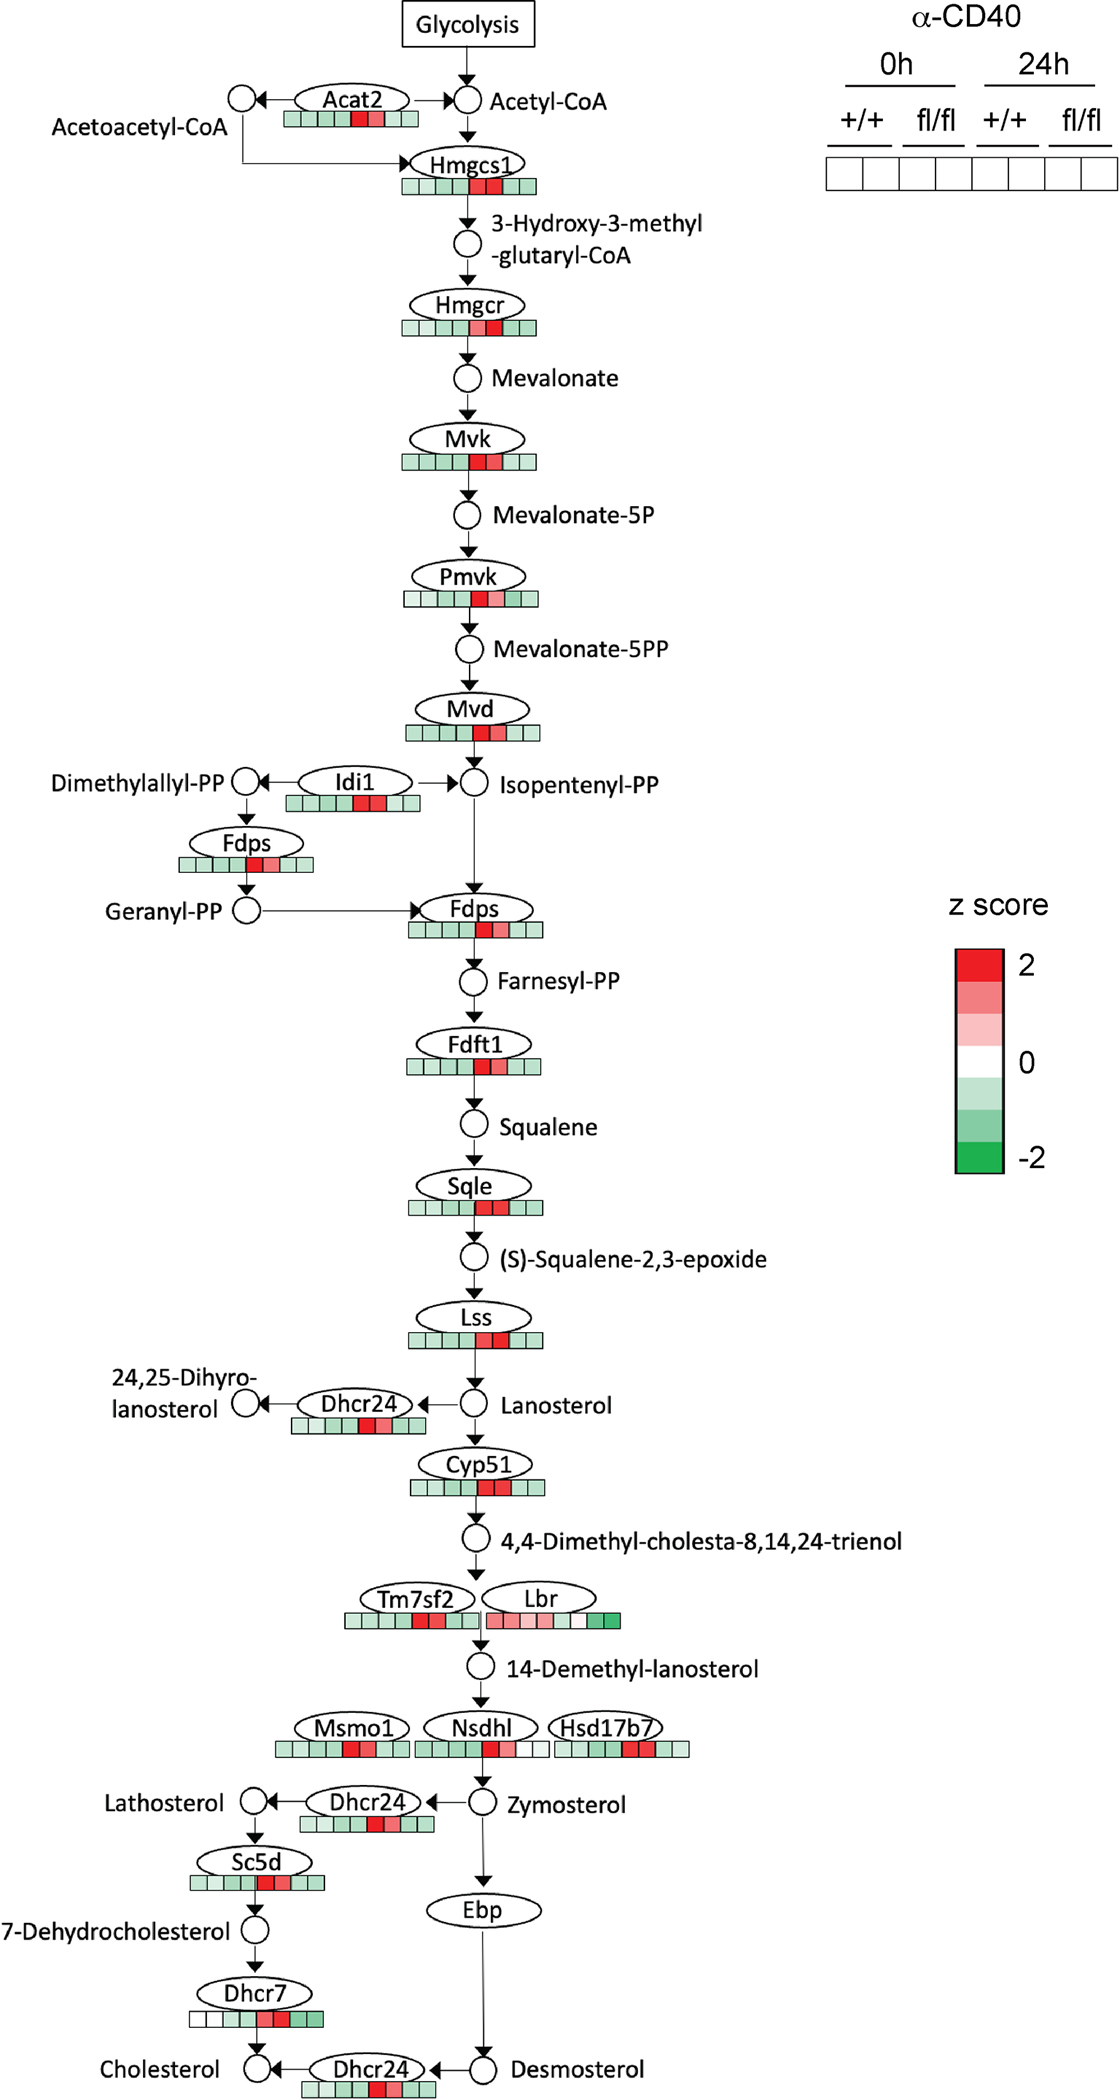
Bead-purified splenic B cells from SCAP+/+ CD19Cre/+ (+/+) mice and SCAPfl/fl CD19Cre/+ (fl/fl) mice were stimulated with 5 μg/ml anti-CD40 tetramer for 24 hours. RNA was isolated from the cells and analyzed by RNA sequencing.
Extended Data Fig. 6. RNA-seq analysis reveals altered pathways in LPS or anti-IgM stimulated SCAP deficient B cells.
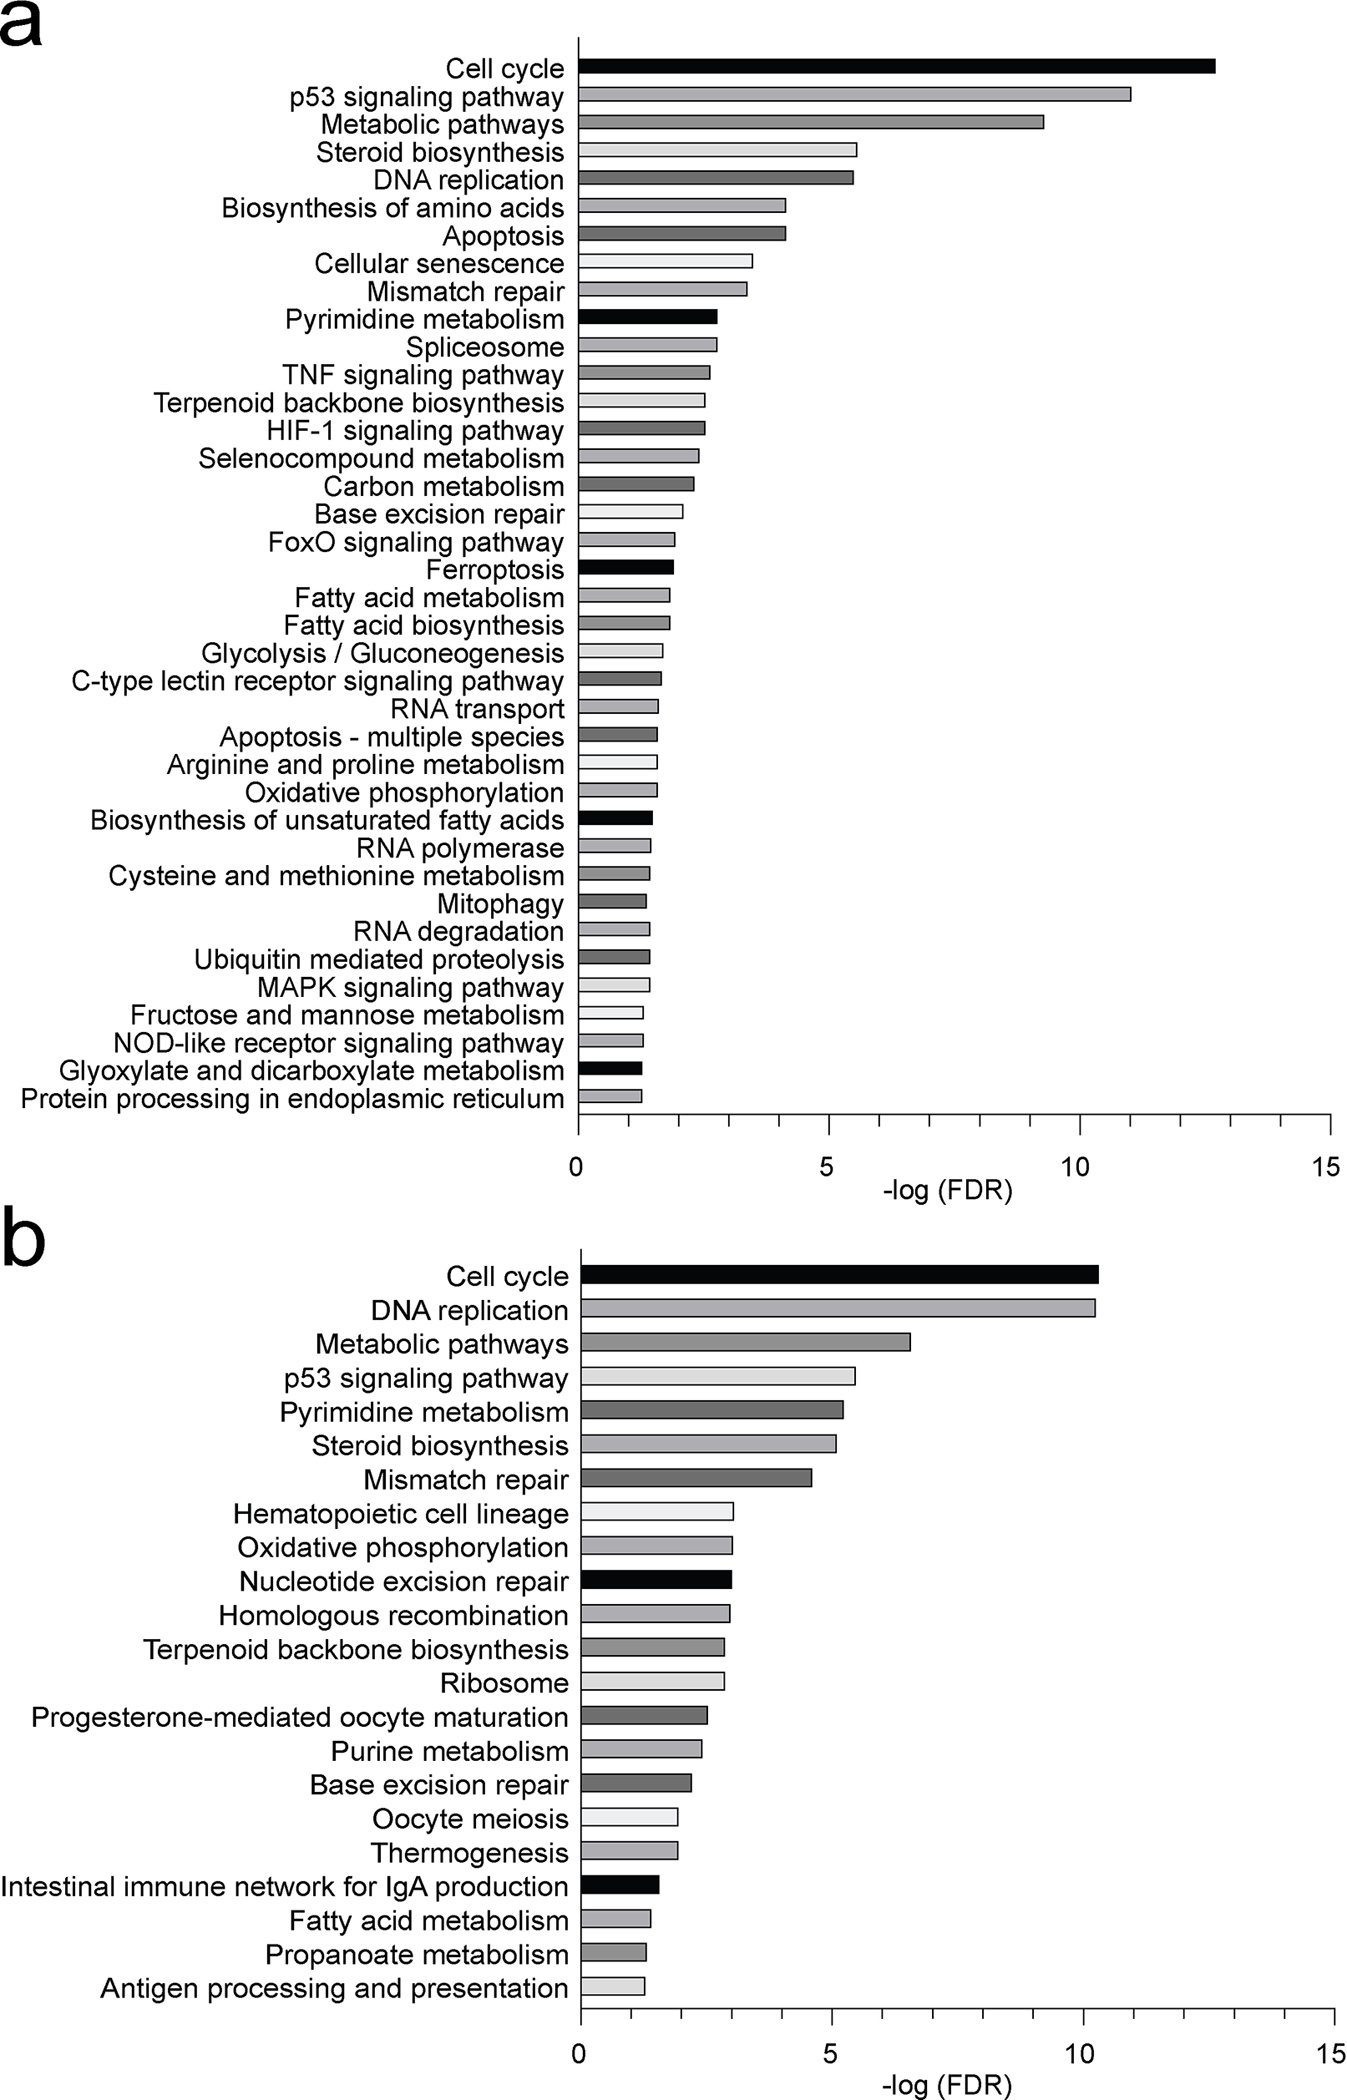
Bead-purified splenic B cells from SCAP+/+ CD19Cre/+ mice and SCAPfl/fl CD19Cre/+ mice were stimulated with 10 μg/ml LPS or 20 μg/ml anti-IgM for 24 hours. RNA was isolated from the cells and analyzed by RNA sequencing. Pathways that were altered in SCAP deficient B cells post LPS (a) and anti-IgM (b) stimulation were ranked by FDR ( < 0.05). Shown are data from 2 independent experiments with cells pooled from 5 mice in each experiment.
Extended Data Fig. 7. SCAP deficiency leads to reduced survival of B cells activated by BCR signal.
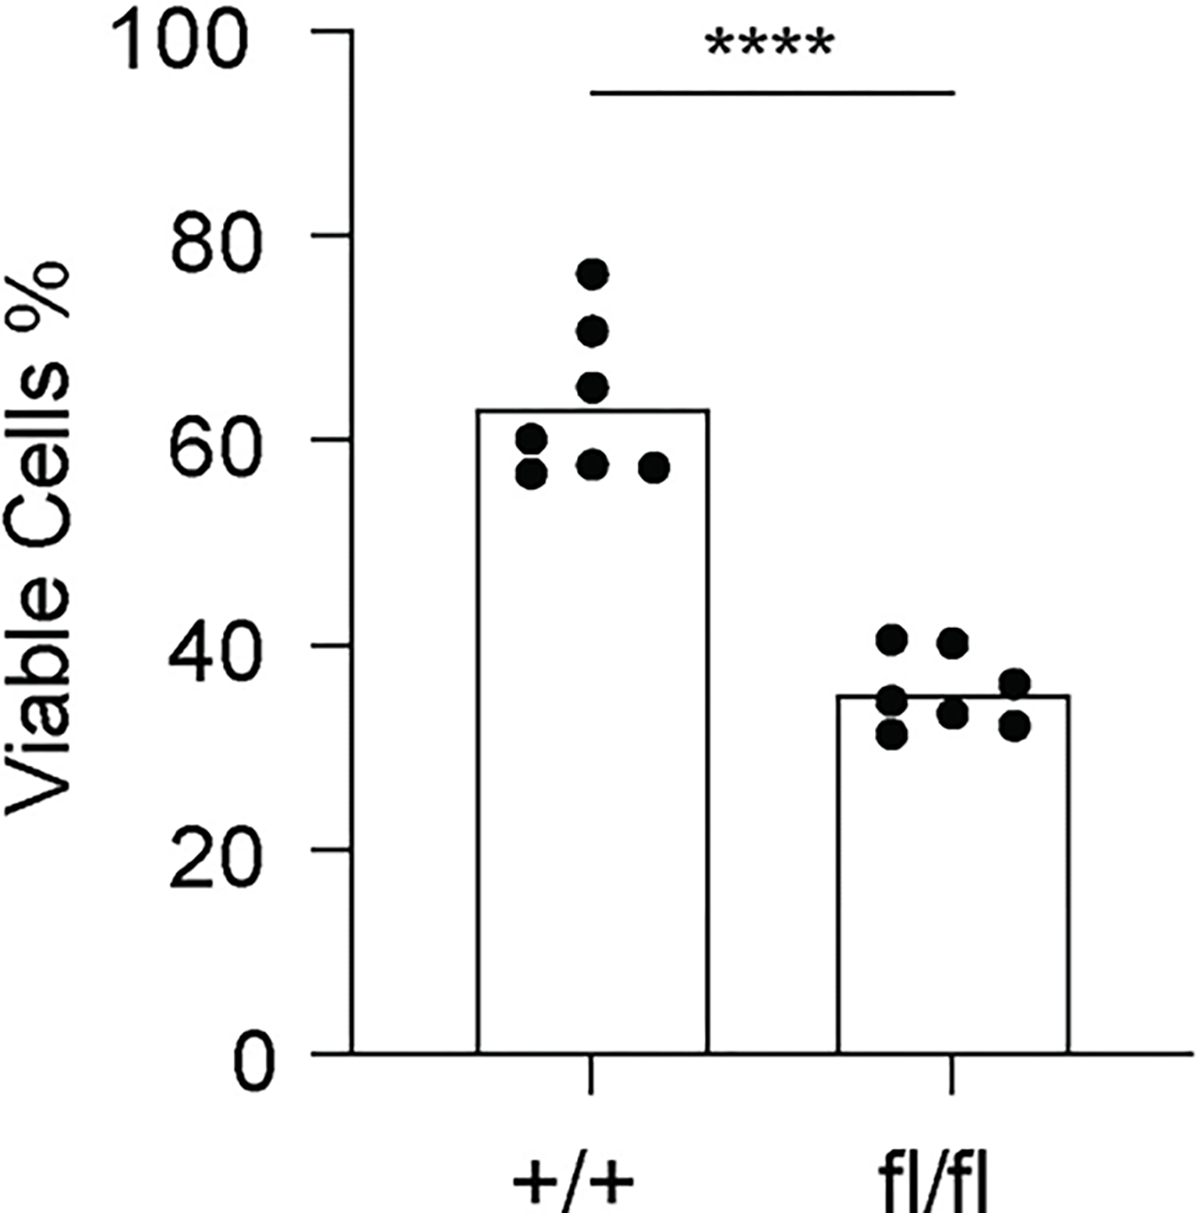
B cells isolated from SCAP+/+ CD19Cre/+ (+/+) mice and SCAPfl/fl CD19Cre/+ (fl/fl) mice were stimulated with 20 μg/ml anti-IgM for 2 days. Cell viability was measured by a cell counter with AO/PI staining. Data represent 7 biological replicates from 2 independent experiments. P value is determined by two-tailed unpaired t-test. ****P ≤ 0.0001.
Extended Data Fig. 8. Altered signaling in activated SCAP deficient B cells.
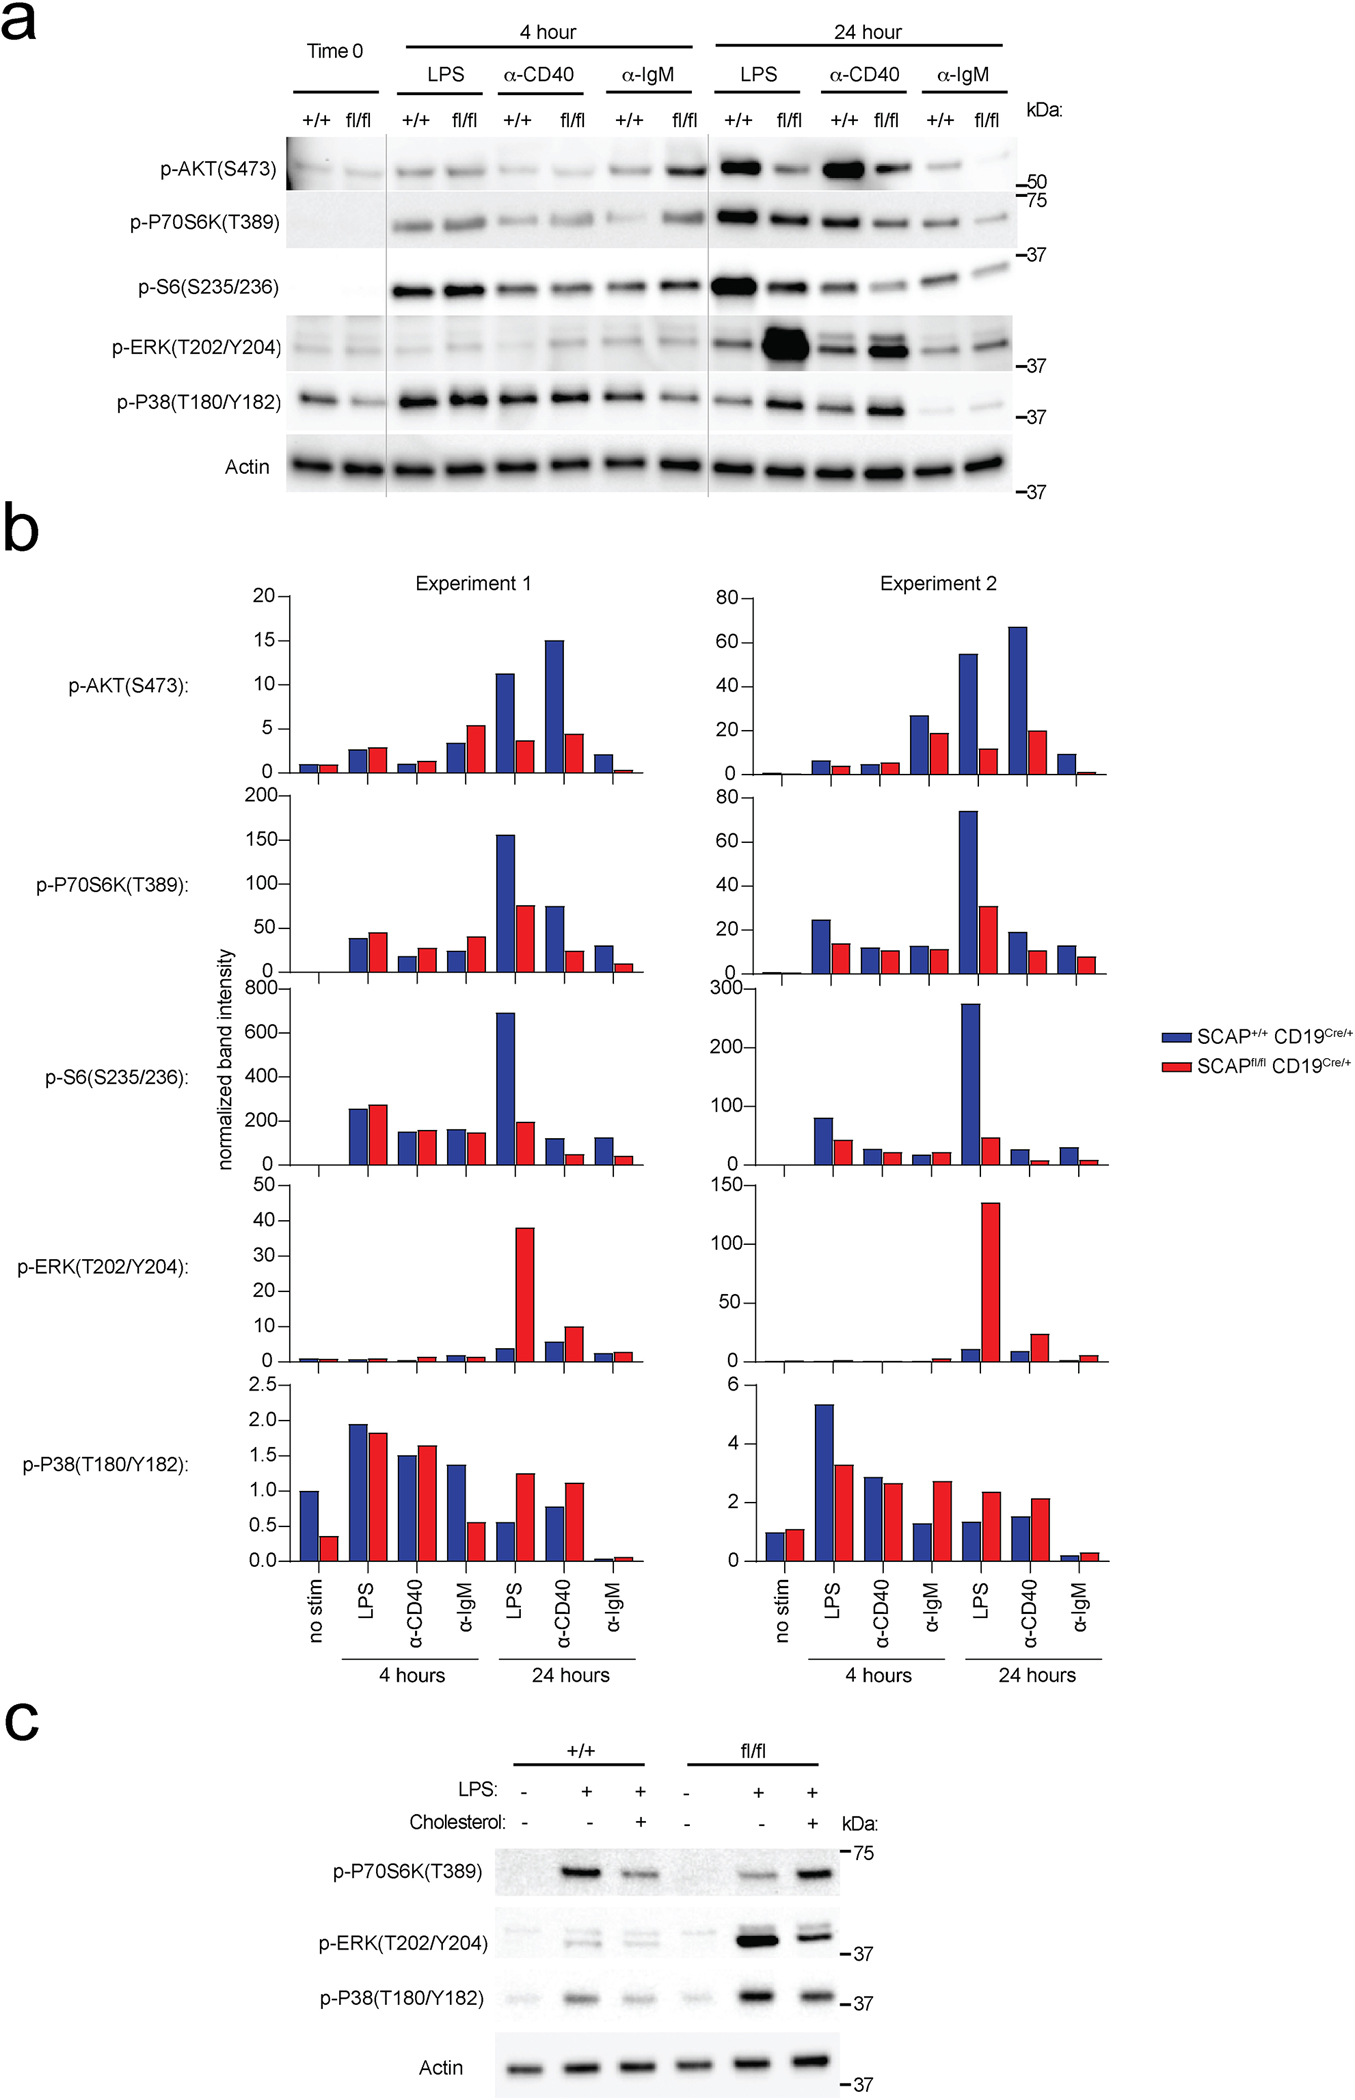
B cells isolated from SCAP+/+CD19Cre/+ mice and SCAPfl/flCD19Cre/+ mice were stimulated with 10 μg/ml LPS, 5 μg/ml anti-CD40 or 20 μg/ml anti-IgM for 0, 4 and 24 hours. Cell lysates were analyzed by immunoblotting. a. Representative immunoblotting. b. Quantitation of 2 independent immunoblotting experiments. c. B cells isolated from SCAP+/+ CD19Cre/+ mice and SCAPfl/fl CD19Cre/+ mice were stimulated with 10 μg/ml LPS and cultured with or without 5 μg/mL MβCD conjugated cholesterol for 24 hours. Data shown is a representative immunoblotting of 2 independent experiments.
Extended Data Fig. 9. Metabolomics reveals global metabolic changes in SCAP deficient B cells.
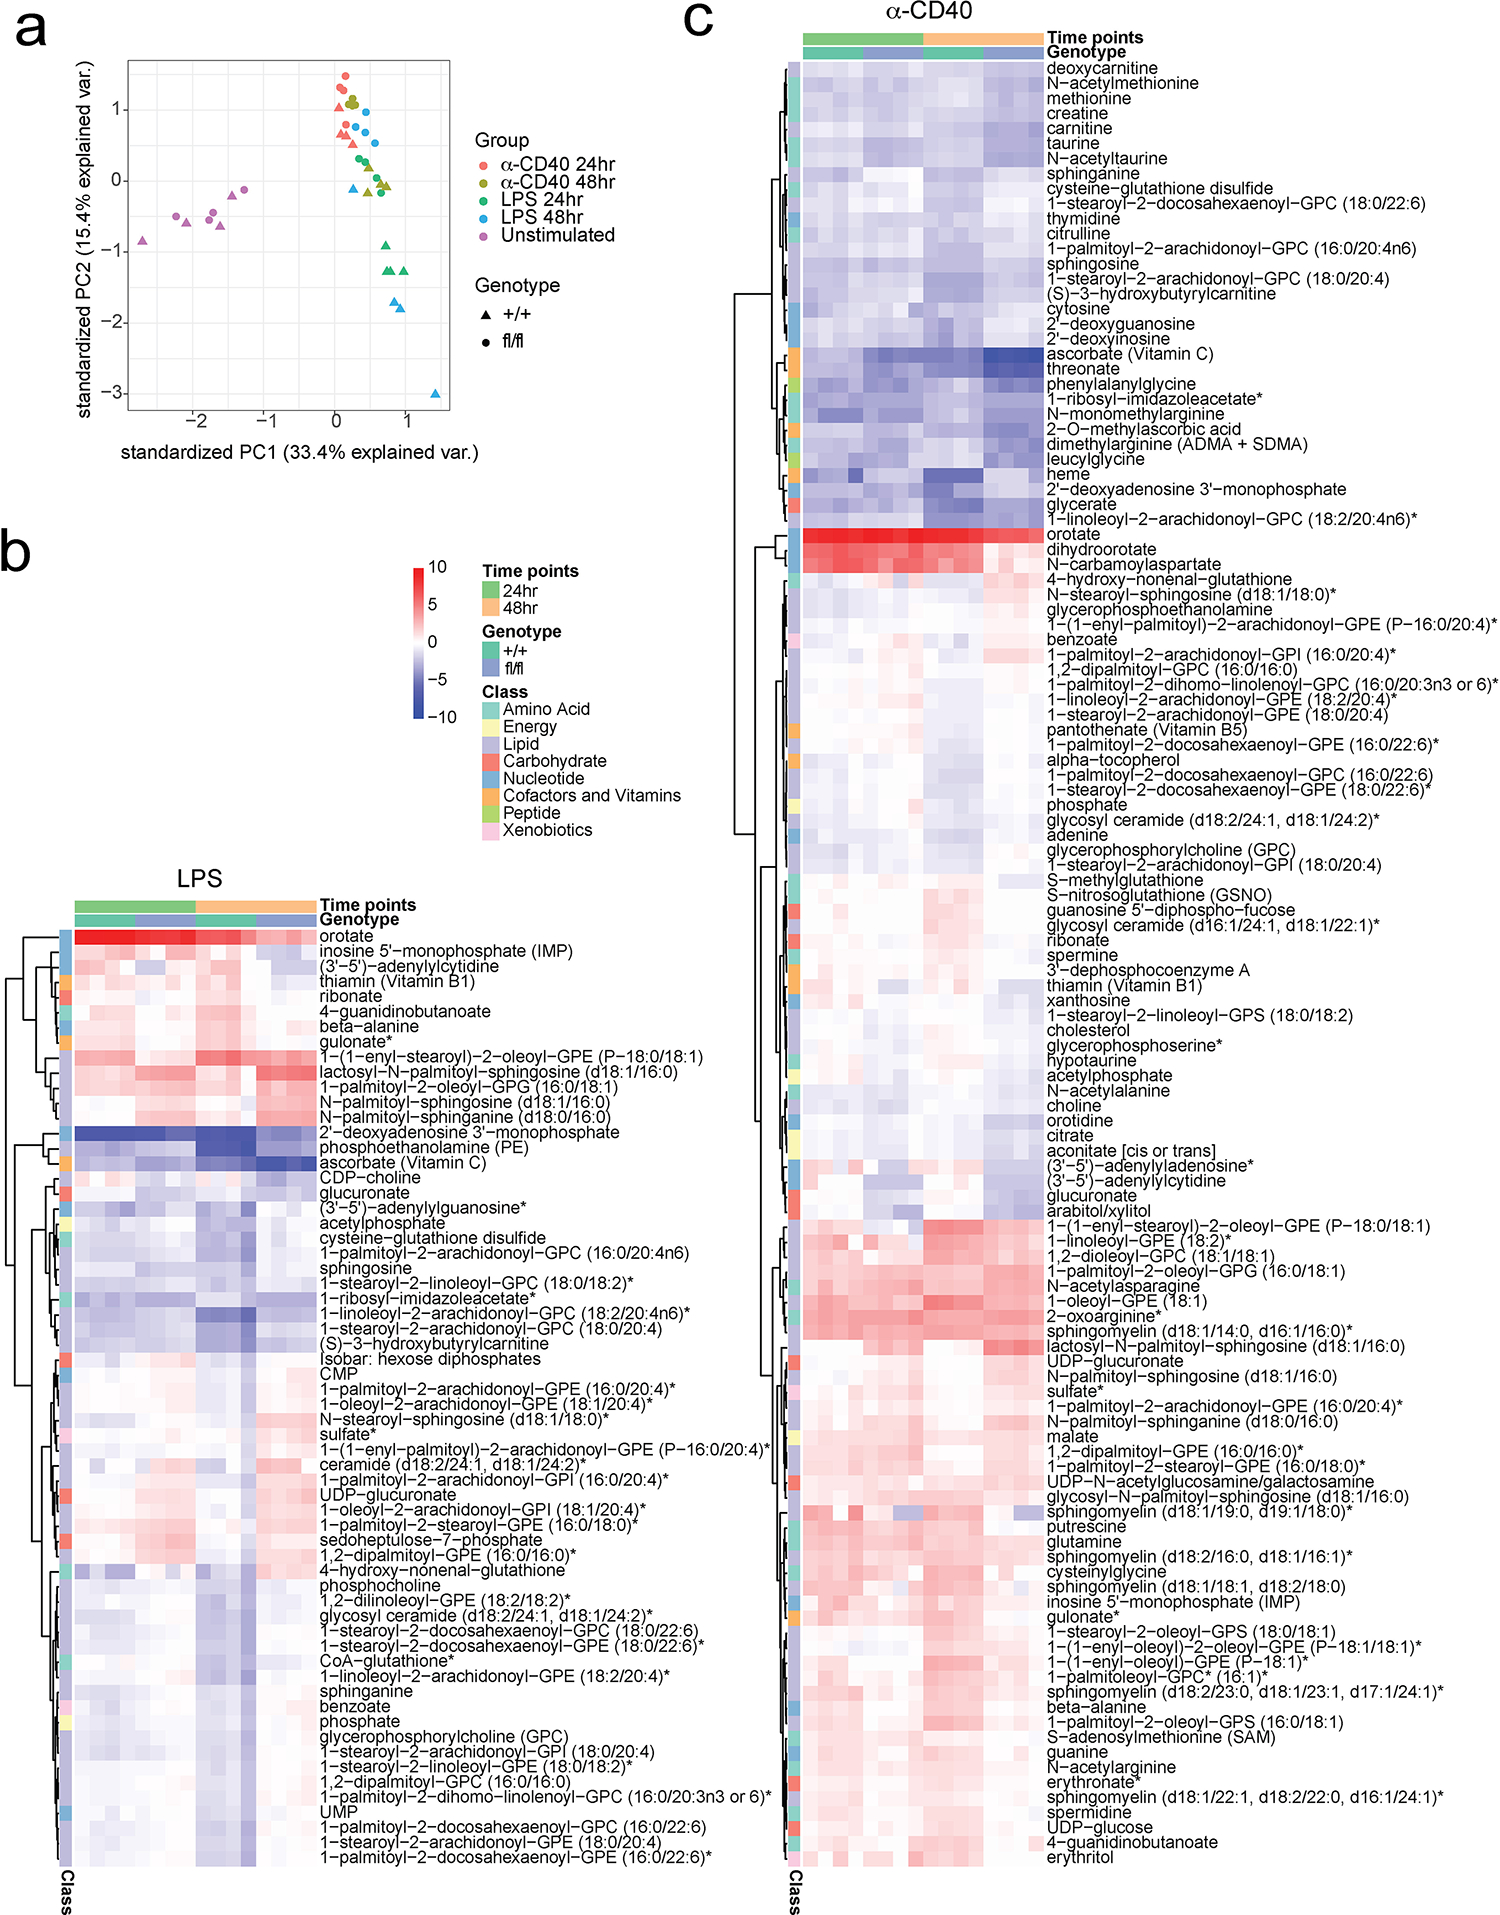
Splenic B cells isolated from SCAP+/+ CD19Cre/+ (+/+) mice and SCAPfl/fl CD19Cre/+ (fl/fl) mice were stimulated with 10 μg/ml LPS or 5 μg/ml anti-CD40 tetramer for 24 and 48 hours. Cells were then analyzed by metabolomics. a. PCA plot showing the differences of all replicates between different treatments in different genotypes. b-c. Heatmap of altered metabolites (FDR < 0.05, log2 Fold Change >1) marked by their pathways. Colors represent log2 FC relative to the untreated corresponding genotype samples. Four biological replicates generated from two experiments were used for metabolomics analysis.
Extended Data Fig. 10. SREBP signaling regulates GC B cell response.
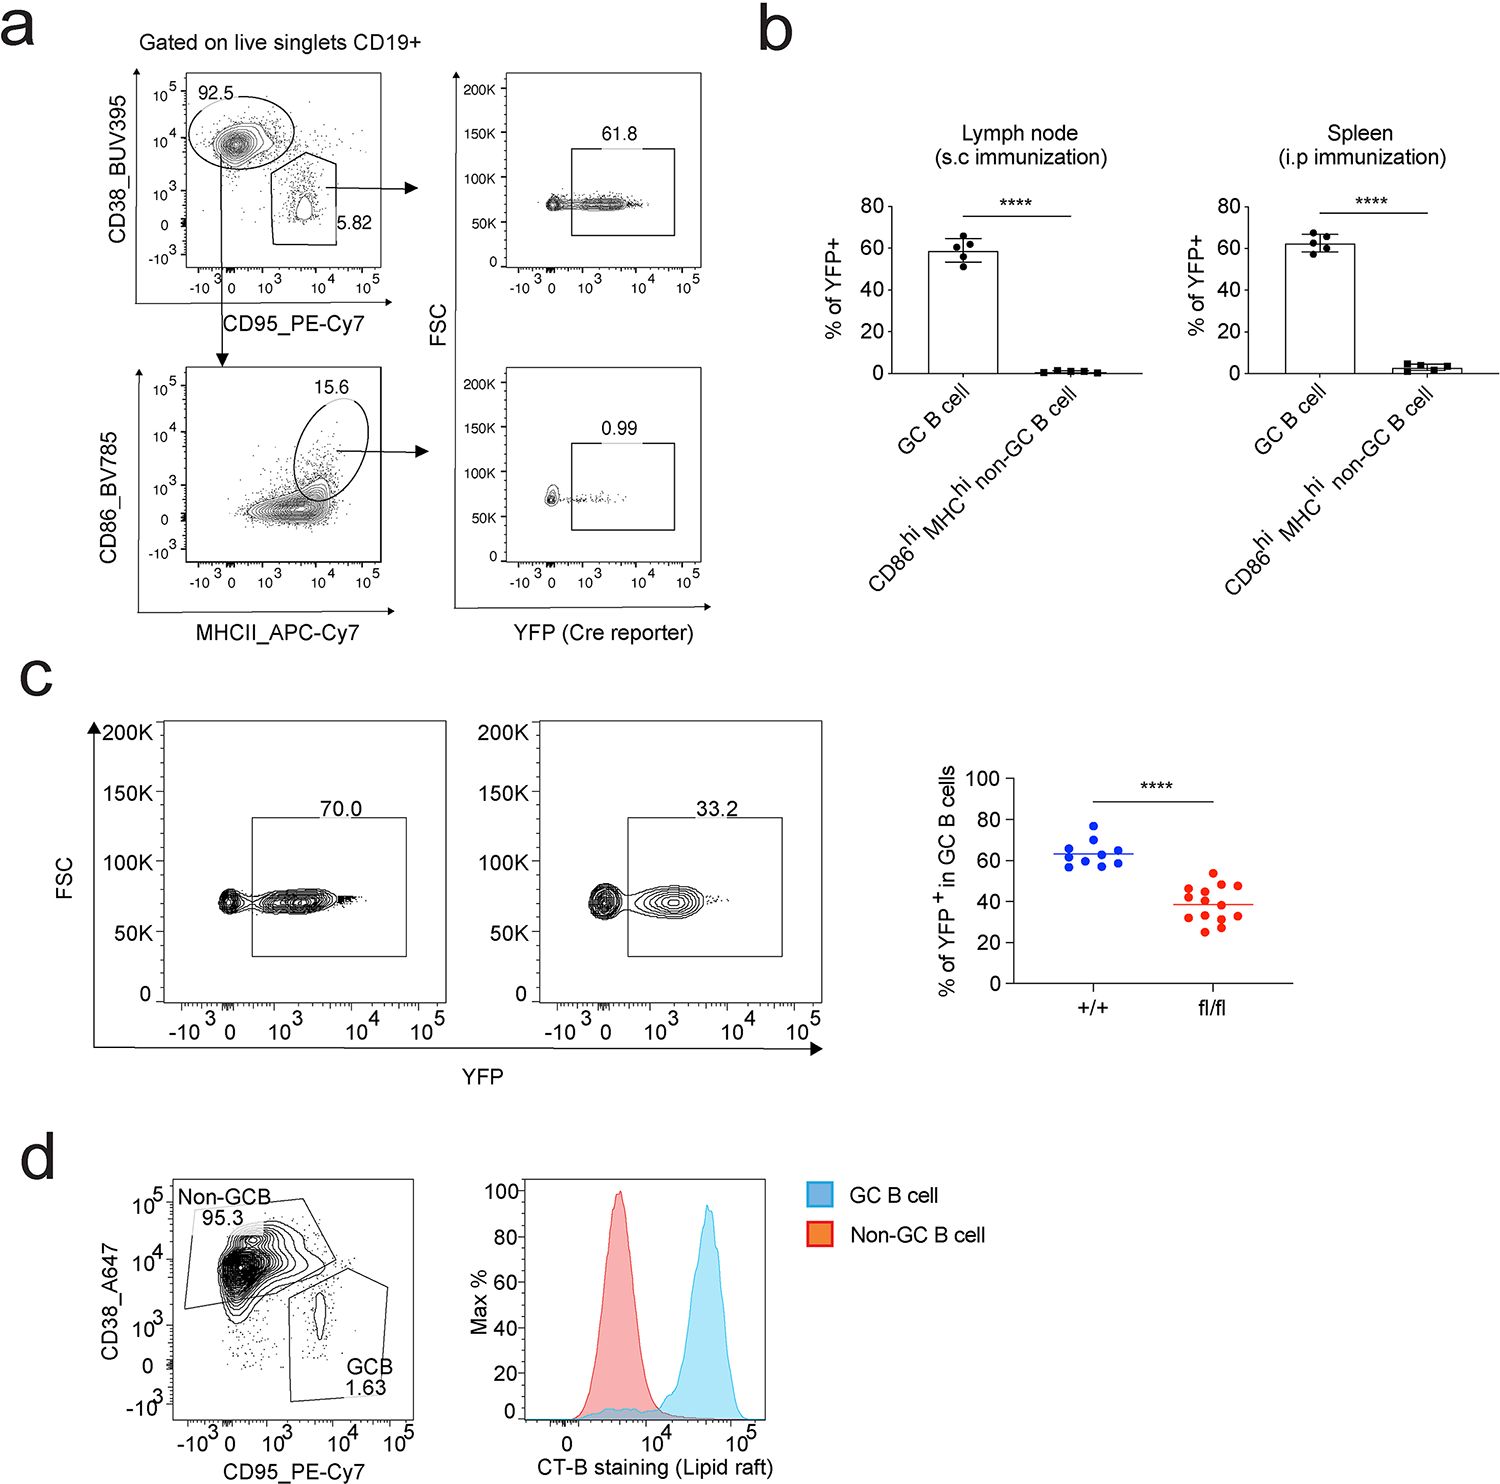
a-b. AID-Cre R26YFP mice were immunized with NP-OVA adjuvanted by RIBI through i.p or s.c. Splenocytes (i.p immunization) and dLN cells (s.c immunization) were analyzed by FACS 10 days post immunization. GC B cells and CD86hi MHCIIhi non-GC B cells were compared for Cre activity through their YFP reporter expression. a shows the gating strategy; b shows the statistical analysis of 2 independent experiments (n = 5, mean ± SD). c. SCAP+/+ AID-Cre R26YFP mice (+/+) and SCAPfl/fl AID-Cre R26YFP mice (fl/fl) were i.p. immunized with NP-OVA adjuvanted with RIBI. Cells in the spleen were analyzed by FACS 14 days post immunization for the % of YFP+ GC B cells in total GC B cells (gated on CD19+CD95+CD38− live singlets). 10 + /+ and 14 fl/fl mice from 4 independent experiments were analyzed. a-c, P values were determined by two-tailed unpaired t-test. ****P ≤ 0.0001. d. Splenocytes from day 14 RIBI adjuvanted NP-OVA immunization were analyzed by FACS to compared lipid raft content between GC and non-GC B cells. Lipid rafts were stained with cholera toxin subunit B (CT-B). Data show one representative of two independent experiments.
Acknowledgements:
We thank next generation sequencing services provided by the Yerkes NHP Genomics Core which is supported in part by NIH P51 OD011132. Sequencing data was acquired on an Illumina NovaSeq6000 funded by NIH S10 OD026799. We thank Dr. Rafael Casellas (NIH) for providing the AID-Cre R26YFP mice. We acknowledge the NIH (grants R37 DK057665, R37 AI048638, U19 AI090023, and U19 AI057266) and the Bill and Melinda Gates Foundation, and the Soffer Fund endowment and Open Philanthropy to B.P. for supporting this work in Bali Pulendran’s lab.
Footnotes
Competing interests: The authors declare no competing interests.
Code availability
All analyses and visualizations were performed in R. Computer code is available upon reasonable request.
Data availability
RNA-seq data generated in this study have been deposited in NCBI-Gene Expression Omnibus (GEO) database under accession nos. GSE204913 and GSE206016. Metabolomics data have been provided in Source Data Fig.4.
References
- 1.Hu J, Ge H, Newman M & Liu K. OSA: a fast and accurate alignment tool for RNA-Seq. Bioinformatics 28, 1933–1934 (2012). [DOI] [PubMed] [Google Scholar]
- 2.Love MI, Huber W & Anders S. Moderated estimation of fold change and dispersion for RNA-seq data with DESeq2. Genome Biol 15, 550 (2014). [DOI] [PMC free article] [PubMed] [Google Scholar]
- 3.Luo W & Brouwer C. Pathview: an R/Bioconductor package for pathway-based data integration and visualization. Bioinformatics 29, 1830–1831 (2013). [DOI] [PMC free article] [PubMed] [Google Scholar]
References
- 1.Luo W & Yin Q B Cell Response to Vaccination. Immunol Invest, 1–22 (2021). 10.1080/08820139.2021.1903033 [DOI] [PubMed] [Google Scholar]
- 2.Cyster JG & Allen CDC B Cell Responses: Cell Interaction Dynamics and Decisions. Cell 177, 524–540 (2019). 10.1016/j.cell.2019.03.016 [DOI] [PMC free article] [PubMed] [Google Scholar]
- 3.Baumgarth N The Shaping of a B Cell Pool Maximally Responsive to Infections. Annu Rev Immunol 39, 103–129 (2021). 10.1146/annurev-immunol-042718-041238 [DOI] [PMC free article] [PubMed] [Google Scholar]
- 4.Luo W et al. The AKT kinase signaling network is rewired by PTEN to control proximal BCR signaling in germinal center B cells. Nat Immunol 20, 736–746 (2019). 10.1038/s41590-019-0376-3 [DOI] [PMC free article] [PubMed] [Google Scholar]
- 5.Luo W, Weisel F & Shlomchik MJ B Cell Receptor and CD40 Signaling Are Rewired for Synergistic Induction of the c-Myc Transcription Factor in Germinal Center B Cells. Immunity 48, 313–326 e315 (2018). 10.1016/j.immuni.2018.01.008 [DOI] [PMC free article] [PubMed] [Google Scholar]
- 6.Weisel FJ et al. Germinal center B cells selectively oxidize fatty acids for energy while conducting minimal glycolysis. Nat Immunol 21, 331–342 (2020). 10.1038/s41590-020-0598-4 [DOI] [PMC free article] [PubMed] [Google Scholar]
- 7.Chen D et al. Coupled analysis of transcriptome and BCR mutations reveals role of OXPHOS in affinity maturation. Nat Immunol 22, 904–913 (2021). 10.1038/s41590-021-00936-y [DOI] [PubMed] [Google Scholar]
- 8.Mesin L, Ersching J & Victora GD Germinal Center B Cell Dynamics. Immunity 45, 471–482 (2016). 10.1016/j.immuni.2016.09.001 [DOI] [PMC free article] [PubMed] [Google Scholar]
- 9.Li S et al. Metabolic Phenotypes of Response to Vaccination in Humans. Cell 169, 862–877 e817 (2017). 10.1016/j.cell.2017.04.026 [DOI] [PMC free article] [PubMed] [Google Scholar]
- 10.Horton JD, Goldstein JL & Brown MS SREBPs: activators of the complete program of cholesterol and fatty acid synthesis in the liver. J Clin Invest 109, 1125–1131 (2002). 10.1172/JCI15593 [DOI] [PMC free article] [PubMed] [Google Scholar]
- 11.Brown MS, Radhakrishnan A & Goldstein JL Retrospective on Cholesterol Homeostasis: The Central Role of Scap. Annu Rev Biochem 87, 783–807 (2018). 10.1146/annurev-biochem-062917-011852 [DOI] [PMC free article] [PubMed] [Google Scholar]
- 12.Kidani Y et al. Sterol regulatory element-binding proteins are essential for the metabolic programming of effector T cells and adaptive immunity. Nat Immunol 14, 489–499 (2013). 10.1038/ni.2570 [DOI] [PMC free article] [PubMed] [Google Scholar]
- 13.Matsuda M et al. SREBP cleavage-activating protein (SCAP) is required for increased lipid synthesis in liver induced by cholesterol deprivation and insulin elevation. Genes Dev 15, 1206–1216 (2001). 10.1101/gad.891301 [DOI] [PMC free article] [PubMed] [Google Scholar]
- 14.Querec T et al. Yellow fever vaccine YF-17D activates multiple dendritic cell subsets via TLR2, 7, 8, and 9 to stimulate polyvalent immunity. J Exp Med 203, 413–424 (2006). 10.1084/jem.20051720 [DOI] [PMC free article] [PubMed] [Google Scholar]
- 15.Stoddart A, Jackson AP & Brodsky FM Plasticity of B cell receptor internalization upon conditional depletion of clathrin. Mol Biol Cell 16, 2339–2348 (2005). 10.1091/mbc.e05-01-0025 [DOI] [PMC free article] [PubMed] [Google Scholar]
- 16.Janes PW, Ley SC & Magee AI Aggregation of lipid rafts accompanies signaling via the T cell antigen receptor. J Cell Biol 147, 447–461 (1999). 10.1083/jcb.147.2.447 [DOI] [PMC free article] [PubMed] [Google Scholar]
- 17.Kraus M, Alimzhanov MB, Rajewsky N & Rajewsky K Survival of resting mature B lymphocytes depends on BCR signaling via the Igalpha/beta heterodimer. Cell 117, 787–800 (2004). 10.1016/j.cell.2004.05.014 [DOI] [PubMed] [Google Scholar]
- 18.Zuccarino-Catania GV et al. CD80 and PD-L2 define functionally distinct memory B cell subsets that are independent of antibody isotype. Nat Immunol 15, 631–637 (2014). 10.1038/ni.2914 [DOI] [PMC free article] [PubMed] [Google Scholar]
- 19.Crotty S T Follicular Helper Cell Biology: A Decade of Discovery and Diseases. Immunity 50, 1132–1148 (2019). 10.1016/j.immuni.2019.04.011 [DOI] [PMC free article] [PubMed] [Google Scholar]
- 20.Yeh CH, Finney J, Okada T, Kurosaki T & Kelsoe G Primary germinal center-resident T follicular helper cells are a physiologically distinct subset of CXCR5(hi)PD-1(hi) T follicular helper cells. Immunity 55, 272–289 e277 (2022). 10.1016/j.immuni.2021.12.015 [DOI] [PMC free article] [PubMed] [Google Scholar]
- 21.Querec TD et al. Systems biology approach predicts immunogenicity of the yellow fever vaccine in humans. Nat Immunol 10, 116–125 (2009). 10.1038/ni.1688 [DOI] [PMC free article] [PubMed] [Google Scholar]
- 22.Kwak K, Akkaya M & Pierce SK B cell signaling in context. Nat Immunol 20, 963–969 (2019). 10.1038/s41590-019-0427-9 [DOI] [PubMed] [Google Scholar]
- 23.Hou B et al. Selective utilization of Toll-like receptor and MyD88 signaling in B cells for enhancement of the antiviral germinal center response. Immunity 34, 375–384 (2011). 10.1016/j.immuni.2011.01.011 [DOI] [PMC free article] [PubMed] [Google Scholar]
- 24.Kasturi SP et al. Programming the magnitude and persistence of antibody responses with innate immunity. Nature 470, 543–547 (2011). 10.1038/nature09737 [DOI] [PMC free article] [PubMed] [Google Scholar]
- 25.Han S et al. Cellular interaction in germinal centers. Roles of CD40 ligand and B7–2 in established germinal centers. J Immunol 155, 556–567 (1995). [PubMed] [Google Scholar]
- 26.Yan S et al. Long-chain acyl-CoA synthetase in fatty acid metabolism involved in liver and other diseases: an update. World J Gastroenterol 21, 3492–3498 (2015). 10.3748/wjg.v21.i12.3492 [DOI] [PMC free article] [PubMed] [Google Scholar]
- 27.Waters LR, Ahsan FM, Wolf DM, Shirihai O & Teitell MA Initial B Cell Activation Induces Metabolic Reprogramming and Mitochondrial Remodeling. iScience 5, 99–109 (2018). 10.1016/j.isci.2018.07.005 [DOI] [PMC free article] [PubMed] [Google Scholar]
- 28.Bowman CE et al. The Mammalian Malonyl-CoA Synthetase ACSF3 Is Required for Mitochondrial Protein Malonylation and Metabolic Efficiency. Cell Chem Biol 24, 673–684 e674 (2017). 10.1016/j.chembiol.2017.04.009 [DOI] [PMC free article] [PubMed] [Google Scholar]
- 29.Wang X & Proud CG Nutrient control of TORC1, a cell-cycle regulator. Trends Cell Biol 19, 260–267 (2009). 10.1016/j.tcb.2009.03.005 [DOI] [PubMed] [Google Scholar]
- 30.Valvezan AJ & Manning BD Molecular logic of mTORC1 signalling as a metabolic rheostat. Nat Metab 1, 321–333 (2019). 10.1038/s42255-019-0038-7 [DOI] [PMC free article] [PubMed] [Google Scholar]
- 31.Porstmann T et al. SREBP activity is regulated by mTORC1 and contributes to Akt-dependent cell growth. Cell Metab 8, 224–236 (2008). 10.1016/j.cmet.2008.07.007 [DOI] [PMC free article] [PubMed] [Google Scholar]
- 32.Lewis CA, Griffiths B, Santos CR, Pende M & Schulze A Regulation of the SREBP transcription factors by mTORC1. Biochem Soc Trans 39, 495–499 (2011). 10.1042/BST0390495 [DOI] [PubMed] [Google Scholar]
- 33.Winter JN, Jefferson LS & Kimball SR ERK and Akt signaling pathways function through parallel mechanisms to promote mTORC1 signaling. Am J Physiol Cell Physiol 300, C1172–1180 (2011). 10.1152/ajpcell.00504.2010 [DOI] [PMC free article] [PubMed] [Google Scholar]
- 34.Heberle AM et al. The PI3K and MAPK/p38 pathways control stress granule assembly in a hierarchical manner. Life Sci Alliance 2 (2019). 10.26508/lsa.201800257 [DOI] [PMC free article] [PubMed] [Google Scholar]
- 35.Zhu J & Thompson CB Metabolic regulation of cell growth and proliferation. Nat Rev Mol Cell Biol 20, 436–450 (2019). 10.1038/s41580-019-0123-5 [DOI] [PMC free article] [PubMed] [Google Scholar]
- 36.Li F, Xu W & Zhao S Regulatory roles of metabolites in cell signaling networks. J Genet Genomics 40, 367–374 (2013). 10.1016/j.jgg.2013.05.002 [DOI] [PubMed] [Google Scholar]
- 37.Worgall TS, Juliano RA, Seo T & Deckelbaum RJ Ceramide synthesis correlates with the posttranscriptional regulation of the sterol-regulatory element-binding protein. Arterioscler Thromb Vasc Biol 24, 943–948 (2004). 10.1161/01.atv.0000125703.20434.4d [DOI] [PubMed] [Google Scholar]
- 38.Worgall TS Sphingolipid synthetic pathways are major regulators of lipid homeostasis. Adv Exp Med Biol 721, 139–148 (2011). 10.1007/978-1-4614-0650-1_9 [DOI] [PubMed] [Google Scholar]
- 39.Chatterjee S, Balram A & Li W Convergence: Lactosylceramide-Centric Signaling Pathways Induce Inflammation, Oxidative Stress, and Other Phenotypic Outcomes. Int J Mol Sci 22 (2021). 10.3390/ijms22041816 [DOI] [PMC free article] [PubMed] [Google Scholar]
- 40.Mu H et al. Lactosylceramide promotes cell migration and proliferation through activation of ERK1/2 in human aortic smooth muscle cells. Am J Physiol Heart Circ Physiol 297, H400–408 (2009). 10.1152/ajpheart.01254.2008 [DOI] [PubMed] [Google Scholar]
- 41.Chatterjee S, Shi WY, Wilson P & Mazumdar A Role of lactosylceramide and MAP kinase in the proliferation of proximal tubular cells in human polycystic kidney disease. J Lipid Res 37, 1334–1344 (1996). [PubMed] [Google Scholar]
- 42.Novgorodov SA et al. Lactosylceramide contributes to mitochondrial dysfunction in diabetes. J Lipid Res 57, 546–562 (2016). 10.1194/jlr.M060061 [DOI] [PMC free article] [PubMed] [Google Scholar]
- 43.Volkel W et al. Glutathione conjugates of 4-hydroxy-2(E)-nonenal as biomarkers of hepatic oxidative stress-induced lipid peroxidation in rats. Free Radic Biol Med 38, 1526–1536 (2005). 10.1016/j.freeradbiomed.2005.02.015 [DOI] [PubMed] [Google Scholar]
- 44.Black S, Nicolay U, Del Giudice G & Rappuoli R Influence of Statins on Influenza Vaccine Response in Elderly Individuals. J Infect Dis 213, 1224–1228 (2016). 10.1093/infdis/jiv456 [DOI] [PubMed] [Google Scholar]
- 45.Omer SB et al. Impact of Statins on Influenza Vaccine Effectiveness Against Medically Attended Acute Respiratory Illness. J Infect Dis 213, 1216–1223 (2016). 10.1093/infdis/jiv457 [DOI] [PMC free article] [PubMed] [Google Scholar]
- 46.Yusuf I & Fruman DA Regulation of quiescence in lymphocytes. Trends Immunol 24, 380–386 (2003). 10.1016/s1471-4906(03)00141-8 [DOI] [PubMed] [Google Scholar]
- 47.Ricker E et al. Serine-threonine kinase ROCK2 regulates germinal center B cell positioning and cholesterol biosynthesis. J Clin Invest 130, 3654–3670 (2020). 10.1172/JCI132414 [DOI] [PMC free article] [PubMed] [Google Scholar]
- 48.Trindade BC et al. The cholesterol metabolite 25-hydroxycholesterol restrains the transcriptional regulator SREBP2 and limits intestinal IgA plasma cell differentiation. Immunity 54, 2273–2287 e2276 (2021). 10.1016/j.immuni.2021.09.004 [DOI] [PMC free article] [PubMed] [Google Scholar]
- 49.Reboldi A & Cyster JG Peyer’s patches: organizing B-cell responses at the intestinal frontier. Immunol Rev 271, 230–245 (2016). 10.1111/imr.12400 [DOI] [PMC free article] [PubMed] [Google Scholar]
- 50.Assmann N et al. Srebp-controlled glucose metabolism is essential for NK cell functional responses. Nat Immunol 18, 1197–1206 (2017). 10.1038/ni.3838 [DOI] [PubMed] [Google Scholar]
Associated Data
This section collects any data citations, data availability statements, or supplementary materials included in this article.
Data Availability Statement
RNA-seq data generated in this study have been deposited in NCBI-Gene Expression Omnibus (GEO) database under accession nos. GSE204913 and GSE206016. Metabolomics data have been provided in Source Data Fig.4.


