

Abstract
The N-nitrosamine, N-nitrosodimethylamine (NDMA), is an environmental mutagen and rodent carcinogen. Small levels of NDMA have been identified as an impurity in some commonly used drugs, resulting in several product recalls. In this study, NDMA was evaluated in an OECD TG-488 compliant Muta™Mouse gene mutation assay (28-day oral dosing across seven daily doses of 0.02-4 mg/kg/day) using an integrated design that assessed mutation at the transgenic lacZ locus in various tissues and at the endogenous Pig-a gene-locus, along with micronucleus frequencies in peripheral blood. Liver pathology was determined together with NDMA exposure in blood and liver. The additivity of mutation induction was assessed by including two acute single-dose treatment groups (i.e. 5 and 10 mg/kg dose on Day 1), which represented the same total dose as two of the repeat dose treatment groups. NDMA did not induce statistically significant increases in mean lacZ mutant frequency (MF) in bone marrow, spleen, bladder, or stomach, nor in peripheral blood (Pig-a mutation or micronucleus induction) when tested up to 4 mg/kg/day. There were dose-dependent increases in mean lacZ MF in the liver, lung, and kidney following 28-day repeat dosing or in the liver and kidney after a single dose (10 mg/kg). No observed genotoxic effect levels (NOGEL) were determined for the positive repeat dose–response relationships. Mutagenicity did not exhibit simple additivity in the liver since there was a reduction in MF following NDMA repeat dosing compared with acute dosing for the same total dose. Benchmark dose modelling was used to estimate point of departure doses for NDMA mutagenicity in Muta™Mouse and rank order target organ tissue sensitivity (liver > kidney or lung). The BMD50 value for liver was 0.32 mg/kg/day following repeat dosing (confidence interval 0.21–0.46 mg/kg/day). In addition, liver toxicity was observed at doses of ≥ 1.1 mg/kg/day NDMA and correlated with systemic and target organ exposure. The integration of these results and their implications for risk assessment are discussed.
Keywords: N-nitrosamine, N-Nitrosodimethylamine, Muta™Mouse gene mutation assay, point of departure, Benchmark dose modelling
Introduction
N-Nitrosodimethylamine (NDMA), also known as dimethylnitrosamine (DMN), is the simplest dialkylnitrosamine and a member of the class of chemicals known as N-nitrosamines. The genotoxicity of NDMA has been demonstrated in multiple assay systems, both in vitro and in vivo and it is a recognized carcinogen in animal studies [1–4]. NDMA is present in the environment from both natural and anthropogenic sources and based on historical data, worst-case estimates of daily human exposure from the environment have been determined [2]. Recently, NDMA was identified as a contamination impurity in some commonly used pharmaceuticals, and this has resulted in several drug recalls by regulatory authorities [5,6].
Following ingestion, NDMA is absorbed quickly in animals (>90%), and NDMA and its metabolites are widely distributed throughout the body. Metabolism involves either α-hydroxylation or de-nitrosation of the nitrosamine. Both pathways proceed via cytochrome P450 [CYP2E1]-dependent mixed function oxidase metabolism [7,8]. The α-hydroxylation pathway is primarily responsible for genotoxic activation and liver toxicity [9,10] and leads to equimolar formation of formaldehyde and mono-methylnitrosamine, which is chemically unstable and undergoes rapid rearrangement to a highly reactive methyldiazonium ion. This reactive species is a potent alkylating agent and is responsible for methylating biological macromolecules such as DNA, RNA, and proteins [8,9,11–14]. The toxicological profile of formaldehyde is well characterized; it is reported to be mutagenic in bacterial and mammalian cells, and its carcinogenic properties are specific to the route of administration where weight of evidence indicates it is carcinogenic via the inhalation but not the oral route [15]. Upon further metabolism, formaldehyde is ultimately converted to carbon dioxide.
Hepatic CYP2E1 is a highly inducible enzyme, via a post-transcriptional regulatory mechanism [16,17], and the liver is the most sensitive tissue for NDMA induced mutagenesis in transgenic rodent (TGR) mutation assays [18–21] and the most sensitive target organ for tumour induction in the rat [22], although tumours in other organs have been reported [1,2,4]. In the mouse, the liver and lung are the primary targets, although rare tumours in other tissues, e.g. oesophagus and nasal cavity, have been observed [23]. Whereas studies of NDMA metabolic conversion in human liver preparations suggest there are no qualitative differences in metabolism between humans and laboratory animals [2], a comparative study of the bioactivation of NDMA showed hamster and mouse microsomes resulted in higher mutagenic activation compared with human and rat microsomes [24].
There are numerous reports confirming the in vivo mutagenicity of NDMA in various transgenic rodent (TGR) assays. For example, an early review of the performance of Muta™Mouse and Big Blue™ identified several studies where NDMA mutagenesis had been assessed in the liver [25]. These included single-dose or sub-chronic treatments via oral or inter-peritoneal routes of exposure and sampled at various time points after the final dose (ranging from 1 to 22 days). NDMA doses typically ranged between 1 and 20 mg/kg in most of the studies cited (10 mg/kg is the most common), and outcomes were generally positive for mutagenicity at doses ≥ 2 mg/kg, which typically resulted in ~2–5-fold increases in liver mutant frequencies (MF) compared with controls. Most of the studies had limited group sizes of three or four animals and would not be considered compliant for regulatory risk assessment purposes. Later studies investigated other parameters. For example, Butterworth et al. [26], assessed NDMA treatment (2, 4, or 8 mg/kg/day) in female Big Blue™ mice dosed by gavage for 4 days and sampled on Days 10, 30, 90, and 180 after treatment. Dose-related increases in MF (~2- to 5-fold) were seen in the liver compared with vehicle controls, and these were observed from Day 10 onwards, remaining stable over the 180-day sample period. The results suggest there is limited, if any contribution to the MF by clonal expansion in the liver under the test regimen used. Gollapudi et al. [19], investigated NDMA mutagenicity in male Fischer 344 Big Blue® rats (n = 4 per treatment group) dosed orally (0, 0.2, 0.6, 2.0, and 6.0 mg/kg/day). Rats received a total of nine doses over a 12-day period (daily dosing on test Days 1–5 and 8–11, respectively) and were sacrificed on Day 12, with liver MF determined at both the lacI and cII transgenic gene loci. NDMA was positive at the two highest doses tested, inducing a maximum of 4.7- and 4.2-fold increases in group mean MF at 6.0 mg/kg/day in lacI and cII, respectively, indicating there were no significant differences in either the spontaneous or NDMA induced liver MF between the two transgenic loci. The MF at lower doses were not statistically different from controls (i.e. P > 0.05 at 0.2 and 0.6 mg/kg/day with a 1.5- and 1.4-fold increase at the lacI and 1.1- and 1.2-fold increase at the cII locus, respectively). Both Jiao et al. [18] and Souliotis et al. [27] investigated NDMA mutagenesis in λlacZ transgenic mice (sic Muta™Mouse). Three single doses of 2, 6, and 10 mg/kg were administered orally in the first study, and MF increased in both 30- and 90-day liver samples but not in bone marrow [18]. In the second study, mice were treated with single doses of 5 or 10 mg/kg NDMA or 10 daily doses of 1 mg/kg/day. In addition to measuring MF in various tissues, changes in DNA N7- or O6-alkylguanine-DNA adducts and the repair enzyme, O6-methylguanine alkyl-transferase (AGT) were determined [27]. NDMA was positive for mutation induction in the liver but not in bone marrow, lung or spleen following single doses of 5 mg/kg across all sampling times (7, 14, 28, and 49 days) and was positive following a single dose of 10 mg/kg in the liver (Day 14 and Day 28) or spleen (on Day 28-day but not Day 14). When administered as a split dose (10 daily doses of 1 mg/kg/day NDMA), a positive response was observed in the liver on Day 28, but the MF was only ~2/3 of that seen with the single 10 mg/kg bolus dose. The authors reported increases in DNA adducts but noted a lack of proportionality between mutation induction and the administered dose or corresponding adduct levels, which they believed reflected NDMA-associated toxicity at higher doses [27]. In gptΔ neonatal mice, there was increased sensitivity to NDMA mutagenesis [28], which likely reflects the contribution of high rates of cell replication to mutation fixation in these young animals. There was also increased sensitivity to NDMA mutagenesis in methyl guanine methyltransferase deficient gptΔ mice [28,29] confirming the importance of the repair of DNA alkylation as a key defence mechanism [30].
Mutation signatures for NDMA have been reported following traditional Sanger–sequencing of mutant clones in various TGR studies [18,21,27,31,32]. Mutations were typically characterized in DNA extracted from liver tissues obtained from treatment groups, eliciting the highest increases in MF. The resulting signatures are somewhat variable, depending on the study design, treatment dose, the transgene sequenced, and the number of clones sampled. Nevertheless, a predominance of GC to AT transition mutations is apparent, and this is consistent with DNA-alkylation and the role of O6-methylguanine in shaping NDMA mutational spectra. More recently, bioinformatics has been used to compare an NDMA TGR mutational spectrum with the Catalogue of Somatic Mutations in Cancer (COSMIC) tri-nucleotide signatures, identifying similarities with human single base substitution (SBS) signatures SBS11 and SBS30 [33]. High-fidelity duplex sequencing (DS) of the transgenic locus from NDMA treated gptΔ mouse livers has since confirmed the predominance of GC to AT transition mutations in the liver and lung along with the presence of an SBS11-like tri-nucleotide signature [28].
In the current study, NDMA genotoxicity was evaluated in Muta™Mouse across a wide range of doses using an integrated study design. This included mutation assessment at the transgenic gene locus (a chromosomally integrated recombinant λgt10 phage shuttle vector containing the Escherichia coli lacZ reporter gene) in various tissues i.e. liver, lung, kidney, spleen, stomach, bladder, and bone marrow. Mutation at the endogenous, X-linked Pig-a gene locus was also evaluated along with micronucleus frequencies in peripheral blood erythrocytes. In addition, liver tissue pathology was investigated, and NDMA exposure was determined in blood and in the liver. Study design and animal treatments were performed according to the Organisation of Economic Co-operation and Development (OECD) test guidelines, i.e. TG 488 for the TGR assay and analysis of somatic mutation [34], TG 474 for the mammalian erythrocyte micronucleus test [35] and TG 470 for the Pig-a assay [36]. The study design comprised a 28-day treatment period and acute single-dose treatments, and all phases of the study were conducted under the principals of a robust data integrity framework. Additional dose groups and animals were included to better characterize dose–response relationships in the lower dose region. This scheme was selected to follow the guidance for TGR assays, support an appropriate manifestation time for induced mutation and avoid potential ‘founder effects’ at substantially longer treatments. Acute treatments were included to allow conclusions regarding the accumulation and/or additivity of individual dose effects. The liver was included as the most sensitive organ for mutation induction and bone marrow for reasons of comparison to the micronucleus endpoint used to assess clastogenic potential. Additionally, the selection permitted the comparison of tissues with differing CYP2E1 expression [37] and rates of cell turnover (e.g. rapid for bone marrow but slow in liver and kidney). Some of the other tissues, e.g. lung and kidney, were included as they are known targets for NDMA-induced tumorigenesis, along with the spleen (because of conflicting positive reports for mutagenesis in the literature), stomach (as a site of contact for oral NDMA administration), and bladder (as a site of urinary clearance).
Here, we present the results of the integrated study with NDMA in Muta™Mouse mice and from dose range finder studies in the parental strain, CD2F1 mice. Benchmark dose analysis of the dose–response relationships for NDMA-induced lacZ MF were determined, and these define conservative points-of-departure (PoD) for mutation induction whilst refining the previous BMD estimate for NDMA mutagenesis in the liver [38]. Further advanced dose–response analysis and modelling of NDMA TGR mutagenesis data will be reported elsewhere (Wills et al—manuscript in preparation) along with a separate manuscript describing additional tissue concentration measurements (McCugh et al.—in preparation). Together, these publications will help to inform the human risk assessment of NDMA.
Materials and methods
Chemicals
N-Nitrosodimethylamine (NDMA, CAS no. 62-75-9) purity 95% (Batch Number, 2020-0369507) was purchased from Enamine Ltd (Kyiv, Ukraine) and was stored at approximately 4°C protected from light. Dose formulations were prepared in 0.5% (w/v) aqueous methylcellulose (400 cps at 2%) and were stable and homogenous for 8 days when protected from light and stored at 15–25°C or for 16 days at 2–8°C. Fresh formulations were prepared weekly for the main Muta™Mouse study. Ethyl nitrosourea, cyclophosphamide, and ethyl methane sulphonate were purchased from Sigma (UK).
Animal supply and husbandry
All animal studies were ethically reviewed and carried out in accordance with Animals (Scientific Procedures) Act 1986 and the GSK Policy on the Care, Welfare and Treatment of Animals. CD2F1 (BALB/C × DBA2) mice (CD2F1/Crl), the parental strain of Muta™Mouse mice, were obtained from Charles River Ltd. (Italy) and Muta™Mouse (CD2-lacZ80/HazfBR) mice were obtained from Charles River (UK) Ltd, Margate, UK. Males only were evaluated since no notable sex differences have been reported for NDMA genotoxicity [2].
At GSK (Ware, UK), all CD2F1 mice (8–11 weeks old) were clinically inspected and weighed. The animals were individually identified using indelible ink tail marks and randomly allocated to cages and housed according to treatment group. They were provided free access to food (Purina Mills International 5CR4 EU Rodent Diet) and water (Veolia Water Plc). Room environment controls were set to maintain temperature and relative humidity in the range 19–23°C and 45–65%, respectively. Fluorescent lighting was controlled to give a cycle of 12 h light/dark. Animals were acclimatized for at least 12 days prior to treatment.
The Muta™Mouse study was conducted at LabCorp (Harrogate, UK). Mice (8–12 weeks old) were clinically inspected, weighed (~18–35 g) and individually identified using subcutaneous electronic transponders prior to random allocation to cages according to treatment groups. Mice were provided free access to food (5LF2 EU Rodent Diet) and mains water. Room environment controls were set to provide 15 to 20 air changes/hour and maintain temperature and relative humidity in the range 20–24°C and 45–65%, respectively. Fluorescent lighting was controlled automatically to give a cycle of 12 h light (0600 to 1800 GMT) and 12 h dark. Animals were acclimatized for 7 days prior to treatment, and a second health check was performed prior to dosing.
Animal treatments
Cages were identified with study information, including study number, study type, start date, number, and sex of animals, together with a description of the dose level and proposed time of necropsy. Health checks were conducted prior to dosing and at least twice daily during the in-life phase to ensure the weight variation of animals was minimal and did not exceed ± 20% of the mean weight. Final formulations were prepared prior to each dosing occasion (Labcorp) or weekly (GSK).
Dose range-finding studies
An initial dose range finder study was conducted at GSK using male CD2F1 mice (five animals per group) dosed orally, once daily for 14 consecutive days with NDMA (0.36, 1.125, or 2 mg/kg/day) in 0.5% (w/v) aqueous methylcellulose. Negative control animals received vehicle only. Three separate positive control treatment groups (n = 3 per group) received N-ethyl-N-nitrosourea (ENU, dosed at 40 mg/kg once daily on Days 1, 2, and 3) or cyclophosphamide (5 mg/kg once daily on Days 12 and 13) or ethyl methane sulphonate (300 mg/kg once on Day 15) orally by gavage (Table 1). All doses were administered at a dose volume of 10 ml/kg. Animals were sacrificed on Day 15. Clinical observations and body weight measurements were performed during the in-life portion of the study. Additional mice (n = 6 per group) were used to assess toxicokinetics following treatment with NDMA (0.36 and 2 mg/kg/day) on Days 1 and 14 (composite profile).
Table 1.
Study design in male CD2F1 mice treated with NDMA.
| Group number | Treatment | Dosea (mg/kg/day) | Number of animals |
|---|---|---|---|
| 1b | Vehiclec | 0 | 5 |
| 2b | NDMA | 0.36 | 5 |
| 3b | NDMA | 1.125 | 5 |
| 4b | NDMA | 2 | 5 |
| 5 | Positive Controld—ENU | 40 | 3 |
| 6 | Positive Controle—CPA | 5 | 3 |
| 7 | Positive Controlf—EMS | 300 | 3 |
| 8 | NDMA | 0.36 | 6g + 6h |
| 9 | NDMA | 2 | 6g + 6h |
CPA, Cyclophosphamide; EMS, Ethyl methanesuphonate; ENU, N-ethyl-N-nitrosourea; NDMA, N-Nitrosodimethylamine.
aExpressed in terms of parent compound.
bDosed once daily for 14 days; sampled 24 h after final dose.
cVehicle was 0.5% (w/v) aqueous methylcellulose.
dPig-a positive control was ENU. Animals were dosed orally (by gavage) once only on Days 1–3 and analysed for Pig-a mutations only.
eMicronucleus positive control was CPA. Animals were dosed orally (by gavage) once on Day 12 and 13 (24 h apart) and analysed for micronucleated reticulocytes only.
fComet positive control was EMS. Animals were dosed orally (by gavage) once only on Day 15 (3 h prior to termination) and analysed for Comets only.
gCompositive profiles for toxicokinetic analysis on Day 1.
hCompositive profiles for toxicokinetic analysis on Day 14.
To better define the high dose in the main Muta™Mouse study, a second dose range-finder study was completed at LabCorp (Harrogate, UK). Male animals were dosed with NDMA at 2 and 4 mg/kg/day for 14 days (n = 3 per group) and sacrificed on Day 15. Clinical observations and body weight measurements were performed daily during the in-life portion of this study.
Main study in Muta™Mouse
Mice (5–6 animals per group) were dosed orally by gavage with NDMA as described in Table 2. Negative control animals (n = 6) received vehicle (0.5% w/v aqueous methylcellulose), and positive control animals (n = 3) were treated with ENU at a dose of 50 mg/kg (po) daily for 3 days (on Days 1, 2, and 3). Dose volumes were based on individual animal body weights. All doses were administered at a dose volume of 10 ml/kg. Animals were humanely killed on Day 31 except for animal (M0903/group 10) that was terminated early due to excessive weight loss (no data collected). Animals were euthanized by cervical dislocation, under isoflurane anaesthesia, and death subsequently confirmed by exsanguination. Representative samples were taken from dose formulations in the main study and toxicokinetic (TK)/tissue disposition phases and analysed for achieved concentration and homogeneity to confirm accurate dosing.
Table 2.
Study design in male Muta™Mouse treated with NDMA.
| Group | Dosea (mg/kg/day) | N d | Total dosee (mg/kg) | Dose justification |
|---|---|---|---|---|
| 1b | 0 (Vehicle) | 6 | 0.00 | Negative control |
| 2b | 0.02 | 5 | 0.56 | Low dose to support NOGEL and modelling |
| 3b | 0.07 | 6 | 1.96 | Total dose equivalent to single positive bolus {Jiao, 1997 #18} and BMDL50 {Johnson, 2021 #38} |
| 4b | 0.19 | 6 | 5.32 | Provides 28-day assessment of mouse TD50 dose (0.189 mg/kg/day). |
| 5b | 0.36 | 6 | 10.08 | Total dose reproducibly positive as a single dose in multiple studies |
| 6b | 1.1 | 5 | 30.8 | Dose reported negative in several short terms TGR assays (see text) |
| 7b | 2.0 | 5 | 56.00 | Positive dose in Big Blue rat {Gollapudi, 1998 #19} |
| 8b | 4.0 | 5 | 112.00 | Likely positive dose (mutagenicity) and limited toxicity |
| 9c | 5.0 | 5 | 5.0 | Single-dose equivalent to total cumulative dose (group 4) |
| 10c | 10.0 | 5 | 10.0 | Single-dose equivalent to total cumulative dose (group 5) |
| 11f | 40 | 3 | 120 | Positive control—ENU |
BMDL, Benchmark dose lower confidence limit; ENU, N-ethyl-N-nitrosourea; NOGEL, no observed genotoxic effect level.
aExpressed in terms of the parent compound.
bDosed once daily for 28 days.
cSingle dose given on day 1.
d(N) animal group-size.
eCumulative total dose (mg/kg).
fENU positive control dosed once daily for 3 days.
Tissue sampling
CD2F1 dose range-finding study (GSK)
Blood samples were taken at necropsy to assess clinical pathology, micronucleus (MN) frequency, and mutation at the X-linked phosphatidylinositol glycan class A gene (Pig-a). Samples were processed according to standard procedures for clinical pathology, MicroFlowBASIC, and MutaFlow® (Litron Laboratories, Rochester, NY), respectively. In addition, liver samples were taken to assess DNA strand breaks (Comet assay). Blood samples from satellite animals dosed with 0.36 or 2 mg/kg/day NDMA were collected on Day 1 or Day 14 for toxicokinetic analysis.
Main study in Muta™Mouse (LabCorp)
For the micronucleus assay, peripheral blood samples were collected on the final day of treatment (Day 28) from the same animals euthanized three days later for the LacZ and Pig-a assays. Blood was collected from the tail vein in K2EDTA anticoagulant (nominal sample volume ~100 μl) and fixed with ice-cold methanol at −80°C. After ~5 days, fixed blood samples were centrifuged, rinsed, and transferred to a long-term storage solution. For the Pig-a assay, blood was collected on Day 31 via cardiac puncture in K2EDTA anticoagulant (nominal sample volume ~ 400 μl) and gently mixed by inversion. Samples (~100 μl) were added to 500 μl Rodent Blood Freezing Solution and stored at −80°C (Vivo MutaFlow® Kit). All samples were transferred to GSK for analysis. For the lacZ TGR mutation assay, various somatic tissues were removed at necropsy and flash frozen in liquid nitrogen. Tissues were stored (<−50°C) prior to DNA extraction at LabCorp (Harrogate UK).
Toxicokinetic (TK) and tissue disposition analysis in Muta™Mouse
Blood and urine samples were obtained from mice in the bioanalysis treatment groups. For in-life TK bleeds, ~125 μl whole blood samples were collected on necropsy Days 1 and 28. The animals were assigned to two separate groups for TK bleeds. For the first group, the earlier time points (5 and 30 min) were collected via jugular vein and terminal bleeds via cardiac puncture were at 1 h. For the second group, the earlier time points (0.25 and 2 h) were collected via jugular vein and terminal bleeds via cardiac puncture were at 4 h. Blood was collected into tubes containing appropriate volumes of K2EDTA and gently mixed by inversion. TK samples (120 μl) were mixed with water (50/50, v/v) in pre-labelled tubes, frozen and stored at −80°C prior to shipment to GSK for analysis. Urine samples were collected at 0–4 h and 4–24 h intervals on Days 26/27 using mouse metabolism cages equipped with free-catch urine containers of an appropriate size, preserved on ice just after collection. The total volume collected for each group was determined by weighing the collection vial before and after the collection interval. Samples from animals in each group were pooled and stored at approximately −20°C until shipment to GSK for analysis. Whole liver tissues were excised, and weights were recorded. The tissues were rinsed with saline and blotted dry to remove residual blood on the outside of the organ. Bone marrow samples were collected by rinsing each femur with 1 mL PBS (Phosphate buffered saline) and collecting all fluid into a sample tube. Right and left femur samples were collected into separate sample tubes. Liver and bone marrow samples were flash frozen in liquid nitrogen and then stored at −80°C prior to shipment to GSK for analysis.
Genetic toxicology assessments
Peripheral blood micronucleus assay
Blood samples were prepared using the MicroFlow Kit (Litron Laboratories, Rochester, USA) and analysed in a randomized order by flow cytometry using a MACSQuant® Analyzer 10 (Miltenyi Biotec Ltd., Bisley, UK) running MACSQuantify v2. Briefly, cells were stained with propidium iodide to label micronucleus DNA, and anti-CD71-FITC antibodies were used to label expressed transferrin receptors. Blood samples infected with a malarial parasite were used as an internal control for instrument set up [39,40]. The frequency of reticulocytes (RET), micronucleated reticulocytes (MN-RETsCD71+) and micronucleated red blood cells (MN-RBCsCD71-) were determined with ~20,000 RETCD71+ analysed per sample. Group mean values (and standard deviations) were calculated for micronucleus frequencies along with %RETCD71+ (relative to RBCs CD71-) to provide an indication of erythroid toxicity, consistent with OECD TG 474 (2016).
The Pig-a mutation assay
Pig-a mutant phenotype cell frequencies were determined in coded blood samples, analysed in a randomized order [41]. The frequency of mutant phenotype reticulocytes (RETCD24-), mutant phenotype erythrocytes (RBCCD24-) and %RET was determined for each sample, and group mean values (and standard deviations) were calculated for each endpoint [42]. An Instrument Calibration Standard was generated on each day of data acquisition. These samples contained a high prevalence of mutant-mimic cells and provided a means to define the location of CD24—GPI-anchor-deficient RETs and RBCs [43]. A MACSQuant® Analyzer 10 flow cytometer (Miltenyi Biotec Ltd., Bisley, UK) running MACSQuantify v2 was used for these analyses.
Muta™Mouse TGR (lacZ mutation) assay
Tissue processing, DNA extraction, vector recovery, and transfection of host bacteria
Tissues (liver, kidney, lung, bone marrow, spleen, stomach, and bladder) were processed, and high molecular weight DNA was extracted using Recoverease™ DNA isolation and purification kits (Agilent Technologies, Stockport, UK). Single copies of recombinant λgt10 phage vector were recovered by in vitro packaging (Transpack kits, Agilent Technologies, Stockport, UK). The resulting phage particles were used to transfect E. coli C (DlacZ, galE-, recA-, Kanr, (galE-, Ampr)). The lacZ mutation assay involved the scoring of titration plates to determine the total number of plaque-forming units (pfu) and selection plates containing phenyl-b,D-galactoside (P-gal) to determine the numbers of lacZ mutant pfu. For the titration plates, packaged DNA (10 μl) was diluted with SM buffer (190 μl), and 10 μl of this dilution was adsorbed to 500 μl suspension of E. coli C bacteria for approximately 20–30 min at room temperature. After adsorption, the phage/bacteria was suspended in 12 ml 1:3 LB:NaCl, 0.75% w/v agar (top agar) containing 10 mM magnesium sulphate and plated onto petri dishes (14 cm diameter) containing 12 ml 1:3 LB:NaCl, 1.5% w/v agar (bottom agar). Once the agar had set, the plates were inverted and incubated overnight at 37 ± 1°C. The remaining packaged DNA was divided equally into three tubes and incubated at room temperature with bacterial suspension (500 μl/tube) as above, suspended in top agar containing 10 mM magnesium sulphate and 0.3% w/v P-gal, and plated overnight as above.
Comet assay
Liver specimens were processed according to in-house GSK procedures using a high > pH 13 protocol. In brief, single-cell suspensions were prepared and embedded in agarose and layered onto slides. Cell membranes were lysed using a high salt and pH lysis buffer. DNA was allowed to unwind for 20 min in > pH 13 electrophoresis buffer prior to electrophoresis (0.74–0.8 V/cm) for 20 min at less than 8°C. Two slides per tissue were prepared from each animal, and quality was checked prior to scoring using Perceptive Instruments COMET IV image analysis system (Instem®, Staffordshire, UK).
Pathology
Histopathology
CD2F1 mouse liver samples were fixed in 10% Neutral Buffered Formalin, embedded in paraffin wax and sections were prepared and stained with haematoxylin and eosin (H&E). For the Muta™Mouse study, macroscopic observations and liver weights were recorded at necropsy. Livers from treatment groups 1–10 (Table 2) were fixed and embedded prior to shipment to GSK where tissue sections were prepared as above. For selected mouse livers, Schmorl’s and Perls’ Prussian blue histochemical stains were used to identify pigment observed in specimens from treatment groups 6 and above.
Immunohistochemistry
Cellular proliferation was assessed using immunohistochemical staining for Ki-67 expression in liver sections from Muta™Mouse study groups 1-10 (Table 2) using a knock-out validated, recombinant, rabbit anti-Ki-67 monoclonal primary antibody (0.2 µg/ml) (#ab16667, Abcam plc, Cambridge, UK). Staining was performed using a Ventana autostainer with detection by DAB chromogen. The potential for non-specific binding was assessed in serial sections using a concentration-matched IgG negative control (#ab172730, Abcam plc, Cambridge, UK). A section of the mouse spleen was also included as a Ki-67 positive control on each staining run.
Microscopic observations and image acquisition
All H&E and Ki-67-stained slides were digitized using a Pannoramic 250 slide scanner (3DHISTECH, Budapest, Hungary). Microscopic examination of the H&E-stained liver sections used both manual observation of the glass slides and the digitally scanned images with results recorded using INHAND terminology [44] and Provantis v10 software (Instem, Staffordshire, UK). The following microscopic changes were evaluated by a blind read, where the pathologist graded each finding without current knowledge of the treatment group on an ordinal scale (minimal, mild, moderate): centrilobular cytoplasmic pigment, centrilobular single cell necrosis, glycogen vacuolation, mitotic figures, and perivascular mononuclear inflammatory cells. An additional microscopic change, namely mixed inflammatory cells, was graded on a semiquantitative scale: 1 or 2 foci/ liver = minimal; ≥3 foci/liver or a single focus involving at least 50% of a lobule = mild. A focus was defined as a cluster of > 4 inflammatory cells.
Image analysis of hepatocyte Ki-67 expression and nuclear area
Automated analysis of hepatocyte Ki-67 expression and nuclear area was performed from the scanned slides using HALO image analysis software (version 3.3.2541.409, Indica Labs, Albuquerque, NM, USA.). First, a Densenet AI v2 model was trained to delineate two classes: background (defined as all areas without hepatocytes e.g. bile ducts, bile lumen, blood vessel lumen and inflammatory cells, etc.) and hepatocyte lobules. Next, an AI-phenotyper model was trained and executed only on delineated hepatocytes which enabled quantification and sizing of Ki-67-positive hepatocyte nuclei.
Clinical chemistry
In the CD2F1 study, liver clinical chemistry results for alanine aminotransferase, glutamate dehydrogenase, aspartate aminotransferase, alkaline phosphatase, total bilirubin, glucose, albumin, total protein, urea, creatinine, inorganic phosphorus, calcium, total cholesterol, and triglycerides were determined by standard procedures [45,46] using the ADVIA® Chemistry photometry system (Siemens Healthcare Diagnostics).
Bioanalysis and toxicokinetic analysis of NDMA
Dose range finding study in CD2F1 mice
Blood/water (50/50, v/v) samples from satellite animals given 0.36 or 2 mg/kg/day NDMA collected at various timepoints on Day 1 or Day 14 were analysed by UHPLC-MS/MS to assess systemic exposure. Briefly, NDMA levels were determined using liquid-liquid extraction followed by UHPLC-MS/MS analysis. The lower limit of quantification (LLOQ) for NDMA was 0.1 ng/ml in blood using an 80 µl aliquot of mouse blood/water (50/50, v/v) sample. Data was acquired and analysed using Analyst (version 1.7) and Watson (version 7.6.1) software. Quality Control samples (QCs) containing NDMA (prepared at three different analyte concentrations) were analysed with each sample batch against separately prepared calibration standards. For the analysis to be acceptable, no more than one third of the total QC results and no more than one-half of the results from each concentration level were to deviate from the nominal concentration by more than 20%. The applicable analytical runs met all predefined run acceptance criteria.
Muta™Mouse study
Blood/water (50/50, v/v) or urine samples were analysed for NDMA using a method based on liquid-liquid extraction followed by UHPLC-MS/MS analysis. The lower limit of quantification (LLOQ) for NDMA was 1.0 ng/ml in blood or urine using a 20 µl aliquot of mouse blood/water (50/50, v/v) or urine sample. Data were acquired and quantified using Analyst (version 1.7.1) and Watson (version 7.6.1) software. Quality Control samples (QCs) containing NDMA (prepared at three different analyte concentrations) were analysed with each sample batch against separately prepared calibration standards. For the analysis to be acceptable, no more than one third of the total QC results and no more than one-half of the results from each concentration level were to deviate from the nominal concentration by more than 20%. The applicable analytical runs met all predefined run acceptance criteria. Similarly, bone marrow flush and liver homogenate samples were analysed for NDMA using liquid–liquid extraction followed by UHPLC-MS/MS. The lower and higher limits of quantitation for each tissue were 0.1 ng/ml and 500 ng/ml, respectively, using 100 µl of liver homogenate or bone marrow flush. Liver homogenate samples were prepared by adding PBS (1:4, w/v) to each liver tissue sample. Samples were homogenized using a hand-held probe-style homogenizer (Omni THQ, Omni International).
Toxicokinetic analysis
Toxicokinetic analysis was performed by non-compartmental pharmacokinetic analysis using Phoenix WinNonLin (Version 8.3) with PK Submit™ Plugin (Certara, USA). The systemic exposure to NDMA was determined by calculating the area under the blood concentration–time curve (AUC) from the start of dosing to the last quantifiable time point (AUC0-t) using the linear up/log down trapezoidal method. NDMA concentrations were determined in pooled urine samples collected on Day 26/27 from each group at 0.19, 0.36, 1.1, 2, and 4 mg/kg/day. The amount of NDMA excreted in urine (Ae), and the fraction of the total dose excreted in urine (fe) (dose excreted in urine vs the total dose given to the animals) were calculated where data allowed. The liver homogenate concentrations (ng/ml) were multiplied by the actual homogenate/tissue weight ratio (dilution factor) to determine the tissue concentration in ng/g of tissue. The total amount of NDMA in each tissue specimen was then determined by subtracting the amount of NDMA in the residual blood in the tissue specimen (steady-state blood concentration (ng/ml) and constant blood volume in the mouse liver (ml/g tissue) from the tissue concentration (ng/g). The liver tissue-to-blood concentration ratios were calculated by dividing the corrected tissue concentration (ng/g) by the steady-state blood concentration (ng/ml). Bone marrow flush concentrations were not corrected.
Statistical analysis
Pairwise testing of Muta™Mouse lacZ mutant frequency data
Pairwise testing was conducted using the framework developed by the Genetic Toxicology Technical Committee [47]. The lacZ MF dose–response data were organized by dose level in raw format alongside log10 and square root transformations. A panel of preliminary distribution tests were then performed consisting of the Bonferroni outlier test in addition to assessments of variance homogeneity and distribution normality using Bartlett and Shapiro-Wilk tests, respectively. To provide unambiguous guidance on the most suitable data transformation to take forward for pairwise testing, the Fisher chi-square composite P-value method was also calculated to determine the best transformation in terms of variance homogeneity and normality, by selecting the transformation yielding the highest Fisher composite P-value. Pairwise testing was then carried out according to the decision-tree described by Johnson et al. [47]. In all instances, data transformation yielded dose–response data that ‘passed’ (i.e. P > .05) in the Bartlett and Shapiro-Wilk tests. For this reason, pairwise comparisons against the vehicle controls utilized the one-sided, post hoc Dunnett’s test with α 0.05. Statistical analyses were conducted using the ‘DRSMOOTH’ package in the R programming environment (version 3.5.0).
Comparisons of single versus repeat dose groups
LacZ MF data from single (e.g. 1 × 10 mg/kg) or cumulatively equivalent repeat-dose regimens (e.g. 28 × 0.36 mg/kg/day) were log10 transformed and assessed for variance homogeneity and distribution normality using Bartlett and Shapiro-Wilk tests, respectively. In each case, these tests were ‘passed’ (i.e. P > .05), enabling pairwise comparison by two-sided Tukey’s honestly significant difference test with correction for multiple comparisons.
Pairwise testing of the Pig-a mutation assay data
Due to some zero responses, a small offset of 0.1 was first applied to the mutant frequency response data. Data was then log10 transformed to stabilize the within-group variance. Pairwise comparisons against vehicle controls were then calculated using the one-sided (mutant RETs or RBC endpoints) or two-sided (percentage RETs) Dunnett’s T-test method with α set at 0.05.
Pairwise testing of the micronucleus assay data
Data were log10 transformed, and the Levene’s test was used to check dose-group homogeneity of variance. Pairwise testing was then carried out using a one-sided (micronucleated NCE and micronucleated RET endpoints) or two-sided (percentage RETs) Dunnett’s t-test with α set at 0.05.
Image analysis of liver sections: pairwise testing of the Ki67 and nuclear area data
Halo image analysis data was exported and analysed using GraphPad Prism (version 9.1.2) (GraphPad Software, San Diego, CA). Pairwise comparisons of response data from the NDMA-treated groups with the vehicle control were carried out using a Tukey’s multiple comparison test.
Benchmark dose modelling of lacZ mutant frequency data
Benchmark dose analyses were conducted using the PROAST R-package (version 70.9) (http://www.proast.nl). The lacZ mutant frequency data for liver, kidney, and lung tissues where a significant dose–response was identified under pairwise testing were analysed using the weighted, four-model average approach (i.e. exponential, Hill, inverse exponential, and log normal models) [48]. Analyses were conducted one-at-a-time in series (i.e. not using the combined-covariate approach with tissue as covariate). Single analyses were performed to exclude the possibility of a nested effect arising amongst tissues harvested from the same animal contributing to the confidence intervals. PROAST outputs designate potency (i.e. the BMD) and its two-sided 90% confidence interval (i.e. the BMDL and BMDU) as the ‘critical effect dose’ (i.e. CED, CEDL and CEDU) respectively. BMDs were calculated using a benchmark response (i.e. the critical effect size or CES in PROAST notation) of 50% (i.e. a 50% increase in mutant frequency relative to concurrent control). The BMDL and BMDU values represent the lower and upper bounds of the two-sided, 90% confidence interval of the BMD, with the difference between the BMDU and the BMDL defining the ‘length’ of the confidence interval, and therefore, its precision [49].
Liver image analysis data
Measurements from the image analysis process were exported from HALO and analysed using GraphPad Prism (version 9.1.2). Response data from the different dose groups were compared by one-way ANOVA followed by post hoc testing to define significant differences between groups using the Tukey’s honestly significant difference test with multiple comparisons correction.
Results and discussion
Clinical observations
NDMA was well tolerated in the preliminary dose range finder study using CD2F1 mice (i.e. the Muta™Mouse parental strain) following 14 days oral treatment with 0.36, 1.125, or 2 mg/kg/day. There were no overt clinical signs of toxicity, and animal bodyweights remained stable. A second dose range-finder study was completed in Muta™Mouse mice dosed at 2 and 4 mg/kg/day for 14 days (n = 3 per group); animals were sacrificed on day 15. Reductions in bodyweight were observed with group mean bodyweight loss of 8.9% at 2 mg/kg/day and 6.6% at 4 mg/kg/day (data not shown), and urinalysis sampling towards the end of the dosing period, a likely contributing factor. No other observations of note were recorded. In the main Muta™Mouse study, there were reductions in body weight on Day 31 in the repeat high-dose group (group mean bodyweight loss of 10.9%—data not shown), but no overt clinical signs of toxicity were observed in any treatment group.
Genetic toxicology
Peripheral blood micronucleus assays in CD2F1 mice and Muta™Mouse
In CD2F1 mice, the positive control (cyclophosphamide 5 mg/kg) induced a clear positive response in group mean CD71-positive micro-nucleated reticulocytes (% MN-RETCD71+) following treatment on Days 12 and 13 with blood sampled on Day 15, but there was no increase in group mean micronucleated red blood cells (% MN-NCECD71-), which is considered a lagging indicator of cytogenetic damage because it requires a longer manifestation time. These results are consistent with a valid assay as per the study protocol acceptance criteria. Repeat dose oral administration of NDMA to male CD2F1 mice resulted in no statistically significant increases in group mean % MN-RETCD71+ in any NDMA treatment group (0.36, 0.125, and 2 mg/kg/day) sampled on day 15 (Fig. 1, Table 3). Raw study data are presented in Supplementary File 1.
Figure 1.

Peripheral blood micronucleus assay dose response relationships following exposure to NDMA. Summary of 14-day treatments in male CD2F1 mice (top row), 28-day repeat dose treatment in Muta™Mouse (middle row) and single bolus doses in Muta™Mouse (bottom row—blue lines). In the plots, dots represent data for individual animals with geometric group means overlaid (stars). Panels (A, D and G) are % CD71 + reticulocytes (RET), panels (B, E and H) are % CD71 + micronucleated reticulocytes (MN-RET), and panels (C, F, and I) are % CD71 + micronucleated normochromic erythrocytes (MN-NCE). There were no statistically significant increases in % MN-RET or % MN-NCE compared with the vehicle controls in any study arm. Red data points are placeholders on the X-axis and represent response information in the concurrent positive controls, i.e. cyclophosphamide in the 14-day treatment and Microflow positive control standard in the 28-day treatment (+ve ctrl(s)). Asterisks represent statistical significance levels relative to concurrent control (Dunnett’s post hoc T-test) at: *P = ≤.05, **P = ≤.01, ***P = ≤.001 levels.
Table 3.
Summary data and pairwise statistics for 14- and 28-day blood micronucleus studies with NDMA.
| Test Article | Strain | Dosea | No. of animals analysedb | Group Mean %RET (SD) | Group Mean %RET | Group Mean %MN CD71+ RET (SD) | Group Mean %MN CD71+ | Group Mean %MN CD71- NCE (SD) | Group Mean %MN CD71- |
|---|---|---|---|---|---|---|---|---|---|
| mg/kg (bw)/day | P-valuec | P-valuec | P-valuec | ||||||
| Vehicle | CD2F1 | 0d | 5M | 1.10 (0.15) | N/A | 0.20 (0.04) | N/A | 0.16 (0.01) | N/A |
| NDMA | CD2F1 | 0.36d | 4Mf | 0.87 (0.21) | 0.998 | 0.17 (0.03) | 0.996 | 0.15 (0.01) | 0.996 |
| NDMA | CD2F1 | 1.125d | 3Mf | 0.95 (0.27) | 0.988 | 0.21 (0.02) | 0.520 | 0.15 (0.01) | 0.918 |
| NDMA | CD2F1 | 2d | 5M | 1.12 (0.05) | 0.746 | 0.23 (0.02) | 0.178 | 0.16 (0.01) | 0.252 |
| CPA | CD2F1 | 5e | 2Mf | 1.20 (0.12) | 0.582 | 0.34 (0.05) | 0.002 | 0.14 (0.02) | 0.996 |
| Vehicle | MutaMouse | 0g | 6M | 1.31 (0.21) | N/A | 0.57 (0.20) | N/A | 0.44 (0.13) | N/A |
| NDMA | MutaMouse | 0.02g | 5M | 1.38 (0.18) | 0.698 | 0.52 (0.09) | 0.965 | 0.37 (0.07) | 0.992 |
| NDMA | MutaMouse | 0.07g | 6M | 1.65 (0.18) | 0.013 | 0.53 (0.12) | 0.968 | 0.41 (0.09) | 0.966 |
| NDMA | MutaMouse | 0.19g | 6M | 1.60 (0.29) | 0.042 | 0.62 (0.29) | 0.812 | 0.47 (0.25) | 0.896 |
| NDMA | MutaMouse | 0.36g | 6M | 1.62 (0.20) | 0.021 | 0.56 (0.12) | 0.911 | 0.45 (0.09) | 0.808 |
| NDMA | MutaMouse | 1.1g | 5M | 1.57 (0.14) | 0.063 | 0.54 (0.12) | 0.950 | 0.40 (0.07) | 0.968 |
| NDMA | MutaMouse | 2.0g | 5M | 1.36 (0.21) | 0.762 | 0.55 (0.17) | 0.943 | 0.40 (0.09) | 0.977 |
| NDMA | MutaMouse | 4.0g | 5M | 1.48 (0.18) | 0.254 | 0.46 (0.09) | 0.998 | 0.31 (0.04) | 1.000 |
| NDMA | MutaMouse | 5.0h | 5M | 1.86 (0.12) | 0.000 | 0.66 (0.08) | 0.431 | 0.50 (0.05) | 0.468 |
| NDMA | MutaMouse | 10.0h | 4Mi | 1.67 (0.09) | 0.016 | 0.67 (0.07) | 0.407 | 0.51 (0.04) | 0.420 |
| Positivej | MutaMouse | N/A | 2 | 0.72j | N/A | 1.66j | N/A | 0.18j | N/A |
aExpressed in terms of the parent compound.
bM = Male.
cDunnett’s T-test method. Data were log transformed prior to analysis to stabilize the variance. Group means are on original scale. P-value of < .05 considered significant.
dDosed orally once daily for 14 days and sampled on Day 15.
ePositive control CPA dosed orally once daily for 2 days (Days 12 and 13) and sampled on Day 15.
fFour animals (one animal from 0.36 mg/kg(bw)/day dose group, two animals for 1.125 mg/kg(bw)/day dose group, one animal from 5 mg/kg(bw)/day dose group) were humanely killed for welfare reasons after they sustained an injury unrelated to treatment. No samples were collected from these animals.
gDosed once daily for 28 days with sampling on Day 28.
hSingle dose given on Day 1 and sampled on Day 28.
iOne animal died prior to scheduled sampling time; no samples taken.
jPositive control standard provided with the Litron Microflow kit. This demonstrated a clear positive response in-line with positive control standard ranges. One sample used on each of the two analysis occasions (therefore no SD generated).
CPA, cyclophosphamide; ENU, N-nitroso-N-ethylurea ; NCE, normochromatic erythrocyte (red blood cell); NDMA, N-Nitrosodimethylamine; RET, Reticulocyte; SD, standard deviation.
In Muta™Mouse, there were no increases in group mean % MN-RETCD71+ in any NDMA treatment group sampled on Day 28 compared with vehicle controls (Fig. 1, Table 3). This was the case for both single bolus treatments (5 or 10 mg/kg dose on Day 1) and repeat dose treatments (0.02–4 mg/kg/day dose for 28 days). Similarly, there were no statistically significant increases in group mean % MN NCE CD71- on Day 28 in any treatment group. Furthermore, there was no evidence of toxicity based on group mean %RET CD71+ at any dose, although there was some evidence of small increases in reticulocyte frequencies in some of the repeat dose treatment groups (0.07, 0.19, and 0.36 mg/kg/day) and in both single bolus dose treatment groups (Fig. 1D,G). Given the sampling time for the bolus treatment groups, this likely reflects random biological variability rather than a response to systemic toxicity. The positive control standard (supplied with the MicroFlow kit) produced the expected frequency of %MN-RET CD71+ indicative of a valid analysis. Raw study data are presented in Supplementary File 2.
The results in CD2F1 and Muta™Mouse mice are consistent with other NDMA studies of shorter duration. NDMA (1 mg/kg) was negative for MN-induction in transgenic Big Blue mice [20] but positive increases were seen at higher doses (5 and 10 mg/kg), although these increases may have been confounded by the vehicle control %MN-RET values in the positive 48 h blood sample which were half those observed in the 24 h sample, whereas the NDMA %MN-RET values were consistent in both experimental arms (and both had similar values to the 24 h vehicle controls). Sato et al. [50] reported single doses of NDMA (5 mg/kg) were negative for MN-induction in peripheral blood reticulocytes in CD1 mice but weakly positive at a higher dose of 10 mg/kg; further increases in dose (to 20–80 mg/kg NDMA) resulted in animal mortality. In young rats, NDMA was negative for MN-induction when dosed acutely at 5 or 10 mg/kg [51] and following 15 days, oral treatment in adult rats at 0.5, 2.0, and 4.0 mg/kg/day [52]. More recently, Dertinger and colleagues evaluated NDMA (2.5, 5.0, and 10.0 mg/kg/day) in 4-week-old male and female Crl:CD (SD) rats using one 3-day exposure cycle or three 3-day exposure cycles. Peripheral blood MN-induction was evaluated using similar flow cytometry methods as used in the current study. NDMA was negative in both treatment arms [53].
Other investigators have reported NDMA positive for MN-induction in vivo in bone marrow and in some other tissues, especially liver but also in the kidney and spleen, although the doses were typically higher than those used in the current study [4]. NDMA was reported negative in the stomach and colon—see [2,4] and references therein.
Mutant frequency analysis
Pig-a mutation assay
In mammals, mutations in the X-linked phosphatidylinositol glycan, class A gene (Pig-a) lead to loss of glycosylphosphatidylinositol (GPI) anchors and GPI-anchored proteins from the surface of erythrocytes and other cell types. The Pig-a gene mutation assay quantifies in vivo gene mutation by immunofluorescent labelling and flow cytometry to detect the loss of GPI-anchored proteins on peripheral blood erythrocytes [41,42]. Besides direct-acting agents, such as DNA alkylators, positive responses have been detected with a number of chemicals that require metabolic activation in order to manifest their genotoxicity [54].
In the current study, daily oral administration of NDMA to male CD2F1 mice for 14 consecutive days resulted in no statistically significant increases in group mean reticulocytes, group mean CD24-negative reticulocytes (Pig-a mutant RETCD24−) or group mean CD24-negative RBC (Pig-a mutant RBCCD24-) in any NDMA treatment group (Fig. 2A–C, Table 4). In Muta™Mouse, there were no increases in group mean reticulocytes or group mean CD24-negative reticulocytes (Pig-a mutant RETCD24−) compared with vehicle control in any of the treatment groups on Day 31, following either single bolus dose (5 or 10 mg/kg on day 1) or repeat dose treatments (0.02–4 mg/kg/day for 28 days), respectively. Similarly, there were no dose-dependent increases in group mean CD24-negative erythrocytes (Pig-a mutant RBCCD24−) observed on Day 31 in any of the treatment groups (Fig. 2D–I, Table 4). Raw study data are presented in Supplementary Files 3 and 4.
Figure 2.

Peripheral blood Pig-a mutation assay dose response relationships following exposure to NDMA. Summary of 14-day treatments in male CD2F1 mice (top row), 28-day repeat dose treatment in Muta™Mouse (middle row) and single bolus doses in Muta™Mouse (bottom row—blue line). In the plots, dots represent data for individual animals with geometric group means overlaid (stars). Panels (B, E and H) are % CD24- mutant reticulocytes (mut-RET), and panels (C, F, and I) are % CD24- mutant red blood cells (mut-RBC). Panels (G, H and I) show percentage reticulocytes (%RET) included to provide a measure of cytotoxicity. There were no statistically significant increases in % mut-RET or % mut-RBC compared with the vehicle controls in any study arm. Red data points are placeholders on the X-axis and represent response information in the concurrent positive controls (+ve ctrl(s)).
Table 4.
Summary data and pairwise statistics for 14- and 28-day pigA studies with NDMA.
| Test Article | Strain | Dosea mg/kg (bw)/day |
No. of animals analysedb |
Group Mean %RET (SD) | Group Mean %RET | Group Mean CD24- Mutant RBCs per 106 Total RBCs (SD) | Group Mean CD24- Mutant RBCs per 106 Total RBCs | Group Mean CD24- Mutant RETs per 106 Total RETs (SD) | Group Mean CD24- Mutant RETs per 106 Total RETs |
|---|---|---|---|---|---|---|---|---|---|
| P-value | P-valuec | P-valuec | |||||||
| Vehicle | CD2F1 | 0d | 4Mf | 2.4 (0.3) | N/A | 5.5 (8.0) | N/A | 3.4 (4.1) | N/A |
| NDMA | CD2F1 | 0.36d | 4Mg | 2.1 (0.2) | 0.42 | 56.2 (96.6) | 0.63 | 38.6 (63.8) | 0.63 |
| NDMA | CD2F1 | 1.125d | 3Mg | 2.2 (0.4) | 0.76 | 0.3 (0.2) | 0.50 | 0.9 (0.7) | 0.81 |
| NDMA | CD2F1 | 2d | 5M | 2.3 (0.2) | 1.00 | 10.7 (22.1) | 1.00 | 8.8 (15.3) | 1.00 |
| ENUe | CD2F1 | 40e | 3M | 3.0 (0.4) | 0.06 | 77.2 (84.7) | 0.12 | 210.9 (129.6) | N/A |
| Vehicle | MutaMouse | 0h | 6M | 3.37 (0.19) | N/A | 0.77 (1.30) | N/A | 0.40 (0.46) | N/A |
| NDMA | MutaMouse | 0.02h | 4Mj | 3.00 (1.32) | 0.99 | 0.70 (0.58) | 1.00 | 7.55 (13.05) | 0.13 |
| NDMA | MutaMouse | 0.07h | 5Mj | 3.68 (0.37) | 0.99 | 0.08 (0.08) | 0.24 | 0.46 (0.63) | 1.00 |
| NDMA | MutaMouse | 0.19h | 6M | 4.07 (1.29) | 0.52 | 0.25 (0.28) | 0.90 | 0.45 (0.45) | 1.00 |
| NDMA | MutaMouse | 0.36h | 6M | 3.93 (0.45) | 0.75 | 0.15 (0.12) | 0.58 | 0.08 (0.16) | 0.95 |
| NDMA | MutaMouse | 1.1h | 5M | 4.26 (0.78) | 0.30 | 0.06 (0.05) | 0.17 | 0.20 (0.29) | 1.00 |
| NDMA | MutaMouse | 2.0h | 4Mj | 3.53 (0.56) | 1.00 | 0.98 (1.68) | 1.00 | 12.35 (22.31) | 0.06 |
| NDMA | MutaMouse | 4.0h | 5M | 3.06 (0.19) | 0.99 | 0.26 (0.11) | 1.00 | 0.88 (0.84) | 0.99 |
| NDMA | MutaMouse | 5.0i | 5M | 3.96 (0.93) | 0.75 | 0.16 (0.13) | 0.67 | 0.48 (0.97) | 1.00 |
| NDMA | MutaMouse | 10.0i | 4Ml | 3.40 (0.08) | 1.00 | 0.43 (0.46) | 1.00 | 0.43 (0.85) | 1.00 |
| ENUk | MutaMouse | 40.0k | 3M | 2.33 (0.15) | N/A | 30.07 (8.20) | N/A | 40.80 (9.44) | N/A |
aExpressed in terms of the parent compound.
bM = Male.
cDunnett’s T-test method. P-value of ≤.05 considered significant.
dDosed once daily for 14 days and sampled on Day 15.
ePositive control ENU given once daily for 3 consecutive days (on Days 1, 2, and 3) and sampled on Day 15.
fData from Animal 3 excluded—this was considered to be a ‘jackpot’ due to the high frequency of mutant RBC and RET in an untreated animal.
gThree animals (one animal from 0.36 mg/kg(bw)/day dose group, two animals for 1.125 mg/kg/day dose group) were humanely killed for welfare reasons after they sustained an injury unrelated to treatment. No samples were collected from these animals.
hDosed once daily for 28 days and sampled on Day 31.
iSingle dose given on Day 1 and sampled on Day 31.
jNo data generated from one animal from each of these groups (0.02, 0.07, and 2 mg/kg/day) due to poor sample quality.
kPositive control ENU given once daily for 3 consecutive days (on Days 1, 2, and 3) and sampled on Day 31.
lOne animal died prior to scheduled sampling time; no samples taken.
ENU, N-Nitroso-N-Ethylurea; NDMA, N-Nitrosodimethylamine; RET, reticulocyte; RBC, red blood cell;SD, standard deviation.
At the time of writing, there was only one other published study where NDMA mutagenicity has been investigated using the Pig-a gene mutation assay. In that study, there were no statistically significant treatment effects in Pig-a mutant reticulocytes or red blood cells in young (4-week old) Crl:CD (SD) rats, orally dosed with NDMA (2.5, 5.0, and 10.0 mg/kg/day), using either a one 3-day exposure cycle or three 3-day exposure cycles [53], although there was evidence of cytotoxicity in the high dose group based on a significant reduction in mean %RETCD59+. The absence of a Pig-a mutation response for NDMA in rodents may be attributed to poor metabolic capacity in the bone marrow to activate NDMA and/or the limited systemic distribution of reactive metabolites generated in the liver. As such, the results suggest the Pig-a gene mutation assay may not be a suitable in vivo follow-up test for Ames-positive nitrosamines.
Mutation analysis at the transgenic lacZ locus
Following oral administration of NDMA to male Muta™Mouse mice, tissue samples were prepared at necropsy on Day 31 and high molecular weight DNA was extracted. The λ-phage shuttle vectors, containing the lacZ transgene, were isolated as described above, and lacZ mutants were determined ex vivo, using a positive selection bacterial assay. Data were generated for at least 200,000 plaque-forming units (pfu) per tissue for each animal (where possible) to give a total yield > 1 million pfu for the majority of treatment groups. Vehicle control lacZ mutant frequencies (MF) were comparable to the laboratory’s historical vehicle control ranges (Table 5). Positive control DNA from ENU-treated animals, tissue matched and packaged at the same time as the study DNA, gave elevated lacZ MF compared to the vehicle control DNA. These data confirmed correct DNA isolation, packaging procedures, and bacterial transductions, consistent with a valid assay. Raw study data are presented in Supplementary File 5.
Table 5.
Summary data and pairwise statistics for 28-day MutaTMMouse (lacZ) transgenic rodent studies with NDMA
| Tissue | Test Article | Dosea mg/kg(bw)/day | Regimen | CumulativeDosea mg/kg(bw) | No. animals analysedb | Group MFx106 (SD) | P-valuef |
|---|---|---|---|---|---|---|---|
| Bladder | Vehicle controlg | 0 | 1xdayx28days | 0 | 5M | 23.49 (16.6) | N/A |
| Bladder | NDMA | 2 | 1xdayx28days | 56 | 5M | 43.32 (31.5) | 0.248 |
| Bladder | NDMA | 4c | 1xdayx28days | 112 | 2M | 34.76 (16.8) | 0.413 |
| Bladder | NDMA | 10d (single dose) | 1xdayx1days | 10 | 2M | 30.71 (30.9) | 0.665 |
| Bladder | ENU positive control | 50e | - | - | 6M | 645.67 (355.5) | N/A |
| Bone Marrow | Vehicle controlg | 0 | 1xdayx28days | 0 | 5M | 21.63 (11.37) | N/A |
| Bone Marrow | NDMA | 4 | 1xdayx28days | 112 | 4M | 14.07 (3.73) | 0.951 |
| Bone Marrow | NDMA | 10d (single dose) | 1xdayx1days | 10 | 4M | 18.01 (8.25) | 0.846 |
| Bone Marrow | ENU positive control | 10 | - | - | 2M | 440.23 (85.44) | N/A |
| Spleen | Vehicle controlg | 0 | 1xdayx28days | 0 | 6M | 30.99 (8.2) | N/A |
| Spleen | NDMA | 10d (single dose) | 1xdayx1days | 10 | 4M | 31.44 (20.9) | 0.634 |
| Spleen | ENU positive control | 50e | - | - | 4M | 690.9 (124.3) | N/A |
| Stomach | Vehicle controlg | 0 | 1xdayx28days | 0 | 5M | 29.13 (9.0) | N/A |
| Stomach | NDMA | 2 | 1xdayx28days | 56 | 3M | 47.49 (11.5) | 0.069 |
| Stomach | NDMA | 4c | 1xdayx28days | 112 | 4M | 47.92 (19.6) | 0.055 |
| Stomach | NDMA | 10d (single dose) | 1xdayx1days | 10 | 4M | 45.4 (8.0) | 0.071 |
| Stomach | ENU positive control | 50e | - | - | 8M | 599.25 (274.1) | N/A |
| Kidney | Vehicle controlg | 0 | 1xdayx28days | 0 | 6M | 45.79 (19.3) | N/A |
| Kidney | NDMA | 0.36 | 1xdayx28days | 10.08 | 4M | 37.05 (12.8) | 0.986 |
| Kidney | NDMA | 1.1 | 1xdayx28days | 30.8 | 4M | 54 (10.8) | 0.438 |
| Kidney | NDMA | 2 | 1xdayx28days | 56 | 3M | 181.32 (59.1) | <.001 |
| Kidney | NDMA | 4c | 1xdayx28days | 112 | 4M | 432.45 (82.0) | <0.001 |
| Kidney | NDMA | 10d (single dose) | 1xdayx1days | 10 | 4M | 76.44 (27.2) | 0.042 |
| Kidney | ENU positive control | 50e | - | - | 3M | 339.64 (21.5) | N/A |
| Lung | Vehicle controlg | 0 | 1xdayx28days | 0 | 6M | 42.25 (26.9) | N/A |
| Lung | NDMA | 0.36 | 1xdayx28days | 10.08 | 4M | 40.9 (14.4) | 0.842 |
| Lung | NDMA | 1.1 | 1xdayx28days | 30.8 | 4M | 45.46 (2.8) | 0.665 |
| Lung | NDMA | 2 | 1xdayx28days | 56 | 3M | 94.42 (21.4) | 0.005 |
| Lung | NDMA | 4c | 1xdayx28days | 112 | 4M | 310.15 (49.2) | <0.001 |
| Lung | NDMA | 10d (single dose) | 1xdayx1days | 10 | 4M | 41.6 (16.3) | 0.831 |
| Lung | ENU positive control | 50e | - | - | 4M | 407.24 (91.3) | N/A |
| Liver | Vehicle controlg | 0 | 1xdayx28days | 0 | 6M | 25.39 (6.97) | N/A |
| Liver | NDMA | 0.02 | 1xdayx28days | 0.56 | 5M | 25.08 (9.86) | 0.964 |
| Liver | NDMA | 0.07 | 1xdayx28days | 1.96 | 6M | 21.35 (8.88) | 0.997 |
| Liver | NDMA | 0.19 | 1xdayx28days | 5.32 | 6M | 27.01 (7.83) | 0.835 |
| Liver | NDMA | 0.36 | 1xdayx28days | 10.08 | 6M | 40.35 (17.78) | 0.087 |
| Liver | NDMA | 1.1 | 1xdayx28days | 30.8 | 5M | 80.52 (18.9) | <0.001 |
| Liver | NDMA | 2 | 1xdayx28days | 56 | 5M | 124.20 (43.7) | <0.001 |
| Liver | NDMA | 4c | 1xdayx28days | 112 | 4M | 98.94 (20.7) | <0.001 |
| Liver | NDMA | 5 (single dose) | 1xdayx1days | 5 | 5M | 31.15 (7.1) | 0.505 |
| Liver | NDMA | 10d (single dose) | 1xdayx1days | 10 | 4M | 74.05 (17.0) | <0.001 |
| Liver | ENU positive control | 20e | - | - | 4M | 209.99 (15.23) | N/A |
| Liver | ENU positive control | 50e | - | - | 3M | 232.32 (29.15) | N/A |
aExpressed in terms of the parent compound.
bM = Male.
cJackpot animal removed from 4 mg/kg/day dose group.
dEarly termination of one animal given 10 mg/kg due to b/w loss (tissues from this animal were not analysed).
eDue to poor DNA quality of the ENU positive control samples collected in the study, ENU samples (20 and 50 mg/kg dose groups) were generated from a separate study to demonstrate successful packaging and mutant expression. Unequivocal responses were seen from both doses analysed.
fDunnett’s T-test method. P-value of ≤.05 considered significant.
gConcurrent laboratory historical control ranges (mean ± SD) for vehicle control lacZ mutant frequencies (MF) were bladder 56 ± 21; bone marrow 41 ± 21; spleen 38 ± 10, glandular stomach 43 ± 20; kidney 49 ± 22; lung 39 ± 14; and liver 57 ± 42.
ENU, N-Nitroso-N-Ethylurea; NDMA, N-Nitrosodimethylamine;SD, standard deviation.
Compared with vehicle controls, there were no statistically significant increases in group mean lacZ MF following high, repeat dose (28-day) treatment with NDMA in bone marrow (4 mg/kg/day) or stomach and bladder (2 and 4 mg/kg/day), i.e. the maximum NDMA treatments used in the repeat dose arm of the study (Fig. 3A,D,I and Table 5). In addition, there were no statistically significant increases in group mean lacZ MF following single bolus NDMA treatments (i.e. 10 mg/kg on Day 1 only) in bone marrow, bladder, stomach, and spleen (Fig. 3B,E,G,J and Table 5). For stomach, small (1.6-fold) increases in lacZ MF were observed for both the single and two NDMA repeat dose groups compared with the concurrent controls. Individual animal stomach vehicle control lacZ MF data were tightly grouped, and this likely accounted for the probability values tending towards significance in the single and repeat NDMA dose treatment groups (P ≤ .071 but > .050). Comparison with two more laboratory-matched historical control data sets for stomach, generated in the same study year for GSK, indicated the NDMA lacZ MF data fell within the observed control lacZ MF ranges (see Fig. 3I,J,K, turquoise data points). As such, we conclude the NDMA lacZ MF data are consistent with normal lacZ MF variance, and the small increases observed in the current study were of no biological significance. These findings are consistent with those reported in the literature [19,20,27].
Figure 3.

Mutant frequency (lacZ) dose response relationships following exposure to NDMA. Summary data in various tissues sampled after 28-day repeat dose treatments in Muta™Mouse (left-hand column—panels A, D, I, L, O, R) or single bolus dose treatments (middle column—blue lines: panels B, E, G, J, M, P, S). A cumulative dose comparison of the repeat (black) and single dose (blue) response relationships is shown in the right-hand column (panels C, F, H, K, N, Q, T). In the plots, dots represent data for individual animals with geometric group means overlaid (stars). Compared to the vehicle controls there were no statistically significant increases in lacZ mutant frequencies in bladder, bone marrow, spleen (high single-bolus dose analysed only, i.e. 10 mg/kg NDMA), or stomach. Statistically significant increases (P = ≤.01) in lacZ mutant frequencies were observed in kidney, lung, and liver at the higher doses and in kidney and liver (P = ≤ .05) following the high, single-bolus dose. In the cumulative dose plots, treatment groups with similar cumulative doses (i.e. 28 × 0.19 mg/kg/day vs 5 mg/kg; 28 × 0.36 mg/kg/day vs 10 mg/kg) where statistically compared. These comparisons were statistically significant in kidney (N) and liver (T) but only at the 10 mg/kg cumulative dose. Red circular data points are placeholders on the X-axis and represent response information in the concurrent positive controls (+ve ctrl(s)). Asterisks represent statistical significance levels at: *P = ≤.05, **P = ≤.01, ***P = ≤.001 levels.
NDMA treatment in liver, kidney, and lung resulted in dose-dependent increases in group mean lacZ MF (Fig. 3L–T, Table 5). In all three tissues, NDMA-induced lacZ MF showed non-linear dose–response relationships. For kidney and lung, increases in lacZ MF were observed at the two highest doses (2 and 4 mg/kg/day for 28 days, respectively), and these were statistically significant compared with the concurrent vehicle control group, but at the next two lower doses (0.36 and 1.1 mg/kg/day NDMA) the lacZ MF were consistent with the vehicle controls. For liver, increases in lacZ MF were observed at doses of 0.36 mg/kg/day (× 28 days) and above, and these were statistically significant compared with the concurrent vehicle control group following repeat doses of ≥ 1.1 mg/kg/day (P < .000). For liver, the dose–response resembled a shallow J-shaped relationship characterized by small, non-significant decreases in liver lacZ MF at the very lowest doses (0.02 and 0.07 mg/kg/day NDMA) and a return to parity with the vehicle control at 0.19 mg/kg/day NDMA; thereafter, the liver lacZ MF increased to a maximum 4.9-fold at 2 mg/kg/day NDMA (P < .000), i.e. a culminative dose of 56 mg NDMA over the 28-day dosing period (Table 5). At the highest repeat dose tested (4 mg/kg/day NDMA), there was a slight decrease in liver lacZ MF (3.9-fold) compared with the vehicle control (Fig. 3R). The small dip in lacZ MF at the highest dose may reflect inter-animal variability or the impact of hepatoxicity (see below), or maybe a combination of both factors. There were no statistically significant increases in lacZ MF at doses of 0.36 mg/kg/day NDMA or below. As such, 0.36 mg/kg/day defines a no observed genotoxic effect level (NOGEL) for 28-day repeat doses of NDMA in liver, i.e. the most sensitive tissue for mutagenesis and carcinogenesis. For kidney and lung, the NDMA repeat dose of NOGEL was 1.1 mg/kg/day in both tissues. These data are consistent with NDMA carcinogenic tissue potency [4], and they also align with relative levels of CYP2E1 expression in these tissues [55,56]. In contrast, the negative results in bone marrow [57], stomach, bladder, and spleen support the notion that there is limited metabolic capacity in these tissues to activate NDMA and thereby elicit a genotoxic response, and short-lived metabolites do not reach these tissues. Again, these data are consistent with negative NDMA target organ profiles for tumorigenesis in the mouse.
For single-dose NDMA treatments, there were statistically significant increases in MF in the liver and kidney at 10 mg/kg only (Fig. 3M,S). There were no significant responses in MF in the lung at 10 mg/kg or in the liver at 5 mg/kg (Fig. 3P,S). The group mean lacZ MF for single bolus NDMA (5 mg/kg) in kidney has yet to be determined, but it is unlikely to be positive given the liver data and the small response (1.67-fold) seen in the kidney at 10 mg/kg NDMA.
Liver lacZ MF data for single bolus treatments (5 or 10 mg/kg on day 1) and cumulative repeat dose treatments resulting in similar overall total doses (i.e. 28 × 0.19 = 5.32 mg/kg and 28 × 0.36 = 10.08 mg/kg) were compared (Table 6). For a total dose of ~5 mg/kg NDMA, there was a 1.23-fold increase following acute treatment but only a 1.06-fold increase following 28-day repeat dosing, relative to vehicle controls (NS; P > .05). In contrast, for a total dose of 10 mg/kg NDMA, there was a 2.92-fold increase in lacZ MF following acute treatment (P < .0001) but only a 1.59-fold increase after repeat dosing (P = .087). Statistical comparison of treatment groups with similar cumulative doses (i.e. 28 × 0.19 mg/kg/day vs 5 mg/kg; 28 × 0.36 mg/kg/day vs 10 mg/kg) indicated significant differences (P < .05) between the treatment regimens for kidney (Fig. 3N) and liver (Fig. 3T) but only at the 10 mg/kg cumulative dose. These data suggest different potencies in the liver between acute and fractionated repeat dose treatments for the same cumulative dose of NDMA (10 mg/kg), and our results are consistent with previous reports in lacZ TGR mice, where 10 daily doses of 1 mg/kg NDMA were ~1/3 less potent than the equivalent single 10 mg bolus dose [27]. Similarly, in kidney, a single dose of 10 mg/kg resulted in a 1.67-fold increase in MF, whereas 28-day repeat dosing for the same cumulative dose resulted in only a 0.8-fold increase in lacZ MF, compared to controls. These data indicate that dose fractionation results in overall lower MF at the lacZ locus in the liver and kidney compared with the equivalent single dose. In other words, NDMA mutation-induction is not proportionally cumulative in terms of additivity in the liver or kidney, and there is good evidence for an overall reduction in lacZ MF following repeat dosing compared with acute dosing for the same total dose. In lung, neither acute nor repeat dose NDMA (cumulative dose of 10 mg/kg) were statistically different from the vehicle control group.
Table 6.
Comparison of NDMA-induced lacZ mutant frequency in Muta™Mouse Liver following single bolus doses or 28-day repeat doses resulting in similar total doses overall.
| Group (n)a | Dose (mg/kg) × day | Total dose (mg/kg) | Group MF (×10-6) ± SD |
Fold-change | P-value (versus control) |
|---|---|---|---|---|---|
| 1 (6)a | 0 (Vehicle) × 28 | 0 | 25.39 ± 6.97 | - | - |
| 4 (6)a | 0.19 × 28 | 5.32 | 27.01 ± 7.83 | 1.06 | 0.835 |
| 9 (5)a | 5 × 1 | 5 | 31.15 ± 7.1 | 1.23 | 0.505 |
| 5 (6)a | 0.36 × 28 | 10.08 | 40.35 ± 17.78 | 1.59 | 0.087 |
| 10 (4)a,b | 10 × 1 | 10 | 74.05 ± 17.0 | 2.92 | <0.001 |
NDMA, N-Nitrosodimethylamine; SD, standard deviation.
Study design is described in Table 2.
a(n) animal group size.
bOne animal died prior to scheduled termination; no sample was taken.
Benchmark dose (BMD) analysis of the repeat dose lacZ MF data in Muta™Mouse lung, kidney and liver were determined, and results are shown in Table 7, alongside the determined NOGELs and Lowest Observed Genotoxic Effect Levels (LOGELs) for each tissue (Fig. 4). The analysis was performed using EFSA’s recommended four-model average approach [48] with a benchmark response size of 50%, according to current HESI GTTC and IWGT recommendations [49]. The modelling average BMD50 value for lung was 1.39 mg/kg/day (confidence interval 0.97–1.89 mg/kg/day); kidney BMD50 value was 1.19 mg/kg/day (confidence interval 0.94–1.42 mg/kg/day); and liver BMD50 value was 0.32 mg/kg/day (confidence interval 0.21–0.46 mg/kg/day). These values define point of departure (PoD) doses for each tissue and are in good agreement with tissue NOGELs, i.e. for lung (1.1 mg/kg/day), kidney (1.1 mg/kg/day), and liver (0.36 mg/kg/day)—see Fig. 4D–F (the modelling results are presented in full in Supplementary Fig. 1). These NOGEL values fall within the confidence intervals of the BMD50 values, but the BMD harnesses data from the whole dose–response curve to determine the PoD values and they do not rely on the serendipitous selection of dose groups. In this respect, the BMD provides a more precise estimate of the PoD compared with the NOGEL. In addition, the BMD values further support tissue sensitivity ranking in terms of target organ cancer incidence in mouse (i.e. liver > kidney or lung).
Table 7.
NDMA benchmark dose values from liver, kidney and lung MutaTMMouse transgenic rodent data (individual not combined-covariate BMD analyses).
| CES = 50% | Lung | Kidney | Liver |
|---|---|---|---|
| EXP | w = 0.25 | w = 0.26 | w = 0.24 |
| BMDb | 1.40 | 1.23 | 0.33 |
| BMDLb | 0.72 | 0.93 | 0.21 |
| BMDUb | 1.88 | 1.53 | 0.51 |
| HILL | w = 0.25 | w = 0.21 | w = 0.24 |
| BMDb | 1.40 | 1.12 | 0.32 |
| BMDLb | 0.73 | 0.91 | 0.22 |
| BMDUb | 1.82 | 1.30 | 0.46 |
| INVEXP | w = 0.25 | w = 0.27 | w = 0.23 |
| BMDb | 1.38 | 1.18 | 0.31 |
| BMDLb | 0.86 | 0.96 | 0.22 |
| BMDUb | 1.87 | 1.40 | 0.43 |
| LOGN | w = 0.25 | w = 0.27 | w = 0.29 |
| BMDb | 1.39 | 1.20 | 0.32 |
| BMDLb | 0.80 | 0.95 | 0.22 |
| BMDUb | 1.85 | 1.38 | 0.45 |
| 4-model average | |||
| BMD a , b | 1.39 | 1.19 | 0.32 |
| BMDL b | 0.97 | 0.94 | 0.21 |
| BMDU b | 1.89 | 1.42 | 0.46 |
aWeighted-average BMD values are shown in bold.
bUnits are mg NDMA/kg(bw)/day (1xdayx28day exposure regimen with harvest on day 31).
Exp, analysis using exponential model family; Hill, analysis using Hill model family; InvExp, analysis using inverse exponential model family; LogN, analysis using log-normal model family; W, model weighting in the four-model average bootstrap sampling process.
Figure 4.

Benchmark dose determination and point-of-departure summaries using Muta™Mouse (lacZ) TGR data. Four-model average benchmark dose (BMD) determination by bootstrap sampling for a critical effect-size (i.e. benchmark response) of 50% for lung, kidney, and liver are shown in panels A, B, and C, respectively. Geometric mean responses for each treatment group are represented by the red triangles. In the plots on the right-side (D–F), dots represent response data for individual animals with geometric group means overlaid as stars for each tissue respectively. The BMD50 values (yellow arrow) and 90% confidence intervals (pale yellow boundary) are presented to illustrate their relative position to the no observed genotoxic effect level (NOGEL) and lowest observed genotoxic effect level (LOGEL) values. Red circular data points are placeholders on the X-axis and represent response information in the concurrent positive controls (+ve ctrl(s)).
Comet assay in CD2F1 mice
Following a visual quality check of the comet slides prior to coding, vehicle control slides were seen to exhibit high levels of tail DNA. Subsequent unblinded analysis showed that all individual animals’ mean % tail intensity values were > 6%. In addition, the group mean % tail intensity (12.93%) exceeded the upper 95% CI range of the laboratory’s historical control for CD1 mice (95% CI range 0.02–2.14% tail intensity). Therefore, the vehicle control did not meet the assay acceptance criteria, and the Comet endpoint for this study was invalidated. Consequently, no formal analysis was performed on the treated samples. Previous studies with NDMA have reported positive findings in the liver Comet assay in rat [52] and mouse [58], and these are consistent with the positive responses seen in the liver with TGR assays.
Recently, the mutagenesis of N-nitrosodiethylamine (NDEA) was reported for 28 days, Big Blue rat transgenic rodent (TGR) gene mutation assay where animals (n = 6 per dose group) were administered doses of 0.001, 0.01, 0.1, 1, and 3 mg/kg/day NDEA by oral gavage [59]. The study compared the dose–response relationship of three genotoxicity endpoints (mutant frequencies at the transgenic cII locus, mutation frequencies using duplex sequencing [DS], and liver Comet assay). NDEA was positive for all three endpoints, but none of the methods (DS, cII mutants, or comet) detected increases in mutant/mutation frequencies caused by exposures to NDEA equal to or lower than 0.01 mg/kg/day. These data therefore define NOGELs for another well-studied N-nitrosamine that is both mutagenic and carcinogenic in animals. BMD analysis of the three endpoints revealed that DS analysis led to the lowest BMDL while comet assay led to the highest BMDL, however, the BMD ranges were overlapping or very close to overlapping [59].
Pathology
There were no macroscopic or microscopic liver findings in the 14-day NDMA CD2F1 mouse study. Clinical pathology assessments showed small increases in plasma alanine aminotransferase and aspartate aminotransferase activities (1.4-fold) in all treated animals. Animals given 2 mg/kg/day NDMA also had increased glutamate dehydrogenase activity (1.6-fold), and total bilirubin concentrations were also increased in animals given 1.125 mg/kg/day and 2 mg/kg/day (1.3- and 1.6-fold, respectively).
In Muta™Mouse, macroscopic observations were not conducted at necropsy. In the repeat high dose group (4 mg/kg/day), there were small increases as a % of total body weight in group mean lung and spleen weights (~1.3-fold in both tissues), but no increases in other tissues or in any other treatment group. In contrast, there were small decreases in group mean liver weights (when expressed as a percentage of total body weight) following repeat doses ≥ 1.1 mg/kg/day (i.e. 7.4% reduction at 1.1 mg/kg/day to 13.7% reduction at 4 mg/kg/day compared with the vehicle controls). Microscopic pathology was confined to the liver. There were no remarkable findings in the liver in any treatment groups dosed with 0.36 mg/kg/day NDMA or less. A range of microscopic observations were observed in livers of animals dosed at 1.1 mg/kg/day NDMA and above. These included single-cell necrosis, graded as minimal or mild, in the centrilobular region of the liver in mice given ≥ 1.1 mg/kg/day NDMA, and these were predominantly hepatocellular. This finding was variably associated with centrilobular haemorrhage, and congestion and capsular indentations were observed at lobular intervals (Fig. 5A–C). There was an increase in hepatocellular mitotic figures in mice given ≥ 2.0 mg/kg/day or single doses of ≥ 5.0 mg/kg NDMA (Fig. 5I–K). Pale golden-coloured pigment, graded as minimal or mild, and located in the cytoplasm of centrilobular cells were observed ≥ 1.1 mg/kg/day NDMA (Fig. 5E–H) and subsequently identified as hemosiderin (Schmorl’s negative, Perls’ prussian blue positive: Fig. 5L–N). Hepatocyte vacuolation, considered to represent glycogen, was reduced in grade (absent to mild) in mice given 4.0 mg/kg/day NDMA. In these animals, the vacuolation was reduced in periportal areas. All other findings were considered to represent aspects of the background pathology of the Muta™Mouse strain.
Figure 5.
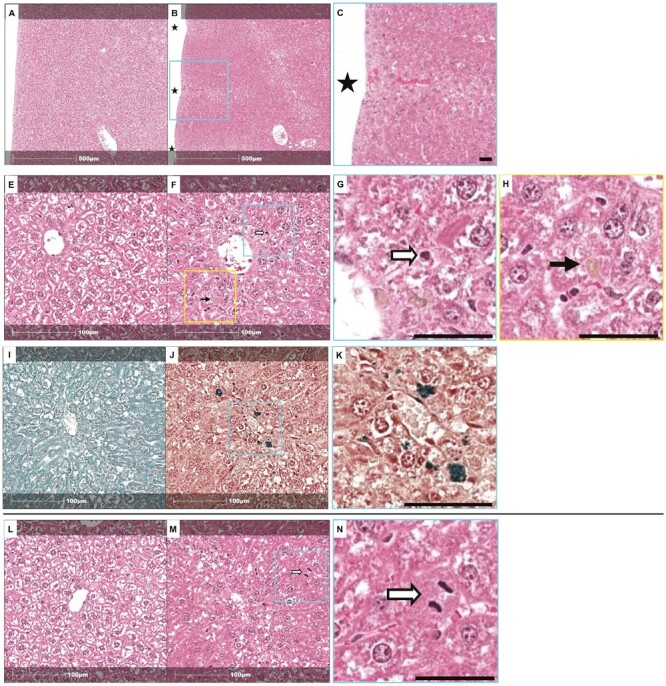
Liver histopathology findings for Muta™Mouse tissues exposed to NDMA. Vehicle controls (Panels A/E are animal 1M1; panels I/L are animal 2M1) and NDMA treatment of 4.0 mg/kg/day (Panels B/F/J/M are animal 702M8) are shown (H&E stain). Note capsular indentations (B: indicated by stars and magnified in C) and reduction in hepatocellular vacuolation in B compared to A (control); also, pigment (F: black arrow and magnified in G) and single-cell necrosis (F: white arrow and magnified in H). Presence of pigment in the centrilobular area using Schmorl’s and Perls’ Prussian blue stain (see J compared with I and magnified in K). Mitotic figure (M: white arrow and magnified in N) and reduction in hepatocellular vacuolation (M compared with L). Inset scales are (C) 100 micron; (G/H/K/N) 50 micron.
Additional investigations on liver samples using image analysis were performed to determine Ki67 proliferation index (Fig. 6A–C) and hepatocyte nuclear size (Fig. 6D–F). The results showed that mice given ≥ 2 mg/kg/day NDMA had a significantly higher percentage of hepatocyte nuclei that were Ki67 positive relative to the vehicle control group (P < .0001), whereas mice given 4 mg/kg/day NDMA or a single dose of 5.0 mg/kg NDMA had significantly larger hepatocyte mean nuclear areas relative to the vehicle control group (P < .0005 and P < 0.05, respectively). When cumulative doses were compared, as before, the findings for acute doses were elevated (but not statistically different) compared to the repeat dose regimens (Fig. 6C,F). Nevertheless, these observations suggest increased liver toxicity upon high single bolus doses of NDMA compared with repeat low doses, resulting in the same cumulative total dose given over 28 days.
Figure 6.

Hepatocyte % Ki67 positive and nuclear size dose response relationships for Muta™Mouse liver exposed to NDMA. Panels A–C show % Ki67-positive hepatocytes and panels D–E hepatocyte nuclear size (µm2). Data in panels A and D (black lines) are for repeat dose treatments with individual animal data shown as dots with geometric group means overlaid using stars. Data in panels B and E (blue lines) are for single bolus doses of NDMA (5 or 10 mg/kg). Panels C and F are composite Figures using cumulative dose on the X-axis to allow comparison of repeat (black) and single-dose (blue) regimens and include statistical comparison for the four-treatment groups with similar cumulative doses (i.e. 28 × 0.19 mg/kg/day vs 5 mg/kg; 28 × 0.36 mg/kg/day vs 10 mg/kg). These comparisons were not statistically significant (P = >0.05). In panels A/B/D/E, asterisks represent statistical significance levels relative to concurrent control at: *P = ≤.05, **P = ≤.01, ***P = ≤.001 levels.
Similar patterns of dose-dependent hepatic toxicity and hepatocyte degeneration have been reported for NDMA in λlacZ transgenic mice [27], rats [52], and more recently in neonatal gptΔ C57BL/6J mice [28]. In rats, daily oral treatment with NDMA (0.5, 2, or 4 mg/kg bw/day over 15 days) resulted in increases in bilirubin, liver-enzyme activities, and histopathological findings of similar magnitude as those observed in the current Muta™Mouse study and moreover, these were confined to the mid- and high-dose groups (2 and 4 mg/kg bw/day, respectively) but absent in the low-dose group (0.5 mg/kg bw/day) [52].
The nature and extent of hepatic toxicity observed in Muta™Mouse is consistent with NDMA activation by hepatic CYP2E1 to form DNA reactive methyldiazonium ions [8,17] and generation of hepatotoxic metabolites, e.g. formaldehyde, which are particularly relevant at higher doses [10]. Armijo et al. [28] arrived at a similar conclusion when discussing their results in gptΔ C57BL/6J mice. Briefly, ongoing liver cell necrosis during the study would lead to hepatocellular loss, which disrupts the sinusoidal architecture in the centrilobular region of the lobule, with secondary consequences of haemorrhage and congestion. The presence of hemosiderin pigment, which is a breakdown product from red blood cells, indicates that haemorrhage, and by implication through this proposed mechanism, necrosis, was occurring at least 3 days prior to necropsy [60]. Indirect evidence for hepatocellular cell loss is also supported by the observation of capsular indentations which were observed at lobular intervals in regions associated with subcapsular central veins. This proposed cell loss would also account for the reduced group liver weights, adjusted for body weight, which were lower in Muta™Mouse mice administered doses ≥ 1.1 mg/kg/day NDMA. The molecular and pathogenesis mechanisms of NDMA hepatic toxicity have been reviewed recently [10,61].
An additional potential contributing factor to reduced liver weights in mice given 4.0 mg/kg/day NDMA is the observation of reduced hepatocyte vacuolation, considered to represent glycogen. The liver responds to hepatocellular loss by regeneration of cell numbers through cell division. This was observed in the current study through recognition of increased hepatocellular mitotic figures on haematoxylin and eosin-stained sections in mice given ≥ 2.0 mg/kg/day and in mice given a single dose of ≥ 5.0 mg/kg NDMA. In addition, the use of Ki67 immunohistochemistry demonstrated that mice given ≥ 2 mg/kg/day NDMA had a significantly higher percentage of hepatocyte nuclei that were Ki67 positive, relative to the vehicle control group. The levels and localization of Ki67 protein, which spatially organizes heterochromatin, varies throughout the cell cycle [62]. The maximum expression occurs in the G2 phase or during mitosis, and Ki67 is continuously degraded during G0 and G1; production resumes from the start of the S phase until mitotic exit; therefore, Ki67 protein levels in a cell population span a large spectrum [63]. One interesting observation is that increased mitoses, but not increases in Ki67 positive hepatocellular nuclei, were observed in those groups which received a single dose of NDMA. This difference in proliferation kinetics and stage of cell cycle likely reflects the difference in timing of the hepatocellular injury induced by NDMA through single and repeat dosing. Mice given 4 mg/kg/day NDMA or a single dose of 5 mg/kg NDMA had significantly larger hepatocyte mean nuclear area relative to the vehicle control group. Although not evaluated in this study, an increase in nuclear area (karyomegaly) has been associated with polyploidy [64] and this finding was also observed in in gptΔ C57BL/6J mice treated with NDMA [28].
Toxicokinetics of NDMA in male CD2F1 mice and Muta™Mouse mice
Systemic assessment of NDMA exposure in blood
Systemic exposure to NDMA was measured in the dose range-finding study following oral administration to male CD2F1 mice for 14 days (0.36 and 2 mg/kg/day NDMA). The active metabolite could not be determined directly because of its highly reactive nature. Increases in blood NDMA levels were greater than dose proportionality for both sampling Days 1 and 14. At a dose of 0.36 mg/kg/day, the composite AUC0-t values were similar between Days 1 and 14; and the composite Cmax value on Day 14 (observed at 0.5 h) was 2.3-fold higher than that on Day 1; however, at 2 mg/kg/day, the composite AUC0-t and Cmax values increased from Day 1 to Day 14 by 5.7- and 10.4-fold, respectively. These results indicate accumulation of NDMA with increasing dose and exposure duration in CD2F1 mice.
NDMA levels were also measured in Muta™Mouse blood samples following repeat dose oral administration for 28 days at 0.19, 0.36, 1.1, 2, or 4 mg/kg/day NDMA or after a single bolus administration at 5 or 10 mg/kg (Table 8). Dose proportionality and changes in systemic exposure determined in blood following repeat dosing were not consistent over the dose ranges tested (Fig. 7, Table 8). On Day 1, with increasing doses from 0.19 to 0.36, and then to 1.1 mg/kg/day, NDMA systemic exposure (composite AUC0-t values) increased proportionally (Fig. 7A—green line). Between doses of 1.1 and 2 mg/kg/day, the systemic exposure remained relatively constant and did not increase in proportion to the administered dose. However, at the highest doses, i.e. 2 to 4 mg/kg/day, overall systemic exposure increased beyond dose proportionality. A similar observation was made for systemic exposure following 5 and 10 mg/kg single dose administrations (Fig. 7B—blue line), although the systemic exposure at 5 mg/kg was lower than that observed at 4 mg/kg/day (Table 4). After 28 days of dosing, with the dose increasing from 0.19 to 0.36 mg/kg/day, Day 28 NDMA systemic exposure based on AUC0-t in blood increased proportionally. However, from 0.36 to 4 mg/kg/day, Day 28 NDMA systemic exposure increased greater than proportionally (Fig. 7A—black line).
Table 8.
Compositive blood toxicokinetic parameters for NDMA from male Muta™Mouse following oral administration of NDMA.
| Parameter | Period | Dose of NDMA (mg/kg(bw)/day) | ||||||
|---|---|---|---|---|---|---|---|---|
| 0.19 | 0.36 | 1.1 | 2 | 4 | 5 | 10 | ||
| AUC0-t | Day 1 | 18.0 | 53.4 | 125 | 156 | 1190 | 401 | 2250 |
| (ng.h/ml) | Day 28 | 6.18 | 12.1 | 148 | 587 | 2820 | N/A | N/A |
| C max | Day 1 | 57.5 | 73.7 | 164 | 184 | 1770 | 1340 | 3310 |
| (ng/ml) | Day 28 | 17.1 | 26.0 | 184 | 918 | 2780 | N/A | N/A |
| T max | Day 1 | 0.083 | 1.00 | 1.00 | 1.00 | 1.00 | 0.083 | 0.083 |
| (h) | Day 28 | 0.083 | 0.083 | 0.083 | 0.083 | 0.25 | N/A | N/A |
N/A, not applicable to the single-administration 5 and 10 mg/kg dose groups; NDMA, N-Nitrosodimethylamine.
Figure 7.

Compositive blood toxicokinetics in Muta™Mouse exposed to NDMA. The top two panels show area under the blood concentration–time curve (AUC) dose–response relationships. Panel A is for the 28-day repeat-dose arm, where data in green represents Day 1 sampling and data in black represents Day 28 sampling. Panel B shows Day 1 data (blue line) for the bolus-dose treatment arm. The bottom two panels show maximum concentration values (Cmax) dose response relationships. Panel C is for the 28-day, repeat-dose arm where data in green represents Day 1 sampling and data in black represents Day 28 sampling. Panel D shows Day 1 data (blue line) for the bolus dose treatment arm.
At doses of 0.19 and 0.36 mg/kg/day NDMA, systemic exposure decreased 2.8–4.4-fold from Day 1 to Day 28. For example, with an NDMA dose of 1.1 mg/kg/day, there were similar composite AUC0-t values on Days 1 and 28, but at higher doses (2 and 4 mg/kg/day), the composite AUC0-t values increased by up to 5-fold from Day 1 to Day 28 (Fig. 7A, Table 8). Similar dose–exposure relationships were observed for peak blood NDMA values (Cmax) on Day 1 and Day 28, as shown in Fig. 7C,D and Table 8. Therefore, the greater than dose-proportionality increase in AUC is likely driven by the similar trend in Cmax, suggesting saturation of first-pass metabolism at doses > 1.1 mg/kg/day and leading to NDMA accumulation. Published NDMA toxicokinetic studies in multiple species (mouse, rat, hamster, dog, pig, and monkey) exposed orally have shown that clearance of NDMA from blood is primarily via metabolism [65] and at higher doses, NDMA metabolism is saturable in the pig and dog (see ATSDR 2023 and references therein). The evidence for metabolism saturation in Muta™Mouse at higher doses of NDMA are consistent with these observations and published results for the competitive inhibition of NDMA metabolism by ethanol in the mouse [66].
Assessment of NDMA exposure in liver
The analysis of liver samples confirmed exposure to NDMA in liver, the most sensitive organ for mutagenesis and carcinogenesis (Fig. 8, Table 9). At a dose of 0.36 mg/kg/day NDMA, the amount of nitrosamine present in liver was not quantifiable (<1 ng/ml) in samples from Day 1 other than immediately after dosing (Fig. 8A) and not at all on Day 28 (Fig. 8B). At a dose of 2 mg/kg/day, NDMA levels were observed up to 1 h after dosing at similar levels on Day 1 and Day 28. However, NDMA was not quantifiable after 4 h consistent with rapid clearance from the liver, even after 28 days of exposure. In contrast, at the 4 mg/kg/day dose, NDMA was detectable even after 4 h on Day 1, whereas on Day 28, the levels of NDMA were higher immediately after dosing and 1 h later (albeit with high inter-animal variability). These data are consistent with the idea of NDMA accumulation in the liver after repeat dosing at the highest dose tested, and this is a likely factor associated with the overt toxicity seen in the liver at higher doses.
Figure 8.

Concentrations of NDMA in the livers of Muta™Mouse specimens. Panel A shows NDMA levels in liver as a function of dose and sampling time measured on Day 1 whereas Panel B shows the equivalent data measured on Day 28 (i.e. after 28 days of exposure). The height and colour of the bars indicate the levels of NDMA at the various dose/time points sampled.
Table 9.
Liver NDMA levels in the Muta™Mouse study.
| Sampling day | Sampling timepoint (h) | Dose group mg/kg(bw)/day | Tissue | Mean NDMA concentration (ng/g) | Standard deviation |
|---|---|---|---|---|---|
| 1 | IAD | 0.36 | Liver | 2.5 | NQ |
| 1 | 1 | 0.36 | Liver | NQ | NQ |
| 1 | 4 | 0.36 | Liver | NQ | NQ |
| 28 | IAD | 0.36 | Liver | NQ | NQ |
| 28 | 1 | 0.36 | Liver | NQ | NQ |
| 28 | 4 | 0.36 | Liver | NQ | NQ |
| 1 | IAD | 2 | Liver | 2.4 | 1.2 |
| 1 | 1 | 2 | Liver | 1 | 0.8 |
| 1 | 4 | 2 | Liver | NQ | NQ |
| 28 | IAD | 2 | Liver | 2.5 | NQ |
| 28 | 1 | 2 | Liver | 1.7 | 1 |
| 28 | 4 | 2 | Liver | NQ | NQ |
| 1 | IAD | 4 | Liver | 2.3 | 1.9 |
| 1 | 1 | 4 | Liver | 24.4 | 20.1 |
| 1 | 4 | 4 | Liver | 1.2 | NQ |
| 28 | IAD | 4 | Liver | 97.5 | 102.6 |
| 28 | 1 | 4 | Liver | 28.4 | 25.1 |
| 28 | 4 | 4 | Liver | 1.1 | NQ |
IAD, immediately after dosing; NQ, not quantifiable (<1.00 ng/ml); NDMA, N-Nitrosodimethylamine.
Assessment of NDMA excretion in urine
For the pooled urine samples collected on Day 26/27, NDMA was not quantifiable in the urine samples collected at 0.36 mg/kg/day. The fractions of the total daily dose excreted in urine (fe) were 0.006%, 0.0005%, 0.009%, and 0.09%, respectively, at 0.19, 1.1, 2, and 4 mg/kg/day. This shows that very low levels of NDMA are excreted in urine as unchanged nitrosamine in the mouse following repeat dose treatments at the lower doses, although levels were an order of magnitude higher in the top dose treatment group (4 mg/kg/day). These results are similar to those observed in rats, where only small amounts of unchanged NDMA were recovered in urine, which is in contrast to hamster and dog where urinary NDMA was not quantifiable [4].
Summary and conclusions
The International Workshops on Genotoxicity Testing (IWGT) have endorsed the use of TGR gene mutation assays for in vivo detection of gene mutations [67], and it is widely accepted that transgenes respond to mutagens in an approximately similar manner to endogenous genes, especially with respect to the detection of base pair substitutions, frameshift mutations, and small deletions and insertions [68]. In the current study, NDMA mutagenesis was investigated in an OECD 488 compliant TGR assay (28-day study) across a range of doses. NDMA was positive in the TGR gene mutation assay as statistically significant increases in MF were observed in the lacZ reporter transgene in DNA extracted from liver, kidney, and lungs following 28-day repeat dose treatments at doses of ≥ 1.1 mg/kg/day, and in liver and kidney following a single bolus dose of 10 mg/kg. No statistically significant increases in MF were observed in bone marrow, spleen, stomach, or bladder (lacZ) or in peripheral blood (Pig-a) nor were there any statistically significant increases in peripheral blood micronucleus frequencies. In the liver, the most sensitive tissue for mutagenesis, the NOGEL for NDMA was 0.36 mg/kg/day for 28 days or 5 mg/kg following a single bolus dose. NDMA was cleared quickly at lower doses, which did not result in mutation, whereas at higher doses, there was evidence for greater than dose-proportionality exposure in liver and blood. Evidence for liver toxicity was also seen at higher doses (≥1.1 mg/kg/day NDMA) and both mutation and liver toxicity appeared to correlate with NDMA exposure. For a BMR of 50% using a four-model average, the BMD for 28-day repeat dose NDMA mutagenesis was 0.32 mg/kg(bw)/day (CI 0.21-0.46) based on liver MF data, and this is consistent with the observed NOGEL.
The BMD/NOGEL for mutagenesis defined for NDMA are many orders of magnitude higher than the levels mandated for the control of NDMA in pharmaceutical products [69,70]. In the adverse outcome pathway under development for ‘alkylation of DNA leading to cancer 1’ (i.e. AOP139) an increase in mutations is described as a key event (KE), and identified as KE185 by the OECD, which is essential for the progression of DNA alkylation leading to cancer. Importantly, data from our study and from others [71] suggest the combination of mutagenesis and toxicity in the liver at higher doses are likely important factors in the mutagenic and carcinogenic potency of NDMA. There are other contributory factors that come into play at the higher doses too, for example, the formation of the toxic metabolite, formaldehyde, and role of other stressors, such CYP2E1 activation and its association with oxidative stress. At high doses, it is likely these factors combine to overwhelm defence mechanisms and thereby potentiate the overall effect. However, we and others have identified doses of NDMA that do not lead to measurable increases in MF in TGR assays, probably because at lower doses, the additional contributory factors described above do not come into play and/or other compensatory mechanisms prevent and/or repair DNA damage [30,72]. Therefore, in the absence of key events necessary for AOP139 progression, i.e. ‘inadequate DNA repair’ (KE155) and ‘increase, mutations’ (KE185) it can be postulated that the conditions leading to the adverse outcome i.e. ‘increase, cancer’ would not be met. As such, the robustness of the BMD and NOGELs values defined for NDMA represents an important consideration for risk assessment. We believe our data would benefit from further corroboration using the precision and sensitivity of error-corrected next-generation sequencing, such as duplex sequencing [73]. Moreover, this would enable mechanistic insight into NDMA-induced mutagenicity at lower doses, as reported in MGMT deficient gptΔ mice [28,29] and more recently with NDEA [59]. These studies are underway and will be reported in due course.
Supplementary Material
Acknowledgements
We would like to thank Zena Keig-Shevlin and Victoria Brown and other supporting LabCorp staff for the conduct of the Muta™Mouse study which included dosing of animals, collection of tissues and conduct of the exogenous transgene reporter mutation assay. Deniz Akin for laboratory support in genetic toxicology. Nicola Mifsud and Yvonne Squire for histopathology. Hermes Licea-Perez, Clara Andonian, and Jonathan Kehler for support with bioanalysis.
Contributor Information
Anthony M Lynch, Genetic Toxicology & Photosafety, GSK R&D, Stevenage, SG1 2NY, United Kingdom.
Jonathan Howe, Genetic Toxicology & Photosafety, GSK R&D, Stevenage, SG1 2NY, United Kingdom.
Deon Hildebrand, Pathology, GSK R&D, Stevenage, SG1 2NY, United Kingdom.
James S Harvey, Genetic Toxicology & Photosafety, GSK R&D, Stevenage, SG1 2NY, United Kingdom.
Mark Burman, Genetic Toxicology & Photosafety, GSK R&D, Stevenage, SG1 2NY, United Kingdom.
Danielle S G Harte, Genetic Toxicology & Photosafety, GSK R&D, Stevenage, SG1 2NY, United Kingdom.
Liangfu Chen, DMPK, GSK R&D, Upper Providence, Collegeville, PA, United States.
Casey Kmett, DMPK, GSK R&D, Upper Providence, Collegeville, PA, United States.
Wei Shi, DMPK, GSK R&D, Upper Providence, Collegeville, PA, United States.
Charles F McHugh, DMPK, GSK R&D, Upper Providence, Collegeville, PA, United States.
Kinnari K Patel, BIB, GSK R&D, Upper Providence, Collegeville, PA, United States.
Venkat Junnotula, BIB, GSK R&D, Upper Providence, Collegeville, PA, United States.
Julia Kenny, TPPS, GSK R&D, Stevenage, SG1 2NY, United Kingdom.
Richard Haworth, RosettaPath Ltd, Hertford, United Kingdom.
John W Wills, Genetic Toxicology & Photosafety, GSK R&D, Stevenage, SG1 2NY, United Kingdom.
Conflict of interest
The authors are (or were at the time of study conduct) employees of GSK.
Data availability statement
Requests for additional specific raw data and/or modelling approaches used and not presented in the Supplementary information can be made in writing to the lead author.
References
- 1. IARC. Overall evaluations of carcinogenicity: an updating of IARC Monographs volumes 1 to 42. IARC Monogr Eval Carcinog Risks Hum Suppl 1987;7:1–440. [PubMed] [Google Scholar]
- 2. WHO. World Health Organisation (WHO) Concise International Chemical Assessment Document (CICAD) 38 N-NIitrosodimethylamine. WHO Geneva. 2002 [Google Scholar]
- 3. NTP. N-Nitrosamines: 15 listings. In: Report on Carcinogens. 15th edn. National Toxicology Program (NTP), Research Triangle Park (NC), 2021. [Google Scholar]
- 4. ATSDR. Toxicological profile for N-Nitrosodimethylamine (NDMA). In: Agency for Toxic Substances and Disease Registry (ATSDR) U.S. Department of Health and Human Services. Atlanta, GA. 2023. [PubMed] [Google Scholar]
- 5. Ruepp R, Frotschl R, Bream R, et al. The EU response to the presence of nitrosamine impurities in medicines. Front Med (Lausanne) 2021;8:782536. [DOI] [PMC free article] [PubMed] [Google Scholar]
- 6. Wichitnithad W, Nantaphol S, Noppakhunsomboon K, et al. An update on the current status and prospects of nitrosation pathways and possible root causes of nitrosamine formation in various pharmaceuticals. Saudi Pharm J 2023;31:295–311. [DOI] [PMC free article] [PubMed] [Google Scholar]
- 7. Haggerty HG, Holsapple MP.. Role of metabolism in dimethylnitrosamine-induced immunosuppression: a review. Toxicology 1990;63:1–23. [DOI] [PubMed] [Google Scholar]
- 8. Yang CS, Patten C, Lee MJ, et al. Enzymatic mechanisms in the metabolic activation of N-nitrosodialkylamines. IARC Sci Publ 1987;84:104–8. [PubMed] [Google Scholar]
- 9. Lee VM, Keefer LK, Archer MC.. An evaluation of the roles of metabolic denitrosation and alpha-hydroxylation in the hepatotoxicity of N-Nitrosodimethylamine. Chem Res Toxicol 1996;9:1319–24. [DOI] [PubMed] [Google Scholar]
- 10. George J, Tsuchishima M, Tsutsumi M.. Molecular mechanisms in the pathogenesis of N-nitrosodimethylamine induced hepatic fibrosis. Cell Death Dis 2019;10:18. [DOI] [PMC free article] [PubMed] [Google Scholar]
- 11. Guttenplan JB. N-nitrosamines: bacterial mutagenesis and in vitro metabolism. Mutat Res 1987;186:81–134. [DOI] [PubMed] [Google Scholar]
- 12. Kleihues P, von Hofe E, Schmerold I, et al. Organ specificity, metabolism and reaction with DNA of aliphatic nitrosomethylalkylamines. IARC Sci Publ 1987;84:49–54. [PubMed] [Google Scholar]
- 13. Lijinsky W. Structure-activity relations in carcinogenesis by N-nitroso compounds. Cancer Metastasis Rev 1987;6:301–56. [DOI] [PubMed] [Google Scholar]
- 14. Encell L, Shuker DE, Foiles PG, et al. The in vitro methylation of DNA by a minor groove binding methyl sulfonate ester. Chem Res Toxicol 1996;9:563–7. [DOI] [PubMed] [Google Scholar]
- 15. ICHM7(R1). International Conference on Harmonization (ICH), M7(R1): Assessment and control of DNA reactive (mutagenic) impurities in pharmaceuticals to limit potential carcinogenic risk, 2017.
- 16. Seitz HK, Wang XD.. The role of cytochrome P450 2E1 in ethanol-mediated carcinogenesis. Subcell Biochem 2013;67: 131–43. [DOI] [PubMed] [Google Scholar]
- 17. Hong JY, Pan JM, Gonzalez FJ, et al. The induction of a specific form of cytochrome P-450 (P-450j) by fasting. Biochem Biophys Res Commun 1987;142:1077–83. [DOI] [PubMed] [Google Scholar]
- 18. Jiao J, Douglas GR, Gingerich JD, et al. Analysis of tissue-specific lacZ mutations induced by N-nitrosodibenzylamine in transgenic mice. Carcinogenesis 1997;18:2239–45. [DOI] [PubMed] [Google Scholar]
- 19. Gollapudi BB, Jackson KM, Stott WT.. Hepatic lacI and cII mutation in transgenic (lambdaLIZ) rats treated with dimethylnitrosamine. Mutat Res 1998;419:131–5. [DOI] [PubMed] [Google Scholar]
- 20. Suzuki T, Itoh T, Hayashi M, et al. Organ variation in the mutagenicity of dimethylnitrosamine in Big Blue mice. Environ Mol Mutagen 1996;28:348–53. [DOI] [PubMed] [Google Scholar]
- 21. Shane BS, Smith-Dunn DL, de Boer JG, et al. Mutant frequencies and mutation spectra of dimethylnitrosamine (DMN) at the lacI and cII loci in the livers of Big Blue transgenic mice. Mutat Res 2000;452:197–210. [DOI] [PubMed] [Google Scholar]
- 22. Peto R, Gray R, Brantom P, et al. Effects on 4080 rats of chronic ingestion of N-nitrosodiethylamine or N-nitrosodimethylamine: a detailed dose-response study. Cancer Res 1991;51:6415–51. [PubMed] [Google Scholar]
- 23. Li K, Ricker K, Tsai FC, et al. Estimated cancer risks associated with nitrosamine contamination in commonly used medications. Int J Environ Res Public Health 2021;18:9465. [DOI] [PMC free article] [PubMed] [Google Scholar]
- 24. Phillipson CE, Ioannides C.. A comparative study of the bioactivation of nitrosamines to mutagens by various animal species including man. Carcinogenesis 1984;5:1091–4. [DOI] [PubMed] [Google Scholar]
- 25. Morrison V, Ashby J.. A preliminary evaluation of the performance of the Muta Mouse (lacZ) and Big Blue (lacI) transgenic mouse mutation assays. Mutagenesis 1994;9:367–75. [DOI] [PubMed] [Google Scholar]
- 26. Butterworth BE, Templin MV, Constan AA, et al. Long-term mutagenicity studies with chloroform and dimethylnitrosamine in female lacI transgenic B6C3F1 mice. Environ Mol Mutagen 1998;31:248–56. [DOI] [PubMed] [Google Scholar]
- 27. Souliotis VL, van Delft JH, Steenwinkel MJ, et al. DNA adducts, mutant frequencies and mutation spectra in lambda lacZ transgenic mice treated with N-nitrosodimethylamine. Carcinogenesis 1998;19:731–9. [DOI] [PubMed] [Google Scholar]
- 28. Armijo AL, Thongararm P, Fedeles BI, et al. Molecular origins of mutational spectra produced by the environmental carcinogen N-nitrosodimethylamine and S(N)1 chemotherapeutic agents. NAR Cancer 2023;5:zcad015. [DOI] [PMC free article] [PubMed] [Google Scholar]
- 29. Thongararm P, Fedeles BI, Khumsubdee S, et al. Modulation of N-methyl-N-nitrosourea mutagenesis in mouse embryo fibroblasts derived from the gpt delta mouse by an inhibitor of the O(6)-methylguanine methyltransferase, MGMT. Chem Res Toxicol 2020;33:625–33. [DOI] [PMC free article] [PubMed] [Google Scholar]
- 30. Kaina B, Christmann M, Naumann S, et al. MGMT: key node in the battle against genotoxicity, carcinogenicity and apoptosis induced by alkylating agents. DNA Repair (Amst) 2007;6:1079–99. [DOI] [PubMed] [Google Scholar]
- 31. Wang X, Suzuki T, Itoh T, et al. Specific mutational spectrum of dimethylnitrosamine in the lacI transgene of Big Blue C57BL/6 mice. Mutagenesis 1998;13:625–30. [DOI] [PubMed] [Google Scholar]
- 32. Delker DA, Geter DR, Kleinert KM, et al. Frequency and spectrum of lacI mutations in the liver of Big Blue mice following the administration of genotoxic carcinogens singly and in series. Int J Toxicol 2008;27:35–42. [DOI] [PubMed] [Google Scholar]
- 33. Beal MA, Meier MJ, LeBlanc DP, et al. Chemically induced mutations in a MutaMouse reporter gene inform mechanisms underlying human cancer mutational signatures. Commun Biol 2020;3:438. [DOI] [PMC free article] [PubMed] [Google Scholar]
- 34. OECD. Test No. 488: Transgenic Rodent Somatic and Germ Cell Gene Mutation Assays. The Organisation for Economic Co-operation and Development, Paris. 2022. [Google Scholar]
- 35. OECD. Test No. 474: Mammalian Erythrocyte Micronucleus Test. The Organisation for Economic Co-operation and Development, Paris. 2016. [Google Scholar]
- 36. OECD. Test No. 470: Mammalian Erythrocyte Pig-a Gene Mutation Assay. The Organisation for Economic Co-operation and Development, Paris. 2022. [Google Scholar]
- 37. Bernauer U, Vieth B, Ellrich R, et al. CYP2E1-dependent benzene toxicity: the role of extrahepatic benzene metabolism. Arch Toxicol 1999;73:189–96. [DOI] [PubMed] [Google Scholar]
- 38. Johnson GE, Dobo K, Gollapudi B, et al. Permitted daily exposure limits for noteworthy N-nitrosamines. Environ Mol Mutagen 2021;62:293–305. [DOI] [PubMed] [Google Scholar]
- 39. Torous DK, Hall NE, Illi-Love AH, et al. Interlaboratory validation of a CD71-based flow cytometric method (Microflow) for the scoring of micronucleated reticulocytes in mouse peripheral blood. Environ Mol Mutagen 2005;45:44–55. [DOI] [PubMed] [Google Scholar]
- 40. Dertinger SD, Torous DK, Hayashi M, et al. Flow cytometric scoring of micronucleated erythrocytes: an efficient platform for assessing in vivo cytogenetic damage. Mutagenesis 2011;26:139–45. [DOI] [PubMed] [Google Scholar]
- 41. Bemis JC, Hall NE, Dertinger SD.. Erythrocyte-based pig-a gene mutation assay. Methods Mol Biol 2019;2031:29–57. [DOI] [PubMed] [Google Scholar]
- 42. Gollapudi BB, Lynch AM, Heflich RH, et al. The in vivo Pig-a assay: a report of the International Workshop On Genotoxicity Testing (IWGT) Workgroup. Mutat Res Genet Toxicol Environ Mutagen 2015;783:23–35. [DOI] [PubMed] [Google Scholar]
- 43. Phonethepswath S, Franklin D, Torous DK, et al. Pig-a mutation: kinetics in rat erythrocytes following exposure to five prototypical mutagens. Toxicol Sci 2010;114:59–70. [DOI] [PMC free article] [PubMed] [Google Scholar]
- 44. Thoolen B, Maronpot RR, Harada T, et al. Proliferative and nonproliferative lesions of the rat and mouse hepatobiliary system. Toxicol Pathol 2010;38:5S–81S. [DOI] [PubMed] [Google Scholar]
- 45. Schumann G, Bonora R, Ceriotti F, et al. ; International Federation of Clinical Chemistry and Laboratory Medicine. IFCC primary reference procedures for the measurement of catalytic activity concentrations of enzymes at 37 degrees C International Federation of Clinical Chemistry and Laboratory Medicine Part 4 Reference procedure for the measurement of catalytic concentration of alanine aminotransferase. Clin Chem Lab Med 2002;40:718–24. [DOI] [PubMed] [Google Scholar]
- 46. NCCLS, Clinical and Laboratory Standards Institute. Evaluation of Precision Performance of Quantitative Measurement Methods; Approved Guideline. 2nd edn. Wayne, PA: Clinical and Laboratory Standards Institute. NCCLS Document EP5-A2,2004. [Google Scholar]
- 47. Johnson GE, Soeteman-Hernandez LG, Gollapudi BB, et al. Derivation of point of departure (PoD) estimates in genetic toxicology studies and their potential applications in risk assessment. Environ Mol Mutagen 2014;55:609–23. [DOI] [PMC free article] [PubMed] [Google Scholar]
- 48. Committee ES, More SJ, Bampidis V, et al. Guidance on the use of the benchmark dose approach in risk assessment. EFSA J 2022;20:e07584. [DOI] [PMC free article] [PubMed] [Google Scholar]
- 49. Wills JW, Long AS, Johnson GE, et al. Empirical analysis of BMD metrics in genetic toxicology part II: in vivo potency comparisons to promote reductions in the use of experimental animals for genetic toxicity assessment. Mutagenesis 2016;31:265–75. [DOI] [PubMed] [Google Scholar]
- 50. Sato S, Taketomi M, Morita T.. Simplified mouse peripheral reticulocyte micronucleus test with dimethylnitrosamine. Mutat Res 1992;278:103–7. [PubMed] [Google Scholar]
- 51. Suzuki H, Ikeda N, Kobayashi K, et al. Evaluation of liver and peripheral blood micronucleus assays with 9 chemicals using young rats. A study by the Collaborative Study Group for the Micronucleus Test (CSGMT)/Japanese Environmental Mutagen Society (JEMS)-Mammalian Mutagenicity Study Group (MMS). Mutat Res 2005;583:133–45. [DOI] [PubMed] [Google Scholar]
- 52. Rothfuss A, O’Donovan M, De Boeck M, et al. Collaborative study on fifteen compounds in the rat-liver Comet assay integrated into 2- and 4-week repeat-dose studies. Mutat Res 2010;702:40–69. [DOI] [PubMed] [Google Scholar]
- 53. Dertinger SD, Avlasevich SL, Torous DK, et al. 3Rs friendly study designs facilitate rat liver and blood micronucleus assays and Pig-a gene mutation assessments: proof-of-concept with 13 reference chemicals. Environ Mol Mutagen 2019;60:704–39. [DOI] [PMC free article] [PubMed] [Google Scholar]
- 54. Dertinger SD, Bhalli JA, Roberts DJ, et al. Recommendations for conducting the rodent erythrocyte Pig-a assay: a report from the HESI GTTC Pig-a Workgroup. Environ Mol Mutagen 2021;62:227–37. [DOI] [PMC free article] [PubMed] [Google Scholar]
- 55. Renaud HJ, Cui JY, Khan M, et al. Tissue distribution and gender-divergent expression of 78 cytochrome P450 mRNAs in mice. Toxicol Sci 2011;124:261–77. [DOI] [PMC free article] [PubMed] [Google Scholar]
- 56. Nannelli A, De Rubertis A, Longo V, et al. Effects of dioxane on cytochrome P450 enzymes in liver, kidney, lung and nasal mucosa of rat. Arch Toxicol 2005;79:74–82. [DOI] [PubMed] [Google Scholar]
- 57. Bernauer U, Vieth B, Ellrich R, et al. CYP2E1 expression in bone marrow and its intra- and interspecies variability: approaches for a more reliable extrapolation from one species to another in the risk assessment of chemicals. Arch Toxicol 2000;73:618–24. [DOI] [PubMed] [Google Scholar]
- 58. Owiti NA, Corrigan JJ, Pribyl LJ, et al. Novel in vivo CometChip reveals NDMA-induced DNA damage and repair in multiple mouse tissues. Int J Mol Sci 2022;23:11776. [DOI] [PMC free article] [PubMed] [Google Scholar]
- 59. Bercu JP, Zhang S, Sobol Z, et al. Comparison of the transgenic rodent mutation assay, error corrected next generation duplex sequencing, and the alkaline comet assay to detect dose-related mutations following exposure to N-nitrosodiethylamine. Mutat Res Genet Toxicol Environ Mutagen 2023;891:503685. [DOI] [PubMed] [Google Scholar]
- 60. Epstein CE, Elidemir O, Colasurdo GN, et al. Time course of hemosiderin production by alveolar macrophages in a murine model. Chest 2001;120:2013–20. [DOI] [PubMed] [Google Scholar]
- 61. George J, Tsuchishima M, Tsutsumi M.. Metabolism of N-nitrosodimethylamine, methylation of macromolecules, and development of hepatic fibrosis in rodent models. J Mol Med (Berl) 2020;98:1203–13. [DOI] [PubMed] [Google Scholar]
- 62. Sobecki M, Mrouj K, Camasses A, et al. The cell proliferation antigen Ki-67 organises heterochromatin. Elife 2016;5:e13722. [DOI] [PMC free article] [PubMed] [Google Scholar]
- 63. Miller I, Min M, Yang C, et al. Ki67 is a graded rather than a binary marker of proliferation versus quiescence. Cell Rep 2018;24:1105–1112.e5. [DOI] [PMC free article] [PubMed] [Google Scholar]
- 64. Wang MJ, Chen F, Lau JTY, et al. Hepatocyte polyploidization and its association with pathophysiological processes. Cell Death Dis 2017;8:e2805. [DOI] [PMC free article] [PubMed] [Google Scholar]
- 65. Gombar CT, Harrington GW, Pylypiw HM Jr., et al. Interspecies scaling of the pharmacokinetics of N-nitrosodimethylamine. Cancer Res 1990;50:4366–70. [PubMed] [Google Scholar]
- 66. Anderson LM, Harrington GW, Pylypiw HM Jr., et al. Tissue levels and biological effects of N-nitrosodimethylamine in mice during chronic low or high dose exposure with or without ethanol. Drug Metab Dispos 1986;14:733–9. [PubMed] [Google Scholar]
- 67. Thybaud V, Dean S, Nohmi T, et al. In vivo transgenic mutation assays. Mutat Res 2003;540:141–51. [DOI] [PubMed] [Google Scholar]
- 68. Lambert I, Singer T, Boucher S, et al. Detailed review paper on transgenic rodent mutation assays. OECD Environment, Health and Safety Publications: Series on Testing and Assessment 2009;103:1–281. [Google Scholar]
- 69. FDA. United States Food and Drug Administration (US FDA), Guidance for Industry. Control of Nitrosamine Impurities in Human Drugs. Rockville, MD: Center for Drug Evaluation and Research. 2020. [Google Scholar]
- 70. EMA/CHMP. European Medicines Agency (EMA), Questions and answers on ‘Information on nitrosamines for marketing authorisation holders’. EMA/CHMP/428592/2019 Rev. 3 (2020), 2020. [Google Scholar]
- 71. Souliotis VL, Chhabra S, Anderson LM, et al. Dosimetry of O6-methylguanine in rat DNA after low-dose, chronic exposure to N-nitrosodimethylamine (NDMA) Implications for the mechanism of NDMA hepatocarcinogenesis. Carcinogenesis 1995;16:2381–7. [DOI] [PubMed] [Google Scholar]
- 72. Kondo N, Takahashi A, Ono K, et al. DNA damage induced by alkylating agents and repair pathways. J Nucleic Acids 2010;2010:543531. [DOI] [PMC free article] [PubMed] [Google Scholar]
- 73. Marchetti F, Cardoso R, Chen CL, et al. Error-corrected next generation sequencing - promises and challenges for genotoxicity and cancer risk assessment. Mutat Res Rev Mutat Res 2023;792:108466. [DOI] [PubMed] [Google Scholar]
Associated Data
This section collects any data citations, data availability statements, or supplementary materials included in this article.
Supplementary Materials
Data Availability Statement
Requests for additional specific raw data and/or modelling approaches used and not presented in the Supplementary information can be made in writing to the lead author.