

Abstract
Introduction
State policies and programs affect population health, yet little is known about the connections between health and the political institutions and actors that prescribe and execute those policies and programs.
Methods
We fitted two-way fixed effects regression models to data from the National Center for Health Statistics, 1969–2014, to estimate logged infant mortality rate differentials between Republican-and non-Republican-controlled state legislatures. We used these data in 2020 to hypothesize that, net of trend, fluctuations in infant mortality rates—overall and by race—correlate with the party that controls state legislatures (the Lower House, the Upper House, and Congress).
Results
We find that state infant (IMR) and postneonatal (PNMR) mortality rates are substantively higher under Republican-controlled state legislatures than under non-Republican-controlled ones. The effect size is larger for postneonatal compared to neonatal mortality. We find evidence to suggest effects may be greater for Black compared to White infants, although our race-specific results are imprecisely estimated. The governor’s party shows no substantive effects on IMRs net of party control of the Lower House.
Conclusions
Findings support the proposition that the social determinants of health are constructed, at least in part, by the power vested in governments.
Keywords: Infant mortality, politics, political parties, state legislatures, racial disparities, social determinants
Introduction
American politicians have grown extraordinarily polarized along partisan lines,1, 2 and research shows that their increasingly opposing constituencies, lobbies, coalition actors, and ideological positions affect health policy today.3–6 For the period 1965–2010, Rodriguez, Bound, and Geronimus 7, 8 found that, net of trend, national overall and race-specific infant (IMR), neonatal (NMR), and postneonatal (PNMR) mortality rates were 3% higher under Republican presidential administrations compared to Democratic ones. In addition, regardless of the many legislative, regulatory, and budgetary powers U.S. presidents employ to set their parties’ agendas, state legislatures are responsible for safety net programs, their state’s minimum wage, and other public goods and services that influence the social determinants of health. Is partisan politics at the state level associated with trends in infant mortality rates (IMR)?
The influence of state governments on population health follows decentralization patterns imparted since the 1970s, when states started to expand their independence from federal jurisdiction over welfare programs, including those directly affecting infant health (e.g., Medicaid).9 Currently, U.S. states’ health spending comprises between one-fourth and one-third of total state budgets—of which programs affecting infant health like Medicaid and the Children’s Health Insurance Program (CHIP) comprise the lion’s share.10 And, even though the Political Realignment of the 1960s—which ignited the radical policy ideological divergence between the Democratic and the Republican parties that we see today—shaped national party politics, it is a political phenomenon whose essential variation originated in the states.
States’ policy choices—including those affecting access to healthcare—are also shaped by the ideology of government officials that control state-level institutions.11, 12 States’ policy choices have the potential to shape key socioeconomic factors like education—which are associated with risky behaviors (e.g., smoking), disability, and mortality—highlighting the importance of state policy actors for the distribution of the social determinants of health.13, 14 The ideology and priorities of the party in power at the state level can heavily influence what policies are implemented and their level of commitment to those policies as they tend to do so in a zero-sum fashion as, unlike the federal government, states are required to balance their budgets. 15 Indeed, in studying how ideology shapes health policy and outcomes, Purtle et al. 16 report that conservative policymakers were significantly less likely to think that health disparities existed and that health disparities were unfair. Montez et al. 17 show that states are more likely to experience life expectancy declines as they execute more conservative policies. Thus, the party that controls any given state legislature may therefore represent a critical institutional arrangement affecting its state’s population and infant health through its priorities and policies, especially as numerous welfare and health obligations depend on the decisions state representatives make. To the extent that party control facilitates legislative business influencing committee assignments and the nomination of political leaders that are selectively put in agenda-setting positions with the political capital to establish procedural preferences, parties may have an independent effect on policy prescription and implementation, as well. 18
As the two parties did not become different from the other at the same pace, but with Republicans showing a brusque and ongoing rightward ideological shift,2 the Republican policy agenda is increasingly presenting powerful and racialized opposition against social and healthcare programs—including universal health insurance and the Affordable Care Act—known to improve infant health.19–22 Historically, such racialization of policy has intensified within the Republican Party since Nixon’s Southern Strategy, which reshaped the race- and class-oriented production and distribution of public goods and services, the functioning of U.S. capitalism, and therefore how macrodynamics of policy trickle down to the activation of individuals’ physiological responses to social stress, by class and race.23–29 Thus, we hypothesize that at least since the Political Realignment, Republican control of state legislatures could have a detrimental effect on state birth outomes.
This paper analyses partisan political power in the U.S.—explicitly, the political party that controls state-level legislatures (the Congress, the Upper House, and the Lower House)—as a critical factor influencing the improvement of infant health in U.S. states, overall and by race. It also explores the possibility that infants’ heath is affected by the party of the state’s governor. Some research suggests that governors’ powers to determine budgets may create conflict or opportunities for budgetary alignments with state legislatures. Clarke 30 finds that state legislatures tend to support governors’ budget proposals if there are different majority parties in each house, but budget conflict increases when the governor faces a united opposing legislature.
Data and Methods
Overall and race-specific infant mortality data are from the Centers for Disease Control and Prevention and the National Center for Health Statistics. Since Hispanic origin is not available during the early years of the study period, for consistency, we estimate race-specific infant mortality rates including Hispanics. Party composition of state legislatures and the party of governors (1969–2007) are from the updated dataset in Klarner (2003); data for years 2008–2014 are from Klarner 31 and the National Conference of State Legislatures. Annual state unemployment rate data are from the Bureau of Labor Statistics (1974–2014) and the U.S. Statistical Abstract (1969–1973). State average age of females are from the Surveillance, Epidemiology, and End Results Program (SEER) (1969–2014). Our sample includes 49 of the 50 states (Nebraska is excluded because Nebraska has a unicameral legislature). Our study period is 1969–2014, but we also experimented with 1977–2014 which allowed us to include additional controls (Supplementary Materials (SM)). All data were analyzed in year 2020.
We estimated models of the form:
| (1) |
where is the natural logarithm of the infant-related mortality rate in state and year . The terms , and are 1-year lagged indicators for party control of a state legislature (Lower, Upper, and their interaction, respectively) in state and year , coded “1” if the share of Republican representatives is higher than 50% in the legislature, “0” otherwise. stands for a 1-year lagged variable coded as “1” if the governor is Republican, “0” otherwise. and represent state and year fixed effects, respectively; is the error term. In the great majority of cases, legislators who are not Repulicans are Democrats; however, some are either independents or belong to third parties. We also experimented with estimating equations that augmented (1) with interactions between and , , and . In no case were these interactions statistically significant at conventional levels and the coefficients on these interaction terms were, in all cases, small in magnitude. As a result, we have chosen to report results based on the simpler model (see the Supplementary Materials for more details).
By including year and state fixed effects, we control for factors that would affect all states in a given year and permanent differences across states. The inclusion of year fixed effects implies that our estimates of the effect of party control is net of any national trend. Our estimates are two-way linear fixed effects estimates and are identified off of constrasts between states that did and did not experience a change in party control of one or both houses and/or the governor’s office in a particular year. During our study period, when a party takes control of a house it typically lasts 4–10 years (SM). Although our estimates correspond to average annual differences in infant mortality between Republican- and non-Republican-controlled houses, our estimated coefficients should not be interpreted as effects that necessarily materialize immediately.
The standard errors of the coefficients are clustered at the state level to account for arbitrary forms of within state serial correlations and are estimated using the fixed effects estimator. 32 Our estimations use state-level time-constant weights, which correspond to annual state shares of live births (such that in any given year) and then averaged for states across all years. We estimated equation 1 for all races, and separately for Black and White infants. Not all states reported data for Black infants during the study period, and others showed very low numbers of Black infant deaths (<20) due to a low Black population, which did not allow for reliable estimates of the Black IMR. Accordingly, we included 32 states in our race-specific analyses (SM). For our race-specific estimates, we constructed weights in the manner described previously using annual shares of Black births rather than annual shares of all births. By using the same set of weights whether the outcome was Black or White infant mortality, we weighted states the same for the two sets of estimates. (Supplementary Materials report parameter estimates using different samples and weighting strategies.)
Results
Table 1 shows substantial variation in the fraction of time state legislatures are controlled by the Republican Party. Figure 1 shows, for each house/governorship, the number of states under Republican control, 1969–2014. For example, the upper left panel of the figure shows that 13 states had their lower houses under Republican control 20% of the time or less, while nine states were in Republican control for at least 80% of the time. For most states, the control of state legislatures shifts over time. This is essential since it is these shifts that allow us to estimate the coefficients in equation 1.
Table 1.
Descriptive statistics
| All states | 32 states | |||
|---|---|---|---|---|
|
|
||||
| Variable | Mean | SD | Mean | SD |
|
| ||||
| LnlMR | 2.24 | .41 | 2.28 | .39 |
| LnNMR | 1.82 | .45 | 1.88 | .43 |
| LnPNMR | 1.13 | .39 | 1.15 | .37 |
| White LnlMR | 2.10 | .41 | 2.11 | .40 |
| Black LnlMR | 2.86 | .35 | ||
|
| ||||
| Rep-control Lower House | .37 | .48 | .30 | .46 |
| Rep-control Upper House | .40 | .49 | .35 | .48 |
| Rep-control Congress | .29 | .45 | .23 | .42 |
| Rep Governor | .46 | .50 | .46 | .50 |
|
| ||||
| Unemployment rate | 6.0 | 2.06 | 6.1 | 2.02 |
| Females average age | 35.8 | 2.75 | 36.1 | 2.25 |
| Birth rate | 15.0 | 2.52 | 14.8 | 1.89 |
Note: “All states” represents all states with the exception of Nebraska (n=49), which has a unicameral system; “32 states” are the 32 states with enough black population to estimate a reliable black infant mortality rate during the study period.
Figure 1.
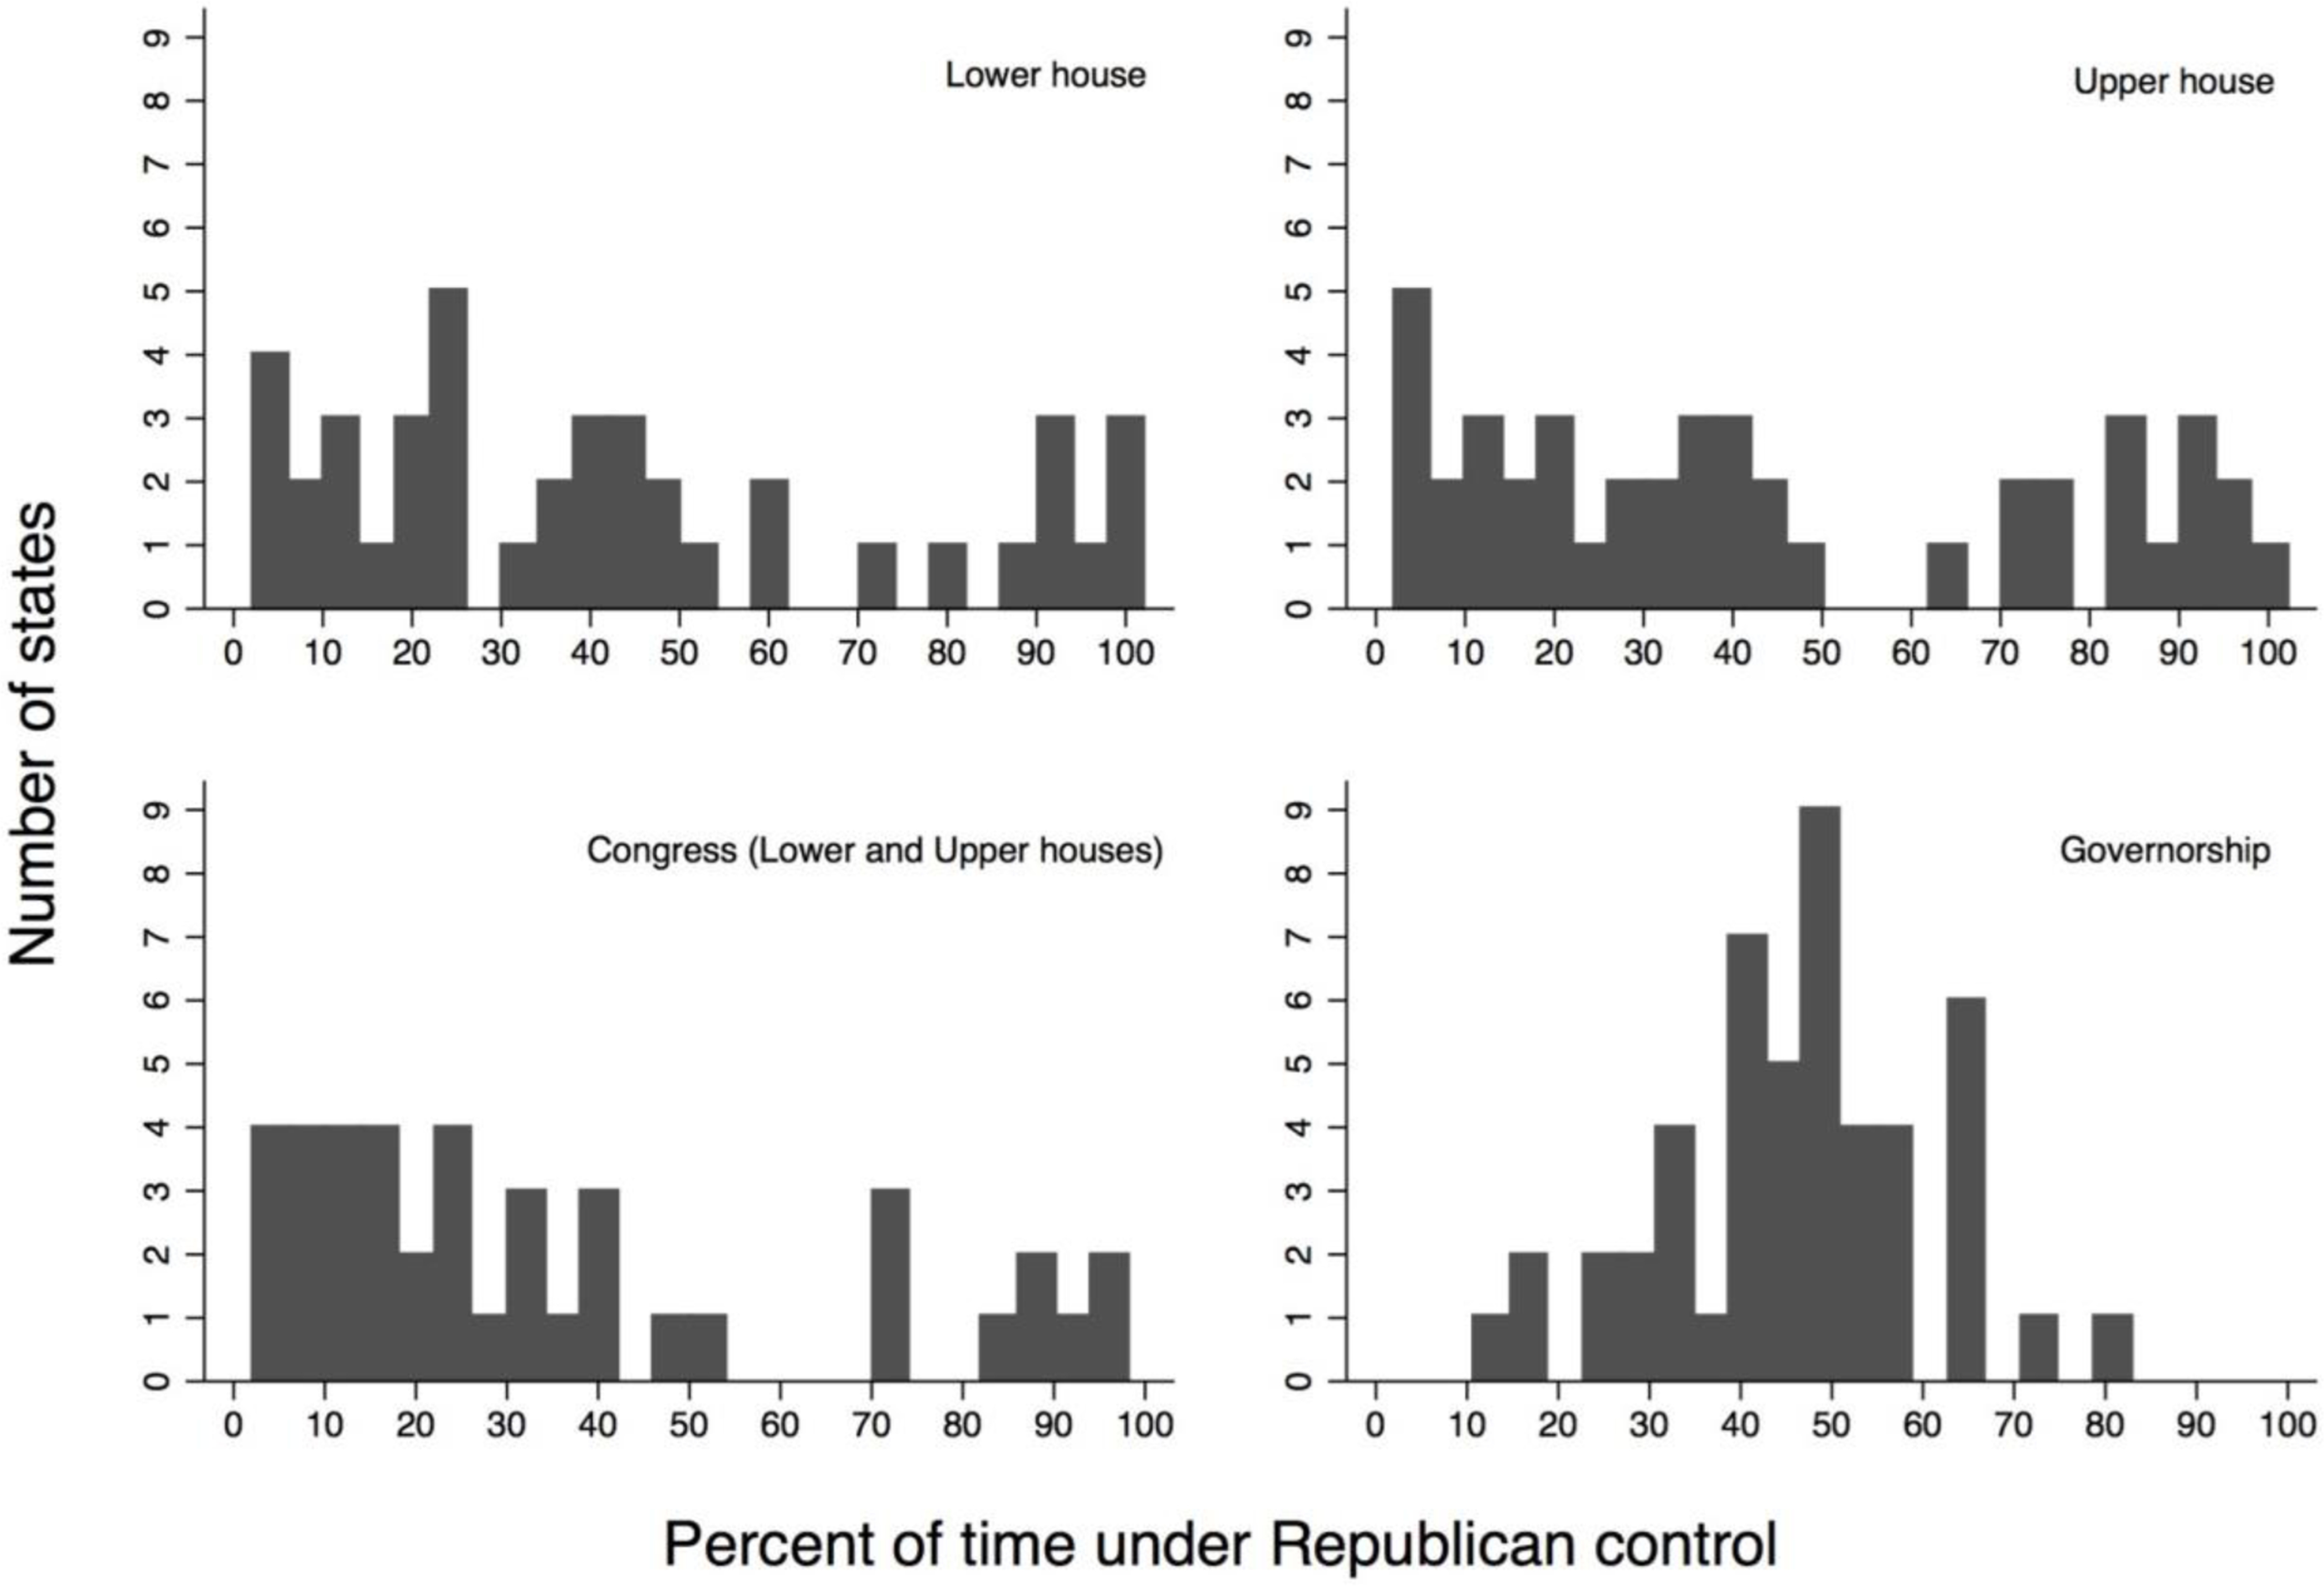
Time under Republican control in state legislatures and governorship, 1969–2024
We report estimates of equation 1 in the Supplementary Materials. In the cases where the dependent variable involves either overall infant mortality or postneonatal infant mortality the estimated coefficients of the party control variables are jointly significant at conventional levels (SM). Tables 2 and 3 translate these estimates into the implied effect of transitioning to Republican control of either or both houses or the governorship. These estimates are linear combinations of coefficient estimates from equation 1. For example, estimates of represent the effect of moving from a legislature controlled by Democrats to one in which the lower house in controlled by Republicans. Estimates of represent the effect of moving from a scenario where both houses are controlled by Democrats to one in which both are controlled by Republicans. We thus report the implied effect for going from a simultaneously non-Republican-controlled legislature (both chambers) to other partisan-control scenarios on logged IMR, NMR, and PNMR (Table 2) and on logged White infant mortality (WIMR), Black infant mortality (BIMR), and the Black-White IMR gap (Table 3). (Results for period 1977–2014 support the same conclusions; SM.)
Table 2.
Contrast estimates for party control in state legislatures and the governor’s party on logged state IMR, NMR, and PNMR
| Contrast | Estimate | LnIMR | LnNMR | LnPNMR |
|---|---|---|---|---|
|
| ||||
| Legislature Transitions | ||||
|
|
||||
| All Dem to Lower House Rep | Coeff | .033 | .034 | .033 |
| p-value | .039 | .080 | .056 | |
| 95% CI | .002 – .065 | −.004 – .072 | −.001 – .067 | |
| All Dem to Upper House Rep | Coeff | .025 | .007 | .062 |
| p-value | .103 | .752 | .000 | |
| 95% CI | −.005 – .056 | −.035 – .048 | .033 – .091 | |
| All Dem to Both Houses Rep | Coeff | .042 | .019 | .081 |
| p-value | .007 | .292 | .000 | |
| 95% CI | .012 – .072 | −.017 – .056 | .039 – .124 | |
|
|
||||
| Governor Transitions | ||||
|
|
||||
| All Dem to Governor Rep | Coeff | .001 | −.000 | .006 |
| p-value | .859 | .967 | .567 | |
| 95% CI | −.014 – .017 | −.018 – .018 | −.015 – .027 | |
|
|
||||
| Legislatures and Governor Transitions | ||||
|
|
||||
| All Dem to All Rep | Coeff | .043 | .019 | .087 |
| p-value | .003 | .202 | .000 | |
| 95% CI | .015 – .071 | −.010 – .048 | .041 – .133 | |
Note: All effects are derived from estimates of equation 1. The standard errors are clustered at the state level to account for arbitrary forms of within state serial correlations. All regressions are weighted using time-constant, averaged total number of births in the states. All states included with the exception of Nebraska (n=49), which has a unicameral system. Controls are females average age, unemployment rate, the birth rate, and time and state fixed effects. Boldface indicates statistical significance (p<0.05).
Table 3.
Contrast estimates for party control in state legislatures and the governor’s party on logged state race-specific IMR
| Contrast | Estimate | LnWIMR | LnBIMR | Racial Gap |
|---|---|---|---|---|
|
| ||||
| Legislature Transitions | ||||
|
|
||||
| All Dem to Lower House Rep | Coeff | .014 | .041 | .029 |
| p-value | .295 | .339 | .410 | |
| 95% CI | −.013 – .041 | −.044 – .126 | −.041 – .099 | |
| All Dem to Upper House Rep | Coeff | .018 | .040 | .022 |
| p-value | .208 | .007 | .122 | |
| 95% CI | −.011 – .047 | .011 – .069 | −.006 – .049 | |
| All Dem to Both Houses Rep | Coeff | .026 | .059 | .033 |
| p-value | .030 | .021 | .079 | |
| 95% CI | .003 – .049 | .009 – .109 | −.004 – .069 | |
|
|
||||
| Governor Transitions | ||||
|
|
||||
| All Dem to Governor Rep | Coeff | .004 | .001 | −.002 |
| p-value | .525 | .897 | .766 | |
| 95% CI | −.009 – .017 | −.021 – .024 | −.018 – .013 | |
|
|
||||
| Legislatures and Governor Transitions | ||||
|
|
||||
| All Dem to All Rep | Coeff | .030 | .061 | .030 |
| p-value | .008 | .014 | .132 | |
| 95% CI | .008 – .052 | .013 – .109 | −.009 – .070 | |
Note: All effects are derived from estimates of equation 1. The standard errors are clustered at the state level to account for arbitrary forms of within state serial correlations. “Racial Gap” refers to LnBIMR – LnWIMR. All regressions are weighted using time-constant, averaged total number of Black births in the states. The sample comprises the 32 states with enough Black population to retrieve reliable IMRs. Controls are females average age, unemployment rate, the birth rate, and time and state fixed effects. Boldface indicates statistical significance (p<0.05).
Our estimates show that going from a non-Republican-contolled legislature to one where the Lower House is controlled by Republicans is associated with a rise in overall IMR of 3.3%, NMR of 3.4%, and PNMR of 3.3%. Effects for goring from a non-Republican-controlled to a Republican-controlled Upper House shows increases of 2.5%, 0.7%, and 6.2% in IMR, NMR, and PNMR respectively. Simultaneous Republican control of the Lower and the Upper House shows increases of 4.2% (IMR), 1.9% (NMR), and 8.1% (PNMR). Effects for Republican-controlled governorships are small and not statistically distinguishable from 0. What appears to affect infant health, is the Republican control of state legislatures and not of governorships.
Table 3 reports contrasts for our race-specific analyses. Going from a non-Republican-contolled legislature to one where both houses are controlled by Republicans raises WIMR by 2.6% and BIMR by 5.9%. In general, our estimates suggest that moving from Democratic to Republican control of one or both legislative chambers is associated with an increase in IMR for both Whites and Blacks, with the effects being larger for Black infants. While point estimates are consistently higher for BIMR than for WIMR, the race-specific results are sometimes imprecisely estimated, and the Black-White difference is never statistically significant at conventional levels.
Discussion
We found that annual state IMR, NMR, and PNMR are consistently higher under Republican-controlled state legislatures than under non-Republican-controlled ones. When we stratified by race, we found larger estimates for Black than for White infants, though the differences were not statististically significant at conventional levels. Our estimates also suggest that simultaneous Republican control of the state Lower and Upper House (i.e., Congress) showed greater associations with IMR and PNMR than individually Republican-controlled houses, although the increase in the size of the association when moving from one to both houses under Republican control was often small.
The effects of a Republican-controlled state Congress on IMR and PNMR are 4.2% and 8.1%, respectively. These are striking effects considering that, since the year 2000, the average annual state IMR and PNMR declines were 1.3% and 1.5%, respectively. These are also larger than estimates found in previous research showing a robust association between the party of the president and infant mortality. To further place our results in context, Goodman-Bacon 33 reports that the introduction of Medicaid was associated with an 8% decline in the non-White IMR between 1965 and 1980. Comparatively, our annual estimate for a Republican-controlled Congress on BIMR is 5.9%—i.e., 74% the magnitude of the 15-year effect attributed to the introduction of Medicaid.
Net of party control of legislatures, we found no clear evidence of Republican governor effects on any of our infant-related mortality rates. This may reflect variability in the balance of power between the executive and legislative branches across states. There are states with weak and others with strong governors; some weak governors even lack the authority to create their own cabinets, submit budgets, or to veto legislation. 34 Also, governors’ health policy positions seem to be more synchronized with state-level political culture than with national party ideological stances. Democratic states like California and Massachusetts, for example, have had Republican governors who are not highly conservative in the conventional sense. The same happens with non-Republican governors in Republican states where, for example, very recently the Democratic governor of Louisiana signed a stringent abortion ban into law. 35
Whereas our estimates show no detectable effect of the governor’s party, our estimates do show substantive effects of party control of the Lower House on IMR, NMR, and PNMR. In general, there is a tendency for postneonatal estimates to be larger than neonatal estimates, which makes some sense. Neonatal deaths are more likely to reflect maternal health over her life course, which make them less susceptible to short-term policy fluctuations rinduced by transitions in party control. Influences on postneonatal mortality include more social components operating directly on infants that are potentially lethal in the short term, such as home and environmental safety and food security that influence the risk of lethal accidents, injury, infectious disease or malnourishment—all of which are more immediately affected by current policy.
By including state and year fixed effects in our models, we controlled for overall trends and permanent differences across states. We may be, however, not controlling for unobserved differences across states that may change at roughly the same time as the party control change of state legislatures; thus, causal inferences should be made with caution. Regardless of whether the right interpretation of our estimates represents causal effects of legislative control or are indicators of other contemporaneous changes, the magnitudes are large enough to raise serious concerns. Our estimates were robust to controlling for unemployment rates, average age of females, and birth rate. However, in our 1977–2014 analyses for IMR and PNMR, once the high school dropout rate and the poverty rate were included in our models, the effect of Republican-controlled legislatures dropped by about 20%. Whether to interpret high school dropout and poverty as confounders or mechanisms of the association between party control and infant health is unclear, but it does raise the possibility that there may be other unmeasured factors that might partially account for our estimates. Regardless of whether party control causally affects health or is an indicator of other underlying factors, the magnitude of these effects suggest there is something important going on in these states affecting population health and suggest heterogeneity among states is an essential locus for considering mechanisms in future research.
While our goal was not to identify specific causal mechanisms, and data limitations precluded our doing so, there are plausible mechanisms connecting Republican control of state legislatures and increases in infant mortality relative to trend. For example, with smoking during pregnancy and exposure to environmental pollutants both risk factors for poor pregnancy outcomes, part of the mechanism that may contribute to the associations we report could be that Republican administrations are found to lower cigarette taxes 36 and de-regulate environmental health protections. 37 Republican budget proposals also tend to disservice Black people and the poor 38 and induce fiscal deficits through tax cuts reducing access to and defunding healthcare. 39–41 Republican politicians are more likely to weaken social welfare and other safety net programs, undermining support systems among vulnerable populations. 42 One study found evidence that state budgeting might partially mediate the association between party majority in state legislatures and infant health. 43 Republican administrations are also known to de-regulate the gun industry 44 and to correlate with higher suicide and homicide rates. 45 Research shows they also correlate with higher unemployment, and income and wealth inequality46—all of which are known to detrimentally affect the poor and the populations with higher healthcare needs. In addition, policies that shape the electorate in ways that increase Republican electoral advantage by suppressing the vote of those who suffer the greatest health inequities—the poor and minorities—could influence to which voters elected Republicans feel beholden when shaping their agenda and policy priorities.38, 46–52 Examples of such policies include strict voter identification laws, felony disenfranchisement, and gerrymandering.
Our findings are consistent with research emphasizing the power that political institutions and government officials have on writing and executing the policies and programs that shape the social determinants of health, including those shaping infant health.53 Rodriguez 53 proposed the “politics hypothesis”—the proposition that the social determinants of health are, at least in part, constructed by the power vested in governments. That the party that controls state legislatures is powerfully associated with fluctuations in infant mortality and racial disparities in infant health, should send a clear signal to the public health community: A deep understanding of political processes and institutions at the state level is necessary for improving overall population health and promoting health equity.
Supplementary Material
References
- 1.Thurber JA, Yoshinaka A. American gridlock: The sources, character, and impact of political polarization. Cambridge University Press; 2015. [Google Scholar]
- 2.Bonica A, McCarty N, Poole KT, Rosenthal H. Why hasn’t democracy slowed rising inequality? Journal of Economic Perspectives 2013;27(3):103–24. [Google Scholar]
- 3.McDonough JE. The road ahead for the Affordable Care Act. New England Journal of Medicine 2012;367(3):199–201. [DOI] [PubMed] [Google Scholar]
- 4.Pacheco J, Boushey G. Public health and agenda setting: determinants of state attention to tobacco and vaccines. Journal of health politics, policy and law 2014;39(3):565–589. [DOI] [PubMed] [Google Scholar]
- 5.Beckfield J, Bambra C. Shorter lives in stingier states: social policy shortcomings help explain the US mortality disadvantage. Social science & medicine 2016;171:30–38. [DOI] [PubMed] [Google Scholar]
- 6.Purtle J, Goldstein ND, Edson E, Hand A. Who votes for public health? US senator characteristics associated with voting in concordance with public health policy recommendations (1998–2013). SSM-population health 2017;3:136–140. [DOI] [PMC free article] [PubMed] [Google Scholar]
- 7.Rodriguez JM, Bound J, Geronimus AT. US infant mortality and the President’s party. International journal of epidemiology 2013;43(3):818–826. [DOI] [PMC free article] [PubMed] [Google Scholar]
- 8.Rodriguez JM, Bound J, Geronimus AT. Rejoinder: Time series analysis and US infant mortality: de-trending the empirical from the polemical in political epidemiology. International journal of epidemiology 2014;43(3):831–834. [DOI] [PMC free article] [PubMed] [Google Scholar]
- 9.Conlan TJ. From new federalism to devolution: Twenty-five years of intergovernmental reform. Brookings Institution Press; 2010. [Google Scholar]
- 10.Katz Olson L. Health Care. In: Niemi RG, Dyck JJ, editors. Guide to State Politics and Policy. London, UK: CQ Press; 2013. [Google Scholar]
- 11.Soss J, Schram SF, Vartanian TP, O Brien E. Setting the terms of relief: Explaining state policy choices in the devolution revolution. American Journal of Political Science 2001;45(2):378–395. [Google Scholar]
- 12.Rom MC. Transforming state health and welfare programs. Politics in the American states 1999:117–31. [Google Scholar]
- 13.Montez JK, Hayward MD, Zajacova A. Educational Disparities in Adult Health: US States as Institutional Actors on the Association. Socius 2019;5:2378023119835345. [DOI] [PMC free article] [PubMed] [Google Scholar]
- 14.Montez JK, Zajacova A, Hayward MD, Woolf SH, Chapman D, Beckfield J. Educational Disparities in Adult Mortality Across US States: How Do They Differ, and Have They Changed Since the Mid-1980s? Demography 2019;56(2):621–644. [DOI] [PMC free article] [PubMed] [Google Scholar]
- 15.Bowling CJ, Pickerill JM. Fragmented federalism: The state of American federalism 2012–13. Publius: The Journal of Federalism 2013;43(3):315–346. [Google Scholar]
- 16.Purtle J, Henson RM, Carroll-Scott A, Kolker J, Joshi R, Diez Roux AV. US mayors’ and health commissioners’ opinions about health disparities in their cities. American journal of public health 2018;108(5):634–641. [DOI] [PMC free article] [PubMed] [Google Scholar]
- 17.Montez JK, Beckfield J, Cooney JK, Grumbach JM, Hayward MD, Koytak HZ, et al. US State Policies, Politics, and Life Expectancy. The Milbank quarterly 2020. [DOI] [PMC free article] [PubMed] [Google Scholar]
- 18.Cox GW, McCubbins MD. Legislative leviathan: Party government in the House. Cambridge University Press; 2007. [Google Scholar]
- 19.Tesler M. The spillover of racialization into health care: How President Obama polarized public opinion by racial attitudes and race. American Journal of Political Science 2012;56(3):690–704. [Google Scholar]
- 20.Bhatt CB, Beck-Sagué CM. Medicaid expansion and infant mortality in the United States. American journal of public health 2018;108(4):565–567. [DOI] [PMC free article] [PubMed] [Google Scholar]
- 21.Henderson M, Hillygus DS. The dynamics of health care opinion, 2008–2010: Partisanship, self-interest, and racial resentment. Journal of Health Politics, Policy and Law 2011;36(6):945–960. [DOI] [PubMed] [Google Scholar]
- 22.Race Michener J., Politics, and the Affordable Care Act. Journal of health politics, policy and law 2020;45(4):547–566. [DOI] [PubMed] [Google Scholar]
- 23.Geronimus AT, Thompson JP. To denigrate, ignore, or disrupt: racial inequality in health and the impact of a policy-induced breakdown of African American communities. Du Bois Review 2004;1(2):247. [Google Scholar]
- 24.Cheadle JE, Goosby BJ, Jochman JC, Tomaso CC, Yancey CBK, Nelson TD. Race and ethnic variation in college students’ allostatic regulation of racism-related stress. Proceedings of the National Academy of Sciences 2020;117(49):31053–31062. [DOI] [PMC free article] [PubMed] [Google Scholar]
- 25.Rodriguez JM, Karlamangla AS, Gruenewald TL, Miller-Martinez D, Merkin SS, Seeman TE. Social stratification and allostatic load: shapes of health differences in the MIDUS study in the United States. Journal of biosocial science 2019;51(5):627–644. [DOI] [PMC free article] [PubMed] [Google Scholar]
- 26.LeBrón AM, Viruell-Fuentes EA. Racial/Ethnic Discrimination, Intersectionality, and Latina/o Health. In: New and Emerging Issues in Latinx Health: Springer; 2020. p. 295–320. [Google Scholar]
- 27.Michener J. Social class as racialized political experience. In: The Forum; 2017: De Gruyter; 2017. p. 93–110. [Google Scholar]
- 28.Michener J. Policy feedback in a racialized polity. Policy Studies Journal 2019;47(2):423–450. [Google Scholar]
- 29.Inwood JF. Neoliberal racism: the ‘Southern Strategy’and the expanding geographies of white supremacy. Social & Cultural Geography 2015;16(4):407–423. [Google Scholar]
- 30.Clarke W. Divided government and budget conflict in the US states. Legislative Studies Quarterly 1998:5–22. [Google Scholar]
- 31.Klarner C. The measurement of the partisan balance of state government. State Politics & Policy Quarterly 2003;3(3):309–319. [Google Scholar]
- 32.Arellano M. Computing robust standard errors for within-groups estimators. Oxford bulletin of Economics and Statistics 1987;49(4):431–434. [Google Scholar]
- 33.Goodman-Bacon A. Public insurance and mortality: evidence from Medicaid implementation. Journal of Political Economy 2018;126(1):216–262. [Google Scholar]
- 34.Radin BA, Boase JP. Federalism, political structure, and public policy in the United States and Canada. Journal of Comparative Policy Analysis: Research and Practice 2000;2(1):65–89. [Google Scholar]
- 35.Gonzalez R. Louisiana’s Democratic Governor Signs Abortion Ban Into Law. 2019. [Google Scholar]
- 36.Golden SD, Ribisl KM, Perreira KM. Economic and political influence on tobacco tax rates: a nationwide analysis of 31 years of state data. American journal of public health 2014;104(2):350–357. [DOI] [PMC free article] [PubMed] [Google Scholar]
- 37.Fredrickson L, Sellers C, Dillon L, Ohayon JL, Shapiro N, Sullivan M, et al. History of US presidential assaults on modern environmental health protection. American journal of public health 2018;108(S2):S95–S103. [DOI] [PMC free article] [PubMed] [Google Scholar]
- 38.Griffin J, Newman B. The presidency and political equality. In: Congress & the Presidency; 2016: Taylor & Francis; 2016. p. 352–376. [Google Scholar]
- 39.Alexander M. The new Jim Crow : mass incarceration in the age of colorblindness. New York: New Press; 2010. [Google Scholar]
- 40.Kawachi I. The US elections and the global recession: what’s next? Journal of Epidemiology & Community Health 2009;63(2):89–90. [DOI] [PubMed] [Google Scholar]
- 41.Pagel C, Bates DW, Goldmann D, Koller CF. A way forward for bipartisan health reform? Democrat and republican state legislator priorities for the goals of health policy. In: American Public Health Association; 2017. [DOI] [PMC free article] [PubMed] [Google Scholar]
- 42.Miller DB, Hokenstad T. Rolling downhill: effects of austerity on local Government social services in the United States. J. Soc. & Soc. Welfare 2014;41:93. [Google Scholar]
- 43.Goldstein ND, Palumbo AJ, Bellamy SL, Purtle J, Locke R. State and local government expenditures and infant mortality in the United States. Pediatrics 2020;146(5). [DOI] [PubMed] [Google Scholar]
- 44.Santilli A, O’Connor Duffany K, Carroll-Scott A, Thomas J, Greene A, Arora A, et al. Bridging the response to mass shootings and urban violence: exposure to violence in New Haven, Connecticut. American journal of public health 2017;107(3):374–379. [DOI] [PMC free article] [PubMed] [Google Scholar]
- 45.Gilligan J. Why some politicians are more dangerous than others. John Wiley & Sons; 2013. [Google Scholar]
- 46.Bartels LM. Unequal democracy: The political economy of the new gilded age. Princeton University Press; 2016. [Google Scholar]
- 47.Chen J, Rodden J. Unintentional gerrymandering: Political geography and electoral bias in legislatures. Quarterly Journal of Political Science 2013;8(3):239–269. [Google Scholar]
- 48.Cottrell D, Herron MC, Rodriguez JM, Smith DA. Mortality, incarceration, and African American disenfranchisement in the contemporary United States. American Politics Research 2019;47(2):195–237. [Google Scholar]
- 49.Purtle J. Felon disenfranchisement in the United States: a health equity perspective. American Journal of Public Health 2013;103(4):632–637. [DOI] [PMC free article] [PubMed] [Google Scholar]
- 50.Rodriguez JM, Geronimus AT, Bound J, Dorling D. Black lives matter: Differential mortality and the racial composition of the US electorate, 1970–2004. Social Science & Medicine 2015;136:193–199. [DOI] [PMC free article] [PubMed] [Google Scholar]
- 51.Barreto MA, Nuño S, Sanchez GR, Walker HL. The racial implications of voter identification laws in America. American Politics Research 2019;47(2):238–249. [Google Scholar]
- 52.Hajnal Z, Lajevardi N, Nielson L. Voter identification laws and the suppression of minority votes. The Journal of Politics 2017;79(2):363–379. [Google Scholar]
- 53.Rodriguez JM. The politics hypothesis and racial disparities in infants’ health in the United States. SSM-population health 2019;8:100440. [DOI] [PMC free article] [PubMed] [Google Scholar]
Associated Data
This section collects any data citations, data availability statements, or supplementary materials included in this article.