Figure 6. Relationship between AS rate and gene expression level.
For each species, we selected major-isoform introns with a sufficient sequencing depth to have a precise measure of their AS rate (). We divided major-isoform introns into 5% bins according to their gene expression level and computed the correlation between the average AS rate and median expression level across the 20 bins. To increase sample size, these analyses were based on all annotated protein-coding genes (and not only the BUSCO gene set). (A) Distribution of Pearson correlation coefficients (R) between the AS rate and expression level observed in the 53 metazoans. The vertical dashed lines indicates the thresholds under and above which correlations are significant (i.e. p-value < 0.05). (B): Distribution of Pearson correlation coefficients computed on the subsets of low-AS major-isoform introns (i.e. after excluding major-isoform introns with abundant SVs). (C,D) Two representative species illustrating the negative relation between the average AS rate of low-AS major-isoform introns and the expression level of their gene. Error bars represent the standard error of the mean. (C) N=127,599 low-AS major-isoform introns from Homo sapiens, (D) N=31,357 low-AS major-isoform introns from Drosophila melanogaster.

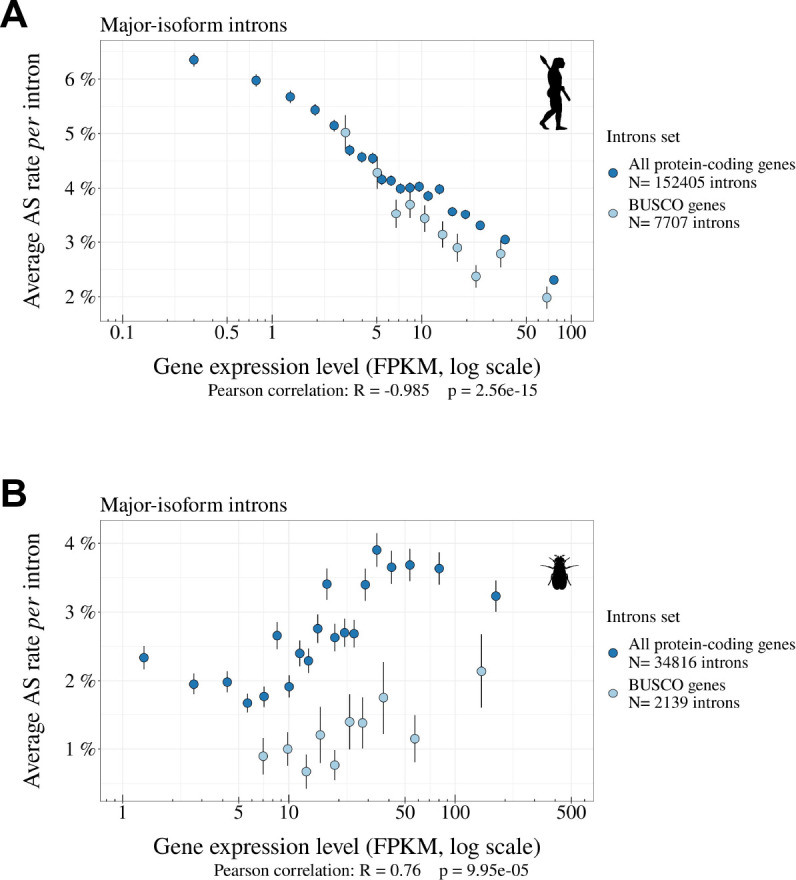
Figure 6—figure supplement 1. Correlations between gene expression levels and AS rates differ among species.