Abstract
Background
Some patients with high-risk gastrointestinal stromal tumor (GIST) experience disease progression after complete resection and adjuvant therapy. It is of great significance to distinguish these patients among those with high-risk GIST. Radiomics has been demonstrated as a promising tool to predict various tumors prognosis.
Methods
From January 2006 to December 2018, a total of 100 high-risk GIST patients (training cohort: 60; validation cohort: 40) from Guangdong Provincial People’s Hospital with preoperative enhanced computed tomography (CT) images were enrolled. The radiomics features were extracted and a risk score was built using least absolute shrinkage and selection operator-Cox model. The clinicopathological factors were analyzed and a nomogram was established with and without radiomics risk score. The concordance index (C-index), calibration plot, and decision curve analysis (DCA) were used to evaluate the performance of the radiomics nomograms.
Results
We selected 11 radiomics features associated with recurrence or metastasis. The risk score was calculated and significantly associated with disease-free survival (DFS) in both the training and validation group. Cox regression analysis showed that Ki67 was an independent risk factor for DFS [P=0.004, hazard ratio 4.615, 95% confidence interval (CI): 1.624–13.114]. The combined radiomics nomogram, which integrated the radiomics risk score and significant clinicopathological factors, showed good performance in predicting DFS, with a C-index of 0.832 (95% CI: 0.761–0.903), which was better than the clinical nomogram (C-index 0.769, 95% CI: 0.679–0.859) in training cohort. The calibration curves and the DCA plot suggested satisfying accuracy and clinical utility of the model.
Conclusions
The CT-based radiomics nomogram, combined with the clinicopathological factors and risk score, has good potential to assess the recurrence or metastasis of patients with high-risk GIST.
Keywords: Gastrointestinal stromal tumor (GIST), high-risk, highest-risk, radiomics, computed tomography (CT)
Highlight box.
Key findings
• The computed tomography (CT)-based radiomics combined with clinicopathological nomogram can distinguish highest-risk patients from high-risk patients with gastrointestinal stromal tumor (GIST).
What is known and what is new?
• Tumor necrosis, mitotic figure, and Ki67 are independent prognostic factors for recurrence of high-risk GIST.
• The CT-based radiomics combined with clinicopathological nomogram can improve the accuracy of GIST risk prediction.
What is the implication, and what should change now?
• Radiomics is a promising method to predict the prognosis of high-risk GIST, especially in combination with clinicopathological data.
Introduction
Gastrointestinal stromal tumor (GIST) is the most common human mesenchymal neoplasm of the gastrointestinal tract, mostly originating from the stomach, small intestine, and some rare sites such as the mesentery and pelvis (1). Risk stratification plays critical roles in the clinical management of patients with GIST, which assesses the probability of recurrence or metastasis. The modified National Institutes of Health (NIH) criteria is now the most widely used system for GIST risk stratification, which consists of tumor size, mitotic count, tumor site, and tumor rupture (2). It classifies GIST into very-low, low, intermediate, and high-risk groups. Surgical resection is the standard treatment for primary localized GIST. The management of patients with GISTs has changed after the introduction of different tyrosine kinase inhibitors (TKI), first of all Imatinib, with a drastic improvement in prognosis (3,4). However, some patients, especially those in the high-risk group, experience disease progression even after complete resection and adjuvant therapy (5,6). Thus, for patients in the high-risk group, it is important to distinguish those who have greater probability for recurrence or metastasis. We aimed to develop a method for distinguishing this subgroup of patients based on clinicopathological features and extending the duration of postoperative adjuvant therapy, thereby enhancing patients’ prognosis. We found that tumor necrosis and >20 mitoses/50 high-power fields (HPFs) can distinguish two additional classification (“very high-risk” and “highest-risk”) within the high-risk GIST group (7).
In recent years, radiomics has been demonstrated as a promising tool to explore lesions in radiological images that cannot be analyzed visually (8). Through extensive mathematical analysis, radiomics has been successfully applied to differential diagnosis, Ki67 expression, risk stratification, prediction of prognosis, and assessment of mutational status of GIST (9-11). Researchers have indicated the feasibility and superiority of radiomics application in the different aspects described above in patients with GIST compared with purely clinical factors. Although several clinical models have been extended to evaluate the prognosis of patients with high-risk GIST, few of them had tried to incorporate radiomics methods into assessment (12).
In this study, we aimed to develop and validate an enhanced computed tomography (CT)-based radiomics nomogram for preoperative prediction of recurrence or metastasis in patients with high-risk GIST, assisting clinical management and decision-making. We present this article in accordance with the TRIPOD reporting checklist (available at https://jgo.amegroups.com/article/view/10.21037/jgo-23-963/rc).
Methods
Patients
From January 2006 to December 2018, a total of 100 consecutive high-risk GIST patients from Guangdong Provincial People’s Hospital were enrolled in this study. According to the Scandinavian Sarcoma Group (SSG) XVIII/Arbeitsgemeinschaft Internistische Onkologie (AIO) trial (NCT00116935) (3), a high-risk GIST is defined as follows: (I) tumor in any site with >10 cm in diameter; (II) tumor in any site with >10 mitoses per 50 HPFs; (III) tumor in any site with >5 cm in diameter, and >5 mitoses per 50 HPFs; (IV) non-gastric tumor with diameter >2 cm but ≤5 cm and >5 mitoses per 50 HPFs; (V) non-gastric tumor with diameter >5 cm but ≤10 cm and ≤5 mitoses per 50 HPFs. The inclusion criteria were as follows: (I) high-risk GIST; (II) with tumor R0 resection; (III) without tumor rupture or metastasis at diagnosis; (IV) routine use of imatinib after surgery; (V) regular follow-up and have complete clinicopathological data and preoperative enhanced CT image. Patients received adjuvant Imatinib for three years and follow-up according to the recommended guidelines. High-risk GIST patients performed during the follow-up an abdominal CT scan every 3–6 months for 3 years during adjuvant therapy; then every 3 months for 2 years, every 6 months until 5 years from stopping adjuvant therapy, and annually for an additional 5 years (7). We randomly divided the eligible patients at a ratio of 6:4 into two groups: a training cohort (n=60) and a validation cohort (n=40). Disease-free survival (DFS) was defined as the time after surgery until the time of recurrence or metastasis. This study was approved by the Ethics Committee of Guangdong Provincial People’s Hospital (No. 2019-457H-2), and written operation informed consent was provided by all patients. The study was conducted in accordance with the Declaration of Helsinki (as revised in 2013).
CT image acquisition and radiomics feature extraction
Enhanced CT was performed by CT scanner in all patients. A total of 70 mL of iodixanol was injected intravenously at a rate of 2.0 mL/s. Patients were scanned and the venous images were saved 60–70 seconds after injection. The scan parameters as follows: tube voltage of 120–140 kV, tube current of 210 mA, pitch of 4.0, matrix size of 512×512, slice thickness of 2.5 mm, and a high spatial resolution algorithm. The image data were retrieved from the radiology department records system in Picture Archiving and Communication System in Digital Imaging and Communications in Medicine (DICOM) format.
Image segmentations were performed by two radiologists (reader A and reader B) through ITK-SNAP software (http://www.itksnap.org/pmwiki/pmwiki.php). The regions of interest delineated the cross-sectional tumor margin layer by layer on portal venous phase images. To assess intra- and inter-observer reproducibility, 30 images were randomly selected and evaluated by reader A and reader B independently. Reader A outlined imagine features twice using the same procedure. The intra-observer intraclass correlation coefficient (ICC) for both extractions by reader A was 0.959 [95% confidence interval (CI): 0.850–0.994]. The inter-observer ICC of features extracted by reader A and reader B in their first outlining was 0.941 (95 % CI: 0.804–0.992). Thus, all remaining images were segmented and the features were extracted by reader A.
Radiomics features were extracted using the PyRadiomics package (https://pyradiomics.readthedocs.io/en/latest/). Z-score standardization was performed on all radiomics features. Radiomics features with ICC >0.75 were selected. Subsequently, the least absolute shrinkage and selection operator (LASSO)-Cox regression analysis was performed to obtain the important radiomics features. The radiomics risk score was then calculated by combining the weights of selected radiomics features. Patients were divided into high- and low-risk groups according to the restricted cubic spline-Cox (RCS-Cox) method. Survival analysis was performed by Kaplan-Meier method.
Construction and validation of nomograms
Cox regression analysis was performed for the clinicopathological factors. The nomogram of DFS was constructed with either the significant clinicopathological factors alone, or a combination of significant clinicopathological factors and radiomics risk score. The discrimination power of nomograms was evaluated by the concordance index (C-index). Calibration curves were used to assess the consistency between predicted and observed survival probability. Decision curves analysis (DCA) was used to assess the net benefit of the nomograms for clinical decision-making at different threshold probabilities.
Statistical analysis
The software SPSS 22.0 (IBM Corp., Armonk, NY, USA) and R (version 3.5.1; http://www.R-project.org; The R Foundation for Statistical Computing, Vienna, Austria) were used for statistical analysis. Continuous variables were presented as the mean ± standard deviation for normally distributed variables or as the median (interquartile range) for non-normally distributed variables. Differences between the two groups were compared using the t-test or Mann-Whitney U test. Categorical variables were expressed by frequency (percentage) and assessed by chi-square test or Fisher’s exact test (13). The optimal cutoff values of clinicopathological factors were determined by X-tile software (Yale School of Medicine, New Haven, CT, USA). Survival curves were constructed using the Kaplan-Meier method and compared using the log-rank test. We used univariate and multivariate analyses to identify the independent prognostic factors. A multivariate Cox model with a backward stepwise selection was used to determine the prognostic factors with P<0.10 in those univariate analyses. The LASSO-Cox regression model analysis was based on the glmnet package. The rms package was used to establish the nomogram and calibration curve, and the DCA R package was used to perform the DCA. The C-index was used to evaluate and the Rcorrp.cens package in Hmisc in R was used to compare the predictive performance of the nomograms. The statistical significance levels reported were all based on two-sided testing, with a significance threshold set at 0.05.
Results
Patients clinicopathological characteristics
A total of 100 patients met the inclusion criteria and were enrolled. Of them, 60 patients were randomly selected as training cohort and 40 patients as validation cohort, the median follow-up time was 53 months (range, 32–89 months).
Radiomics features extraction and analysis
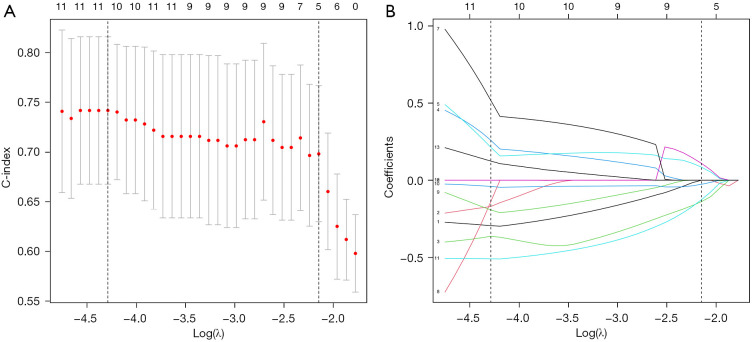
Initially, 1,037 radiomics features were extracted and 833 features were selected with ICC >0.75. The univariate Cox and LASSO Cox regression model was used to analyze the significant features for recurrence or metastasis. Finally, 11 features significantly associated with outcome were selected, with the minimum lambda as 0.0137 in the training cohort (Figure 1 & Table S1).
Figure 1.
Significant radiomic features analyzed by univariate Cox and LASSO Cox regression model [(A) Tuning parameter (λ) selection in the LASSO model used 10-fold cross-validation via minimum criteria, (B) LASSO coefficient profiles of the 833 texture features]. LASSO, least absolute shrinkage and selection operator.
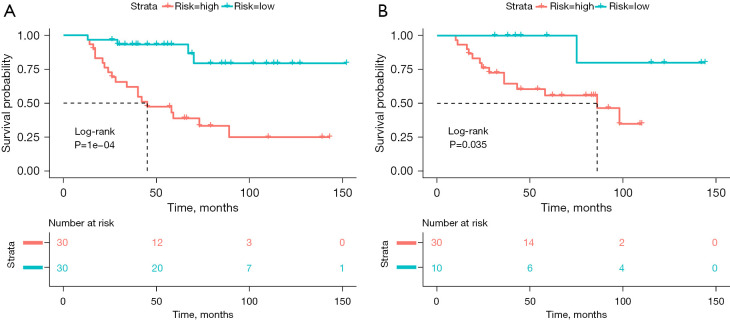
The Rad-score for each patient was calculated by combining the weights of selected features. According to the optimal cutoff value of Rad-score, all patients were classified into the high-risk group (Rad-score ≥0.134) or the low-risk group (Rad-score <0.134). The DFS was compared between the two groups with log-rank test (Figure 2) in both the training and validation cohorts. The DFS rates of the low-risk group were significantly higher than those of the high-risk group in both cohorts (P<0.001 in training cohort, P=0.035 in validation cohort).
Figure 2.
Survival analysis according to 11 selected radiomics features (A, training cohort; B, validation cohort).
Construction and validation of the nomogram
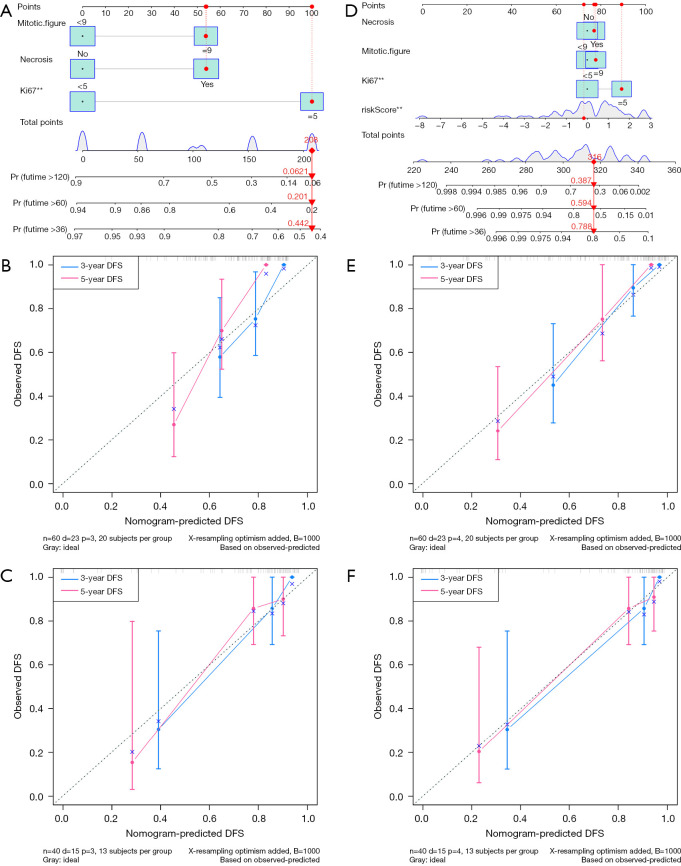
The results of the univariate and multivariate Cox analysis for the clinicopathological factors are displayed in Table 1. According to the multivariate analysis, tumor necrosis [hazard ratio (HR) 2.281; 95% CI: 0.930–5.595; P=0.072], mitotic figure (HR 2.275; 95% CI: 0.865–5.985; P=0.096), and Ki67 (HR 4.615; 95% CI: 1.624–13.114; P=0.004) were used for clinicopathologic nomogram construction. The radiomics nomogram was constructed combining the radiomics risk score and the clinicopathological factors described above. The C-index of the clinicopathologic nomogram was 0.769 (95% CI: 0.679–0.859) and 0.697 (95% CI: 0.535–0.859) in the training and validation cohort, respectively. The radiomics nomogram had a C-index of 0.799 (95% CI: 0.715–0.883) in the training cohort and 0.749 (95% CI: 0.658–0.840) in the validation cohort. The combined nomogram had a C-index of 0.832 (95% CI: 0.761–0.903) in the training cohort and 0.782 (95% CI: 0.704–0.860) in the validation cohort. The corresponding calibration curves are shown with their respective nomogram in Figure 3. The combined radiomics nomogram showed better discrimination performance than the clinicopathological or risk score nomogram.
Table 1. Univariate and multivariate analyses of high-risk gastrointestinal stromal tumor patients for DFS.
| Clinicopathology feature | Univariate | Multivariate | |||||
|---|---|---|---|---|---|---|---|
| Coef | HR (95% CI) | P | Coef | HR (95% CI) | P | ||
| Sex (male) | 0.450 | 1.568 (0.645–3.814) | 0.321 | – | – | – | |
| Necrosis (yes) | 1.033 | 2.810 (1.152–6.851) | 0.023 | 0.825 | 2.281 (0.930–5.595) | 0.072 | |
| Location (non-stomach) | −0.078 | 0.925 (0.408–2.101) | 0.853 | – | – | – | |
| Size | −0.041 | 0.960 (0.879–1.048) | 0.357 | – | – | – | |
| Mitotic figure (≥9) | 1.339 | 3.815 (1.503–9.682) | 0.005 | 0.822 | 2.275 (0.865–5.985) | 0.096 | |
| Ki67 (≥5) | 1.875 | 6.524 (2.398–17.748) | 0.000 | 1.529 | 4.615 (1.624–13.114) | 0.004 | |
| Age | 0.020 | 1.021 (0.992–1.050) | 0.163 | – | – | – | |
DFS, disease-free survival; Coef, coefficient; HR, hazard ratio; CI, confidence interval.
Figure 3.
Nomogram for DFS and calibration curve. (A) Clinicopathology nomogram for DFS. (B) Training cohort calibration curves of clinicopathology nomogram for DFS. (C) Validation cohort calibration curves of clinicopathology nomogram for DFS. (D) Clinicopathology combined with radiomics nomogram for DFS. (E) Training cohort calibration curves of combined nomogram for DFS. (F) Validation cohort calibration curves of combined nomogram for DFS. **, significant difference. DFS, disease-free survival.
Clinical utility
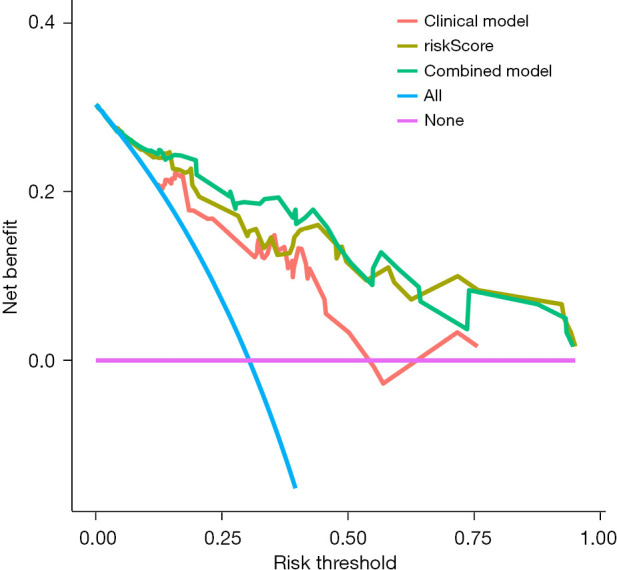
The DCA of the clinicopathology, risk score, and combined nomograms is displayed in Figure 4. The decision curve showed that if the threshold probability of a patient or doctor is >10%, using the nomogram model to predict DFS adds more benefit than either the treat-all-patients scheme or the treat-none scheme. The net benefit of the combined nomogram model is generally better than the clinicopathological model and comparable, with some overlap to risk score nomogram model.
Figure 4.

DCA of the clinicopathology, risk score, and combined nomograms. DCA, decision curve analysis.
Discussion
GISTs are believed to originates from the interstitial cells of Cajal, exhibiting distinctive biological behaviors such as predominantly positive immunostaining for KIT and DOG1, driven by an activating mutation in either KIT or PDGFRA. Surgery remains the cornerstone of GIST therapy (14). Prior to the advent of TKIs, the recurrence or metastasis rates were high, and prognosis was unfavorable. Earlier randomized controlled trials (RCTs) demonstrated that imatinib administration could delay GIST recurrence and enhance survival post-surgical resection (3,15,16). However, some patients in the study group experienced recurrence after therapy discontinuation, leading researchers to identify them as “very high-risk GIST” and “highest-risk GIST” (7). Prolonging adjuvant therapy was suggested to improve outcomes, yet accurately distinguishing these patients remains challenging.
In this study, we identified Ki67 as an independent risk factor for DFS, consistent with previous research (17). Ki67, a nuclear antigen associated with cell division and proliferation, serves as a prognostic indicator in various malignant tumors. Alongside Ki67, we incorporated tumor necrosis and mitotic figure into the nomogram construction. Our previous study indicated the relevance of tumor necrosis and mitotic figures in risk prediction, aiding in distinguishing “very high-risk” and “highest-risk” within high-risk’ gastric GIST group (7). Mitotic figures, included in the current risk stratification system, demonstrated a higher probability of recurrence with an elevated mitotic figure index, as indicated in the recurrence prediction contour map constructed from the pooled population. The nomogram, solely based on clinicopathological factors had a C-index of 0.769 (95% CI: 0.679–0.859) and 0.697 (95% CI: 0.535–0.859) in the two cohorts, suggesting that clinicopathological parameters alone might not suffice to evaluate the variability of recurrence or metastasis within the high-risk patient group. This limitation could be attributed to the heterogenicity of the high-risk group patients and the subjective identification of mitotic figures or Ki67 by pathologists.
Radiomics, a promising tool extracting high-throughput image features, aids in clinical decision-making. Previous studies based on enhanced-CT radiomics model for GIST had been reported. For instance, Lin et al. developed a contrast-enhanced (CE)-CT-based preoperative risk stratification nomogram predicting GIST mitosis (18). Chen et al. used a Residual Neural Network to build a model for predicting relapse-free survival (RFS) after surgical resection, achieving an area under the curve of 0.887 (19). Our study is the first to predict purely high-risk GIST RFS using a radiomics model. We found that the radiomics risk score significantly improve prognosis assessment. A total of 11 radiomics features were used to construct the radiomics signatures, and the weighted calculated radscore was significantly associated with DFS (P<0.001 in training cohort, P=0.035 in the validation cohort). Combining the radiomics signature with the clinicopathological factors showed superior prognostic prediction performance (C-index 0.832) compared to the clinicopathological model (C-index 0.769), indicating great potential in distinguishing high-risk GIST patients with higher likelihood of recurrence and metastasis.
Despite its contributions, our study has limitations. Firstly, this is a retrospective study and selection bias should be considered. Secondly, this study has a relatively small sample size, though it is the largest high-risk GIST cohort to date. Thirdly, due to the wide time span of patient data, some gene expression results are missing, making it impossible to incorporate them into the model construction. Future studies should focus on integrating radiomics data with novel techniques to enhance prediction accuracy.
Conclusions
In conclusion, our results showed that the CE-CT-based radiomics signature had great potential for assessing DFS in patients with high-risk GIST. The nomogram combined with radiomics signature and clinicopathological factors could help for individualized clinical decision-making.
Supplementary
The article’s supplementary files as
Acknowledgments
Funding: This study was supported by the Natural Science Foundation of Guangdong Province (No. 2020A1515010573), Medical Scientific Research Foundation of Guangdong Province of China (No. B2022168), National key Clinical Specialty Construction Project (No.2022YW030009), and the National Natural Science Foundation of China (No. 82102475).
Ethical Statement: The authors are accountable for all aspects of the work in ensuring that questions related to the accuracy or integrity of any part of the work are appropriately investigated and resolved. This study was approved by the Ethics Committee of Guangdong Provincial People’s Hospital (No. 2019-457H-2), and written informed consent was provided by all patients. The study was conducted in accordance with the Declaration of Helsinki (as revised in 2013).
Footnotes
Reporting Checklist: The authors have completed the TRIPOD reporting checklist. Available at https://jgo.amegroups.com/article/view/10.21037/jgo-23-963/rc
Data Sharing Statement: Available at https://jgo.amegroups.com/article/view/10.21037/jgo-23-963/dss
Peer Review File: Available at https://jgo.amegroups.com/article/view/10.21037/jgo-23-963/prf
Conflicts of Interest: All authors have completed the ICMJE uniform disclosure form (available at https://jgo.amegroups.com/article/view/10.21037/jgo-23-963/coif). The authors have no conflicts of interest to declare.
References
- 1.Casali PG, Blay JY, Abecassis N, et al. Gastrointestinal stromal tumours: ESMO-EURACAN-GENTURIS Clinical Practice Guidelines for diagnosis, treatment and follow-up. Ann Oncol 2022;33:20-33. 10.1016/j.annonc.2021.09.005 [DOI] [PubMed] [Google Scholar]
- 2.Joensuu H. Risk stratification of patients diagnosed with gastrointestinal stromal tumor. Hum Pathol 2008;39:1411-9. 10.1016/j.humpath.2008.06.025 [DOI] [PubMed] [Google Scholar]
- 3.Joensuu H, Eriksson M, Sundby Hall K, et al. One vs three years of adjuvant imatinib for operable gastrointestinal stromal tumor: a randomized trial. JAMA 2012;307:1265-72. 10.1001/jama.2012.347 [DOI] [PubMed] [Google Scholar]
- 4.Schuetze SM. Dawn of immunotherapy treatment for gastrointestinal stromal tumors. Gastrointest Stromal Tumor 2023;6:1. 10.21037/gist-22-4 [DOI] [Google Scholar]
- 5.Joensuu H, Wardelmann E, Sihto H, et al. Effect of KIT and PDGFRA Mutations on Survival in Patients With Gastrointestinal Stromal Tumors Treated With Adjuvant Imatinib: An Exploratory Analysis of a Randomized Clinical Trial. JAMA Oncol 2017;3:602-9. 10.1001/jamaoncol.2016.5751 [DOI] [PMC free article] [PubMed] [Google Scholar]
- 6.Raut CP, Espat NJ, Maki RG, et al. Efficacy and Tolerability of 5-Year Adjuvant Imatinib Treatment for Patients With Resected Intermediate- or High-Risk Primary Gastrointestinal Stromal Tumor: The PERSIST-5 Clinical Trial. JAMA Oncol 2018;4:e184060. 10.1001/jamaoncol.2018.4060 [DOI] [PMC free article] [PubMed] [Google Scholar]
- 7.Zheng J, Li R, Qiu H, et al. Tumor necrosis and >20 mitoses per 50 high-power fields can distinguish 'very high-risk' and 'highest-risk' within 'high-risk' gastric gastrointestinal stromal tumor. Future Oncol 2018;14:621-9. 10.2217/fon-2017-0509 [DOI] [PubMed] [Google Scholar]
- 8.Lambin P, Rios-Velazquez E, Leijenaar R, et al. Radiomics: extracting more information from medical images using advanced feature analysis. Eur J Cancer 2012;48:441-6. 10.1016/j.ejca.2011.11.036 [DOI] [PMC free article] [PubMed] [Google Scholar]
- 9.Wang FH, Zheng HL, Li JT, et al. Prediction of recurrence-free survival and adjuvant therapy benefit in patients with gastrointestinal stromal tumors based on radiomics features. Radiol Med 2022;127:1085-97. 10.1007/s11547-022-01549-7 [DOI] [PubMed] [Google Scholar]
- 10.Liu Y, He C, Fang W, et al. Prediction of Ki-67 expression in gastrointestinal stromal tumors using radiomics of plain and multiphase contrast-enhanced CT. Eur Radiol 2023;33:7609-17. 10.1007/s00330-023-09727-5 [DOI] [PubMed] [Google Scholar]
- 11.Yang L, Du D, Zheng T, et al. Deep learning and radiomics to predict the mitotic index of gastrointestinal stromal tumors based on multiparametric MRI. Front Oncol 2022;12:948557. 10.3389/fonc.2022.948557 [DOI] [PMC free article] [PubMed] [Google Scholar]
- 12.Zheng J, Xia Y, Xu A, et al. Combined model based on enhanced CT texture features in liver metastasis prediction of high-risk gastrointestinal stromal tumors. Abdom Radiol (NY) 2022;47:85-93. 10.1007/s00261-021-03321-3 [DOI] [PubMed] [Google Scholar]
- 13.Liu Q, Li J, Liu F, et al. A radiomics nomogram for the prediction of overall survival in patients with hepatocellular carcinoma after hepatectomy. Cancer Imaging 2020;20:82. 10.1186/s40644-020-00360-9 [DOI] [PMC free article] [PubMed] [Google Scholar]
- 14.Kalinowska I, Zdzienicki M, Skoczylas J, et al. A narrative review of surgical management of gastrointestinal stromal tumors. Gastrointest Stromal Tumor 2021;4:5. 10.21037/gist-21-2 [DOI] [Google Scholar]
- 15.Casali PG, Le Cesne A, Poveda Velasco A, et al. Time to Definitive Failure to the First Tyrosine Kinase Inhibitor in Localized GI Stromal Tumors Treated With Imatinib As an Adjuvant: A European Organisation for Research and Treatment of Cancer Soft Tissue and Bone Sarcoma Group Intergroup Randomized Trial in Collaboration With the Australasian Gastro-Intestinal Trials Group, UNICANCER, French Sarcoma Group, Italian Sarcoma Group, and Spanish Group for Research on Sarcomas. J Clin Oncol 2015;33:4276-83. 10.1200/JCO.2015.62.4304 [DOI] [PubMed] [Google Scholar]
- 16.Dematteo RP, Ballman KV, Antonescu CR, et al. Adjuvant imatinib mesylate after resection of localised, primary gastrointestinal stromal tumour: a randomised, double-blind, placebo-controlled trial. Lancet 2009;373:1097-104. 10.1016/S0140-6736(09)60500-6 [DOI] [PMC free article] [PubMed] [Google Scholar]
- 17.Liu X, Qiu H, Zhang P, et al. Ki-67 labeling index may be a promising indicator to identify "very high-risk" gastrointestinal stromal tumor: a multicenter retrospective study of 1022 patients. Hum Pathol 2018;74:17-24. 10.1016/j.humpath.2017.09.003 [DOI] [PubMed] [Google Scholar]
- 18.Lin JX, Wang FH, Wang ZK, et al. Prediction of the mitotic index and preoperative risk stratification of gastrointestinal stromal tumors with CT radiomic features. Radiol Med 2023;128:644-54. 10.1007/s11547-023-01637-2 [DOI] [PubMed] [Google Scholar]
- 19.Chen T, Liu S, Li Y, et al. Developed and validated a prognostic nomogram for recurrence-free survival after complete surgical resection of local primary gastrointestinal stromal tumors based on deep learning. EBioMedicine 2019;39:272-9. 10.1016/j.ebiom.2018.12.028 [DOI] [PMC free article] [PubMed] [Google Scholar]
Associated Data
This section collects any data citations, data availability statements, or supplementary materials included in this article.
Supplementary Materials
The article’s supplementary files as


