

Abstract
Expression of the serine/threonine kinase NEK2 is essential for entry into mitosis via its role in facilitating centrosome separation. Its overactivity can lead to tumorigenesis and drug resistance through the activation of several oncogenic pathways including AKT. While the cancer-enabling activities of NEK2 are documented in many malignancies, including correlations with poor survival in myeloma, breast, and non-small cell lung cancer, little is known about the role of NEK2 in lymphoma. Here, in tumors from patients with diffuse large B cell lymphoma (DLBCL), the most common, aggressive non-Hodgkin lymphoma, we found a high abundance of NEK2 mRNA and protein associated with an inferior overall survival. Using our recently developed NEK2 inhibitor, NBI-961, we discovered DLBCL cell lines and patient-derived cells exhibit a dependency on NEK2 for their viability. This compromised cell fitness was directly attributable to efficient NEK2 inhibition and proteasomal degradation by NBI-961. In a subset of particularly sensitive DLBCL cells, NBI-961 induced G2/mitosis arrest and apoptosis. In contrast, an existing indirect NEK2 inhibitor, INH154, did not prevent NEK2 autophosphorylation, induce NEK2 proteasomal degradation, or affect cell viability. Global proteomics and phospho-proteomics revealed that NEK2 orchestrates cell-cycle and apoptotic pathways through regulation of both known and new signaling molecules. We show the loss of NEK2 sensitized DLBCL to the chemotherapy agents doxorubicin and vincristine, and effectively suppressed tumor growth in mice. These studies establish the oncogenic activity of NEK2 in DLBCL and set the foundation for development of anti-NEK2 therapeutic strategies in this frequently refractory and relapse-prone cancer.
Keywords: cell cycle kinase, therapeutics, lymphoma
Introduction
Diffuse large B-cell lymphoma (DLBCL) is the most diagnosed and aggressive lymphoma worldwide (1). Despite achieving long-term, disease-free survival in ~60% of DLBCL patients, nearly half of patients experience refractory or relapsed disease that is often fatal (2–4). Over 10 years ago, two major DLBCL subgroups were identified based on genetic profiles of normal counterparts and presumed cell-of-origin (COO): germinal center-like (GCB) and activated B cell-like (ABC), which dichotomized patients according to outcome (1,5–8). The immunohistochemical (IHC) based Hans algorithm was developed for clinical use but can only group tumors as GCB or non-GCB due to a limited scope of markers (9). Some clinics now use a small gene expression panel, Lymph2Cx, to classify tumors more definitively into GCB and ABC subgroups (10,11). Recent genetic analyses of DLBCL proposing new molecular subtypes, up to six different subclasses, continue to reveal the complex nature of the disease and its varied clinical response (4,12,13).
The complexity of DLBCL is a major barrier to overcoming treatment failure with current immunochemotherapy (4,12–14). Understanding the factors that drive aggressive disease in patients of diverse genetic backgrounds is critical to developing treatments that combat resistance and relapse. Strong evidence links the cell cycle associated Never In Mitosis Gene A (NIMA) related Kinase 2 (NEK2) to germinal center formation and growth (15), suggesting a role in DLBCL pathology. Although the cancer-enabling activities of NEK2 are well-documented in several cancers (16–21), studies of NEK2 in DLBCL are limited.
The NEK family of serine/threonine kinases (STKs), discovered in Aspergillus, are essential for mitosis and cell cycle regulation (22). The NEK family member NIMA is crucial for mitotic entry, highlighting its potential as a target for mitotic inhibition. The closest mammalian NIMA isoform is NEK2 (23). During G2/M, NEK2 initiates centrosome separation; thus, deficiencies in NEK2 activity lead to G2/M arrest, whereas NEK2 overactivity results in bypass of the G2/M checkpoint (22,24,25). NEK2 engages in a myriad of phosphorylation events and protein-protein interactions within the intercentriolar linkage of the centrosome (26–28). Overexpression of NEK2 promotes premature chromosome separation, yielding daughter cells with frequent aneuploidy (29,30), a common feature of many cancers, particularly DLBCL (4,13). Though NEK2 expression was recently documented in DLBCL (31), it remains unclear whether NEK2 contributes to chemoresistance or if it is expressed in more aggressive DLBCL subtypes. Our previous work demonstrated that elevated NEK2 enhances AKT activity in myeloma and non-small cell lung carcinoma, and contributes to chemoresistance through NF-κB and PIM1 (21), a kinase that helps recently define a more aggressive subset of DLBCL (4). When aberrantly expressed in indolent follicular lymphoma (FL), NEK2 drives the transformation into DLBCL (32,33) and even de novo DLBCL exhibits elevated NEK2 mRNA compared to untransformed FL (33). These data implicate NEK2 in several key oncogenic pathways associated with DLBCL and suggest a role for NEK2 in more aggressive lymphomas, setting the foundation of NEK2 as a putative molecular target. However, no work thus far has investigated pharmacological NEK2 inhibition in lymphoma. In the first patient cohort of its size, we demonstrate that NEK2 expression is a predictor of poor outcome in DLBCL irrespective of COO subtype. We then developed a bifunctional inhibitor that inhibits NEK2 kinase activity and induces its proteasomal degradation. Our NEK2 inhibitor, NBI-961, shows potent anti-tumor effects by blocking cell cycle progression through G2/M and causing apoptosis, supporting an oncogenic function for NEK2 in DLBCL.
Materials and Methods
Patient Samples
A total of 76 formalin-fixed, paraffin-embedded tissues from pre-treatment DLBCL biopsies were used in this study for NEK2 immunohistochemistry (IHC) and survival analyses under a waiver of written informed consent (IRB# 227939). Transformed and HIV-associated DLBCL were excluded from the cohort. For survival analyses, all patients received the R-CHOP standard treatment regimen which consists of rituximab, cyclophosphamide, doxorubicin (DOX), vincristine (VCR), and prednisone. Overall, there were 43 male and 33 female patients with a median age of 67 years at diagnosis (range: 20 – 98 years). COO subtype was assigned by the Hans algorithm (9) as 46 GCB (59%) and 30 non-GCB (41%). A patient-derived, lymphoma primary cell suspension from a 64-year-old male, 36206, was CD20+/CD10-/CD5- lambda monotypic by flow cytometry, and CD79a+/PAX5+/BCL2+/BCL6-/MUM1-/MYC- by immunostaining consistent with malignant B cell lymphoma. The excess biopsy sample was taken from lymphoma in the scalp. The patient also presented with a sub-cranial infiltrate that extended into the dura but there was no detectable brain lesion. The primary cells, 36206, were obtained from the UAMS Tissue Biorepository and Procurement Core within a few hours of surgical removal, cultured, and bio-banked following written informed consent from patient prior to surgery (IRB# 228443). Sample 36206 was used in this study for cell-based assays to test efficacy of pharmacologic NEK2 inhibition. The use of human tissues and clinical data was approved by the University of Arkansas for Medical Sciences (UAMS) Institutional Review Board in accordance with the Declaration of Helsinki.
Cell Lines
The DLBCL cell lines were purchased from the DSMZ (U2932, (DSMZ Cat# ACC-633, RRID:CVCL_1896) RIVA, (DSMZ Cat# ACC-585, RRID:CVCL_1885)) or the American Type Culture Collection (ATCC; HT, (ATCC Cat# CRL-2260, RRID:CVCL_1290), SUDHL4 (ATCC Cat# CRL-2957, RRID:CVCL_0539), SUDHL5 (ATCC Cat# CRL-2958, RRID:CVCL_1735), SUDHL6, (ATCC Cat # CRL-2959, RRID:CVCL_2206)) except for HBL1 and VAL, which were previously obtained from Dr. Rimsza (Mayo Clinic in Arizona, Scottsdale). The GM22761 (RRID: CVCL_1P76) and GM16113 (RRID: CVCL_7646) EBV-immortalized, benign peripheral B cells were obtained from the Coriell Institute. All cells were cultured at 37 °C, 5% CO2 in 10% fetal bovine serum (FBS), 1% penicillin/streptomycin-supplemented RPMI 1640 media. Cell lines were tested for mycoplasma every 6 months and authenticated by the University of Arizona Genetics Core (Tucson, AZ) using the PowerPlex® 16 System (Promega), which consists of a forensic-style 15 autosomal STR loci, including 13 CODIS DNA markers (nine of the standard loci collected by ATCC and DSMZ), Amelogenin, and a mouse-specific locus every 10–12 months (Supplementary Table S1).
Compounds
NBI-961 (formerly CMP3a) was synthesized as previously described (34) and is outlined in Scheme 1 (Supplementary Fig. S1). Briefly, methyl thioglycolate (1) was cyclized with ethyl propiolate (2) in methanol in the presence of sodium methoxide to afford methyl 3-hydroxythiophene-2-carboxylate (3). A Mitsunobu reaction in dry DCM between thiophene core (3) and trifluoromethyl phenyl ethanol (4) in presence of triphenyl phosphine (PPh3) and diisopropyl azodicarboxylate (DIAD) yielded compound (5). Boronic acid derivative (7) was generated via a Miyaura borylation reaction in dry THF in the presence of lithium diisopropylamide (LDA), which was used in next step without further purification. A Suzuki coupling reaction between boronic acid derivative (7) and imidazo[1,2-a]pyridine (8) generated compound 9. Then, compound 9 was heated in methanol with ammonia and ammonium hydroxide to convert ester to an amide (compound 10). The amide compound was then subjected to Suzuki coupling to afford compound NBI-961. 1H NMR (400 MHz, dmso) δ 8.41 (d, J = 7.2 Hz, 1H), 8.13 (s, 1H), 7.90 (s, 2H), 7.78 (d, J = 7.6 Hz, 4H), 7.55 (t, J = 7.7 Hz, 1H), 7.33 (d, J = 7.2 Hz, 1H), 7.15 (s, 1H), 7.09 (s, 1H), 6.02 (d, J = 6.7 Hz, 1H), 4.24 (t, J = 6.5 Hz, 2H), 2.73 (s, 2H), 2.21 (s, 6H), 2.09 (s, 1H), 1.76 (d, J = 6.1 Hz, 3H), m/z (ESI) calculated for C28H27F3N6O2S [M+H]+: 567.19, found: 567.4. The purity of NBI-961 was 96% as determined by HPLC (Supplementary Fig. S2). INH154, the structure of which was previously described (35), was purchased from MedChemExpress (catalog no. HY-117154). Doxorubicin and vincristine were purchased from Cayman Chemical Company (item numbers 15007 and 11764). Sorafenib was purchased from LC Laboratories (Lot No: SFB-104). For in vitro experiments, the compounds were dissolved in dimethyl sulfoxide (DMSO). DMSO was used as the vehicle treatment control (VTC).
IHC Staining and Evaluation
Paraffin slides were prepared from blocks of formalin-fixed paraffin-embedded DLBCL tissues cut at 4 μm and stained using a VENTANA BenchMark XT instrument. The primary NEK2 antibody (Santa Cruz Biotechnology Cat# sc-55601, RRID:AB_1126558) was used at 1:50 dilution. The NEK2 antibody was used as supplied and incubated for 32 minutes at 37 °C. Protein was detected with an OptiView DAB Detection Kit (760–700, VMSI). All slides were counterstained with hematoxylin for 4 minutes. Reactivity was considered in DLBCL cells with moderate to strong DAB brown staining for NEK2 in 5% increments. Two observers, S.K. and V.P., independently evaluated the stained whole tissue sections for NEK2 expression. A third observer, G.P., resolved the discrepant cases (34%, 26/76). Discrepant scoring was defined as ≥ 20% difference in reactivity between the two observers. Both V.P. and G.P. are formally trained hematopathologists. Discrepancies in scoring were due to the intratumor varied intensity (light to strong) of staining of DLBCL cells that frequently occurred within tumors. DLBCL were then dichotomized into low or high NEK2 expression groups based on whether the tumor was below or ≥ median reactivity, which was 80% cells staining positive.
Western Blot Analysis
Cells were harvested by centrifugation, washed three times with cold PBS, and lysed on ice with RIPA buffer (Boston BioProducts) and 1x HALT protease/phosphatase inhibitor (ThermoFisher) for 30 minutes. Lysates were centrifuged at 4 °C for 10 minutes at 14,000 rpm, collected and total protein concentration was quantified using a BCA assay according to manufacturer recommendations (Pierce). For each lysate, 100 μg of total protein was heated at 95 °C for 10 minutes with 2X Laemmli loading buffer (BioRad) supplemented with 5% β-mercaptoethanol. Lysates were resolved by SDS-PAGE at 220 V and transferred onto PVDF membranes. Membranes were blocked for 1 hour at room temperature in 5% non-fat milk in PBS, rinsed with PBS, and incubated overnight at 4 °C with primary antibody diluted with PBST. Membranes were then washed one time for 15 minutes followed by two, 10-minute washes in PBST while rocking at RT. Membranes were incubated with secondary antibody diluted with 1% non-fat milk in PBST for 1 hour while rocking at RT and rinsed three times with PBST. Primary antibodies used were anti-NEK2 (Santa Cruz Biotechnology Cat# sc-55601, RRID:AB_1126558) anti-AKT (Cell Signaling Technology Cat# 9272, RRID:AB_329827), anti-phospho (Ser473) AKT (Proteintech Cat# 66444-1-Ig, RRID:AB_2782958), anti-TBP (Abcam Cat# ab818, RRID:AB_306337), and anti-ACTIN (Thermo Fisher Scientific Cat# PA1-183, RRID:AB_2539914). Secondary antibodies used were from Fisher Scientific: Goat anti-Rabbit IgG Dylight 800 (Thermo Fisher Scientific Cat# SA5-35571, RRID:AB_2556775) and Goat anti-Mouse Dylight 650 (Thermo Fisher Scientific Cat# SA5-10034, RRID:AB_2556614). The Precision Plus Protein Standard All Blue (BioRad) was used as the molecular weight ladder. Membranes were imaged and converted to grayscale using the BioRad ChemiDoc MP, except for the western blot image of basal NEK2 levels in untreated cell lines, which required level adjustment using Creative Cloud Adobe Photoshop (from default input shadows, midtones, and highlights levels 0, 1.00, 255 to 0, 0.31, 255). Images were cropped and rotated as necessary using Creative Cloud Adobe Illustrator. Uncropped and unadjusted images of each membrane are provided in the Supplementary Data (Supplementary Figs. S3–S6).
Total and Phospho-Proteomics
RIVA, VAL, and SUDHL5 cell lines were treated with vehicle (0.1% DMSO) or NBI-961 and incubated for 96 hours at 37° C and 5% CO2. Concentrations of NBI-961 were 240 nM for VAL, 80 nM for SUDHL5, and 25 nM for RIVA, based on their different sensitivity and calculated GI50. Samples were collected, reduced, and digested using filter-aided sample preparation (36). Tryptic peptides were labeled using tandem mass tagging, enriched for phosphopeptides, and submitted for mass spectrometric analysis on the Orbitrap Fusion Lumos and Eclipse Tribrid systems as described previously (37). To generate the heatmaps and volcano plots, MaxQuant (version 1.6.5.0, Max Planck Institute) result files from searching the UniprotKB Homo sapiens database (April 2019 for VAL and SUDHL5; October 2019 for RIVA) were analyzed using ProteoViz as described previously (37).
Cytotoxicity and Chemosensitization Studies
The percent cell viability of the cell lines was determined by the 3-(4,5-dimethylthiazol-2-yl)-5-(3-carboxymethoxyphenyl)-2-(4-sulfophenyl)-2H-tetrazolium (MTS) colorimetric assay as per the manufacturer’s protocol (Promega). Cells were seeded at a density of 20,000 cells per well and incubated with doxorubicin (DOX), vincristine (VCR), NBI-961, or sorafenib at 37 °C and 5% CO2 for 96 hours at a 2-fold serial dilution of 11 concentrations across a range of 0.001 – 40 μM depending on the cell type. For the chemosensitization studies, cells were co-treated with NBI-961 and the chemotherapeutic drug DOX or VCR. The GI50 values with the corresponding 95% confidence intervals (C.I.) were calculated after performing the comparison of fits for nonlinear regression models: normalized response-variable slope, variable slope with four parameters, and variable slope with three parameters using GraphPad Prism software version 9. The best-fit regression model and predicted GI50 was selected based off the sum-of-squares F Test. The therapeutic window was calculated based on the ratio between the minimum effective concentration (MEC) and the minimum toxic concentration (MTC): Therapeutic window = MTC/MEC.
For the NBI-961 versus INH154 experiments, trypan blue exclusion was used to assess the number of live cells. Percent live cells was calculated in reference to the total number of cells counted by the BioRad TC20 automated cell counter.
Cell Cycle and Apoptosis Analyses by Flow Cytometry
Cells were seeded at a density of 250,000 cells/mL and treated with vehicle (0.01% DMSO) or the indicated concentrations of NBI-961. For cell cycle experiments, cells were harvested by centrifugation at the indicated time points and fixed for 2 – 4 hours at 4° C by resuspension in ice cold 70% ethanol. Cells were harvested by centrifugation and stained by resuspension in 0.75 mL propidium iodide (PI) solution (25 μg/mL PI, 20 μg/mL RNase, and 0.1% BSA in PBS) for 30 minutes at room temperature. The area under the first peak for PI (~50,000 arbitrary units (AU)) staining was gated as G1, with the second peak (~100,000 AU) gated as G2/M. The area between peaks was gated as S phase, with cells below the first PI peak gated as sub G1. For apoptosis experiments, cells were harvested by centrifugation and washed with PBS. Cells were resuspended in 100 μL apoptosis staining solution (1 μg/mL PI, 2.5 μL Alexa Fluor 488 Annexin V, annexin-binding buffer (Thermo) to 100 μL) and stained for 15 minutes at room temperature. Then, 400 μL annexin binding buffer was added to all samples, which were then transferred to ice and immediately analyzed. Cells staining positive for Annexin V were gated as early apoptotic, while cells staining double positive for Annexin V and PI were gated as late apoptotic and double negative cells gated as viable. For all flow cytometry experiments, cells were analyzed on the LSRFortessa (BD Biosciences), and doublets identified by plotting side scatter height over side scatter area were excluded from analysis.
Mouse Handling
Humanized NSG-TG(Hu-IL6), abbreviated as NSG-IL6, mice were housed and bred at the UAMS Animal Facility. They were created in Dr. Shultz’s lab by microinjection of a BAC clone (GRCh37/hg19 chromosome7 22,724,723–22,964,038; BAC1) carrying a piece of chromosome 7 with the human IL-6 gene and was microinjected into NSG mice (RRID: IMSR_JAX:005557) fertilized embryos. Mice were kept on a 12-hour light/12-hour dark cycle. Room temperature was maintained at 24 – 26 ˚C. Food pellets and water were sterilized and provided ad libitum.
DLBCL in vivo Mouse Studies
The U2932 DLBCL cell line was transfected with the luciferase gene (Lenti-UBC-RedFluc-T2A-EGFP) by using TransDux MAX Lentivirus Transduction Enhancer (System Biosciences; catalog no: LV860A-1) according to the manufacturer’s protocol and maintained at 37 °C, 5% CO2 in 15% FBS, 1X penicillin/streptomycin, 1X Glutamax-supplemented RPMI 1640 media. Luciferase-expressing U2932 cells were washed with PBS three times and counted by Cellometer Mini (Nexcelom) using the trypan blue exclusion method. At 8 – 10 weeks of age, humanized NSG-IL6 mice, randomized for sex and cage mates, were injected via the tail vein with 0.5 × 10⁶ U2932 cells (>90% viability) suspended in 100 μL PBS. U2932 cell engraftment was confirmed by early second week bioluminescence imaging after 10 min of D-luciferin (1.5 mg/mouse, Perkin Elmer) intraperitoneal injection using an IVIS Imaging System 200 Series (Perkin Elmer). After 10 days of U2932 cell transplantation, mice were randomized for sex, cage mate, and bioluminescence, and NBI-961 was administered via intraperitoneal injection at 5 mg/kg in PBS (n = 6) or PBS alone (n = 5) once a day. Mice were followed for 8-weeks post-treatment by weekly bioluminescence imaging and evaluating for morbidity (hair tufting, significant reductions of activity and swollen body). This mouse study was approved by the UAMS IACUC (AUP #3987) and were conducted as per the National Institutes of Health (NIH) Guide for the Care and Use of Laboratory Animals.
Statistical Analysis
Statistical analyses were performed with GraphPad Prism software version 9. Significance was set at P < 0.05 or adjusted P < 0.05. Data are represented as mean ± standard error of the mean (SEM) from at least three independent experiments unless otherwise indicated. Patient survival was evaluated using Kaplan-Meier curves and the log-rank test. NEK2 was assessed as a covariate with COO subtype using the Cox proportional hazard model. The two-tailed Fisher’s exact test was used to compare patient characteristics from NEK2-low and NEK2-high protein expression groups. Data collected and compared at a single timepoint were evaluated using a one-way ANOVA with the Dunnett’s test for multiple comparisons except for the comparison between SUDHL5 lysate not treated or treated with phosphatase, which was evaluated using an unpaired two-tailed t test. Data collected and compared at multiple timepoints were evaluated using a two-way ANOVA with the Tukey’s test for multiple comparisons. Cell viability comparisons between NBI-961 and INH154 treatments were evaluated using the area under the Receiver-operating characteristic (ROC) curve.
Data Availability
The proteomics data generated and R scripts utilized in this study are publicly available at https://github.com/ByrumLab/ProteoViz or via ProteomeXchange with the identifier PXD015606. All raw mass spectrometry data from the proteomic studies are available at ftp://massive.ucsd.edu/MSV000092686/
All other data generated are available upon request from the corresponding authors.
Results
NEK2 is highly expressed in a subset of DLBCL tissues and high expression levels correlate with poor patient outcome
NEK2 is gaining recognition as an oncogenic player in solid tumors, which prompted us to investigate NEK2 expression in de novo DLBCL. First, we re-analyzed DLBCL patient RNASeq data from the NCI Center for Cancer Research (NCICCR) (38), and found patients with NEK2 mRNA abundance at or above the cohort median tend to have worse overall survival (Fig. 1A). We then performed IHC staining for NEK2 within tumor tissue from our in-house DLBCL patient biopsies (Fig. 1B) to determine NEK2 protein levels. Most DLBCL tumors frequently expressed NEK2 protein with 62% of the cases (47/76) having at least 80% of DLBCL cells staining positive for NEK2 and an overall range of 20 – 100% malignant cells staining positive in all 76 cases (Fig. 1C). When NEK2 was expressed in 80% or more of the malignant cells (NEK2-high), patients had significantly inferior outcomes (Fig. 1D). To rule out the possibility that NEK2 may be expressed predominantly in the more aggressive COO subtype, we performed analysis of covariance and found that NEK2 protein remained a significant indicator of patient survival when considered as a covariate with the known prognostic indicator of the non-GCB subtype (9) (Supplementary Table S2 and Fig. S7A). While patient sex did not differ between NEK2-low and NEK2-high protein DLBCL tumors, patients were slightly older in the NEK2-high group although not significantly (Supplementary Table S3). Positivity of NEK2 protein did not correlate with age (Supplementary Fig. S7B), and thus age likely does not contribute to the inferior survival of the patients with NEK2-high tumors. Recognizing the better outcomes associated with GCB DLBCL, we examined whether NEK2 protein differed among subtypes. However, there was no difference in subtype distribution between the NEK2-low and NEK2-high tumors (Supplementary Table S3). Furthermore, there was no difference in NEK2 protein between the two subgroups (Supplementary Fig. S7C). Of note, our cohort displayed the expected trend towards the non-GCB COO subtype conferring poor survival (Supplementary Fig. S7D). However, low sample size and any misclassification from using the Hans algorithm (9,10) likely account for not reaching statistical significance. Overall, the separation of survival based on NEK2 mRNA and protein expression suggests NEK2 may contribute to aggressive disease in DLBCL.
Figure 1. High NEK2 expression occurs in a majority of DLBCL tumors and predicts poor patient outcome.
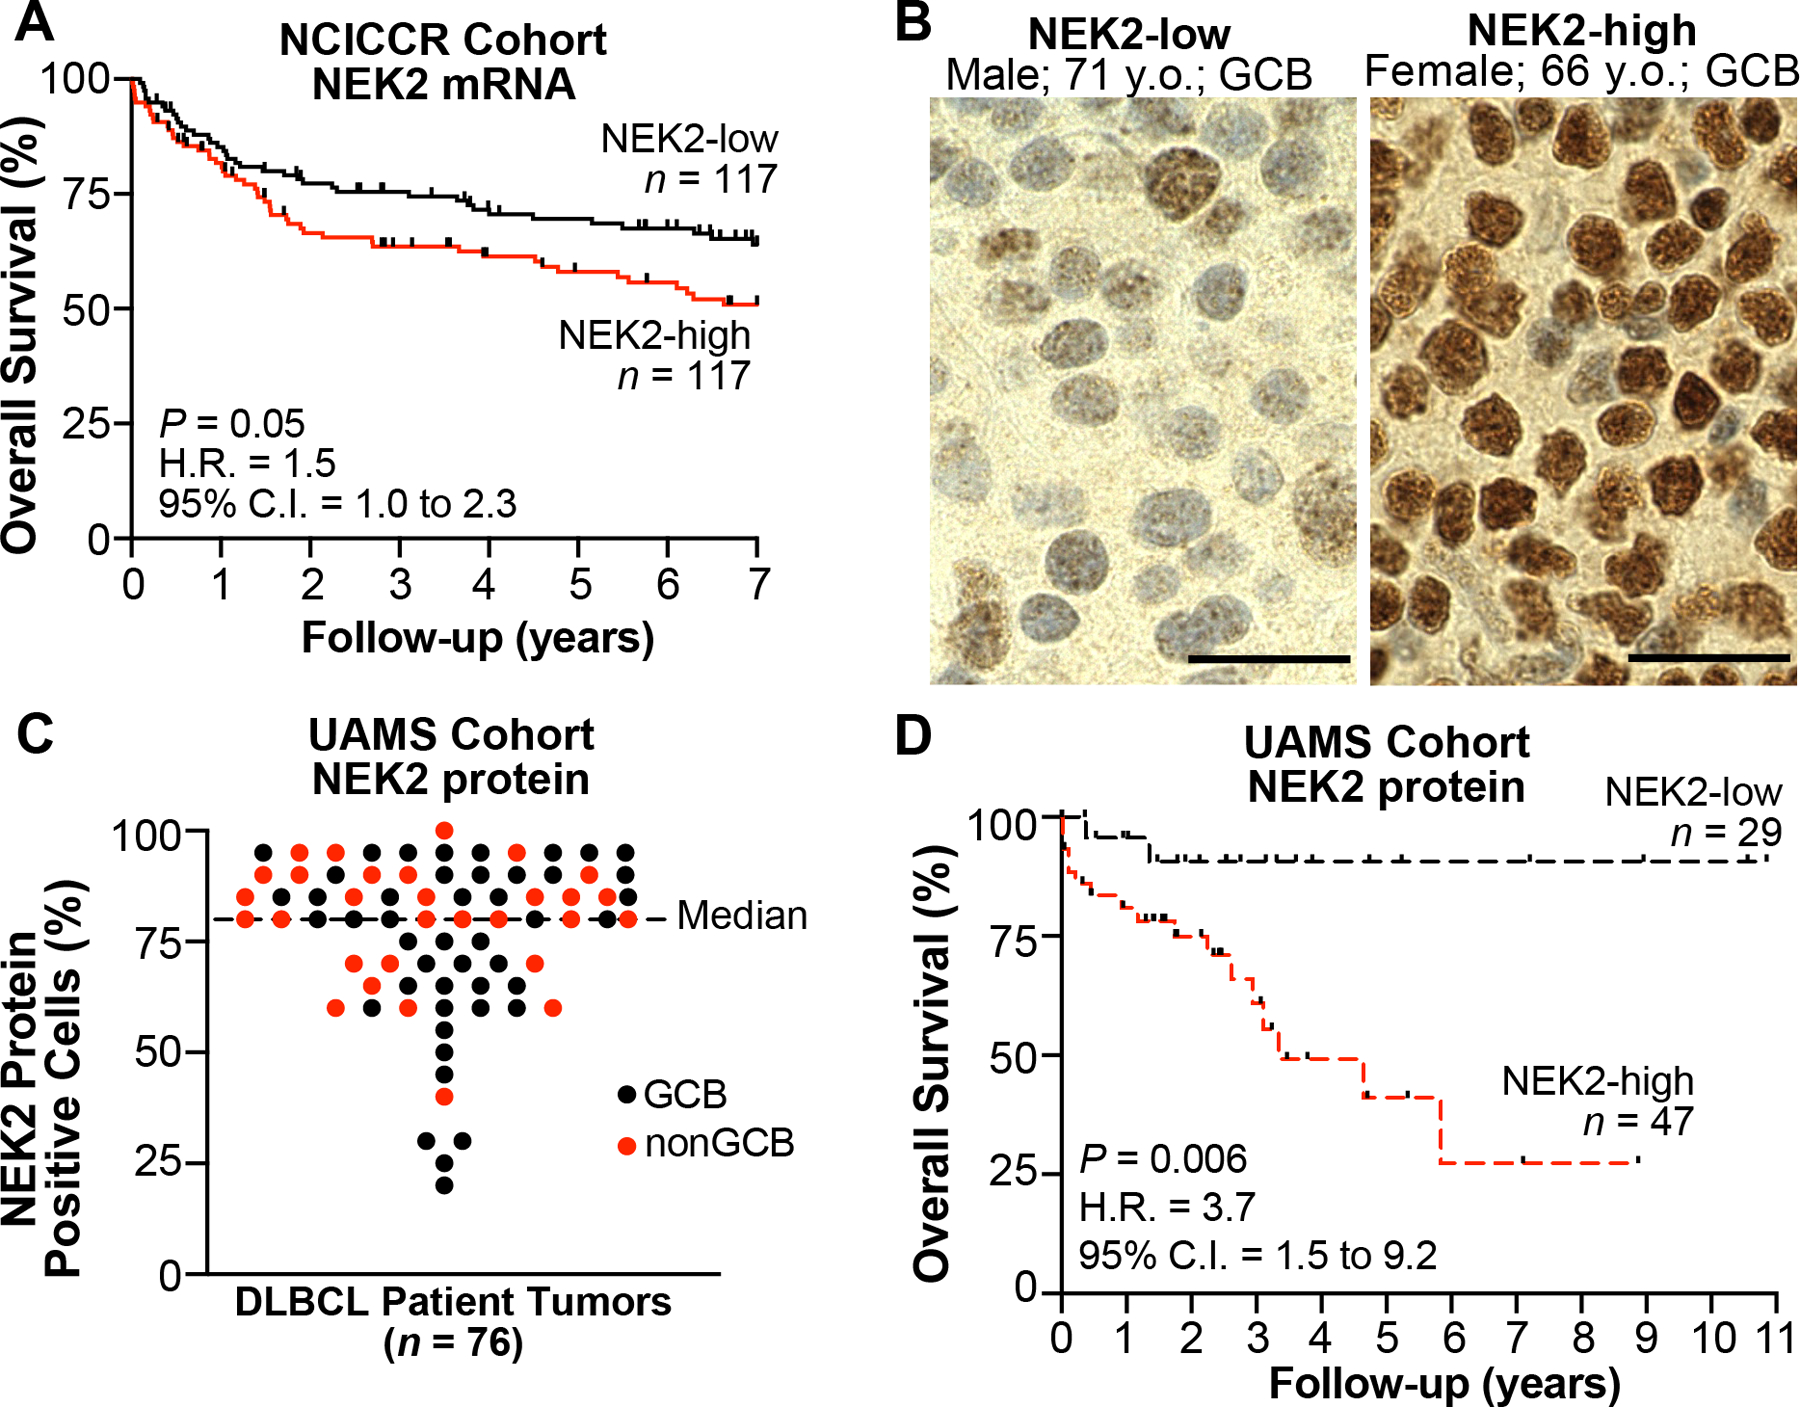
A, Kaplan-Meier overall survival (OS) curves for patients with DLBCL according to NEK2 mRNA expression from NCICCR data set (n = 234); log-rank test. B, Representative IHC images from DLBCL tumors expressing NEK2 below the median percent of positive DLBCL cells (NEK2-low) or ≥ median (NEK-high) in UAMS cohort (n = 76). Scale bar, 20 μm. C, Scatter plot of the percent positive DLBCL cells in each tumor from NEK2 staining by IHC in UAMS cohort (n = 76). D, Kaplan-Meier OS curves for patients with DLBCL according to NEK2 protein expression from UAMS cohort (n = 76); log-rank test. H.R., hazard ratio.
NEK2 promotes DLBCL cell viability by inducing G2/M cell cycle progression and preventing apoptosis
To investigate the cellular role of NEK2 in DLBCL, we utilized our recently developed NEK2 inhibitor, NBI-961 (aka CMP3a) (34); (Fig. 2A). NBI-961 binds to the active protein kinase conformation (Fig. 2B) and efficiently inhibits NEK2 catalytic activity (34). NBI-961 exhibits high binding affinity for NEK2 relative to >90 other kinases (scanEDGE® kinome panel, Eurofins DiscoverX; Fig. 2C; Supplementary Table S4). NBI-961 at 300 nM displaced 98.2% of bound NEK2 and a few other kinases to a lesser extent. At 15 nM, off-target effects were abolished, except for the Fms Related Receptor Tyrosine Kinase 3 (FLT3). However, we previously observed NBI-961 catalytic inhibition of FLT3 at a less than ten-fold potency compared to NEK2 inhibition (34).
Figure 2. NEK2 inhibitor NBI-961 lowers DLBCL cell viability.
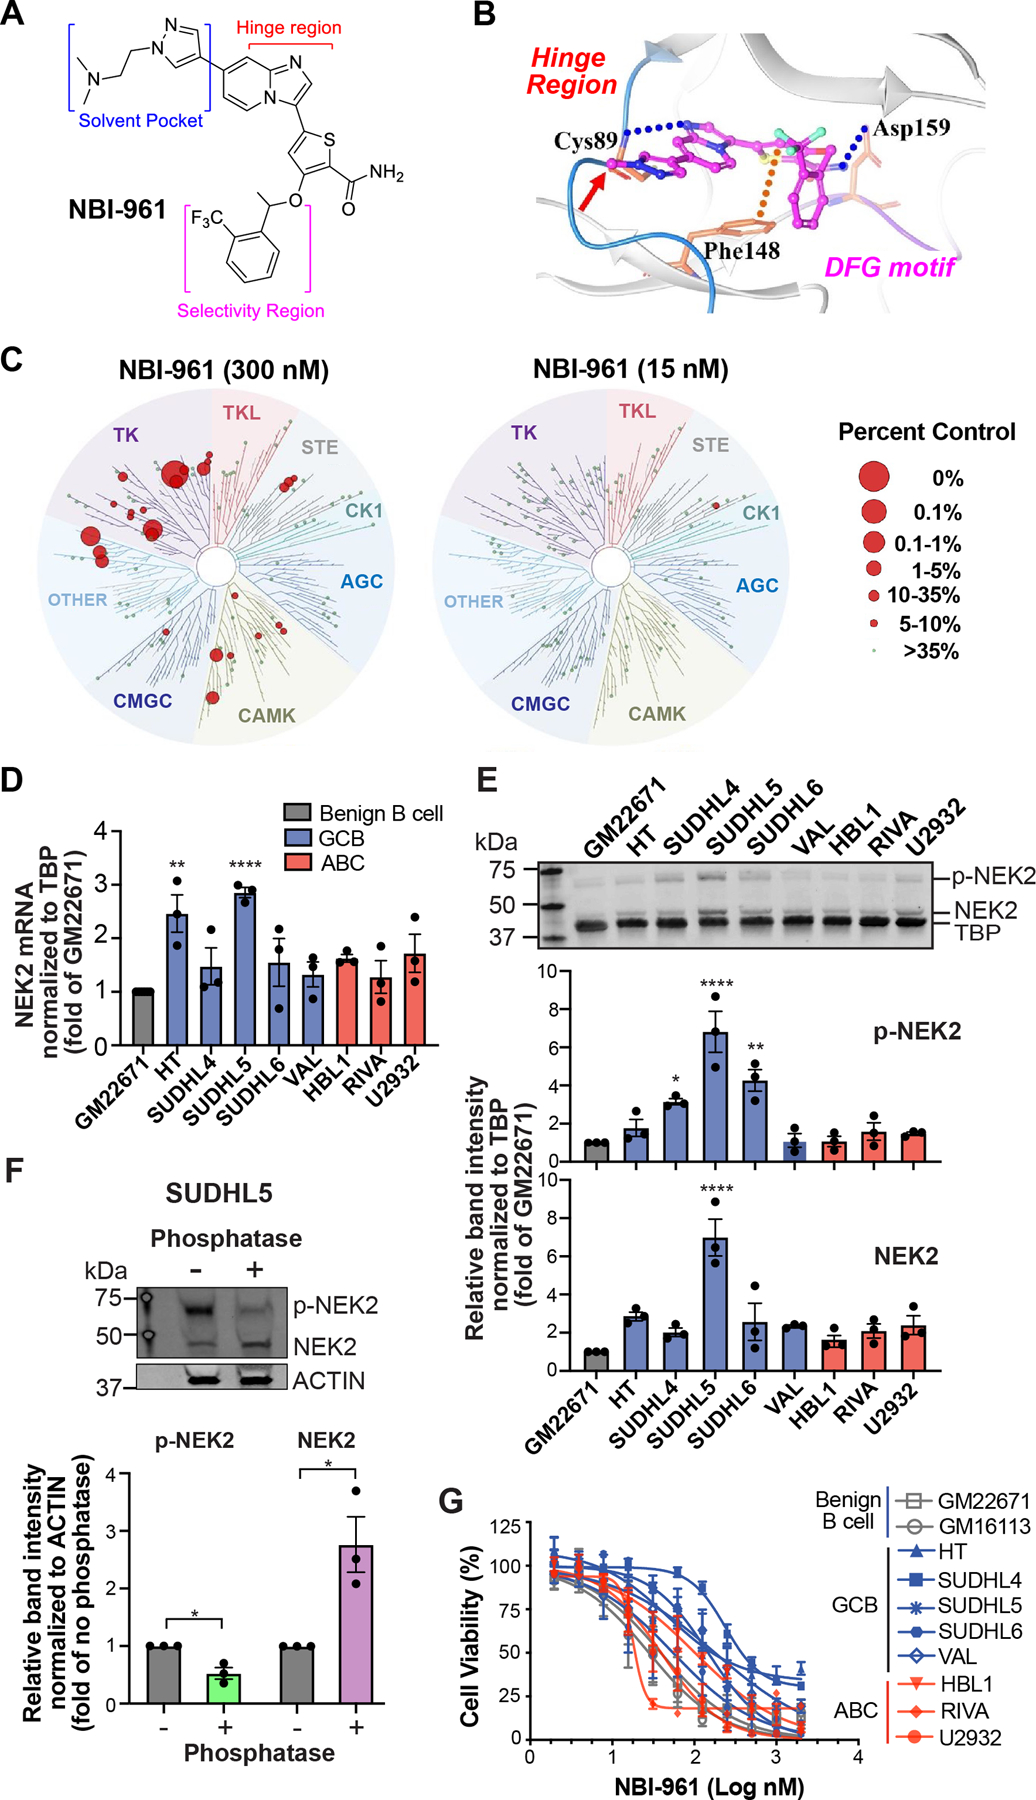
A, Chemical structure of NBI-961. B, Computational modeling shows NBI-961 in the NEK2 active site with the pyrazole oriented towards the solvent (red arrow), the imidazopyridine ring system interacting with the hinge region important for hydrogen bond formation with ATP and the trifluoromethyl phenyl substituent interfacing at the lipophilic roof of the pocket. C, Dendrograms of a 97-kinase panel tested for NBI-961 binding affinity at 300 nM and 15 nM as a percent displacement of control compound from a given kinase. D, Bar graph of NEK2 mRNA abundance in untreated cell lines normalized to TBP. E, Western blot analysis of NEK2 protein expression in untreated cell lines which also detects phosphorylated NEK2 (p-NEK2). Quantification of band intensity normalized to TBP. D and E, Adjusted P-values were determined by a one-way ANOVA with Dunnett’s multiple test correction for comparisons to GM22671. F, Western blot analysis of NEK2 protein expression in untreated SUDHL5 cell lysates incubated without or with phosphatase. Quantification of band intensity normalized to ACTIN. P-values were determined by a two-tailed unpaired t test for comparisons to the respective no phosphatase control. G, Cell viability curves after 96 h NBI-961 treatment. D-G, Data are shown as mean ± SEM from three independent experiments. *P < 0.05; **P < 0.01; ****P < 0.0001.
We then determined basal expression of NEK2 in a panel of established cells representing the molecular subtypes of DLBCL and two benign B cell lines. At the mRNA level, the GCB cell lines SUDHL5 and HT display the highest NEK2 abundance compared to the benign B cell line (Fig. 2D). However, this high expression persisted at the protein level only for SUDHL5 (Fig. 2E). We also observed a distinct upshifted band, especially in SUDHL5 lysates (Fig. 2E). Phosphatase significantly reduced the intensity of this band with a corresponding increase in total NEK2 (Fig. 2F) indicating the upshifted band represents phosphorylated NEK2. Next, we tested how NEK2 inhibition with NBI-961 affects DLBCL cell viability. Overall, NBI-961 achieved growth inhibitory concentrations (GI50) in the nanomolar range particularly in ABC derived cells (Fig. 2G; Supplementary Table S5).
To identify the cause of compromised cell viability, we performed cell cycle and apoptosis analyses in a subset of the NBI-961 sensitive (SUDHL5 and RIVA) and less sensitive (VAL) DLBCL cell lines as well as the GM22671 benign B cells. Consistent with the established role of NEK2 coordinating progression through G2/M (22) we observed a stark G2/M arrest in SUDHL5 and RIVA, and to a lesser extent in VAL cells (Fig. 3A). The G2/M stalling occurred as early as 24 h NBI-961 treatment, and for RIVA and VAL, the G2/M arrest persisted through 48 h. There was no detectable G2/M arrest in the benign GM22671 cells. For SUDHL5 and RIVA, the G2/M arrest at 24 h coincided with significant apoptotic death that steadily increased over the 96 h (Fig. 3B). In contrast, NBI-961 did not trigger apoptosis in VAL cells until 48 h, and as with the G2/M arrest, this effect occurred at 3- or 9.6-fold higher NBI-961 concentrations compared to SUDHL5 and RIVA. Similarly, NBI-961 induced apoptosis in GM22671 cells at 48 h and required a ~3-fold higher concentration of NBI-961 relative to RIVA. As a positive control, a high concentration of DOX alone was capable of inducing apoptosis in all four cell lines (Supplementary Fig. S8).
Figure 3. Inhibition of NEK2 induces G2/M cell cycle arrest and apoptosis in DLBCL cells.
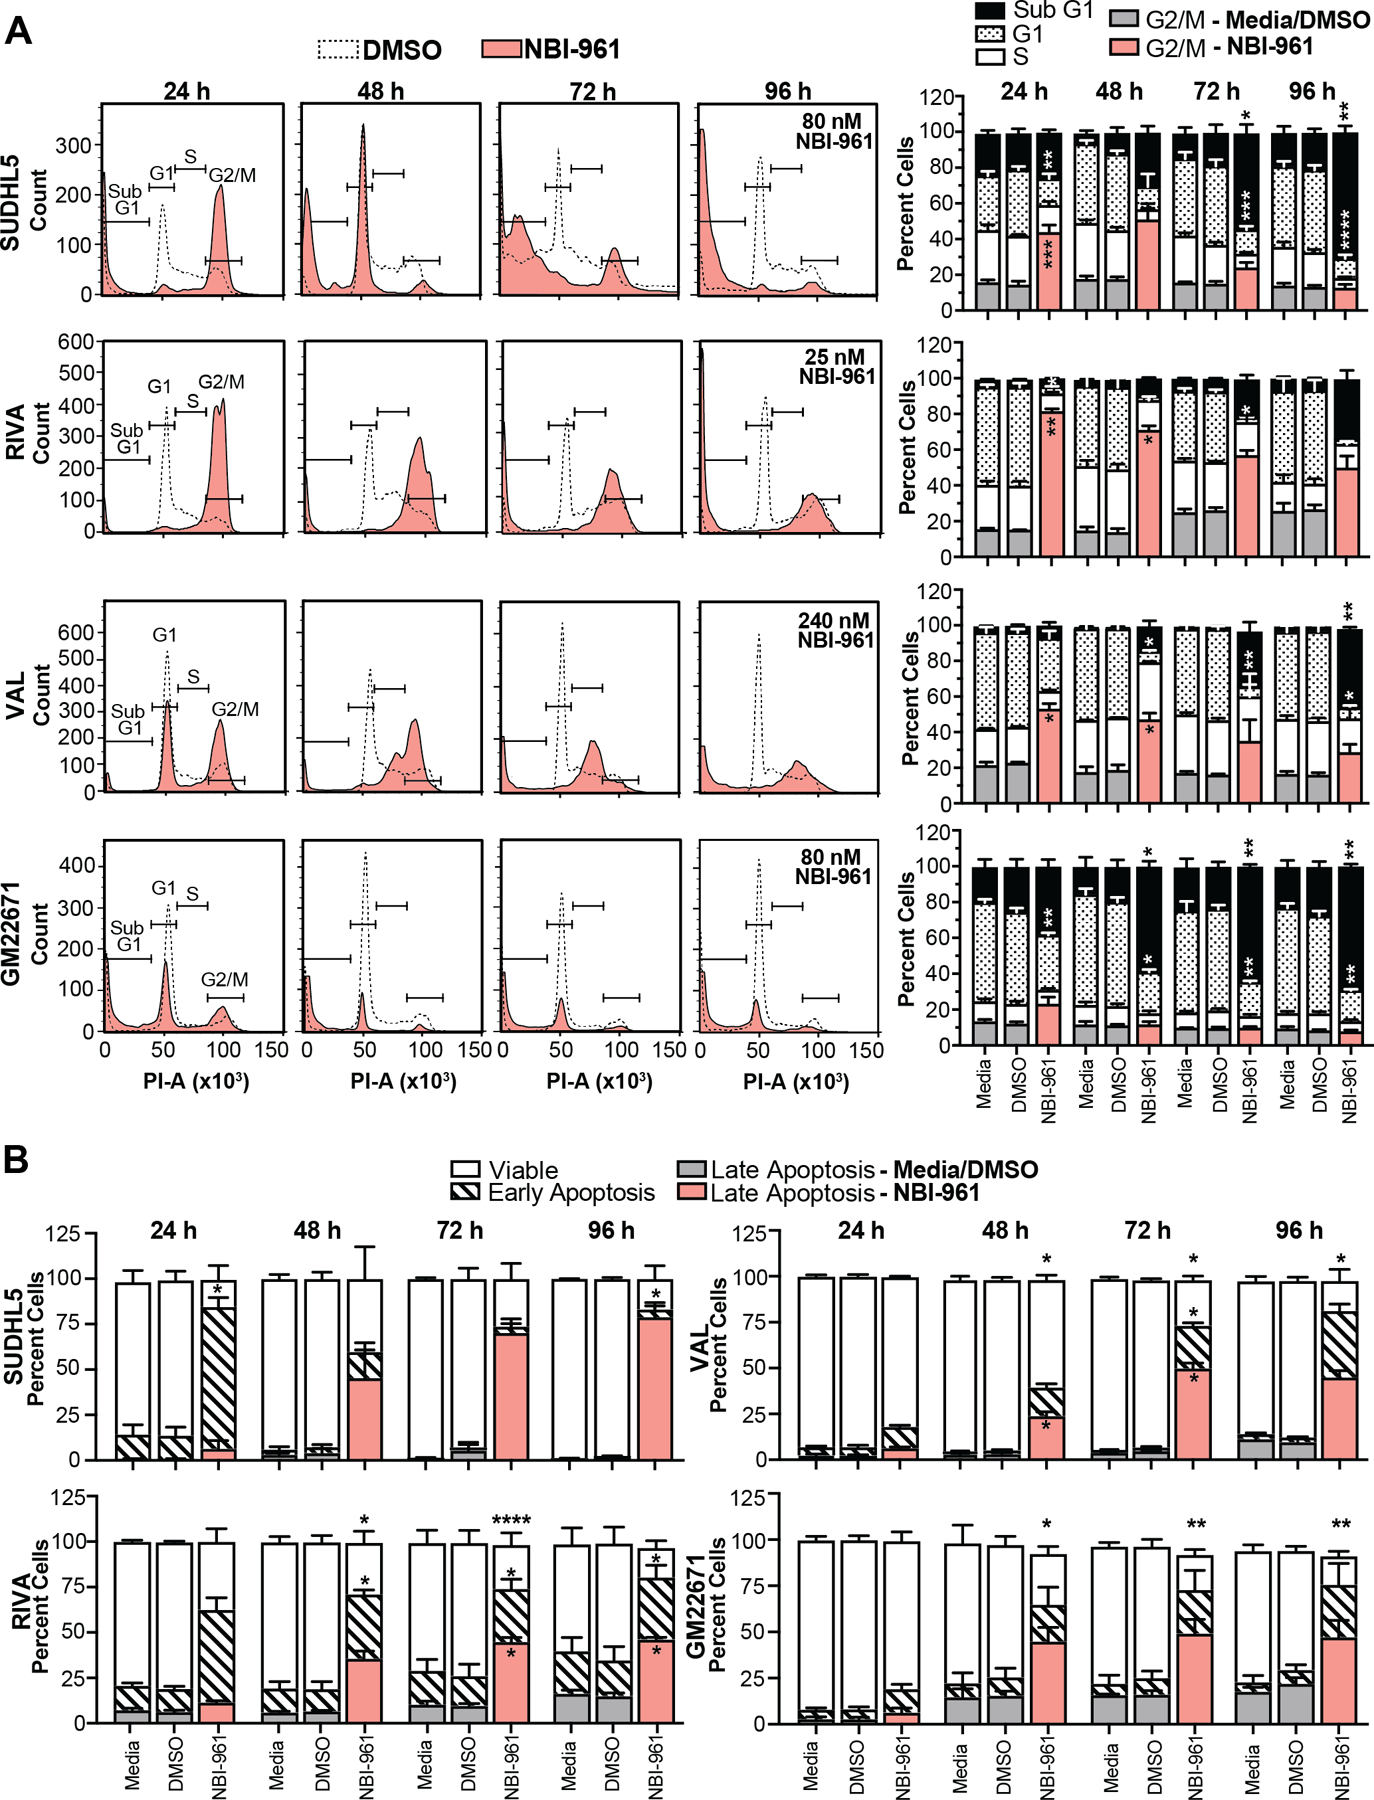
A Representative cell cycle distribution flow cytometry histograms of cell lines untreated or treated with DMSO or NBI-961. Quantification of percent cells in each cell cycle phase is shown as a stacked bar graph to the right. B, Stacked bar graph of cell lines untreated or treated with DMSO or NBI-961 shows percent viable cells and cells in early or late apoptosis. Data are shown as mean ± SEM from three independent experiments. Adjusted P-values as determined by a two-way ANOVA analysis with Tukey’s multiple test correction for comparisons to DMSO treated control. *P < 0.05, **P < 0.01, ***P < 0.001, ****P < 0.0001
NBI-961 leads to proteasomal degradation of NEK2 and is more effective than the indirect INH154 NEK2 inhibitor in both DLBCL cell lines and patient derived cells
Given the efficacy of NBI-961, we sought to determine the mechanism by which it inhibits NEK2 and compare its effects to the commercially available NEK2 inhibitor, INH154. Since NEK2 undergoes autophosphorylation (25), we used NEK2 phosphorylation as direct readout for NEK2 catalytic inhibition. After 24 h treatment with NBI-961 at low nanomolar levels, we observed a more pronounced decrease in phosphorylated NEK2 (p-NEK2) in SUDHL5 cells compared to the less sensitive VAL cell line (Fig. 4A and B). Unexpectedly, we found not only reduction in p-NEK2 but also total NEK2 protein (Fig. 4A and B) suggesting that NBI-961 can promote NEK2 proteasomal degradation. Consistent with this notion, the proteasome inhibitor bortezomib blocked NBI-961-induced loss of NEK2 without negating the loss of p-NEK2 (Fig. 4C). mRNA abundance remained constant with NBI-961, confirming loss of NEK2 occurred at the protein level (Fig. 4D). These data demonstrate a bifunctional mechanism of action for NBI-961 in which NEK2 is both catalytically inhibited (loss of p-NEK2) and degraded by the proteasome (loss of total NEK2). The loss of NEK2 and p-NEK2 was also observed in RIVA and another NBI-961 sensitive ABC-DLBCL cell line, U2932 (Supplementary Fig. S9).
Figure 4. NBI-961 causes NEK2 proteasomal degradation and is more potent than INH154 in both DLBCL cell line and patient derived cells.
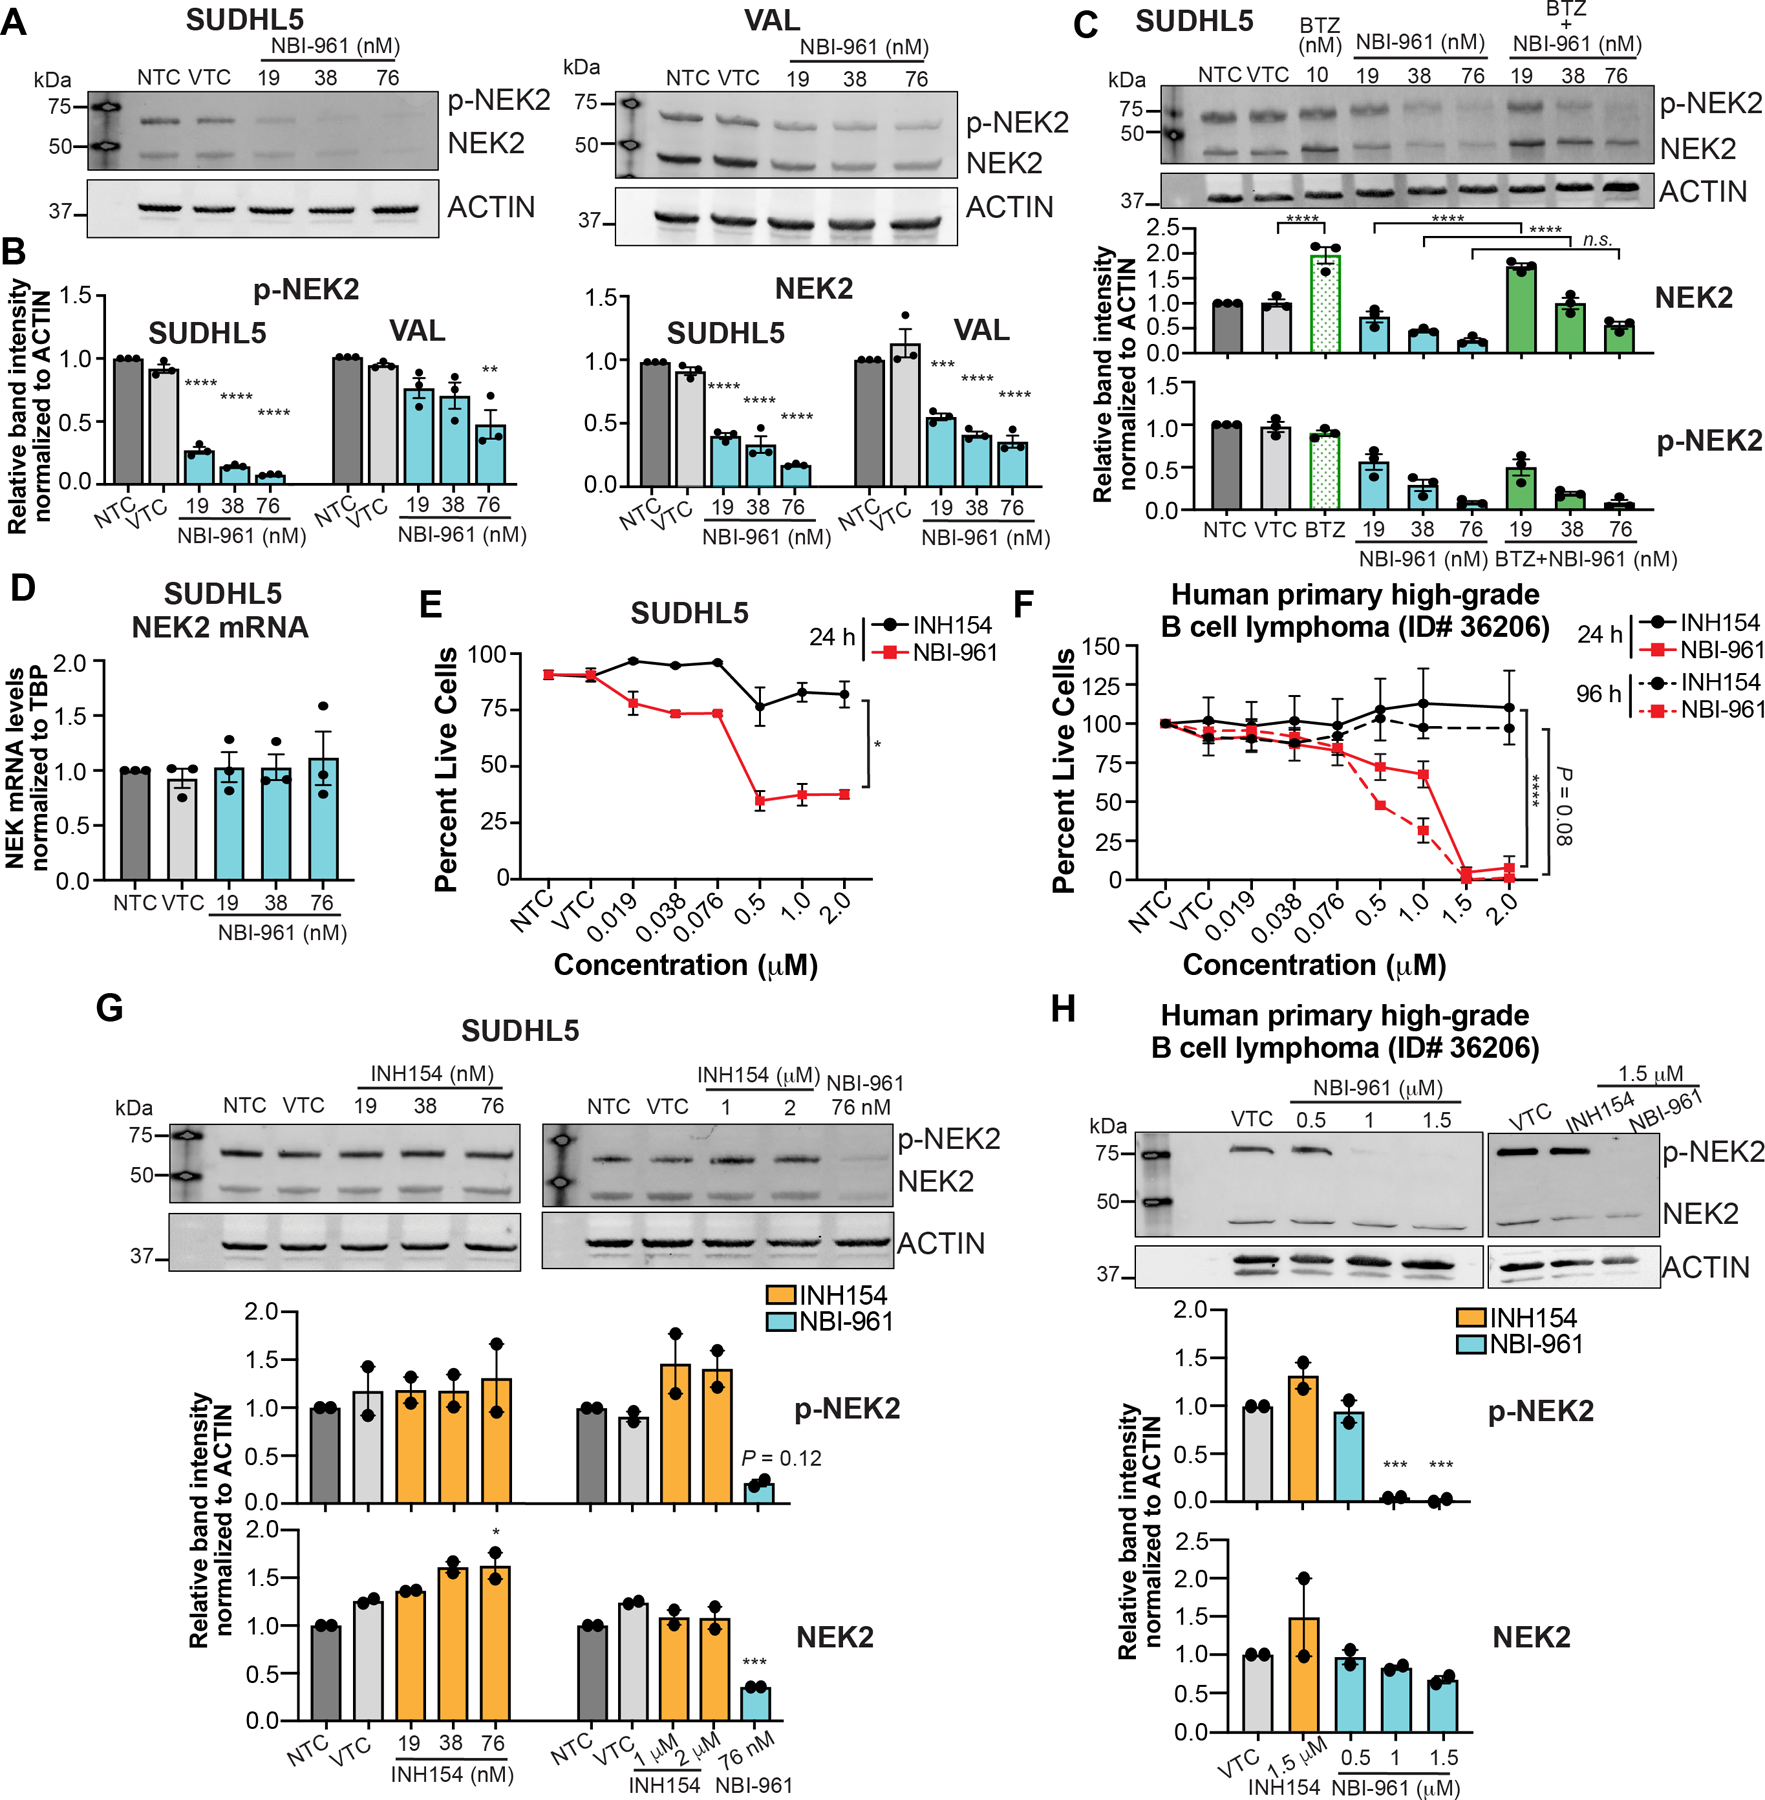
A, B, Western blot analysis of NEK2 and phosphorylated NEK2 (p-NEK2) protein expression in NBI-961 treated SUDHL5 (A) and VAL (B) cell lines after 24 h. C, Western blot analysis of NEK2 and p-NEK2 protein expression in NBI-961 treated SUDHL5 co-treated with bortezomib (BTZ). D, Bar graph showing real-time qPCR data of NEK2 mRNA in NBI-961 treated SUDHL5 cell lines after 24 h. E, F, Cell viability curves after 24 or 96 h treatment of INH154 or NBI-961 in SUDHL5 cell line (E) and primary cells from a patient with a high-grade B cell lymphoma (F). P-values as determined by area under the ROC. G, H, Western blot analysis of NEK2 and p-NEK2 protein expression in INH154 treated SUDHL5 cell line (G) and primary cells from a patient with a high-grade B cell lymphoma (H) after 24 h. Treatment with NBI-961 at 76 nM served as a positive control. A-C, G, H, Quantification of band intensity normalized to ACTIN as mean ± SEM from three (A-C) or two (G, H) independent experiments shown as a bar graph below each blot. Adjusted P-values as determined by a one-way ANOVA with Dunnett’s multiple test correction for comparisons to DMSO vehicle treated control (VTC). *P < 0.05, **P < 0.01, ***P < 0.001, ****P < 0.0001; n.s, not significant
We then compared the effects of NBI-961 on cell survival to INH154, a previously identified NEK2 inhibitor. INH154 indirectly inhibits NEK2 by binding the kinetochore-associated protein HEC1, thus preventing HEC1/NEK2 interaction which subsequently signals for NEK2 proteasomal degradation in HeLa cells (35). While NBI-961 reduced the percentage of live cells in both the SUDHL5 DLBCL cell line and primary patient-derived lymphoma cells, INH154 did not impact cell survival at 24 h (Fig. 4E and F) or even 96 h in the primary cells (Fig. 4F). Despite reports of NEK2 degradation in breast and cervical cancer cell lines (35), we did not observe loss of NEK2 in SUDHL5 or in primary patient-derived lymphoma cells following treatment with INH154 (Fig. 4G and H). The primary lymphoma cells were derived from an atypical extranodal biopsy in the scalp and thus follow-up studies with typical DLBCL are warranted. Since INH154 did not alter NEK2 activity or expression nor affect lymphoma cell viability, these findings reinforce that the lymphoma cell killing properties of NBI-961 are linked to the ability of NBI-961 to elicit NEK2 degradation. As further demonstration, NBI-961 does not degrade FLT3 nor alter phosphorylation of a downstream FLT3 substrate, mTOR, and is ~23 – 188x more cytotoxic than sorafenib, a tyrosine kinase receptor inhibitor that inhibits FLT3, VEGFR, and PDGFRβ (39,40) (Supplementary Fig. S10).
Loss of NEK2 shifts the total- and phospho-proteome towards an anti-mitotic and pro-apoptotic landscape
In showing NEK2 inhibition disrupts the proliferation and survival of DLBCL cells in a subset of cell lines typifying the molecular heterogeneity in patient tumors, we proposed the NBI-961 sensitive cells may predominantly express and therefore depend on NEK2 regulated pathways. To generate a network of NEK2 dependent pathways and substrates, we used an unbiased total- and phospho-proteomic approach in untreated SUDHL5 and VAL cells, which are matched for COO but differ in their sensitivity to NBI-961. Quantitative total proteomics revealed SUDHL5 cells exhibit a cell cycle and centrosome separation profile dominated by known NEK2 regulated proteins relative to VAL (Fig. 5A and B; Supplementary Table S6).
Figure 5. Loss of NEK2 alters the proteome and phospho-proteome landscapes of DLBCL cells.
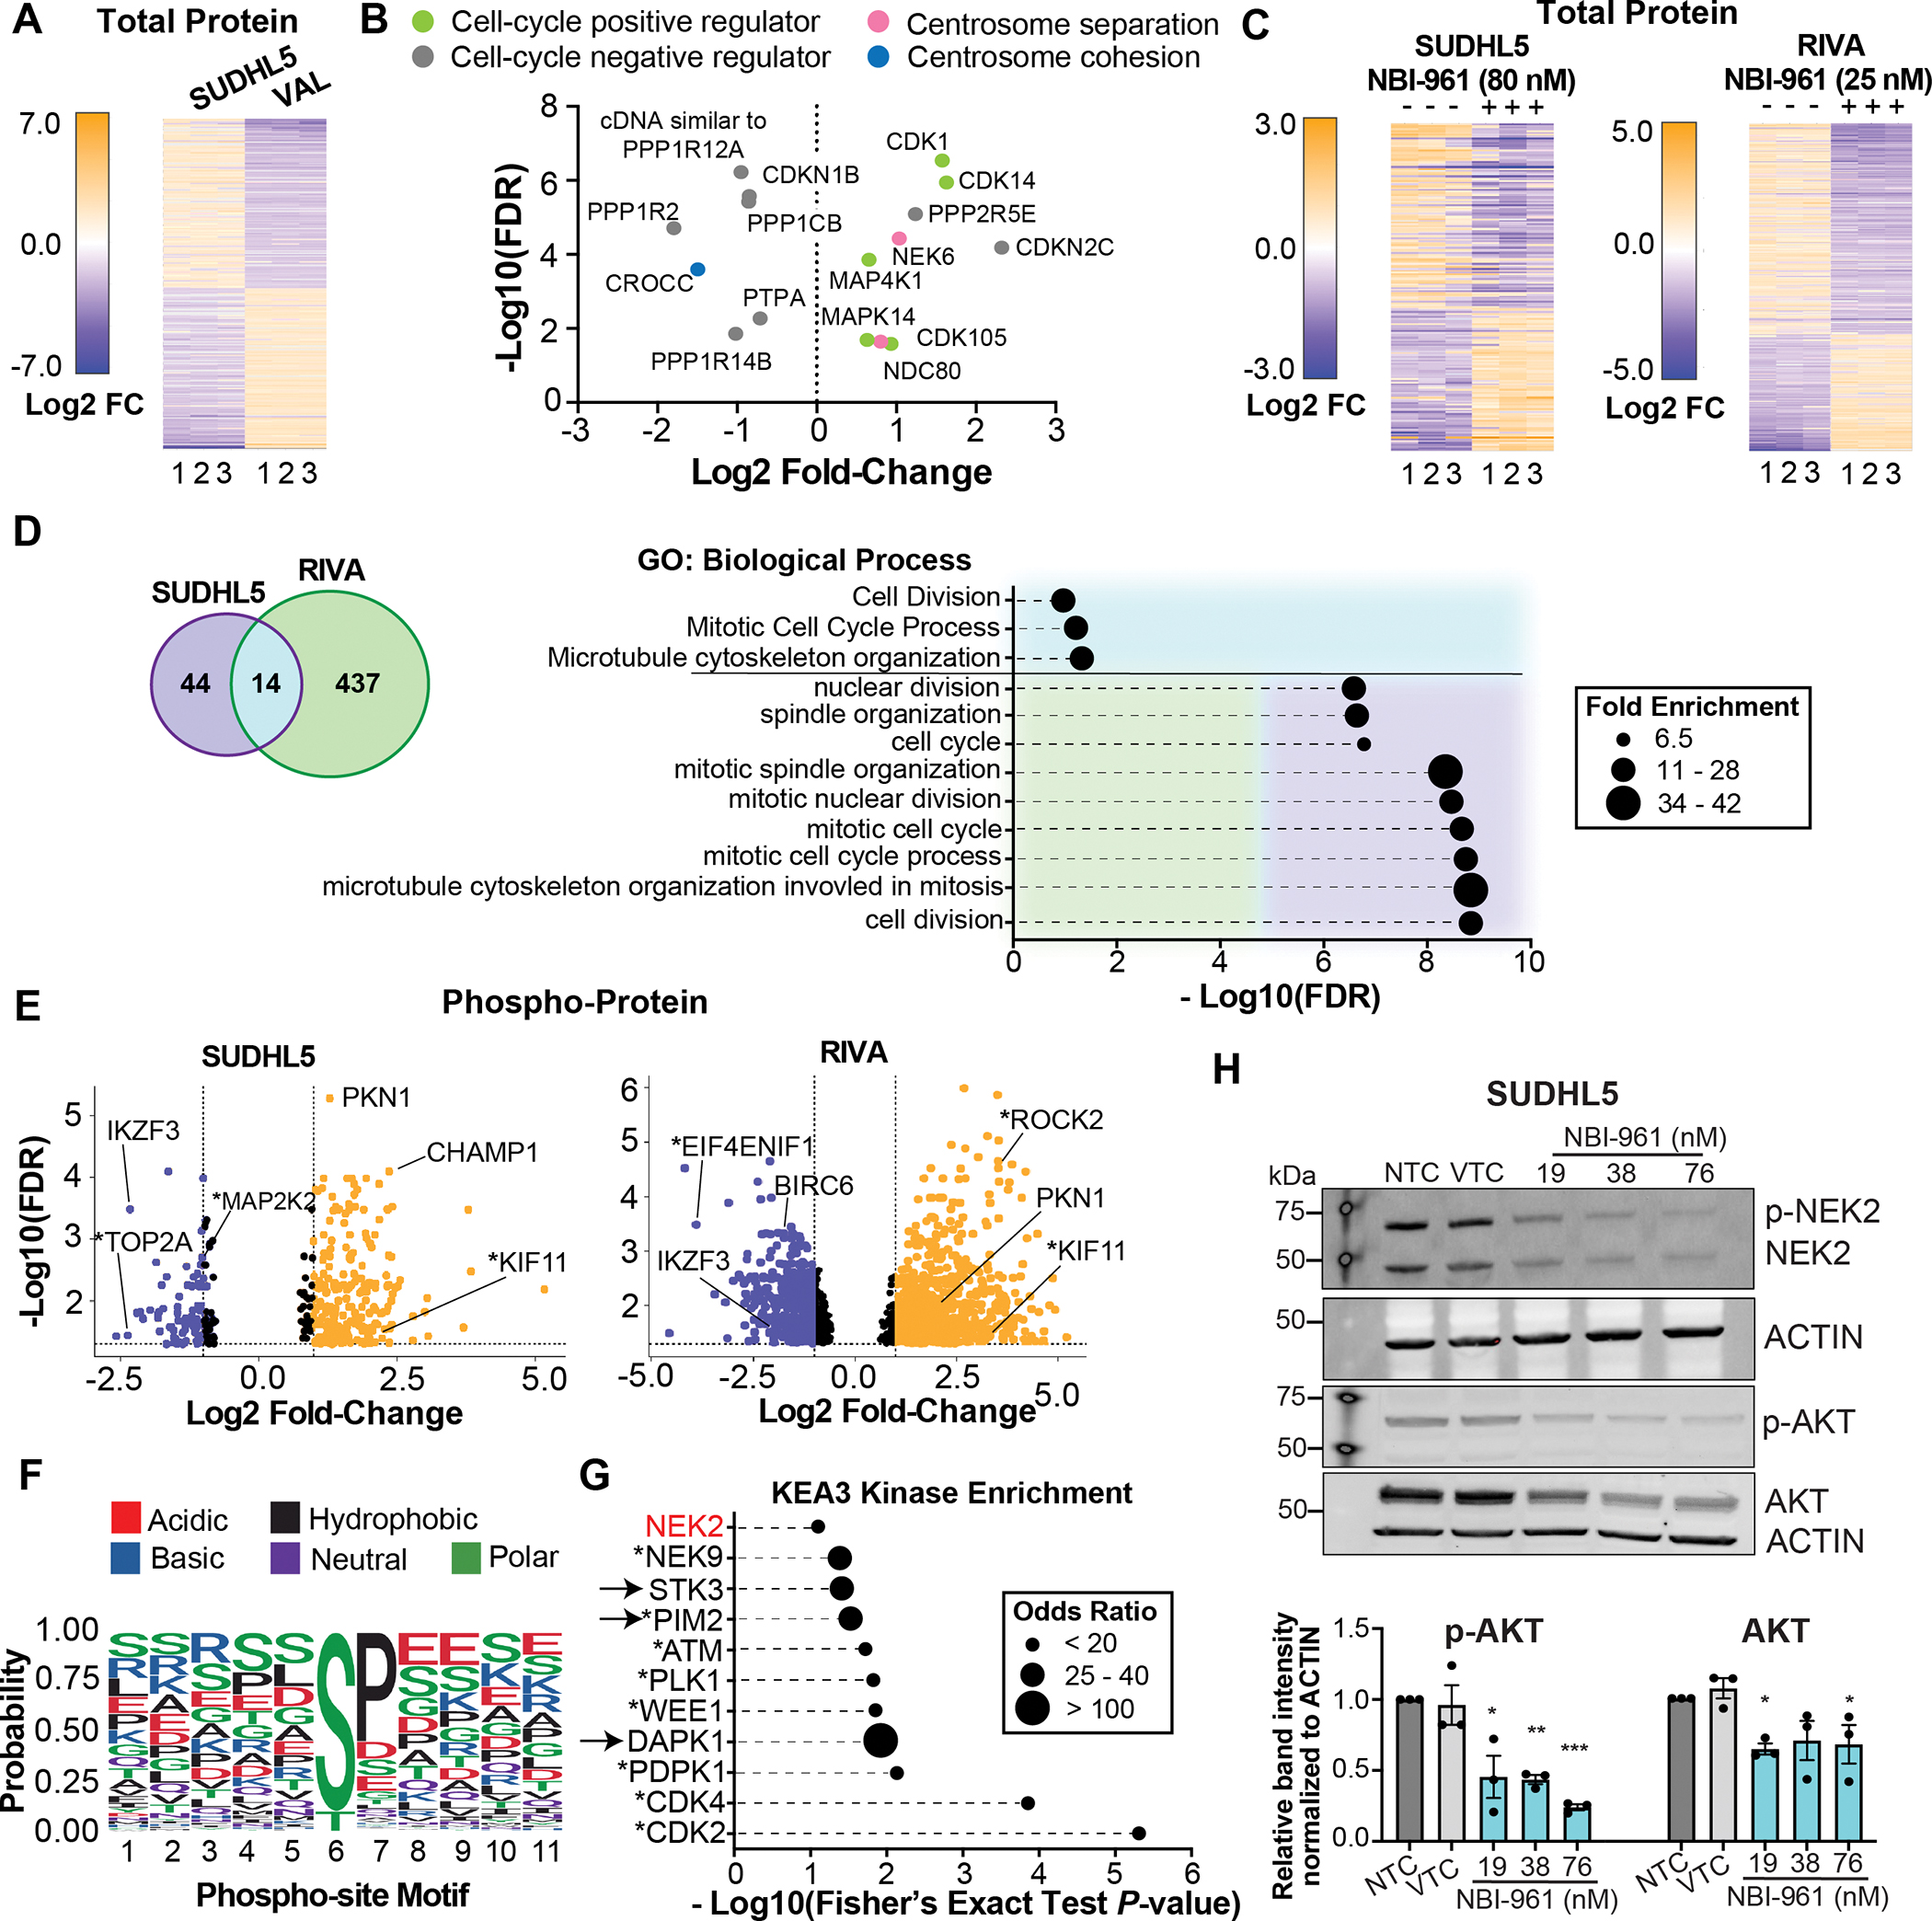
A, Heat map of 179 proteins with different abundances between untreated SUDHL5 and VAL DLBCL cell lines. B, Volcano plot of the abundance of select proteins with known functions in regulating the cell-cycle or centrosome separation in SUDHL5 cells compared to VAL cells. C, Heat maps of select proteins with changes in abundance after NBI-961 treatment for 96 h in SUDHL5 and RIVA DLBCL cell lines. D, Venn diagram (left) depicting the number of differentially expressed proteins and ensemble of gene set enrichment analysis (right) showing pathways after NBI-961 treatment for 96 h that are common to or distinct in SUDHL5 and RIVA. E, Volcano plots of changes in phosphorylation status of proteins after NBI-961 treatment for 96 h in SUDHL5 (top) and RIVA (bottom) DLBCL cell lines using a false discovery rate (FDR) cut-off of <0.05. F, Graphical output of motifx sequence motif analysis for phosphorylation sites of all peptides with differential abundance in NBI-961 treated SUDHL5 cells. G, Kinase enrichment analysis of the 25 proteins with the greatest loss of phosphorylation after NBI-961 treatment for 96 h in both SUDHL5 and RIVA. A, C, E, Adjusted P-values as determined by FDR. H, Western blot analysis of AKT and p-AKT protein expression with loss of NEK2 and p-NEK2 in NBI-961 treated SUDHL5 cells. Quantification of band intensity normalized to ACTIN. Adjusted P-values as determined by a one-way ANOVA with Dunnett’s multiple test correction for comparisons to DMSO vehicle treated control (VTC). All data are shown from three independent experiments. *P < 0.05, **P < 0.01
We then determined how the DLBCL proteome and phospho-proteome were altered by NBI-961. NBI-961 sensitive cells, SUDHL5 and RIVA, displayed significant changes to protein expression with NBI-961 treatment (Fig. 5C; Supplementary Tables S7 and S8). There was a greater overall change in RIVA cells (note the greater Log2 fold change compared to SUDHL5), which may account for their greater sensitivity to NBI-961 (Fig. 2G and 3). We then grouped differentially expressed proteins following NBI-961 treatment for SUDHL5 and RIVA. While few proteins overlapped, overlapping proteins as well as the 25 most significant proteins from each cell line were enriched for cell cycle and centrosome related pathways (Fig. 5D; Supplementary Table S9). Additionally, the loss of NEK2 resulted in an altered global phosphorylation profile, including changes in phosphorylation status of known or predicted NEK2 substrates such as MAP2K2, KIF11, TOP2A, and EIF4ENIF1 (41,42) (Fig. 5E; Supplementary Tables S10 and S11). As expected for an STK, sequence motif analysis of phosphopeptides differentially detected in the NBI-961 versus vehicle treated control group showed high probability for differential phosphorylation status of serine or threonine (Fig. 5F). The predominance of serine is consistent with previous work showing NEK2 exhibits preference for phospho-acceptor serines relative to threonines (43). A K3 kinase enrichment analysis (KEA3, v3) of proteins with significant loss of phosphorylation implicated cell cycle kinases and a few cell death associated kinases as likely drivers of the altered phosphorylation landscape following NBI-961 treatment (Fig. 5G; Supplementary Table S12). Despite KEA3 identifying NEK2 as a lower ranked kinase (18/42; P = 0.079), the top two kinases, cyclin dependent kinase 2 (CDK2) and CDK4 are known to directly interact with NEK2 (30,44) with evidence that expression of CDK4 and NEK2 are co-dependent (30). These phosphoproteomic analyses also identified proteins not yet associated with NEK2 that are potentially critical for NEK2-dependencies in DLBCL, including PKN1 and IKZF3, which were common to both cell line subtypes. Given that PKN1, IKZF3, and other known NEK2 substrates are implicated in regulation of AKT (21,45–49), a well-recognized hub for B cell pro-survival pathways (50,51), we investigated whether NBI-961 inhibits AKT phosphorylation. NBI-961 resulted in a dose-dependent loss of phosphorylated AKT with a concomitant reduction in NEK2 (Fig. 5H). A modest decrease in total AKT reached a maximum over the three, 2-fold concentrations. Together, these studies indicate that by targeting NEK2 in DLBCL, downstream oncogenic signaling can also be inhibited.
Blocking NEK2 signaling sensitizes lymphoma cells to chemotherapy by inducing apoptosis
Given the clinical interest in sensitizing resistant DLBCL to existing chemotherapy to improve patient response (52–54), we investigated the ability of NEK2 inactivation to potentiate DOX and VCR. Both agents can have severe toxic effects including DOX-related cardiotoxicity (55–57), so reducing the effective concentration of these drugs would improve patient survivorship. In the NBI-961 sensitive DLBCL cell lines, SUDHL5 and RIVA, NBI-961 sensitized cells to previously noncytotoxic concentrations of DOX and VCR (Fig. 6A) that were 8 – 28-fold (DOX) and 5 – 7-fold (VCR) lower than their GI50 (Supplementary Table S5). The significant loss in cell viability by NBI-961 potentiation of DOX was due to an increase in apoptosis (Fig. 6B). In contrast, the less NBI-961-sensitive VAL DLBCL cells and the GM22671 benign cells showed no chemosensitization to DOX and VCR and no induction of apoptosis (Fig. 6A and B). Similarly, other DLBCL cell lines more sensitive to NBI-961 alone (Fig. 2G; Supplementary Table S5), U2932 and to a lesser extent HT and SUDHL6, were also sensitized to DOX and VCR by NBI-961 whereas HBL1, SUDHL4, and a second benign B cell line, GM16113, were not (Supplementary Fig. S11). Considering 7.8 nM as the minimal concentration for drug effect (MEC) and the GI50 for the benign B cell lines as the minimal concentration for toxicity (MTC), we determined the therapeutic window of NBI-961 between the sensitive DLBCL cells and the benign B cells is 4.2 indicating a 4.2x higher concentration of NBI-961 is required to cause toxicity to kill 50% of benign B cells than is needed to produce a therapeutic effect in the DLBCL cells.
Figure 6. NEK2 inhibition sensitizes DLBCL cells to chemotherapy and delays tumor growth.
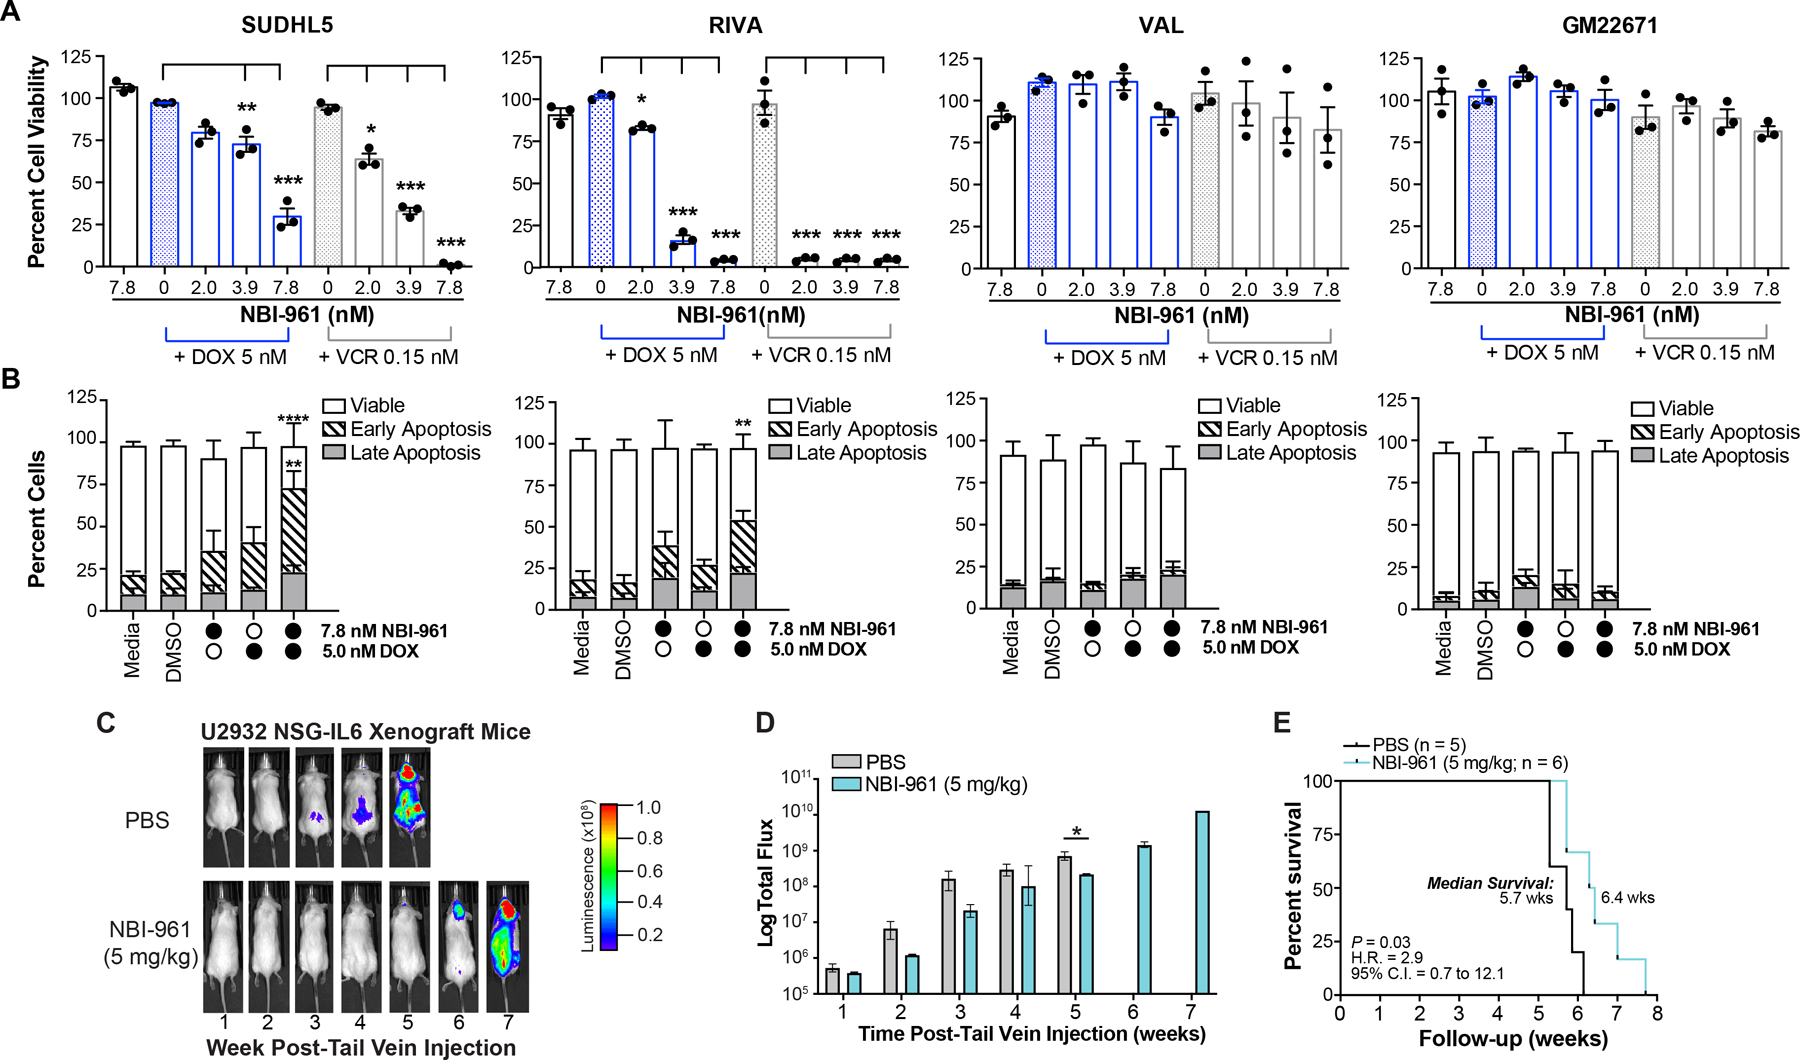
A, Bar graphs showing percent cell viability of DLBCL cell lines and benign B cells (GM22671) after 96 h NBI-961 treatment alone or in combination with doxorubicin (DOX) or vincristine (VCR). Adjusted P-values as determined by a one-way ANOVA with Dunnett’s multiple test correction for comparisons to either DOX or VCR only treated controls. B, Stacked bar graphs showing percent viable cells, cells in early or late apoptosis, and percent cells in each cell cycle phase of the corresponding DLBCL cell lines and GM22671 from A after 96 h treatment of NBI-961 or DOX alone, or both NBI-961 and DOX. Adjusted P-values as determined by a two-way ANOVA with Tukey’s multiple test correction for comparisons to either DMSO, NBI-961 only, or DOX only treated controls. A, B, Data are shown as mean ± SEM from three independent experiments. C, Images of U2932 DLBCL tumor growth in intravenous NSG-IL6 mouse model in representative mice treated with either PBS or NBI-961. D, Quantification of the luminescence in PBS (n = 5) and NBI-961 (n = 6) treated mice. E, Kaplan-Meier survival curves of mice; log-rank test. *P < 0.05, **P < 0.01, ***P < 0.001, ****P < 0.0001
NEK2 inhibition delays DLBCL growth in vivo and prolongs mouse survival
Mouse models of DLBCL often fail to recapitulate human disease. For example, transgenic mice rely on expression of oncogenes that better reflect only specific subgroups of DLBCL (58). Xenograft models better reproduce late-stage disease but require implantation into a localized area, which does not reflect human disease distribution (59). We established a xenograft model in NSG-IL6 mice where, rather than implanting DLBCL cells in a localized region, cells are injected intravenously, and tumors grow in areas that better recapitulate the disease in humans (60). Using U2932 cells, a once-daily intraperitoneal injection of NBI-961 at 5 mg/kg for the duration of the experiment delayed disease onset (Fig. 6C and D) and prolonged mouse survival (Fig. 6E). NBI-961 was well tolerated in the mice with no visible signs of distress or toxicity including no visible weight loss and no loss of appetite, activity, or tuft fur.
Discussion
Although many DLBCL patients achieve disease-free survival following the current R-CHOP regimen, about 40% experience relapsed disease which is often deadly (61). R-CHOP poses significant toxicity including an increased risk for grade 3–4 adverse cardiovascular events (62). These outcomes, along with the heterogenous genetic background of DLBCL, emphasize the need for adjuvant therapies targeting new molecular DLBCL etiologies. Recent work found expression of the cell cycle kinase NEK2 is elevated in DLBCL and at the mRNA level, confers poor patient outcome (31). Here, our study using larger cohorts supports these findings by showing both high NEK2 mRNA and protein expression is a significant predictor of patient outcome. We also demonstrate this correlation is independent of the known influence of COO subtype on DLBCL prognosis and the potential to pharmacologically target NEK2.
Our NEK2 inhibitor NBI-961 is selective for NEK2, with only residual binding to one off-target kinase, FLT3. It is unclear whether non-malignant mature B cells or lymphomas rely on FLT3 signaling (63,64), particularly in post-GC derived malignancies such as ABC DLBCL (65). Together with our previous enzymatic inhibition assay that revealed a ~12-fold lower IC50 of NBI-961 for NEK2 relative to FLT3 (66), the unaltered FLT3 expression and downstream targeting we observed in DLBCL cells suggest NBI-961 is unlikely to affect FLT3 (34).
STK inhibition in cancer is highly susceptible to molecular relapse through multiple, distinct mechanisms, such as kinome rewiring associated with retained scaffolding functions after kinase inhibition, leading to complete response rates of as low as 4% following STK inhibition in lymphoma (67–70). Kinase degradation may offer more sustained reduction in signaling and at lower concentrations compared to kinase inhibition (71). NBI-961 exhibits an unprecedented bifunctional mechanism of action in which it both catalytically inhibits NEK2 and induces NEK2 proteasomal degradation, leading to lymphoma cell death. Since catalytic inhibition of NEK2 alone by INH154 was insufficient to induce lymphoma cell death, it is likely that noncatalytic activities of NEK2 are essential to drive proliferation of lymphomas. We suspect that NEK2 may serve as a scaffold protein to coordinate cell cycle progression and prevent apoptosis, which may be a feature unique to certain subsets of DLBCL. Therefore, the added function of NEK2 degradation upon treatment with NBI-961 may enhance therapeutic benefit beyond traditional kinase inhibition by eliminating NEK2 scaffolding and protein-protein interactions, thus limiting the pathways by which resistance may occur. (71). An important question to address in the future is how does disruption of NEK2 noncatalytic or scaffolding functions drive G2/M arrest and cell death in DLBCL. NBI-961-induced NEK2 degradation can serve as a useful tool to identify these noncatalytic functions.
Sensitivity to NEK2 inhibition did not seem to correlate with any of the classic COO subtypes; although, two of the three ABC DLBCL cell lines displayed increased sensitivity to NBI-961 relative to all of the GCB cell lines. These two cell lines are also associated with the recently proposed molecular subtypes, BN2 (RIVA) (12) and possibly A53 (U2932) (60). BN2 cases tend to have upregulated NF-κB signaling (13), which is characteristic of ABC tumors and associated with increased NEK2 in other cancers (72,73) A53 is characterized by high rates of aneuploidy, another condition associated with high NEK2 expression (20). Regardless, we show a differential response to NBI-961 treatment in terms of NEK2 kinase inhibition and degradation that is directly linked to effects on cell death and cell cycle progression.
These experiments indicate a role for NEK2 in DLBCL cell viability and B cell cycle progression. We demonstrate that the novel NEK2 inhibitor NBI-961 significantly attenuates lymphoma cell viability. Perhaps most strikingly, NBI-961 synergizes with the standard of care drugs DOX and VCR to induce apoptosis and significantly lower their effective doses in DLBCL cells but not in benign B cells, indicating the potential of NEK2 inhibition to reduce the amount and duration of existing treatment. Reducing the dose or frequency of chemotherapy could reduce the severity of dose-dependent neuro- and cardiotoxicities and lower the risk of secondary malignancies resulting from treatment. These studies establish a key role for NEK2 in DLBCL and set the foundation for development of anti-NEK2 therapeutic strategies.
Supplementary Material
Statement of Significance.
Identifying a dependency on NEK2 for cell survival and oncogenic signaling in DLBCL advances our understanding of this molecularly heterogenous cancer and positions NEK2 as a new therapeutic target.
Acknowledgements
We thank Drs. Sinthia Alam and Anna Sharabura, who as medical students at the time of FFPET tissue collection, assisted in collating the patient clinical data.
Financial support:
The Kendrick and Frett laboratories are supported by the National Institutes of Health (NIH; P20GM121293, P20GM109005, and R24GM137786); and the UAMS Winthrop P. Rockefeller Cancer Institute Teams Science Award. The Yoon laboratory is supported by the UAMS Winthrop P. Rockefeller Cancer Center Institute Seeds of Science Award. The Shultz laboratory is supported by the NIH (CA034196). The Zhan laboratory is supported by NIH-NCI 1R01CA236814-01A1, 3R01-CA236814-03S1, U54-CA272691, US Department of Defense (DoD) CA180190, the Paula and Rodger Riney Foundation, and UAMS Winthrop P. Rockefeller Cancer Institute (WRCRI) Fund.
Footnotes
Conflict of Interest: The authors declare no potential conflicts of interest.
References
- 1.Teras LR, DeSantis CE, Cerhan JR, Morton LM, Jemal A, Flowers CR. 2016 US lymphoid malignancy statistics by World Health Organization subtypes. CA Cancer J Clin 2016;66:443–59 [DOI] [PubMed] [Google Scholar]
- 2.Li S, Young KH, Medeiros LJ. Diffuse large B-cell lymphoma. Pathology 2018;50:74–87 [DOI] [PubMed] [Google Scholar]
- 3.Friedberg JW. Relapsed/refractory diffuse large B-cell lymphoma. Hematology Am Soc Hematol Educ Program 2011;2011:498–505 [DOI] [PubMed] [Google Scholar]
- 4.Chapuy B, Stewart C, Dunford AJ, Kim J, Kamburov A, Redd RA, et al. Molecular subtypes of diffuse large B cell lymphoma are associated with distinct pathogenic mechanisms and outcomes. Nat Med 2018;24:679–90 [DOI] [PMC free article] [PubMed] [Google Scholar]
- 5.Alizadeh AA, Eisen MB, Davis RE, Ma C, Lossos IS, Rosenwald A, et al. Distinct types of diffuse large B-cell lymphoma identified by gene expression profiling. Nature 2000;403:503–11 [DOI] [PubMed] [Google Scholar]
- 6.Lenz G, Wright GW, Emre NC, Kohlhammer H, Dave SS, Davis RE, et al. Molecular subtypes of diffuse large B-cell lymphoma arise by distinct genetic pathways. Proc Natl Acad Sci U S A 2008;105:13520–5 [DOI] [PMC free article] [PubMed] [Google Scholar]
- 7.Lenz G, Wright G, Dave SS, Xiao W, Powell J, Zhao H, et al. Stromal gene signatures in large-B-cell lymphomas. N Engl J Med 2008;359:2313–23 [DOI] [PMC free article] [PubMed] [Google Scholar]
- 8.Rosenwald A, Wright G, Chan WC, Connors JM, Campo E, Fisher RI, et al. The use of molecular profiling to predict survival after chemotherapy for diffuse large-B-cell lymphoma. N Engl J Med 2002;346:1937–47 [DOI] [PubMed] [Google Scholar]
- 9.Hans CP, Weisenburger DD, Greiner TC, Gascoyne RD, Delabie J, Ott G, et al. Confirmation of the molecular classification of diffuse large B-cell lymphoma by immunohistochemistry using a tissue microarray. Blood 2004;103:275–82 [DOI] [PubMed] [Google Scholar]
- 10.Scott DW, Wright GW, Williams PM, Lih CJ, Walsh W, Jaffe ES, et al. Determining cell-of-origin subtypes of diffuse large B-cell lymphoma using gene expression in formalin-fixed paraffin-embedded tissue. Blood 2014;123:1214–7 [DOI] [PMC free article] [PubMed] [Google Scholar]
- 11.Robetorye RS, Ramsower CA, Rosenthal AC, Yip TK, Wendel Spiczka AJ, Glinsmann-Gibson BJ, et al. Incorporation of Digital Gene Expression Profiling for Cell-of-Origin Determination (Lymph2Cx Testing) into the Routine Work-Up of Diffuse Large B-Cell Lymphoma. J Hematop 2019;12:3–10 [DOI] [PMC free article] [PubMed] [Google Scholar]
- 12.Wright GW, Huang DW, Phelan JD, Coulibaly ZA, Roulland S, Young RM, et al. A Probabilistic Classification Tool for Genetic Subtypes of Diffuse Large B Cell Lymphoma with Therapeutic Implications. Cancer Cell 2020;37:551–68.e14 [DOI] [PMC free article] [PubMed] [Google Scholar]
- 13.Schmitz R, Wright GW, Huang DW, Johnson CA, Phelan JD, Wang JQ, et al. Genetics and Pathogenesis of Diffuse Large B-Cell Lymphoma. N Engl J Med 2018;378:1396–407 [DOI] [PMC free article] [PubMed] [Google Scholar]
- 14.Wilson WH, Wright GW, Huang DW, Hodkinson B, Balasubramanian S, Fan Y, et al. Effect of ibrutinib with R-CHOP chemotherapy in genetic subtypes of DLBCL. Cancer Cell 2021;39:1643–53.e3 [DOI] [PMC free article] [PubMed] [Google Scholar]
- 15.Gu Z, Zhou W, Huang J, Yang Y, Wendlandt E, Xu H, et al. Nek2 is a novel regulator of B cell development and immunological response. Biomed Res Int 2014;2014:621082. [DOI] [PMC free article] [PubMed] [Google Scholar]
- 16.Fang Y, Zhang X. Targeting NEK2 as a promising therapeutic approach for cancer treatment. Cell Cycle 2016;15:895–907 [DOI] [PMC free article] [PubMed] [Google Scholar]
- 17.Frett B, Brown RV, Ma M, Hu W, Han H, Li HY. Therapeutic melting pot of never in mitosis gene a related kinase 2 (Nek2): a perspective on Nek2 as an oncology target and recent advancements in Nek2 small molecule inhibition. J Med Chem 2014;57:5835–44 [DOI] [PMC free article] [PubMed] [Google Scholar]
- 18.Li G, Zhong Y, Shen Q, Zhou Y, Deng X, Li C, et al. NEK2 serves as a prognostic biomarker for hepatocellular carcinoma. Int J Oncol 2017;50:405–13 [DOI] [PMC free article] [PubMed] [Google Scholar]
- 19.Lu L, Zhai X, Yuan R. Clinical significance and prognostic value of Nek2 protein expression in colon cancer. Int J Clin Exp Pathol 2015;8:15467–73 [PMC free article] [PubMed] [Google Scholar]
- 20.Rivera-Rivera Y, Marina M, Jusino S, Lee M, Velázquez JV, Chardón-Colón C, et al. The Nek2 centrosome-mitotic kinase contributes to the mesenchymal state, cell invasion, and migration of triple-negative breast cancer cells. Sci Rep 2021;11:9016. [DOI] [PMC free article] [PubMed] [Google Scholar]
- 21.Zhou W, Yang Y, Xia J, Wang H, Salama ME, Xiong W, et al. NEK2 induces drug resistance mainly through activation of efflux drug pumps and is associated with poor prognosis in myeloma and other cancers. Cancer Cell 2013;23:48–62 [DOI] [PMC free article] [PubMed] [Google Scholar]
- 22.Fry AM, O’Regan L, Sabir SR, Bayliss R. Cell cycle regulation by the NEK family of protein kinases. J Cell Sci 2012;125:4423–33 [DOI] [PMC free article] [PubMed] [Google Scholar]
- 23.Reininger L, Tewari R, Fennell C, Holland Z, Goldring D, Ranford-Cartwright L, et al. An essential role for the Plasmodium Nek-2 Nima-related protein kinase in the sexual development of malaria parasites. J Biol Chem 2009;284:20858–68 [DOI] [PMC free article] [PubMed] [Google Scholar]
- 24.Faragher AJ, Fry AM. Nek2A kinase stimulates centrosome disjunction and is required for formation of bipolar mitotic spindles. Mol Biol Cell 2003;14:2876–89 [DOI] [PMC free article] [PubMed] [Google Scholar]
- 25.Rellos P, Ivins FJ, Baxter JE, Pike A, Nott TJ, Parkinson DM, et al. Structure and regulation of the human Nek2 centrosomal kinase. J Biol Chem 2007;282:6833–42 [DOI] [PubMed] [Google Scholar]
- 26.Fry AM, Nigg EA. Characterization of mammalian NIMA-related kinases. Methods Enzymol 1997;283:270–82 [DOI] [PubMed] [Google Scholar]
- 27.Sonn S, Jeong Y, Rhee K. Nip2/centrobin may be a substrate of Nek2 that is required for proper spindle assembly during mitosis in early mouse embryos. Mol Reprod Dev 2009;76:587–92 [DOI] [PubMed] [Google Scholar]
- 28.Bahmanyar S, Kaplan DD, Deluca JG, Giddings TH, O’Toole ET, Winey M, et al. beta-Catenin is a Nek2 substrate involved in centrosome separation. Genes Dev 2008;22:91–105 [DOI] [PMC free article] [PubMed] [Google Scholar]
- 29.Lee J, Gollahon L. Mitotic perturbations induced by Nek2 overexpression require interaction with TRF1 in breast cancer cells. Cell Cycle 2013;12:3599–614 [DOI] [PMC free article] [PubMed] [Google Scholar]
- 30.Harrison Pitner MK, Saavedra HI. Cdk4 and nek2 signal binucleation and centrosome amplification in a her2+ breast cancer model. PLoS One 2013;8:e65971. [DOI] [PMC free article] [PubMed] [Google Scholar]
- 31.Zhou L, Ding L, Gong Y, Zhao J, Zhang J, Mao Z, et al. NEK2 Promotes Cell Proliferation and Glycolysis by Regulating PKM2 Abundance. Front Oncol 2021;11:677763. [DOI] [PMC free article] [PubMed] [Google Scholar]
- 32.Andréasson U, Dictor M, Jerkeman M, Berglund M, Sundström C, Linderoth J, et al. Identification of molecular targets associated with transformed diffuse large B cell lymphoma using highly purified tumor cells. Am J Hematol 2009;84:803–8 [DOI] [PubMed] [Google Scholar]
- 33.de Vos S, Hofmann WK, Grogan TM, Krug U, Schrage M, Miller TP, et al. Gene expression profile of serial samples of transformed B-cell lymphomas. Lab Invest 2003;83:271–85 [DOI] [PubMed] [Google Scholar]
- 34.Zhang L, Lakkaniga NR, Bharate JB, Mcconnell N, Wang X, Kharbanda A, et al. Discovery of imidazo[1,2-a]pyridine-thiophene derivatives as FLT3 and FLT3 mutants inhibitors for acute myeloid leukemia through structure-based optimization of an NEK2 inhibitor. Eur J Med Chem 2021;225:113776. [DOI] [PMC free article] [PubMed] [Google Scholar]
- 35.Hu CM, Zhu J, Guo XE, Chen W, Qiu XL, Ngo B, et al. Novel small molecules disrupting Hec1/Nek2 interaction ablate tumor progression by triggering Nek2 degradation through a death-trap mechanism. Oncogene 2015;34:1220–30 [DOI] [PMC free article] [PubMed] [Google Scholar]
- 36.Wiśniewski JR, Zougman A, Nagaraj N, Mann M. Universal sample preparation method for proteome analysis. Nat Methods 2009;6:359–62 [DOI] [PubMed] [Google Scholar]
- 37.Storey AJ, Naceanceno KS, Lan RS, Washam CL, Orr LM, Mackintosh SG, et al. ProteoViz: a tool for the analysis and interactive visualization of phosphoproteomics data. Mol Omics 2020;16:316–26 [DOI] [PMC free article] [PubMed] [Google Scholar]
- 38.NCICCR-DLBCL. Genomic Variation in Diffuse Large B Cell Lymphomas
- 39.Wilhelm SM, Carter C, Tang L, Wilkie D, McNabola A, Rong H, et al. BAY 43–9006 exhibits broad spectrum oral antitumor activity and targets the RAF/MEK/ERK pathway and receptor tyrosine kinases involved in tumor progression and angiogenesis. Cancer Res 2004;64:7099–109 [DOI] [PubMed] [Google Scholar]
- 40.Chen W, Drakos E, Grammatikakis I, Schlette EJ, Li J, Leventaki V, et al. mTOR signaling is activated by FLT3 kinase and promotes survival of FLT3-mutated acute myeloid leukemia cells. Mol Cancer 2010;9:292. [DOI] [PMC free article] [PubMed] [Google Scholar]
- 41.Cheng F, Jia P, Wang Q, Zhao Z. Quantitative network mapping of the human kinome interactome reveals new clues for rational kinase inhibitor discovery and individualized cancer therapy. Oncotarget 2014;5:3697–710 [DOI] [PMC free article] [PubMed] [Google Scholar]
- 42.Zhang QC, Petrey D, Garzón JI, Deng L, Honig B. PrePPI: a structure-informed database of protein-protein interactions. Nucleic Acids Res 2013;41:D828–33 [DOI] [PMC free article] [PubMed] [Google Scholar]
- 43.van de Kooij B, Creixell P, van Vlimmeren A, Joughin BA, Miller CJ, Haider N, et al. Comprehensive substrate specificity profiling of the human Nek kinome reveals unexpected signaling outputs. Elife 2019;8 [DOI] [PMC free article] [PubMed] [Google Scholar]
- 44.Liu X, Gao Y, Lu Y, Zhang J, Li L, Yin F. Upregulation of NEK2 is associated with drug resistance in ovarian cancer. Oncol Rep 2014;31:745–54 [DOI] [PubMed] [Google Scholar]
- 45.Otsuki T, Nagashima T, Komatsu N, Kirito K, Furukawa Y, Kobayashi Si S, et al. Phosphorylation of Fanconi anemia protein, FANCA, is regulated by Akt kinase. Biochem Biophys Res Commun 2002;291:628–34 [DOI] [PubMed] [Google Scholar]
- 46.Hornbeck PV, Zhang B, Murray B, Kornhauser JM, Latham V, Skrzypek E. PhosphoSitePlus, 2014: mutations, PTMs and recalibrations. Nucleic Acids Res 2015;43:D512–20 [DOI] [PMC free article] [PubMed] [Google Scholar]
- 47.Lee SB, Xuan Nguyen TL, Choi JW, Lee KH, Cho SW, Liu Z, et al. Nuclear Akt interacts with B23/NPM and protects it from proteolytic cleavage, enhancing cell survival. Proc Natl Acad Sci U S A 2008;105:16584–9 [DOI] [PMC free article] [PubMed] [Google Scholar]
- 48.Yasui T, Sakakibara-Yada K, Nishimura T, Morita K, Tada S, Mosialos G, et al. Protein kinase N1, a cell inhibitor of Akt kinase, has a central role in quality control of germinal center formation. Proc Natl Acad Sci U S A 2012;109:21022–7 [DOI] [PMC free article] [PubMed] [Google Scholar]
- 49.Lazarian G, Yin S, Ten Hacken E, Sewastianik T, Uduman M, Font-Tello A, et al. A hotspot mutation in transcription factor IKZF3 drives B cell neoplasia via transcriptional dysregulation. Cancer Cell 2021;39:380–93.e8 [DOI] [PMC free article] [PubMed] [Google Scholar]
- 50.Calamito M, Juntilla MM, Thomas M, Northrup DL, Rathmell J, Birnbaum MJ, et al. Akt1 and Akt2 promote peripheral B-cell maturation and survival. Blood 2010;115:4043–50 [DOI] [PMC free article] [PubMed] [Google Scholar]
- 51.Limon JJ, Fruman DA. Akt and mTOR in B Cell Activation and Differentiation. Front Immunol 2012;3:228. [DOI] [PMC free article] [PubMed] [Google Scholar]
- 52.He MY, Kridel R. Treatment resistance in diffuse large B-cell lymphoma. Leukemia 2021;35:2151–65 [DOI] [PubMed] [Google Scholar]
- 53.Chen J, Ge X, Zhang W, Ding P, Du Y, Wang Q, et al. PI3K/AKT inhibition reverses R-CHOP resistance by destabilizing SOX2 in diffuse large B cell lymphoma. Theranostics 2020;10:3151–63 [DOI] [PMC free article] [PubMed] [Google Scholar]
- 54.Clozel T, Yang S, Elstrom RL, Tam W, Martin P, Kormaksson M, et al. Mechanism-based epigenetic chemosensitization therapy of diffuse large B-cell lymphoma. Cancer Discov 2013;3:1002–19 [DOI] [PMC free article] [PubMed] [Google Scholar]
- 55.Volkova M, Russell R. Anthracycline cardiotoxicity: prevalence, pathogenesis and treatment. Curr Cardiol Rev 2011;7:214–20 [DOI] [PMC free article] [PubMed] [Google Scholar]
- 56.Buzdar AU, Marcus C, Smith TL, Blumenschein GR. Early and delayed clinical cardiotoxicity of doxorubicin. Cancer 1985;55:2761–5 [DOI] [PubMed] [Google Scholar]
- 57.Herradón E, González C, González A, Uranga JA, López-Miranda V. Cardiovascular Toxicity Induced by Chronic Vincristine Treatment. Front Pharmacol 2021;12:692970. [DOI] [PMC free article] [PubMed] [Google Scholar]
- 58.Meyer SN, Koul S, Pasqualucci L. Mouse Models of Germinal Center Derived B-Cell Lymphomas. Front Immunol 2021;12:710711. [DOI] [PMC free article] [PubMed] [Google Scholar]
- 59.Chapuy B, Cheng H, Watahiki A, Ducar MD, Tan Y, Chen L, et al. Diffuse large B-cell lymphoma patient-derived xenograft models capture the molecular and biological heterogeneity of the disease. Blood 2016;127:2203–13 [DOI] [PMC free article] [PubMed] [Google Scholar]
- 60.Amini RM, Berglund M, Rosenquist R, Von Heideman A, Lagercrantz S, Thunberg U, et al. A novel B-cell line (U-2932) established from a patient with diffuse large B-cell lymphoma following Hodgkin lymphoma. Leuk Lymphoma 2002;43:2179–89 [DOI] [PubMed] [Google Scholar]
- 61.Coiffier B, Thieblemont C, Van Den Neste E, Lepeu G, Plantier I, Castaigne S, et al. Long-term outcome of patients in the LNH-98.5 trial, the first randomized study comparing rituximab-CHOP to standard CHOP chemotherapy in DLBCL patients: a study by the Groupe d’Etudes des Lymphomes de l’Adulte. Blood 2010;116:2040–5 [DOI] [PMC free article] [PubMed] [Google Scholar]
- 62.Linschoten M, Kamphuis JAM, van Rhenen A, Bosman LP, Cramer MJ, Doevendans PA, et al. Cardiovascular adverse events in patients with non-Hodgkin lymphoma treated with first-line cyclophosphamide, doxorubicin, vincristine, and prednisone (CHOP) or CHOP with rituximab (R-CHOP): a systematic review and meta-analysis. Lancet Haematol 2020;7:e295–e308 [DOI] [PubMed] [Google Scholar]
- 63.Kiyoi H, Kawashima N, Ishikawa Y. FLT3 mutations in acute myeloid leukemia: Therapeutic paradigm beyond inhibitor development. Cancer Sci 2020;111:312–22 [DOI] [PMC free article] [PubMed] [Google Scholar]
- 64.Kallies A, Hasbold J, Fairfax K, Pridans C, Emslie D, McKenzie BS, et al. Initiation of plasma-cell differentiation is independent of the transcription factor Blimp-1. Immunity 2007;26:555–66 [DOI] [PubMed] [Google Scholar]
- 65.Gómez-Abad C, Pisonero H, Blanco-Aparicio C, Roncador G, González-Menchén A, Martinez-Climent JA, et al. PIM2 inhibition as a rational therapeutic approach in B-cell lymphoma. Blood 2011;118:5517–27 [DOI] [PubMed] [Google Scholar]
- 66.Xi JB, Fang YF, Frett B, Zhu ML, Zhu T, Kong YN, et al. Structure-based design and synthesis of imidazo[1,2-a]pyridine derivatives as novel and potent Nek2 inhibitors with in vitro and in vivo antitumor activities. Eur J Med Chem 2017;126:1083–106 [DOI] [PubMed] [Google Scholar]
- 67.Savill KMZ, Lee BB, Oeh J, Lin J, Lin E, Chung WJ, et al. Distinct resistance mechanisms arise to allosteric vs. ATP-competitive AKT inhibitors. Nat Commun 2022;13:2057. [DOI] [PMC free article] [PubMed] [Google Scholar]
- 68.Witzig TE, Geyer SM, Ghobrial I, Inwards DJ, Fonseca R, Kurtin P, et al. Phase II trial of single-agent temsirolimus (CCI-779) for relapsed mantle cell lymphoma. J Clin Oncol 2005;23:5347–56 [DOI] [PubMed] [Google Scholar]
- 69.Neel DS, Bivona TG. Resistance is futile: overcoming resistance to targeted therapies in lung adenocarcinoma. NPJ Precis Oncol 2017;1 [DOI] [PMC free article] [PubMed] [Google Scholar]
- 70.Chen KK, Du TF, Xiong PS, Fan GH, Yang W. Discontinuation of Tyrosine Kinase Inhibitors in Chronic Myeloid Leukemia With Losing Major Molecular Response as a Definition for Molecular Relapse: A Systematic Review and Meta-Analysis. Front Oncol 2019;9:372. [DOI] [PMC free article] [PubMed] [Google Scholar]
- 71.Burslem GM, Smith BE, Lai AC, Jaime-Figueroa S, McQuaid DC, Bondeson DP, et al. The Advantages of Targeted Protein Degradation Over Inhibition: An RTK Case Study. Cell Chem Biol 2018;25:67–77.e3 [DOI] [PMC free article] [PubMed] [Google Scholar]
- 72.Davis RE, Brown KD, Siebenlist U, Staudt LM. Constitutive nuclear factor kappaB activity is required for survival of activated B cell-like diffuse large B cell lymphoma cells. J Exp Med 2001;194:1861–74 [DOI] [PMC free article] [PubMed] [Google Scholar]
- 73.Franqui-Machin R, Hao M, Bai H, Gu Z, Zhan X, Habelhah H, et al. Destabilizing NEK2 overcomes resistance to proteasome inhibition in multiple myeloma. J Clin Invest 2018;128:2877–93 [DOI] [PMC free article] [PubMed] [Google Scholar]
Associated Data
This section collects any data citations, data availability statements, or supplementary materials included in this article.
Supplementary Materials
Data Availability Statement
The proteomics data generated and R scripts utilized in this study are publicly available at https://github.com/ByrumLab/ProteoViz or via ProteomeXchange with the identifier PXD015606. All raw mass spectrometry data from the proteomic studies are available at ftp://massive.ucsd.edu/MSV000092686/
All other data generated are available upon request from the corresponding authors.