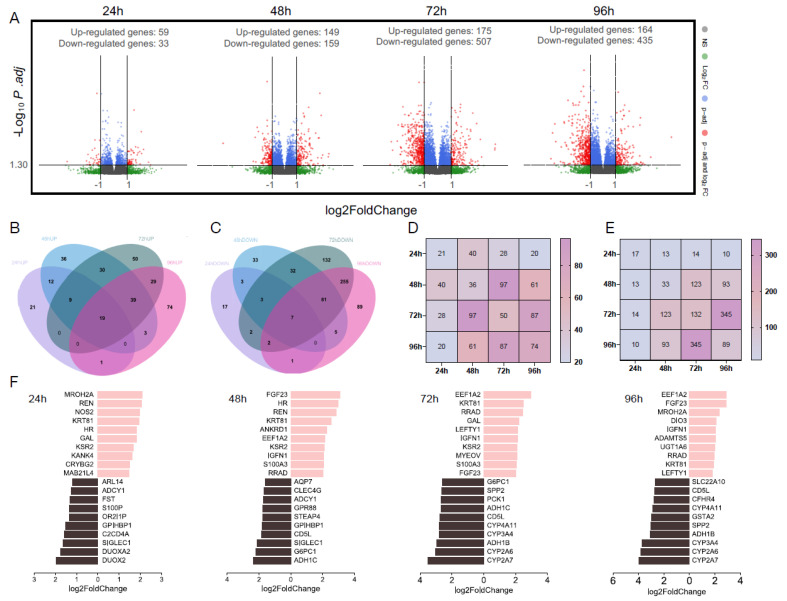
Figure 2.
NGS of PCLSs, cultured for up to 96 h in WEGG or GFIPO. (A) Volcano plots representing the differentially expressed genes (red), with a threshold of log2FoldChange > 1 on the x-axis and p.adj < 0.05 (−Log10p.adj > 1.30) on the y-axis, comparing GFIPO and WEGG at each time point. WEGG serves as the control group. (B,C) Venn diagrams illustrating the distribution of up-regulated genes (B) and down-regulated genes (C) across all time points. (D,E) Heatmap showing the number of overlapped up-regulated (D) and down-regulated (E) DEGs between two timepoints; overlap of the same timepoint stands for the unique DEGs amount as shown in the Venn diagrams. (F) The top 10 up-regulated genes (highlighted in pink, right) and down-regulated genes (highlighted in black, left) at each time point.

