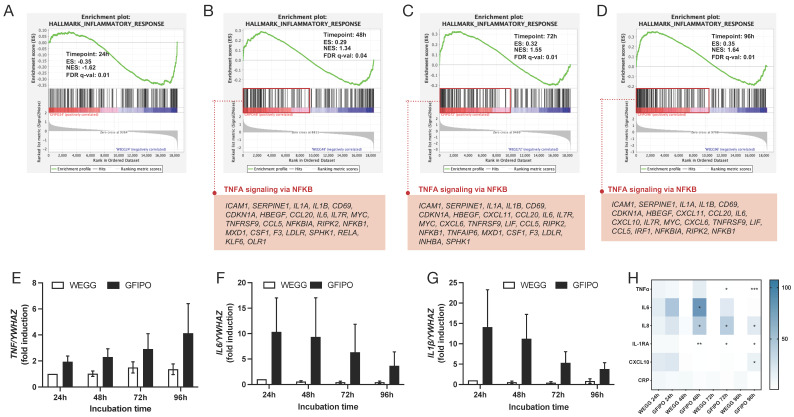
Figure 6.
Gene regulation in inflammatory response of GFIPO compared to WEGG in PCLSs. (A–D) GSEA plots of hallmark inflammatory response pathway at each time point: (A) 24 h, (B) 48 h, (C) 72 h, and (D) 96 h; below are up-regulated genes involved in TNFα signaling via NFκB pathway. (E–G) mRNA expression of inflammatory biomarkers (TNF, IL6, IL1β) in PCLSs after up to 96 h of incubation. (H) Secretion of inflammatory cytokines by PCLSs after up to 96 h of incubation (100% to WEGG 24 h). Data are presented as mean ± SEM, (*) denotes statistical differences between GFIPO and WEGG at each time point; * p < 0.05, ** p < 0.01, *** p < 0.001.

