

Abstract
Background and Aim
Patients with hepatocellular carcinoma (HCC) are managed in various hospital departments, which complicates the assessment of the overall picture. In our large liver transplant institute, we evaluate all HCC patients in a weekly multi-disciplinary liver tumor board, and their data are prospectively collected in an institutional HCC database to evaluate HCC causes, tumor features, treatments, and survival.
Materials and Methods
Baseline data for patients (n=1322) were prospectively recorded, including hepatitis status, routine clinical serum parameters, radiological assessment of maximum tumor diameter (MTD), tumor number, presence of macroscopic portal vein thrombosis (PVT), and serum alpha-fetoprotein (AFP) levels.
Results
Cirrhosis was found in 81.1% of patients; 58.5% had hepatitis B virus (HBV), 14.9% hepatitis C virus (HCV), 8.9% cryptogenic cirrhosis, and less than 2% had alcoholism. MTD was <5 cm in 61.95% of patients, and 31.9% had PVT. The median overall survival was more than six-fold greater for the 444 liver transplant patients than for those without surgery. Transplanted patients had smaller tumors, whereas larger tumors (MTD >10 cm) were primarily in the no-surgery group. Parallel differences were found for AFP levels (highest in the no-surgery group). PVT was present in similar proportions (25.0% for transplant, 28.0% for no-surgery). The presence of cirrhosis was higher in the transplant group. MTD and levels of serum AFP, gamma-glutamyl transferase (GGT), and blood platelets were prognostic parameters for transplant. Furthermore, AFP and GGT levels were prognostic for transplanted PVT patients. Only albumin was prognostic in the no-surgery patients.
Conclusion
Transplanted HCC patients have longer survival, smaller tumors, and more severe liver damage than no-surgery patients. Prognostic subsets were identified within the surgery and the PVT groups.
Keywords: AFP, HCC, multifocality, PVT, relationships
Introduction
Hepatocellular carcinoma (HCC) typically arises against a backdrop of liver cirrhosis, resulting from chronic liver inflammatory disease. The most frequent causes are hepatitis B virus (HBV) or hepatitis C virus (HCV), along with alcoholism, chronic dietary consumption of chemical carcinogens such as aflatoxin B1, or, increasingly, nonalcoholic fatty liver disease. Different etiologies predominate in various countries; broadly, HBV is more common in Asia (excluding Japan), while HCV and obesity are more prevalent in Western countries.[1,2] The end results are either death from liver failure or HCC, with tumor growth being a leading cause of death. Since the causes of HCC are largely known, it is a potentially preventable cancer.
HCC patients can be referred to and managed by various hospital departments, most commonly including hepatology, medical oncology, gastrointestinal surgery, liver transplant, and interventional radiology departments. Consequently, the overall picture of HCC in any given large institution can be challenging to discern clearly. In our institution, which has been performing liver transplants since 2002, most HCC patients are referred to and evaluated by a weekly interdisciplinary liver tumor board, where decisions regarding surgery or non-surgical options are made. Patients earmarked for surgery remain within the Liver Transplant Institute for management, while those deemed ineligible for transplant, resection, or ablation are referred to appropriate specialties, typically interventional radiology or oncology.
The aim of this report is to describe the tumor causes, extent, and prognosis of patients treated by liver transplant, and, since 2019, the HCC patients who were ineligible for surgical interventions. We found that survival after transplant is significantly greater than for those not undergoing surgery. Additionally, within the transplant group, there are prognostic subsets that may be useful for evaluating future patients.
Materials and Methods
Clinical
A database derived from our weekly liver tumor board was prospectively created to record baseline tumor characteristics. This included 1322 adult patients (Table 1) with HCC, primarily from the Malatya region and surrounding Turkish provinces. The database was interrogated for predisposing hepatic diseases (when known), baseline radiological tumor characteristics, such as maximum tumor diameter (MTD), number of tumor nodules, presence of macroscopic tumor portal vein thrombosis (PVT) from CT scans, baseline serum alpha-fetoprotein (AFP) levels, standard liver function tests, and routine clinical hematology parameters. Diagnosis was made either from tumor biopsy or according to AASLD/EASL guidelines. Surgical patients were treated by liver transplantation, while the majority, being non-surgical, received systemic therapy (medical oncology with Sorafenib), locoregional therapy (chemoembolization or radioembolization in interventional radiology), or, in a few cases, only best supportive care.
Table 1.
Characteristics of the total HCC cohort (n=1322)
| n | % | |
|---|---|---|
| Gender | ||
| Female | 231 | 17.5 |
| Male | 1091 | 82.5 |
| Cirrhosis | ||
| No | 251 | 18.9 |
| Yes | 1071 | 81.1 |
| HBV | ||
| No | 545 | 41.2 |
| Yes | 777 | 58.8 |
| HCV | ||
| No | 1125 | 85.1 |
| Yes | 197 | 14.9 |
| Alcoholic | ||
| No | 1297 | 98.2 |
| Yes | 25 | 1.8 |
| Cryptogenic | ||
| No | 1204 | 91 |
| Yes | 118 | 8.9 |
| MTD (cm) | ||
| <5 cm | 818 | 61.9 |
| >5 cm | 502 | 38.1 |
| AFP IU/mL | ||
| <100 | 845 | 69.3 |
| ≥100 | 495 | 37.4 |
| PVT # (%) | ||
| No | 899 | 68.1 |
| Yes | 423 | 31.9 |
| Number of tumors | ||
| <2 | 551 | 50.9 |
| ≥2 | 532 | 49.1 |
| n | Median (Min–Max) | |
| Age | 1322 | 59 (1–89) |
| NE# (2.1–6.1) | 1322 | 3.72 (0.4–24.69) |
| LY# (1.3–3.5) | 1322 | 1.32 (0.12–18.3) |
| CRP (0–0.35) | 608 | 11.7 (3.0–129) |
| ESR (0–20) | 231 | 24 (0.15–119) |
| WBC (4.3–10.3) | 1322 | 6.2 (0.7–15) |
| HGB (13.6–17.2) | 1322 | 13 (3.6–18) |
| Platelets (150–400) | 1322 | 144 (2.64–934) |
| T. Bil (0.5–1.2) | 1322 | 1.1 (0.03–19.6) |
| Alb. (3.4–4.8) | 1322 | 3.3 (0.9–5.4) |
| Na (136–145) | 1181 | 138 (4.31–149) |
| Creat (0.72–1.25) | 1322 | 0.8 (0.2–62) |
| AST (0–34) | 1322 | 48 (9–489) |
| ALT (0–55) | 1322 | 38 (0.28–446) |
| GGT (9–64) | 1322 | 82 (8–975) |
| ALKP (40–150) | 1322 | 117 (1.2–980) |
| Cholesterol (0–199) | 1002 | 155 (11–617) |
| LDL (0–100) | 975 | 92 (1–437.4) |
| HDL (>40) | 934 | 40 (3–131) |
| AFP (0–8) | 1222 | 12.95 (0.1–118883) |
| MTD (cm) | 1222 | 3.5 (0.3–38) |
| NLR | 1313 | 2.75 (0.15–35.25) |
| APRI | 1322 | 0.93 (0.06–31.63) |
| GPR | 1322 | 67.57 (3.81–4763.64) |
NE: Neutrophils; LY: Lymphocytes; HCC: Hepatocellular carcinoma; CRP: C-reactive protein; ESR: Erythrocyte sedimentation rate; WBC: White blood cell; HGB: Hemoglobin; AST: Aspartate aminotransferase; ALT: Alanine aminotransferase; GGT: Gamma-glutamyl transferase; ALKP: Alkaline phosphatase; LDL: Low-density lipoprotein; HDL: High-density lipoprotein; AFP: Alpha-fetoprotein; maximum tumor diameter; MTD: Maximum tumor diameter; NLR: Neutrophil lymphocyte ratio; APRI: AST to platelet ratio; GPR: Glutamyl transpeptidase-to-platelet ratio.
Ethical Approval
Database management adhered to privacy legislation, and this study conforms to the ethical guidelines of the Declaration of Helsinki. Approval for this retrospective study on deceased cases and de-identified patients with HCC was granted by our Institutional Ethics Committee (Institutional Review Board Approval No. 2022-3905). A waiver from obtaining written informed consent was approved for de-identified and mostly deceased patients, in accordance with local guidelines.
Statistical Analysis
The normal distribution of quantitative variables was tested using the Shapiro-Wilk test and summarized by median, minimum, and maximum values. For comparisons of two independent groups, the Mann-Whitney U test was used. The distribution of qualitative variables was presented by count (percentage), and chi-square tests (Pearson or continuity-corrected, where appropriate) were used for comparisons. Different superscript letters indicate significant differences between column proportions in tables as appropriate. Survival analyses were performed using the Kaplan-Meier method, Log-Rank test, and Cox regression analysis. The two-tailed significance level was set at 0.05. All statistical analyses were conducted using IBM SPSS Statistics for Windows, Version 25.0 (IBM Corp, Armonk, NY).
Results
Patient Demographics
The patient demographics are presented in Table 1. Males predominated (82.5%), and most patients had cirrhosis (81.1%). The predominant etiological predisposing cause was HBV (58.8%), followed by HCV (14.9%) and cryptogenic cirrhosis (8.9%), with minimal cases associated with alcoholism. Most patients had small HCC tumors <5 cm (61.9%), and low serum alpha-fetoprotein (AFP) levels (69.3%). Macroscopic portal vein thrombosis (PVT) was present in 31.9% of the total cohort, and approximately half of the total cohort had multifocal HCC. Median serum parameters were as follows: total bilirubin 1.1 mg/dL, albumin 3.3 g/dL, aspartate aminotransferase (AST) 48 IU/L, gamma-glutamyl transferase (GGT) 82 IU/L, and AFP 12.95 IU/mL with a wide range (0.1–118883), C-reactive protein (CRP) level 11.7 mg/dL, and erythrocyte sedimentation rate (ESR) 24 mm/hr (Table 1).
Patient Survival in Transplant and No-Surgery Patients
Survival was analyzed after dividing patients into a surgical group (majority undergoing liver transplant) and a no-surgery group who received locoregional therapies, sorafenib, or best supportive care (BSC). The median survival of the transplant group (n=434) was 88.73 months, whereas the median survival of the no-surgery group (n=548) was 12.93 months (Table 2 and cumulative survival Figure 1). The patient numbers in this table total only 1092, as many no-surgery patients were lost to follow-up once referred elsewhere for care.
Table 2.
Survival analysis: transplant versus no-surgery
| Treatment group | Kaplan-Meier analysis | Univariate Cox regression | |||
|---|---|---|---|---|---|
| Survival (mo.) Mean±SE | Survival (mo.) Mean±SE | Log-rank p | HR (95% CI) | HR p | |
| Transplant (n=434) | 93.58±4.61 | 88.73±9.50 | <0.001 | Reference | |
| No surgery (n=548) | 20.39±2.75 | 12.93±2.93 | 4.243 (3.171–5.678) | <0.001 | |
SE: Standard error; HR: Hazard ratio; CI: Confidence interval.
Figure 1.
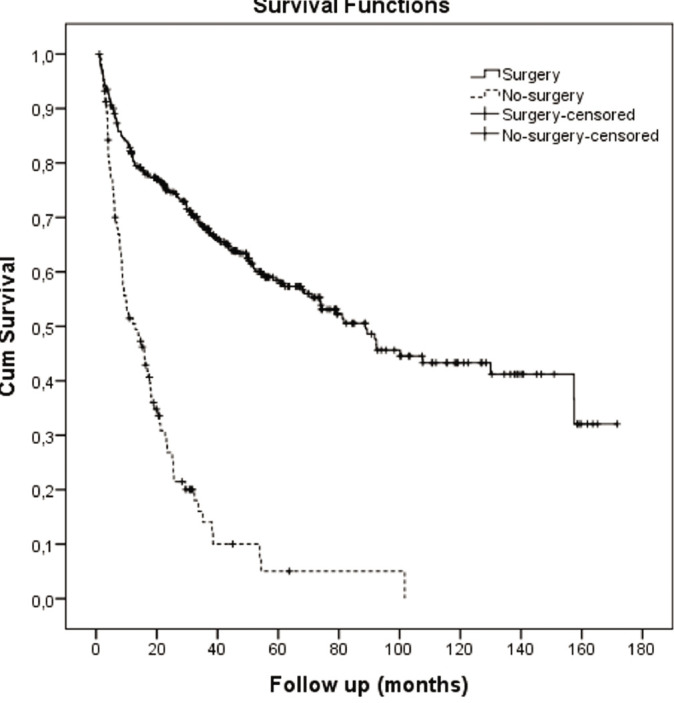
Kaplan-Meier survival graph: transplant vs. no-surgery.
Baseline clinical features of the transplant and no-surgery groups were then compared, as shown in Table 3. Notably, the transplant group had a significantly higher proportion of patients with HBV (transplant 70.9% vs. no-surgery 19%), while the no-surgery group had more HCV (no-surgery 44.6% vs. transplant 17.4%). There were major differences in maximum tumor diameter (MTD) between the two groups, with 80.9% of the transplant group having small tumors with MTD <5 cm compared to 54.0% for the no-surgery group (Table 3a). Conversely, 17.7% of the no-surgery patients had massive HCCs (>10 cm) versus only 0.3% for the transplant patients. These differences were mirrored in the percentages of patients in the three AFP groups, with the majority (78.8%) of transplant patients having low serum AFP <100 IU/mL compared to 67.3% of the no-surgery patients. Patients with very high serum AFP levels >1000 IU/mL were predominantly in the no-surgery group (no-surgery 18.1% vs. transplant 5.8%). Interestingly, the two groups were similar with regard to the percentage of patients with PVT (25.0% transplant vs. 28.0% no-surgery) and tumor multifocality (47.7% vs. 48%). Evidence of portal hypertension (thrombocytopenia) and liver dysfunction (elevated serum total bilirubin, AST, alanine aminotransferase [ALT], alkaline phosphatase [ALKP] levels, and decreased albumin levels) was greater in the transplant group (Table 3b), as liver transplantation is a curative treatment for liver failure. The systemic inflammation markers, platelet-to-lymphocyte ratio (PLR), gamma-glutamyl transpeptidase-to-platelet ratio (GPR), and aspartate aminotransferase-to-platelet ratio index (APRI), yielded conflicting results.
Table 3a.
Patient characteristics in the surgery and no-surgery groups. Demographics: Transplant versus no-surgery
| Surgery (%) | No-surgery (%) | p | |
|---|---|---|---|
| Gender | |||
| Female | 13.1 | 22.6 | <0.001 |
| Male | 86.9 | 77.3 | |
| HCV | |||
| No | 82.4 | 55.3 | <0.001 |
| Yes | 17.4 | 44.6 | |
| HBV | |||
| No | 29.0 | 81 | <0.001 |
| Yes | 70.9 | 19 | |
| Alcoholic | |||
| No | 100 | 97.0 | 0.163 |
| Yes | 0 | 2.8 | |
| Cryptogenic | |||
| No | 88.2 | 88.7 | 0.219 |
| Yes | 11.7 | 9.2 | |
| MTD | |||
| ≤5 cm | 80.9a | 54.0b | <0.001 |
| >5–10 cm | 18.9a | 28.3b | |
| >10 cm | 1(0.2)a | 17.7b | |
| AFP | |||
| <100 | 78.8a | 67.3b | <0.001 |
| 100–1000 | 15.3a | 14.6a | |
| >1000 | 5.8a | 18.1b | |
| PVT | |||
| No | 75.0 | 72.0 | 0.247 |
| Yes | 25.0 | 28.0 | |
| Number of tumors | |||
| 1 | 52.2 | 52.0 | 0.542 |
| >1 | 47.7 | 48.0 | |
| Platelets | |||
| <100 | 48.6a | 19.8b | <0.001 |
| 100–250 | 40.8a | 50.0b | |
| >250 | 10.6a | 30.2b |
a, b: Superscript letters indicate the difference between the column proportions. HCV: Hepatitis C virus; HBV: Hepatitis B virus; MTD: Maximum tumor diameter; AFP: Alpha-fetoprotein; PVT: Portal vein thrombosis.
Table 3b.
Patient characteristics in the surgery and no-surgery groups. Laboratory characteristics: Surgery versus no-surgery
| Transplant Median (Min–Max) | No-surgery Median (Min–Max) | p | |
|---|---|---|---|
| Age | 56 (1–82) | 61 (6–87) | <0.001 |
| NE# (2.1–6.1) | 3.2 (0.4–14.1) | 4.1 (0.4–24.7) | <0.001 |
| LY# (1.3–3.5) | 1.2 (0.2–18) | 1.5 (0.1–18.3) | <0.001 |
| CRP (0–0.35) | 1.3 (0.2–129) | 1 (0.1–127) | 0.076 |
| ESR | 18.5 (1–109) | 28.5 (0.2–119) | 0.034 |
| WBC (4.3–10.3) | 5.4 (0.7–15) | 6.6 (1–14.9) | <0.001 |
| HGB (13.6–17.2) | 13 (6.3–18) | 13.1 (3.6–18) | 0.066 |
| Platelets (150–400) | 101.5 (16–640) | 176.5 (2.6–934) | <0.001 |
| T. Bil (0.5–1.2) | 1.6 (0.1–17.3) | 0.9 (0–14.5) | <0.001 |
| Albumin (3.4–4.8) | 3 (1–5.2) | 3.5 (0.9–5.4) | <0.001 |
| Sodium (136–145) | 136 (19–149) | 138 (4.3–148) | <0.001 |
| Creat (0.72–1.25) | 0.8 (0.3–13.8) | 0.8 (0.4–62) | 0.055 |
| AST (0–34) | 54 (9–489) | 41 (9–470) | <0.001 |
| ALT (0–55) | 39 (5–446) | 34 (0.3–321) | 0.001 |
| GGT (9–64) | 67.5 (11–719) | 91 (8–975) | <0.001 |
| ALKP (40–150) | 113.5 (24–810) | 119 (1.2–980) | 0.008 |
| AFP (0–8) | 11.1 (0.2–29528) | 11.9 (0.1–118883) | 0.115 |
| MTD (cm) | 3 (0.3–12) | 5 (0.4–58) | <0.001 |
| PVT # (%) | 116 (26.1) | 200 (22.8) | 0.247 |
| PLR | 86.79 (2.61–610) | 115.63 (1.66–1061.36) | <0.001 |
| APRI | 1.4 (0.08–31.63) | 0.67 (0.06–29.36) | <0.001 |
| GPR | 75.3 (4.36–700) | 59.23 (3.81–4763.64) | 0.004 |
NE: Neutrophils; LY: Lymphocytes; HCC: Hepatocellular carcinoma; CRP: C-reactive protein; ESR: Erythrocyte sedimentation rate; WBC: White blood cell; HGB: Hemoglobin; AST: Aspartate aminotransferase; ALT: Alanine aminotransferase; GGT: Gamma-glutamyl transferase; ALKP: Alkaline phosphatase; LDL: Low-density lipoprotein; HDL: High-density lipoprotein; AFP: Alpha-fetoprotein; maximum tumor diameter; MTD: Maximum tumor diameter; NLR: Neutrophil lymphocyte ratio; APRI: AST to platelet ratio; GPR: Glutamyl transpeptidase-to-platelet ratio.
Transplant Patients and Survival
Factors associated with survival in the transplant group were analyzed. Tumor and liver factors were dichotomized according to previously established receiver operating characteristic curve (ROC) cutoffs,[3] and the associated survivals were then calculated (Table 4). Table 4a shows the effects on survival of various parameters using both Kaplan-Meier and univariate Cox regression analysis. Four parameters—MTD and serum AFP, GGT, and blood platelet levels—had significant Log-Rank p-values and Hazard Ratio (HR) p-values, while the presence of PVT and elevated AST levels adversely influenced survival, but not significantly.
Table 4a.
Survival analysis of transplant group. Transplant cohort survival subsets
| Kaplan-Meier analysis | Univariate Cox regression | ||||
|---|---|---|---|---|---|
| *Survival Mean±SE | *Survival Mean±SE | Log-rank p | HR (95% CI) | HR p | |
| MTD | |||||
| <5 cm (n=340) | 94.94±5.12 | 89.37±13.58 | 0.006 | Reference | |
| ≥5 cm (n=94) | 72.67±9.35 | 37.30±10.13 | 1.701 (1.159–2.498) | 0.007 | |
| PVT | |||||
| No (n=352) | 95.76±4.98 | 100.20±20.75 | 0.073 | Reference | |
| Yes (n=82) | 61.18±3.78 | 73.77±20.94 | 1.465 (0.962–2.231) | 0.075 | |
| Number of nodules | |||||
| 1 (n=223) | 92.62±6.43 | 89.37±NA | 0.944 | Reference | |
| >1(n=211) | 88.81±6.25 | 81.63±9.92 | 0.988 (0.701–1.392) | 0.944 | |
| AFP | |||||
| <100 (n=334) | 101.10±5.23 | 100.20±19.26 | 0.002 | Reference | |
| ≥100 (n=100) | 63.43±7.79 | 38.97±12.06 | 1.815 (1.238–2.661) | 0.002 | |
| T. Bil | |||||
| <1.5 (n=183) | 94.29±6.39 | 91.83±25.65 | 0.972 | Reference | |
| ≥1.5 (n=251) | 91.15±6.29 | 81.63±9.06 | 1.006 (0.725–1.396) | 0.972 | |
| GGT | |||||
| <50 (n=280) | 104.94±5.67 | 157.43±28.97 | 0.001 | Reference | |
| ≥50 (n=154) | 67.24±5.98 | 51.97±6.93 | 1.740 (1.250–2.423) | 0.001 | |
| AST | |||||
| <40 (n=331) | 96.48±4.93 | 107.63±20.10 | 0.066 | Reference | |
| ≥40 (n=103) | 73.89±9.31 | 52.53±10.06 | 1.414 (0.973–2.048) | 0.067 | |
| Albumin | |||||
| ≥3.5 (n=111) | 87.18±8.29 | 67.97±12.04 | 0.388 | Reference | |
| <3.5 (n=323) | 94.93±5.33 | 89.37±9.81 | 0.852 (0.591–1.227) | 0.388 | |
| Platelets | |||||
| <125 (n=282) | 99.60±5.52 | 92.37±20.18 | 0.025 | Reference | |
| ≥125 (n=152) | 77.63±7.51 | 55.40±12.17 | 1.470 (1.046–2.066) | 0.026 | |
: Survival, months. MTD: Maximum tumor dimension; PVT: Portal vein thrombosis; GGT: Gamma glutamyl transpeptidase; AST: Aspartate amino transferase; AFP: Alpha-fetoprotein; T. Bili: Total bilirubin; NA: Not available; HR: Hazard ratio; CI: Confidence interval.
A similar approach was taken for patients with elevated serum AFP levels (Table 4b), but no factor had a significant p-value, although large MTD came close (p=0.062).
Table 4b.
Survival analysis of transplant group. Survival analysis for Transplant group surviving >30 days, AFP≥100 IU/mL patients
| Kaplan-Meier analysis | Univariate Cox regression | ||||
|---|---|---|---|---|---|
| *Survival Mean±SE | *Survival Mean±SE | Log-rank p | HR (95% CI) | HR p | |
| MTD | |||||
| <5 cm (n=60) | 71.03±9.72 | 61.80±20.28 | 0.058 | Reference | |
| ≥5 cm (n=34) | 43.45±11.61 | 22.97±8.58 | 1.885 (0.968–3.670) | 0.062 | |
| GGT | |||||
| <50 (n=57) | 71.16±10.60 | 38.97±17.76 | 0.300 | Reference | |
| ≥50 (n=37) | 52.70±10.75 | 21.97±18.93 | 1.413 (0.733–2.724) | 0.302 | |
| AST | |||||
| <40 (n=65) | 68.69±9.28 | 51.97±20.32 | 0.376 | Reference | |
| ≥40 (n=29) | 37.48±6.11 | 29.73±5.95 | 1.386 (0.671–2.862) | 0.378 | |
: Survival, months. MTD: Maximum tumor dimension; GGT: Gamma glutamyl transpeptidase; AST: Aspartate; amino transferase; HR: Hazard ratio; CI: Confidence interval.
Given that the presence of PVT is considered the worst prognostic factor for HCC patients, yet is present in 25% of the transplant patients in this study, we explored whether there might be prognostic subsets within the PVT-associated transplant patient group (Table 4c). Serum GGT and AFP levels were found to be significant for survival within this PVT-associated group. Patients with lower levels of either GGT or AFP had more than double the median survival of patients with elevated levels of these two parameters; PVT patients with the combination of low AFP plus low GGT levels had a five-fold greater median survival compared to patients with elevated AFP plus GGT levels (81.63 mo. vs 15.87 mo).
Table 4c.
Survival analysis of transplant group. Survival analysis for PVT+ve Transplant patients surviving >30 days
| Kaplan-Meier analysis | Univariate Cox regression | ||||
|---|---|---|---|---|---|
| *Survival Mean±SE | *Survival Mean±SE | Log-rank p | HR (95% CI) | HR p | |
| MTD | |||||
| <5 cm (n=41) | 59.69±7.55 | 73.77±17.60 | 0.681 | Reference | |
| ≥5 cm (n=15) | 65.44±12.41 | 81.63±47.87 | 0.837 (0.359–1.952) | 0.681 | |
| GGT | |||||
| <50 (n=34) | 72.27±8.24 | 81.63±5.18 | 0.028 | Reference | |
| ≥50 (n=22) | 44.58±8.84 | 33.70±11.53 | 2.265 (1.069–4.800) | 0.033 | |
| AST | |||||
| <40 (n=47) | 60.37±7.50 | 73.77±19.42 | 0.977 | Reference | |
| ≥40 (n=9) | 53.44±11.81 | 74.17±24.40 | 0.986 (0.374–2.597) | 0.977 | |
| AFP | |||||
| <100 (n=40) | 71.49±8.50 | 81.63±5.79 | 0.022 | Reference | |
| ≥100 (n=15) | 38.68±8.61 | 30.40±12.79 | 2.370 (1.109–5.067) | 0.026 | |
| AFP & GGT | |||||
| <100 & <50 (n=29) | 76.72±8.68 | 81.63±8.22 | 0.011 | Reference | |
| ≥100 & ≥50 (n=10) | 39.05±10.90 | 15.87±21.82 | 3.179 (1.246–8.109) | 0.016 | |
: Survival, months. PVT: Portal vein thrombosis; MTD: Maximum tumor dimension; GGT: Gamma glutamyl transpeptidase; AST: Aspartate amino transferase; AFP: Alpha-fetoprotein; HR: Hazard ratio; CI: Confidence interval.
An identical analytical approach was applied to patients with both PVT and large tumors (Table 4d). However, significant prognostic subsets could not be identified, likely due to small patient numbers. Nevertheless, patients with low levels of serum GGT had a two-fold increase in median survival, though not significantly, while patients with low serum AFP levels had a seven-fold increase in median survival, again without statistical significance due to low patient numbers.
Table 4d.
Survival analysis of transplant group. Survival analysis for Transplant patients surviving >30 days, PVT+ve and MTD≥5 cm
| Kaplan-Meier analysis | Univariate Cox regression | ||||
|---|---|---|---|---|---|
| *Survival Mean±SE | *Survival Mean±SE | Log-rank p | HR (95% CI) | HR p | |
| GGT | |||||
| <50 (n=8) | 68.69±12.03 | 81.63±43.56 | 0.349 | Reference | |
| ≥50 (n=7) | 51.71±17.52 | 39.77±43.56 | 1.975 (0.463-8.431) | 0.358 | |
| AST | |||||
| <40 (n=11) | 58.46±13.38 | 39.77±33.04 | 0.367 | Reference | |
| ≥40 (n=4) | 73.11±18.04 | NA | 0.393 (0.048-3.209) | 0.384 | |
| AFP | |||||
| <100 (n=11) | 79.24±14.66 | 81.63±NA | 0.078 | Reference | |
| ≥100 (n=4) | 34.28±19.39 | 11.67±6.17 | 3.307 (0.811-13.477) | 0.095 | |
| AFP & GGT | |||||
| <100 & <50 (n=6) | 87.78±4.35 | 81.63±NA | 0.259 | Reference | |
| ≥100 & ≥50 (n=2) | 51.75±40.08 | 11.67±NA | 3.766 (0.324-43.719) | 0.289 | |
: Survival, months. PVT: Portal vein thrombosis; MTD: Maximum tumor dimension; GGT: Gamma glutamyl transpeptidase; AST: Aspartate amino transferase; AFP: Alpha-fetoprotein; HR: Hazard ratio; CI: Confidence interval.
Patients with PVT in the Transplant versus No-Surgery Groups
The percentage of patients with PVT was similar in the transplant and no-surgery groups (Table 3), despite a large survival difference between the two groups. To examine this observation further, PVT-positive transplant and PVT-positive no-surgery groups were compared (Table 5). The majority of patients in each subgroup had small tumors <5 cm (76.8% transplant vs. 59.4% no-surgery, p=0.234), although there were more in the transplant group. AFP levels were significantly different, with more patients having low serum AFP <100 IU/mL in the transplant group (72.7% transplant vs. 54.6% no-surgery, p=0.007). Furthermore, there were significantly more patients in the no-surgery group with very high AFP levels >1000 IU/mL (33.3% no-surgery vs. 7.3% transplant). Thus, transplant patients with PVT also had less aggressive tumors than the no-surgery patients (Tables 5a, b). As noted in the transplant versus no-surgery cohorts of Tables 3b and 5b, cirrhosis (thrombocytopenia) and liver dysfunction (elevated total bilirubin and AST, lower albumin) were more severe in the transplant group. The median survival of these PVT-positive patients was significantly better in the surgery (55 liver transplant) compared to the no-surgery group (73.7 months vs. 8.7 months, p<0.001), as shown in Table 5c and Figure 2.
Table 5a.
PVT positive patients in surgery and no-surgery groups. PVT positive patients, transplant versus no-surgery: demographics
| Surgery (%) | No-surgery (%) | p | |
|---|---|---|---|
| Gender | |||
| Female | 8 (14.3) | 10 (30.3) | 0.123 |
| Male | 48 (85.7) | 23 (69.7) | |
| MTD | |||
| ≤5 cm | 43 (76.8) | 19 (59.4) | 0.234 |
| >5–10 cm | 12 (21.4) | 12 (37.5) | |
| >10 cm | 1 (1.8) | 1 (3.1) | |
| AFP | |||
| <100 | 40 (72.7)a | 18 (54.6)a | 0.007 |
| 100–1000 | 11 (20.0)a | 4 (12.1)a | |
| >1000 | 4 (7.3)a | 11 (33.3)b | |
| PLT | |||
| <100 | 25 (44.6)a | 4 (12.1)b | <0.001 |
| 100–250 | 28 (50.0)a | 17 (51.5)a | |
| >250 | 3 (5.4)a | 12 (36.4)b |
a, b: Superscript letters indicate the difference between the column proportions. PVT: Portal vein thrombosis; MTD: Maximum tumor dimension; AFP: Alpha-fetoprotein; PLT: Platelet.
Table 5b.
PVT positive patients in surgery and no-surgery groups. Laboratory characteristics in PVT positive patients: transplant versus no-surgery.
| Surgery | No-surgery | ||||
|---|---|---|---|---|---|
| n | Median (Min–Max) | n | Median (Min–Max) | p | |
| Platelets (150–400) | 56 | 102.5 (34–528) | 33 | 212.5 (24–691) | <0.001 |
| T. Bil. (0.5–1.2) | 56 | 1.71 (0.3–12.5) | 33 | 0.7 (0.28–2.45) | <0.001 |
| Albumin (3.4–4.8) | 56 | 2.9 (1.6–4.5) | 33 | 3.6 (1.7–4.9) | <0.001 |
| AST (0–34) | 56 | 57.5 (24–248) | 33 | 34 (13–128) | <0.001 |
| ALT (0–55) | 56 | 36.5 (5–165) | 33 | 32 (0.28–128) | 0.079 |
| GGT (9–64) | 56 | 76 (17–719) | 33 | 126 (17–681) | 0.120 |
| ALKP (40–150) | 56 | 133.5 (37–810) | 33 | 128 (39–385) | 0.538 |
| AFP (0–8) | 55 | 10.1 (0.68–14560) | 33 | 59.8 (0.2–19211.6) | 0.461 |
| MTD (cm) | 56 | 2.8 (1–12) | 32 | 4.4 (1–12) | 0.081 |
PVT: Portal vein thrombosis; AST: Aspartate aminotransferase; ALT: Alanine aminotransferase; GGT: Gamma-glutamyl transferase; ALKP: Alkaline phosphatase; AFP: Alpha-fetoprotein; maximum tumor diameter; MTD: Maximum tumor diameter.
Table 5c.
Survival analysis of transplant group. Survival analysis: PVT positive transplant versus no-surgery (patients surviving >30 days)
| Treatment group | Kaplan-Meier analysis | Univariate Cox regression | |||
|---|---|---|---|---|---|
| *Survival (mo.) Mean±SE | *Survival (mo.) Mean±SE | Log-rank p | HR (95% CI) | HR p | |
| Surgery (n=56) | 61.18±6.78 | 73.77±20.94 | <0.001 | Reference | |
| No-surgery (n=33) | 13.65±1.89 | 8.70±2.68 | 4.313 (2.310–8.054) | <0.001 | |
: Survival, months; HR: Hazard ratio; CI: Confidence interval.
Figure 2.
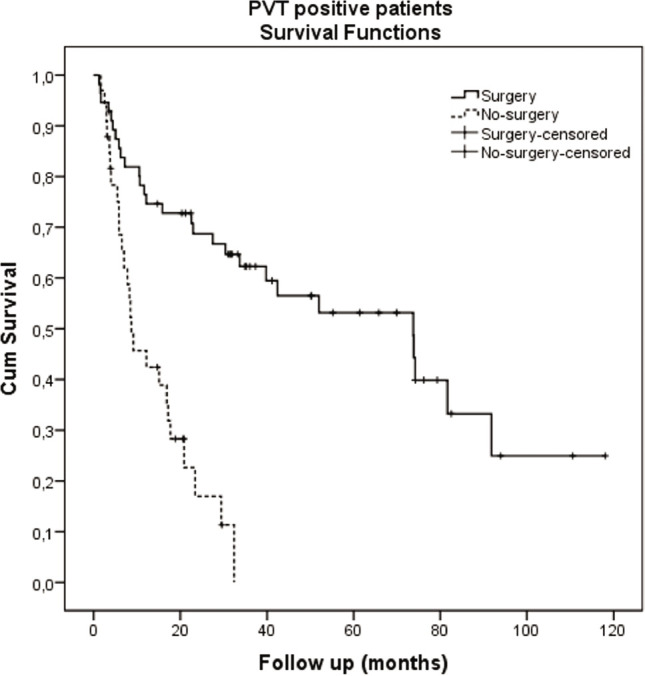
Kaplan-Meier survival graph of PVT positive patients: transplant vs. no-surgery.
No-Surgery Patients and Survival
Table 2 illustrates the markedly decreased survival for patients not treated by transplant. The accompanying graph shows a significant decline in cumulative survival within the first 12 months, and no prognostic subsets could be identified among them (data not shown). For those no-surgery patients who survived beyond 12 months, the only significant survival differences were observed in the albumin groups (Table 6a and Figure 3). Additionally, no significant survival effects were found when comparing different locoregional medical therapies, such as chemoembolization or radioembolization (Table 6b).
Table 6a.
Survival analysis of the no-surgery group. Survival analysis (survivals>12 mo) for no-surgery group
| Kaplan-Meier analysis | |||
|---|---|---|---|
| *Survival time Mean±SE | Survival time Mean±SE | Log-rank p | |
| MTD | 0.709 | ||
| <5 cm | 36.79±6.60 | 23.43±3.25 | |
| ≥5 cm | 28.48±3.56 | 25.47±4.98 | |
| PVT | 0.129 | ||
| No | 38.12±5.87 | 25.47±6.16 | |
| Yes | 23.18±2.21 | 20.83±3.57 | |
| Number of nodules | 0.171 | ||
| 1 | 28.10±3.70 | 21.17±2.00 | |
| >1 | 38.12±6.56 | 35.13±7.46 | |
| AFP | 0.809 | ||
| <100 | 30.52±3.38 | 23.43±3.35 | |
| ≥100 | 39.46±11.55 | 25.43±4.03 | |
| T. Bil | 0.981 | ||
| <1.2 | 32.12±4.96 | 25.47±1.83 | |
| ≥1.2 | 30.15±5.22 | 18.17±4.56 | |
| GGT | 0.673 | ||
| <100 | 29.44±2.71 | 25.43±1.89 | |
| ≥100 | 40.99±10.99 | 25.17±7.39 | |
| Albumin | 0.047 | ||
| ≥3.5 | 36.04±4.25 | 32.37±5.44 | |
| <3.5 | 27.07±4.41 | 20.83±2.54 | |
| Platelets | 0.769 | ||
| <125 | 30.95±4.00 | 23.43±1.84 | |
| ≥125 | 34.71±6.48 | 25.43±2.60 | |
: Survival, months; MTD: Maximum tumor dimension; PVT: Portal vein thrombosis; GGT: Gamma glutamyl transpeptidase; AFP: Alpha-fetoprotein; T. Bili: Total bilirubin.
Figure 3.
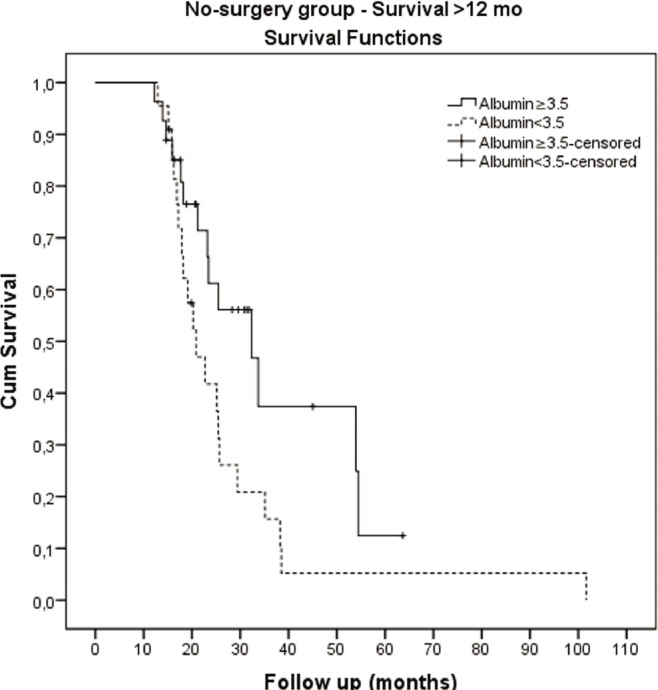
Kaplan-Meier survival graph of no-surgery patients. Albumin ≥3.5 vs <3.5.
Table 6b.
Survival analysis of the no-surgery group. Survival analysis (survivals >30 days) for no-surgery group by treatment
| Kaplan-Meier analysis | |||
|---|---|---|---|
| Survival time Mean±SE | Survival time Mean±SE | Log-rank p | |
| Medical+TARE (n=89) | 17.41±1.89 | 10.73±2.78 | 0.259 |
| TACE (n=14) | 29.72±9.57 | 15.93±0.86 | |
| Medical+TACE (n=29) | 28.00±6.73 | 15.87±2.94 | 0.170 |
| TARE (n=74) | 16.03±1.70 | 10.10±3.08 | |
Medical includes Sorafenib plus Best Supportive Care; TACE: Transarterial chemoembolization; TARE: Transarterial radioembolization.
Discussion
The results presented provide a snapshot of HCC seen in a major tertiary referral center in our part of Turkiye (Table 1). The 4:1 gender ratio is typical for this region, and 81.1% of the patients had cirrhosis. The most common predisposing disease was HBV, followed by HCV, with little alcoholism (reflecting the Muslim country) and 8.9% of patients had cryptogenic cirrhosis, although a large portion of that is likely previously unrecognized metabolic-associated cirrhosis. The majority of the patients had relatively small (<5 cm) tumors at baseline presentation (61.9%) and low AFP levels (69.3%). PVT was present in 31.9%, consistent with other series,[4] and half the patients had unifocal tumors. Serum parameters included median total bilirubin and alanine aminotransferase (ALT) levels within the normal range, but slightly elevated median aspartate aminotransferase (AST), alkaline phosphatase (ALKP), and gamma-glutamyl transferase (GGT) levels, and slightly low albumin levels.
Although this is a major liver transplant center, the clinical data for no-surgery patients were also documented at baseline, as well as their survival, when follow-up was feasible, as shown in Tables 2 and 3. A major finding of this paper was the seven-fold survival difference between the transplant group and all other patients, which is unsurprising and consistent with the literature.[5] It is hoped that the large number of newly approved drugs, especially immune checkpoint inhibitor agents, might narrow this gap in the coming years. The sequencing and possible combinations of the newer (kinase inhibitors, immune checkpoint inhibitors, cell signaling inhibitors) and older (chemoembolization, radioembolization) no-surgery agents are the subject of intense current clinical trial activity.
The transplant and no-surgery patients were then compared for their clinical characteristics (Table 3), in view of the large survival differences seen in Table 2. The main differences related to etiology, with more HBV in the transplant group (70.9% vs. 19%) and more HCV in the no-surgery group (44.6% vs. 16.4%). Perhaps this related to maximum tumor diameter (MTD), but the percentages of patients with PVT and multifocality were similar in the two treatment groups. Small tumors of <5 cm constituted 80.9% of the transplant patients (consistent with the Milan criteria), but only 54% of the no-surgery patients, whereas very large tumors were almost entirely confined to the no-surgery group. Similarly, patients with low serum AFP levels constituted 78.8% of the transplant group vs. 67.3% of the no-surgery group, and as with MTD, patients with extremely high AFP levels were mainly in the no-surgery group (18.1% vs. 5.8%). Surprisingly, the incidence of both PVT and multifocality was similar in the two treatment groups. As shown in the results section, liver function was worse in the transplant group (higher total bilirubin, AST, and ALT, with lower albumin levels), but their survival was much better than for no-surgery patients, as liver transplantation is curative for liver failure.
The transplant patients were further examined. Their tumor and liver function parameters were dichotomized, and four parameters showed significantly different survival within their parameter pairs. These were serum AFP, GGT, MTD, and platelets (Table 4a), with all four having significant hazard ratios, the highest being for AFP, followed closely by GGT. The reason for the significance of platelets is unclear (Tables 3 and 4), although they had the lowest of the significant hazard ratios, and thrombocytopenia is regarded as a cirrhosis surrogate.[6,7] Probably the advanced cirrhosis and associated portal hypertension caused these patients to get diagnosed earlier with resulting definitive therapy by liver transplantation. Given the prognostic importance for liver transplantation of high AFP levels, we looked for survival subsets in this group (Table 4b), but only MTD <5 cm came close.
The other major prognostic factor for liver transplantation for HCC is the presence of PVT.[8] Parameter dichotomization (Table 4c) showed that both AFP and GGT were significant for survival, and especially the combination of these two parameters, which revealed a five-fold survival difference in these PVT patients (81.63 months for low parameter levels vs. 15.87 months for high parameter levels, hazard ratio of 3.179). These observations have potential usefulness in the selection for liver transplantation of appropriate HCC patients with PVT in the future. A further subgroup analysis of HCC patients with PVT was then made, focusing on PVT-positive patients with large tumors (Table 4d). Although the combination of AFP plus GGT again showed survival differences, the very small patient numbers in this sub-subgroup precluded statistical significance. PVT-positive patients were then compared with respect to transplant versus no-surgery treatment groups. There was a nine-fold survival difference in favor of the transplant surgery group, with a hazard ratio of 4.313, p<0.001 (Table 4c). The transplant patients had smaller tumors and lower AFP levels, which likely helped explain the big survival advantage, in addition to the fact of the treatment itself being the major cause of the survival advantage. These findings suggest that HCC patients with PVT and low serum AFP and GGT levels might be suitable for treatment with liver transplantation. In a large series of transarterial radioembolization (TARE) treatment for PVT-positive HCC patients, the median overall survival was 7–13 months, depending on liver and tumor factors.[9] Others have also shown significantly increased survival of these PVT patients with surgery compared to no-surgery treatments.[10]
The no-surgery group was approached similarly, using parameter dichotomization, but only serum albumin levels were found to be significant (Table 6a and Figure 3). The no-surgery group included patients treated with sorafenib, regional interventional therapies of transarterial chemoembolization (TACE) or TARE, or best supportive care (Table 6b). Patients with regional interventional therapies were compared to the rest of the no-surgery group, but neither appeared to offer a particular survival advantage (15.93 months for TACE and 10.1 months for TARE) compared to the other no-surgery patients at the time of writing (median survival of 12.93 months as shown in the graph within Table 2). Although survival rates for non-surgical management have been increasing in recent years, none of them approaches the results of surgery. TACE and TARE seem to offer similar survival on meta-analysis,[11] and survival of 17–18 months on direct comparison.[12] The median overall survival after Sorafenib was 10.7 months,[13] while the median overall survival was recently reported to be 19 months for the combination of atezolizumab plus bevacizumab,[14] which has now become an approved first-line therapy for no-surgery HCC patients. However, the median survivals continue to increase, as new combinations emerge, such as the recently published combination of immune checkpoint inhibitor camrelizumab plus tyrosine kinase inhibitor rivoceramib yielding overall survival of 22.1 months versus sorafenib of 15.2 months;[15] although sorafenib appears increasingly outmoded.
Conclusion
Some strengths of this study include the large patient number from a single institution and the ability to evaluate both transplant and no-surgery patients who were evaluated by the same team and conditions. Disadvantages include the large loss to follow-up and thus survival data in the no-surgery cohort and the non-randomized nature of the treatment groups. Indeed, other than noting the large survival differences and thus stressing once again the importance of liver transplantation in this disease, the two groups are non-comparable. Notwithstanding these considerations, this analysis reinforces the idea that when transplant is possible, it produces much better survival results than any no-surgery therapies so far, despite our non-inclusion of patients treated with immune checkpoint inhibitors, which are not yet covered by insurance for HCC in this country. Also, the 80 plus months of survival in transplant patients with PVT and having low serum levels of AFP or GGT might suggest a future controlled study of the inclusion of such PVT patients for liver transplant eligibility. The results also suggest the importance of downstaging efforts to get more of the advanced-stage patients to be within the (slowly expanding)[16] criteria for liver transplantation.
Ethics Committee Approval
The Inonu University Clinical Research Ethics Committee granted approval for this study (date: 04.10.2022, number: 2022- 3905).
Author Contributions
Concept – BIC; Design – BIC; Supervision – BIC; Fundings – BIC; Materials – SY, BI, VI, AB; Data Collection and/or Processing – SY, BI, VI, AB; Analysis and/or Interpretation – HB; Literature Search – BIC; Writing – BIC, SY; Critical Reviews – BIC, SY, VI.
Conflict of Interest
The authors have no conflict of interest to declare.
Use of AI for Writing Assistance
Not declared.
Financial Disclosure
This work was supported in part by NIH grant CA 82723 (B.I.C).
Peer-review
Externally peer-reviewed.
How to cite this article: Carr BI, Bag H, Ince V, Isik B, Baskiran A, Yilmaz S, et al. Transplant and non-transplant HCC patients at a single institution. Hepatology Forum 2024; 5(2):77–86.
References
- 1.Hepatocellular Carcinoma. 3rd Edition. Switzerland: Springer International Publishing; 2016. Diagnosis and treatment. (Ed. Carr BI) [Google Scholar]
- 2.Liver Cancer in the Middle East . 2021. Springer Nature Switzerland AG. (Ed Carr BI) [Google Scholar]
- 3.Carr BI, Ince V, Bag HG, Ersan V, Usta S, Yilmaz S. Microscopic vascular invasion by hepatocellular carcinoma in liver transplant patients. Clin Pract (Lond) 2020;17(3):1497–1505. [PMC free article] [PubMed] [Google Scholar]
- 4.Guzelbulut F, Karaogullarindan U, Akkiz H, Alintas E, Demirtas CO, Bahadir O, et al. Characteristics of patients with hepatocellular carcinoma; a multicener study. Hepatol Forum. 2022;3(3):71–76. doi: 10.14744/hf.2022.2022.0028. [DOI] [PMC free article] [PubMed] [Google Scholar]
- 5.Kim JH, Sinn DH, Gwak GY, Choi GS, Kim JM, Kwon CHD, et al. Factors determining long-term outcomes of hepatocellular carcinoma within the Milan criteria: liver transplantation versus locoregional therapy: A retrospective cohort study. Medicine (Baltimore) 2016;95(35):e4735. doi: 10.1097/MD.0000000000004735. [DOI] [PMC free article] [PubMed] [Google Scholar]
- 6.Peck-Radosavljevic M. Thrombocytopenia in chronic liver disease. Liver Int. 2017;37(6):778–793. doi: 10.1111/liv.13317. [DOI] [PubMed] [Google Scholar]
- 7.Lu SN, Wang JH, Liu SL, Hung CH, Chen CH, Tung HD, et al. Thrombocytopenia as a surrogate for cirrhosis and a marker for the identification of patients at high-risk for hepatocellular carcinoma. Cancer. 2006;107(9):2212–2222. doi: 10.1002/cncr.22242. [DOI] [PubMed] [Google Scholar]
- 8.Sotiropoulos GC, Radtke A, Schmitz KJ, Molmenti EP, Schroeder T, Saner FH, et al. Liver transplantation in the setting of hepatocellular carcinoma and portal vein thrombosis: a challenging dilemma? Dig Dis Sci. 2008;53(7):1994–1999. doi: 10.1007/s10620-007-0099-4. [DOI] [PubMed] [Google Scholar]
- 9.Abouchaleh N, Gabr A, Ali R, Al Asadi A, Mora RA, Kallini JR, et al. 90Y radioembolization for locally advanced hepatocellular carcinoma with portal vein thrombosis: Long-term outcomes in a 185-patient cohort. J Nucl Med. 2018;59(7):1042–1048. doi: 10.2967/jnumed.117.199752. [DOI] [PubMed] [Google Scholar]
- 10.Ryon EL, Kronenfeld JP, Lee RM, Yopp A, Wang A, Lee AY, et al. Surgical management of hepatocellular carcinoma patients with portal vein thrombosis: The United States safety net and academic center collaborative analysis. J Surg Oncol. 2021;123(2):407–415. doi: 10.1002/jso.26282. [DOI] [PMC free article] [PubMed] [Google Scholar]
- 11.Brown AM, Kassab I, Massani M, Townsend W, Singal AG, Soydal C, et al. TACE versus TARE for patients with hepatocellular carcinoma: Overall and individual patient level meta analysis. Cancer Med. 2023;12(3):2590–2599. doi: 10.1002/cam4.5125. [DOI] [PMC free article] [PubMed] [Google Scholar]
- 12.Salem R, Gordon AC, Mouli S, Hickey R, Kallini J, Gabr A, et al. Y90 radioembolization significantly prolongs time to progression compared with chemoembolization in patients with hepatocellular carcinoma. Gastroenterology. 2016;151(6):1155–1163. doi: 10.1053/j.gastro.2016.08.029. e2. [DOI] [PMC free article] [PubMed] [Google Scholar]
- 13.Llovet JM, Ricci S, Mazzaferro V, Hilgard P, Gane E, Blanc JF, et al. SHARP Investigators Study Group Sorafenib in advanced hepatocellular carcinoma. N Engl J Med. 2008;359(4):378–390. doi: 10.1056/NEJMoa0708857. [DOI] [PubMed] [Google Scholar]
- 14.Cheng AL, Qin S, Ikeda M, Galle PR, Ducreux M, Kim TY, et al. Updated efficacy and safety data from IMbrave150: Atezolizumab plus bevacizumab vs. sorafenib for unresectable hepatocellular carcinoma J. 2022 Hepatol;76(4):862–873. doi: 10.1016/j.jhep.2021.11.030. [DOI] [PubMed] [Google Scholar]
- 15.Qin S, Chan SL, Gu S, Bai Y, Ren Z, Lin X, et al. CARES-310 Study Group Camrelizumab plus rivoceranib versus sorafenib as first-line therapy for unresectable hepatocellular carcinoma (CARES-310): a randomised, open-label, international phase 3 study. Lancet. 2023;402(10408):1133–1146. doi: 10.1016/S0140-6736(23)00961-3. [DOI] [PubMed] [Google Scholar]
- 16.Ince V, Akbulut S, Otan E, Ersan V, Karakas S, Sahin TT, et al. Liver Transplantation for Hepatocellular Carcinoma: Malatya experience and proposals for expanded criteria. J Gastrointest Cancer. 2020;51(3):998–1005. doi: 10.1007/s12029-020-00424-w. [DOI] [PubMed] [Google Scholar]