

Abstract
Background:
Intimate partner violence (IPV) is a leading cause of injury for reproductive-aged women. Clinical guidelines exist to assist providers in counseling women for IPV, but information on provider counseling among pregnant women from population-based sources is limited.
Materials and Methods:
Data for 2009–2015 from 37 states and New York City participating in the Pregnancy Risk Assessment Monitoring System (PRAMS) were analyzed (n = 258,263). We compared prevalence estimates overall and by site, of physical IPV occurring before and/or during pregnancy, and prenatal counseling on physical IPV. Multivariable logistic regression was used to identify factors associated with receiving prenatal counseling on physical IPV.
Results:
Overall, 3.8% of women reported experiencing any physical IPV in the 12 months before and/or during pregnancy (range: 1.5% [Connecticut] to 7.2% [Mississippi]). Prevalence of prenatal IPV counseling was 51.0% (range: 30.2% [Utah] to 63.1% [New Mexico]). Receipt of prenatal counseling on depression predicted a fourfold increase in prevalence of receiving counseling on physical IPV (adjusted prevalence ratio [aPR] = 4.20, 95% confidence interval [CI]: 4.06–4.34). In addition, non-Hispanic black race versus non-Hispanic white race, and having less than a high school education were associated with higher prevalence of receipt of IPV counseling ([aPR = 1.16, 95% CI: 1.14–1.18] and [aPR = 1.11, 95% CI: 1.08–1.13], respectively).
Conclusion:
Almost 4% of women with a recent live birth reported physical IPV before and/or during pregnancy. Only half of women received counseling on IPV during prenatal care, with counseling rates varying widely among states. Increased adherence to guidelines for universal screening and counseling of women could ensure all women are offered appropriate support and referral.
Keywords: intimate partner violence, prenatal care, prenatal care counseling, pregnancy
Introduction
Intimate partner violence (IPV) includes physical violence, sexual violence, stalking, and psychological aggression by a current or former intimate partner.1 IPV remains a major public health problem and is a common cause of injury in women.2 In addition, homicide that occurs during battering remains a leading cause of death for women, including those who are pregnant.3 Nearly one-third of all U.S. women report having experienced physical violence by an intimate partner in their lifetime.4 Due to underreporting, however, the true prevalence of IPV is unknown.5
In addition to acute physical injuries, women exposed to IPV often suffer from chronic conditions, including headaches, pelvic pain, heart palpitations, anxiety, irritable bowel syndrome, and vaginal infections.5 IPV also often co-occurs with other risk factors for poor maternal health outcomes, such as smoking,6 alcohol and substance abuse,7–9 and depression,7,10–12 and has been linked to poor pregnancy weight gain, anemia, placental abruption,5 sexually transmitted infections, including HIV,13–17 and unintended pregnancy.18 IPV is associated with adverse infant health outcomes such as fetal injury, low birth weight, and preterm birth.5,19 Overall, IPV can have an adverse, long-term impact on maternal and child health, beyond the initial physical and emotional trauma, and should therefore be on the radar of providers who care for pregnant women.
While historically, national public health organizations have endorsed screening for physical and other forms of violence during clinical care,20–22 there was a lack of consensus among medical practitioners on appropriateness and effectiveness of universal screening for IPV. Thus, screening practices varied widely.23
In 2011, the Institute of Medicine issued guidelines around the identification of IPV and recommended “screening and counseling of all women and adolescent girls for interpersonal and domestic violence in a culturally competent manner.” These recommendations were included in the Health Resources and Services Administration (HRSA)’s Women’s Preventive Services Guidelines.24 As a result, starting in 2012, new private health insurance plans were required to cover screening for IPV (in addition to other preventive health services), without cost-sharing.24 Furthermore, in 2013, a systematic review conducted by the United States Preventive Services Task Force (USPSTF) found sufficient evidence to recommend that clinicians routinely screen women of childbearing age for IPV and refer those who screen positive to intervention services.5
The review concluded that effective interventions can reduce violence, abuse, and physical or mental harms for women of reproductive age.5 In accordance, the American College of Obstetricians and Gynecologists recommends that physicians screen all women for IPV at periodic intervals, including during obstetric care, that is, at the first prenatal visit, at least once per trimester, and at the postpartum checkup18; and the American Medical Association states that physicians should routinely inquire about physical, sexual, and psychological abuse as part of the medical history.25
Despite the availability of clinical guidelines on screening for IPV, universal screening is not standard practice among clinicians.23,26–31 Previous studies have described IPV screening practices in various clinical settings and subspecialties.32–34 Few studies, however, have used population-based data to examine rates of IPV counseling in prenatal care. One study that used multistate data from the Pregnancy Risk Assessment Monitoring System (PRAMS) from 2004 to 2008 to examine the extent to which IPV was discussed during prenatal care, found that about half of the study population reported not having any discussions on IPV with their prenatal care provider.27
This study extends on the prior report by providing current estimates of physical IPV around the time of pregnancy, and prenatal counseling on physical IPV in a large representative sample of postpartum women across 38 participating U.S. sites. It also examines factors associated with receiving counseling for physical IPV in prenatal care to characterize missed opportunities to identify women at risk. Finally, given that several key events with potential to impact the prevalence of receipt of counseling for physical IPV occurred during the period under review,5,24 this study also provides an opportunity to examine trends in the prevalence of physical IPV screening against the backdrop of these events.
Materials and Methods
We used PRAMS data from 38 sites*,† (37 states and New York City) that participated in 2009–2015, and achieved a weighted response rate in at least 1 year of at least 65% for data collected during 2009–2011, at least 60% for data collected during 2012–2014, and at least 55% for data collected in 2015. PRAMS is a mixed-mode (mail and phone) population-based surveillance system that collects information on select maternal behaviors and experiences before and during pregnancy, and shortly after delivery. Participant responses are weighted to account for nonresponse, non-coverage, and oversampling, and are representative of each participating state’s population of women recently delivering a live infant.
During 2009–2015, a total of 258,263 women participated in PRAMS in the 38 sites included in this study. Of these, 11,053 reported experiencing physical IPV before and/or during pregnancy. A total of 3801 women were excluded from the analyses on provider counseling during prenatal care because they had no prenatal care (n = 3228), or had missing information on prenatal care entry (n = 573), but were included in the overall estimates of physical IPV across sites. Thus, the final sample for analyses on prenatal IPV counseling comprised 254,462 women aged 12–55, with a history of receipt of any prenatal care. Data from seven states (Illinois, New York, Oregon, Tennessee, Texas, Vermont, and Wyoming) do not contain responses from minors on IPV as any question on abuse is removed from surveys administered to minors in these sites. A detailed description of PRAMS methodology is available elsewhere.35 The Centers for Disease Control and Prevention and local Institutional Review Boards approved the PRAMS protocol; all sites approved the study plan.
Intimate partner violence (IPV; “any physical IPV”) was derived from a response of “Yes” to either or both of two questions: “During the 12 months before you got pregnant with your new baby, did your husband or partner push, hit, slap, kick, choke, or physically hurt you in any other way?” and “During your most recent pregnancy, did your husband or partner push, hit, slap, kick, choke, or physically hurt you in any other way?.” Thus, this study’s definition of IPV focuses on only physical violence and not other forms of IPV such as sexual violence, emotional abuse, or stalking, or IPV that may have begun in the postpartum period.
Receipt of provider counseling on physical IPV during prenatal care was measured by the following survey question: “During any of your prenatal care visits, did a doctor, nurse, or other health care worker talk with you about any of the things listed below? Please count only discussions, not reading materials or videos.” Accompanied by a response of “Yes” for the listed item “Physical abuse to women by their husbands or partners?” For the purpose of this study, discussions about IPV with a prenatal care provider will be termed “prenatal counseling on physical IPV.”
Demographic and psychosocial characteristics of interest were selected based on existing literature,27,36–39 and obtained from birth certificate variables routinely linked to the PRAMS dataset or from survey data. Information on maternal race/ethnicity, maternal age, marital status, education, and trimester of entry into prenatal care was obtained from the birth certificate, while type of insurance coverage during prenatal care, enrollment in the Special Supplemental Nutrition Program for Women, Infants, and Children (WIC), family income (calculated as a percentage of the Federal Poverty Level [FPL]), prepregnancy depression diagnosed by a health care professional, receipt of provider counseling on depression, pregnancy intention (unintended defined as pregnancy unwanted or mistimed), alcohol use and cigarette smoking before and/or during pregnancy, and maternal stress items were obtained from PRAMS survey data.
Women were asked about stressful life events they may have experienced in the 12 months before their delivery. From the list of 14 stressors, 7 were chosen for inclusion in this study based on known associations with physical IPV.37–39 These are separation or divorce from husband or partner, involvement in a physical fight, husband or partner not wanting the pregnancy, woman or partner going to jail, being homeless, arguing with husband or partner more than usual, and someone close having a problem with drinking or drugs. Finally, to assess differences in prevalence of IPV counseling rates preimplementation and postimplementation of the HRSA women’s preventive services guidelines in 2012, infant year of birth was dichotomized into two time periods: the first comprising years 2009–2011 (pre) and the second comprising years 2013–2015 (post).
SUDAAN version 11.0 software was used to calculate prevalence rates and corresponding 95% confidence intervals (CIs) for indicators of interest. Chi-squared tests were used to test for significant ( p < 0.05) differences in distribution of aforementioned maternal characteristics among women exposed to physical IPV compared to those who were not, and among women who received provider counseling for physical IPV compared to those who did not. State-based prevalence estimates of any physical IPV and state-based estimates of receiving prenatal counseling on IPV were calculated. The prevalence of receiving prenatal counseling on physical IPV was calculated for each of the maternal characteristics.
Logistic regression was used to assess associations between maternal characteristics (covariates) and receipt of prenatal counseling on physical IPV (outcome) in two steps. First, as PRAMS is a cross-sectional survey, we calculated crude prevalence ratios to examine the association between each covariate and receipt of counseling for physical IPV.40 Second, independent variables that were associated with more than a 10% increase in prevalence of the outcome were included in a multivariable model. Adjusted prevalence ratios (aPRs) and 95% CIs were calculated to determine which variables remained significantly associated with the outcome after controlling for the presence of others. Variables that did not remain significantly associated with receipt of counseling for physical IPV after controlling for other covariates were excluded from the final model. Age, which was highly correlated with both education and marital status, was also removed from the final model. Covariates included in the final model were race/ethnicity, income, education, marital status, insurance coverage for prenatal care, enrollment in the WIC program, alcohol use before and/or during pregnancy, and homelessness. Receipt of provider counseling on depression was added to the model to assess if an association exists with receiving provider counseling on physical IPV based on prior literature that shows a low prevalence of depression screening during prenatal care and a high co-occurrence of these conditions.41,42 Infant year of birth was added to the model as a continuous variable to test for trends over time in receipt of prenatal counseling for physical IPV.
Results
Higher percentages of those reporting physical IPV, compared with their counterparts, were unmarried (72.6% vs. 37.8%), had prenatal care covered by Medicaid or other publicly-funded sources (72.0% vs. 42.2%), were enrolled in WIC (70.4% vs. 44.5%), 20–29 years of age (61.3% vs. 50.4%), had family income between 0% and 100% of FPL (68.8% vs. 36.5%), had an unintended pregnancy (66.7% vs. 42.1%), smoked cigarettes before and/or during pregnancy (47.9% vs. 21.2%), were non-Hispanic black (22.9% vs. 13.1%), and had a diagnosis of prepregnancy depression (12.2% vs. 5.2%) (Table 1). The overall prevalence of reporting any physical IPV before and/or during pregnancy was 3.8% (Table 2). Among sites, the overall prevalence of any physical IPV ranged from 1.5% in Connecticut to 7.2% in Mississippi (Table 2). The overall prevalence of physical IPV before pregnancy was 3.0% and ranged from 1.3% in Connecticut to 5.6% in Mississippi. The prevalence of physical IPV during pregnancy was slightly lower at 2.6%, ranging from 1.0% in Connecticut to 4.2% in Arkansas.
Table 1.
Maternal Characteristics of Women with Physical Intimate Partner Violence Exposure Versus Those Without Physical Intimate Partner Violence Exposure in 38 Pregnancy Risk Assessment Monitoring System Sites, 2009–2015
| IPV exposed | |||||
|---|---|---|---|---|---|
| Yes | No | ||||
| Maternal characteristics | N | %, 95% CI | N | %, 95% CI | pa |
| Received IPV counseling | |||||
| Yes | 5950 | 52.9 (51.2–54.7) | 125,877 | 51.1 (50.7–51.4) | <0.05 |
| No | 4725 | 47.1 (45.4–48.8) | 114,562 | 48.9 (48.6–49.3) | |
| Maternal age (years) | |||||
| <20 | 1548 | 14.2 (13.0–15.5) | 18,954 | 7.3 (7.1–7.4) | <0.01 |
| 20–29 | 6724 | 61.3 (59.6–63.0) | 124,327 | 50.4 (50.1–51.1) | |
| (30 | 2781 | 24.5 (23.1–25.9) | 103,929 | 42.4 (42.1–42.7) | |
| Maternal race | |||||
| Non-Hispanic white | 4509 | 48.2 (46.2–50.1) | 128,391 | 59.7 (59.5–60.0) | <0.01 |
| Non-Hispanic black | 2815 | 22.9 (21.3–24.4) | 38,411 | 13.1 (12.9–13.3) | |
| Other | 3567 | 28.9 (27.2–30.6) | 76,942 | 27.1 (27.0–27.4) | |
| Household income (Federal Poverty Rate) | |||||
| 0%–100% | 7314 | 68.8 (67.2–70.4) | 87,499 | 36.5 (36.1–36.8) | <0.01 |
| 101%–200% | 1788 | 18.1 (16.8–19.5) | 48,629 | 20.8 (20.5–21.1) | |
| 201%–300% | 407 | 3.9 (3.4–4.6) | 20,328 | 8.5 (8.4–8.7) | |
| >300% | 771 | 9.2 (8.3–10.2) | 69,966 | 34.2 (33.9–34.5) | |
| Maternal education | |||||
| Less than high school | 2506 | 22.6 (21.1–24.1) | 37,262 | 16.0 (15.0–15.5) | <0.01 |
| High school | 3856 | 36.6 (34.9–38.3) | 62,141 | 24.7 (24.3–24.8) | |
| Greater than high school | 4537 | 40.9 (39.2–42.5) | 144,838 | 59.2 (59.9–60.5) | |
| Marital status | |||||
| Married | 2978 | 27.4 (26.0–29.0) | 149,950 | 62.2 (61.9–62.5) | <0.01 |
| Other | 8038 | 72.6 (71.0–74.0) | 96,644 | 37.8 (37.5–38.1) | |
| Pregnancy intention | |||||
| Intended | 3571 | 33.3 (31.7–35.0) | 138,264 | 57.9 (57.6–58.2) | <0.01 |
| Unintendedb | 7264 | 66.7 (65.1–68.3) | 103,987 | 42.1 (41.8–42.4) | |
| Trimester entry into PNC | |||||
| First trimester | 7917 | 71.9 (69.6–72.7) | 203,109 | 81.7 (81.5–82.0) | <0.01 |
| Second trimester | 2342 | 22.0 (20.6–23.4) | 34,246 | 14.2 (14.0–14.5) | |
| Third trimester | 498 | 5.1 (4.3–5.9) | 6350 | 2.9 (2.8–3.0) | |
| No PNC | 271 | 1.8 (1.4–2.3) | 2957 | 1.2 (1.1–1.3) | |
| Enrolled in WIC program | |||||
| Yes | 7934 | 70.4 (68.8–71.9) | 114,654 | 44.5 (44.2–44.8) | <0.01 |
| No | 3022 | 29.7 (28.1–31.2) | 129,488 | 55.2 (55.2–55.8) | |
| Insurance coverage | |||||
| Private/HMO | 1742 | 18.1 (16.8–19.3) | 109,450 | 47.7 (47.4–48.1) | <0.01 |
| Medicaid or other publicly funded | 7932 | 72.0 (70.4–73.5) | 108,217 | 42.2 (41.9–42.5) | |
| Other | 707 | 7.4 (6.5–8.5) | 16,768 | 7.1 (6.9–7.3) | |
| None | 303 | 2.6 (2.1–3.2) | 7125 | 3.0 (2.9–3.1) | |
| Alcohol use before and/or during pregnancy | |||||
| Yes | 6660 | 61.8 (60.1–63.4) | 128,129 | 54.4 (54.1–54.8) | <0.01 |
| No | 4245 | 38.2 (36.6–39.9) | 114,691 | 45.6 (45.2–45.9) | |
| Cigarette smoking before and/or during pregnancy | |||||
| Yes | 5639 | 47.9 (46.2–49.6) | 56,560 | 21.2 (20.9–21.5) | <0.01 |
| No | 5294 | 52.1 (50.4–53.8) | 186,883 | 78.9 (78.5–79.1) | |
| Pre-pregnancy depression diagnosedc | |||||
| Yes | 1505 | 12.2 (11.2–13.3) | 13,993 | 5.2 (5.1–5.3) | <0.01 |
| No | 9548 | 87.8 (86.7–88.8) | 233,217 | 94.8 (94.7–94.4) | |
| Stressful life events | |||||
| Was in a physical fightd | 2367 | 39.4 (37.01–41.8) | 2360 | 2.0 (1.9–2.2) | <0.01 |
| Husband/partner did not want pregnancy | 3526 | 30.6 (30.0–33.1) | 16,065 | 6.4 (6.2–6.5) | <0.01 |
| Got separated or divorced | 4130 | 36.3 (34.7–37.9) | 16,342 | 6.3 (6.1–6.5) | <0.01 |
| Husband/partner or self in jail | 2910 | 24.5 (23.0–25.9) | 8610 | 3.1 (2.9–3.2) | <0.01 |
| Someone close had problem with drinking or drugs | 5086 | 43.1 (41.4–44.8) | 27,650 | 10.4 (10.2–10.6) | <0.01 |
| Argued with husband/partner more than usual | 8152 | 73.7 (72.3–75.2) | 51,745 | 20.5 (20.2–20.8) | <0.01 |
| Was homeless | 1714 | 14.4 (13.2–15.6) | 6515 | 2.5 (2.4–2.6) | <0.01 |
Physical IPV exposure: derived from a response of “Yes” to either of two questions that asked if the respondent had been pushed, hit, slapped, kicked, choked, or physically hurt in any way in the 12 months before pregnancy or during pregnancy by a husband or partner.
Chi-squared testing comparing women exposed to physical IPV before and/or during pregnancy to those who were not.
Unintended pregnancy was derived from responses of “I wanted to be pregnant later,” “I did not want to be pregnant then or at any time in the future,” or “I wasn’t sure what I wanted,” to a question that asked how the respondent felt about becoming pregnant shortly before she got pregnant.
Included only on 2012–2015 (Phase 7) surveys.
Included only on 2009–2011 (Phase 6) surveys.
CI, confidence interval; HMO, Health Maintenance Organization; IPV, intimate partner violence; PNC, prenatal care; WIC, the Special Supplemental Nutrition Program for Women, Infants, and Children.
Table 2.
Prevalence of Reported Physical Intimate Partner Violence Before and/or During Pregnancy Among Women with a Recent Live Birth in 38 Pregnancy Risk Assessment Monitoring System Sites, 2009–2015
| Any IPV—before or during pregnancy | IPV before pregnancy only | IPV during pregnancy only | ||||||||||
|---|---|---|---|---|---|---|---|---|---|---|---|---|
| State | Total | N | % | 95% CI | Total | N | % | 95% CI | Total | N | % | 95% CI |
| All | 258,263 | 11,053 | 3.8 | 3.7–4.0 | 253,576 | 8695 | 3.0 | 2.9–3.1 | 253,797 | 7346 | 2.6 | 2.5–2.7 |
| Alabama | 1749 | 62 | 3.9 | 3.0–4.9 | 1714 | 50 | 3.1 | 2.4–4.1 | 1712 | 47 | 3.0 | 2.2–4.0 |
| Alaska | 7070 | 352 | 4.3 | 3.8–4.9 | 6943 | 282 | 3.6 | 3.1–4.1 | 6944 | 236 | 2.9 | 2.5–3.4 |
| Arkansas | 5629 | 401 | 6.5 | 5.6–7.6 | 5577 | 340 | 5.4 | 4.6–6.4 | 5573 | 253 | 4.2 | 3.5–5.1 |
| Colorado | 10,400 | 383 | 3.3 | 2.9–3.8 | 10,348 | 287 | 2.6 | 2.2–3.0 | 10,349 | 242 | 2.1 | 1.7–2.5 |
| Connecticut | 1261 | 27 | 1.5 | 1.0–2.3 | 1252 | 23 | 1.3 | 0.8–2.1 | 1250 | 18 | 1.0 | 0.6–1.7 |
| Delaware | 7168 | 367 | 5.1 | 4.6–5.6 | 7098 | 290 | 4.1 | 3.6–4.6 | 7113 | 243 | 3.4 | 3.0–3.9 |
| Georgia | 5447 | 196 | 3.5 | 2.8–4.4 | 5408 | 160 | 2.8 | 2.2–3.7 | 5395 | 134 | 2.4 | 1.8–3.2 |
| Hawaii | 10,307 | 376 | 3.6 | 3.1–4.1 | 10,177 | 301 | 2.8 | 2.4–3.3 | 10,180 | 249 | 2.5 | 2.1–2.9 |
| Illinois | 10,054 | 308 | 3.1 | 2.7–3.5 | 9746 | 234 | 2.5 | 2.2–2.9 | 9787 | 199 | 2.1 | 1.8–2.4 |
| Iowa | 3412 | 150 | 3.6 | 2.7–4.7 | 3367 | 114 | 2.9 | 2.1–4.0 | 3367 | 109 | 2.2 | 1.6–3.1 |
| Louisiana | 1902 | 85 | 4.1 | 3.0–5.6 | 1894 | 61 | 3.3 | 2.3–4.7 | 1896 | 58 | 2.6 | 1.7–3.8 |
| Maine | 5732 | 229 | 3.5 | 3.0–4.2 | 5713 | 187 | 2.8 | 2.3–3.4 | 5706 | 146 | 2.3 | 1.9–2.8 |
| Maryland | 9429 | 353 | 3.9 | 3.4–4.5 | 9283 | 264 | 3.0 | 2.6–3.6 | 9298 | 231 | 2.5 | 2.1–3.0 |
| Massachusetts | 10,393 | 300 | 2.6 | 2.2–3.0 | 10,176 | 230 | 2.0 | 1.7–2.4 | 10,238 | 205 | 1.7 | 1.4–2.0 |
| Michigan | 10,344 | 551 | 4.4 | 4.0–4.9 | 10,208 | 409 | 3.3 | 2.9–3.7 | 10,204 | 398 | 3.2 | 2.8–3.7 |
| Minnesota | 6406 | 287 | 3.4 | 2.7–3.6 | 6337 | 233 | 2.8 | 2.3–3.2 | 6332 | 171 | 1.7 | 1.4–2.0 |
| Mississippi | 1406 | 114 | 7.2 | 5.8–9.1 | 1402 | 93 | 5.6 | 4.3–7.3 | 1400 | 69 | 4.1 | 3.0–5.5 |
| Missouri | 8488 | 416 | 4.6 | 4.1–5.2 | 8429 | 336 | 3.7 | 3.3–4.3 | 8426 | 264 | 2.9 | 2.5–3.4 |
| Nebraska | 10,976 | 462 | 3.7 | 3.3–4.1 | 10,820 | 372 | 3.0 | 2.6–3.4 | 10,865 | 312 | 2.4 | 2.1–2.8 |
| New Hampshire | 1885 | 53 | 2.4 | 1.7–3.4 | 1863 | 47 | 2.2 | 1.5–3.1 | 1865 | 38 | 1.3 | 0.9–2.1 |
| New Jersey | 7714 | 322 | 3.3 | 2.9–3.8 | 7601 | 259 | 2.7 | 2.3–3.1 | 7624 | 210 | 2.2 | 1.9–2.6 |
| New Mexico | 6838 | 311 | 4.6 | 4.1–5.1 | 6756 | 252 | 3.8 | 3.3–4.3 | 6758 | 211 | 3.0 | 2.6–3.4 |
| New York City | 8578 | 276 | 3.4 | 2.9–3.9 | 8426 | 201 | 2.6 | 2.2–3.1 | 8422 | 189 | 2.4 | 2.1–2.9 |
| New Yorka | 5182 | 220 | 3.9 | 3.3–4.7 | 5125 | 171 | 3.1 | 2.5–3.8 | 5145 | 148 | 2.6 | 2.1–3.3 |
| Ohio | 5918 | 282 | 5.0 | 4.3–5.8 | 5853 | 209 | 3.9 | 3.2–4.7 | 5854 | 190 | 3.5 | 2.9–4.2 |
| Oklahoma | 13,581 | 724 | 5.7 | 5.0–6.5 | 13,508 | 576 | 4.5 | 3.9–5.2 | 13,508 | 464 | 3.8 | 3.2–4.4 |
| Oregon | 8972 | 334 | 2.6 | 2.2–3.2 | 8183 | 267 | 2.2 | 1.8–2.8 | 8182 | 216 | 1.9 | 1.5–2.6 |
| Pennsylvania | 7255 | 297 | 4.0 | 3.5–4.6 | 7197 | 227 | 3.0 | 2.6–3.5 | 7197 | 204 | 2.8 | 2.4–3.3 |
| Rhode Island | 7470 | 254 | 3.3 | 2.8–3.8 | 7341 | 191 | 2.5 | 2.2–3.0 | 7341 | 176 | 2.2 | 1.9–2.6 |
| Tennessee | 3126 | 157 | 4.4 | 3.6–5.4 | 3014 | 26 | 3.3 | 2.6–4.3 | 3015 | 104 | 3.2 | 2.5–4.1 |
| Texas | 4613 | 243 | 4.5 | 3.9–5.3 | 4360 | 182 | 3.6 | 3.0–4.3 | 4356 | 164 | 3.1 | 2.5–3.8 |
| Utah | 10,442 | 301 | 2.4 | 2.1–2.8 | 10,283 | 231 | 1.8 | 1.6–2.1 | 10,330 | 208 | 1.7 | 1.4–2.0 |
| Vermont | 6163 | 207 | 3.5 | 3.0–4.0 | 5841 | 171 | 3.1 | 2.7–3.6 | 5838 | 128 | 2.2 | 1.9–2.6 |
| Virginia | 717 | 20 | 2.6 | 1.4–4.7 | 708 | 15 | 1.8 | 0.9–3.7 | 708 | 15 | 2.3 | 1.2–4.3 |
| Washington | 8818 | 331 | 2.9 | 2.5–3.4 | 8730 | 267 | 2.4 | 2.0–2.8 | 8723 | 221 | 1.9 | 1.6–2.3 |
| West Virginia | 9764 | 574 | 5.0 | 4.4–5.5 | 9702 | 463 | 3.9 | 3.5–4.4 | 9703 | 355 | 3.1 | 2.7–3.6 |
| Wisconsin | 8605 | 509 | 3.5 | 3.0–4.1 | 8333 | 400 | 2.7 | 2.3–3.3 | 8329 | 373 | 2.4 | 2.0–2.9 |
| Wyoming | 5019 | 218 | 3.7 | 3.1–4.4 | 4860 | 165 | 2.9 | 2.4–3.5 | 4864 | 148 | 2.5 | 2.0–3.0 |
Physical IPV exposure: derived from a response of “Yes” to either of two questions that asked if the respondent had been pushed, hit, slapped, kicked, choked, or physically hurt in any way in the 12 months before pregnancy or during pregnancy by a husband or partner.
New York State, not including New York City.
The prevalence of receiving provider counseling on physical IPV during pregnancy was 51.0% (Fig. 1). Among sites, Utah had the lowest prevalence of prenatal provider counseling on physical IPV, at 30.2%, while prevalence was highest in New Mexico, at 63.1% (Fig. 1). The prevalence of receiving counseling was highest among those who also received prenatal counseling for depression (65.2%), were non-Hispanic black (64.0%), had less than high school education (63.8%), were unmarried (62.3%), and had family income between 0% and 100% of FPL (61.4%) (Table 3). The prevalence of receipt of counseling for physical IPV was higher after implementation of HRSA guidelines on women’s preventive services (2013–2015) compared with the earlier time period (51.6% vs. 50.9%, p < 0.05) (data not shown).
FIG. 1.
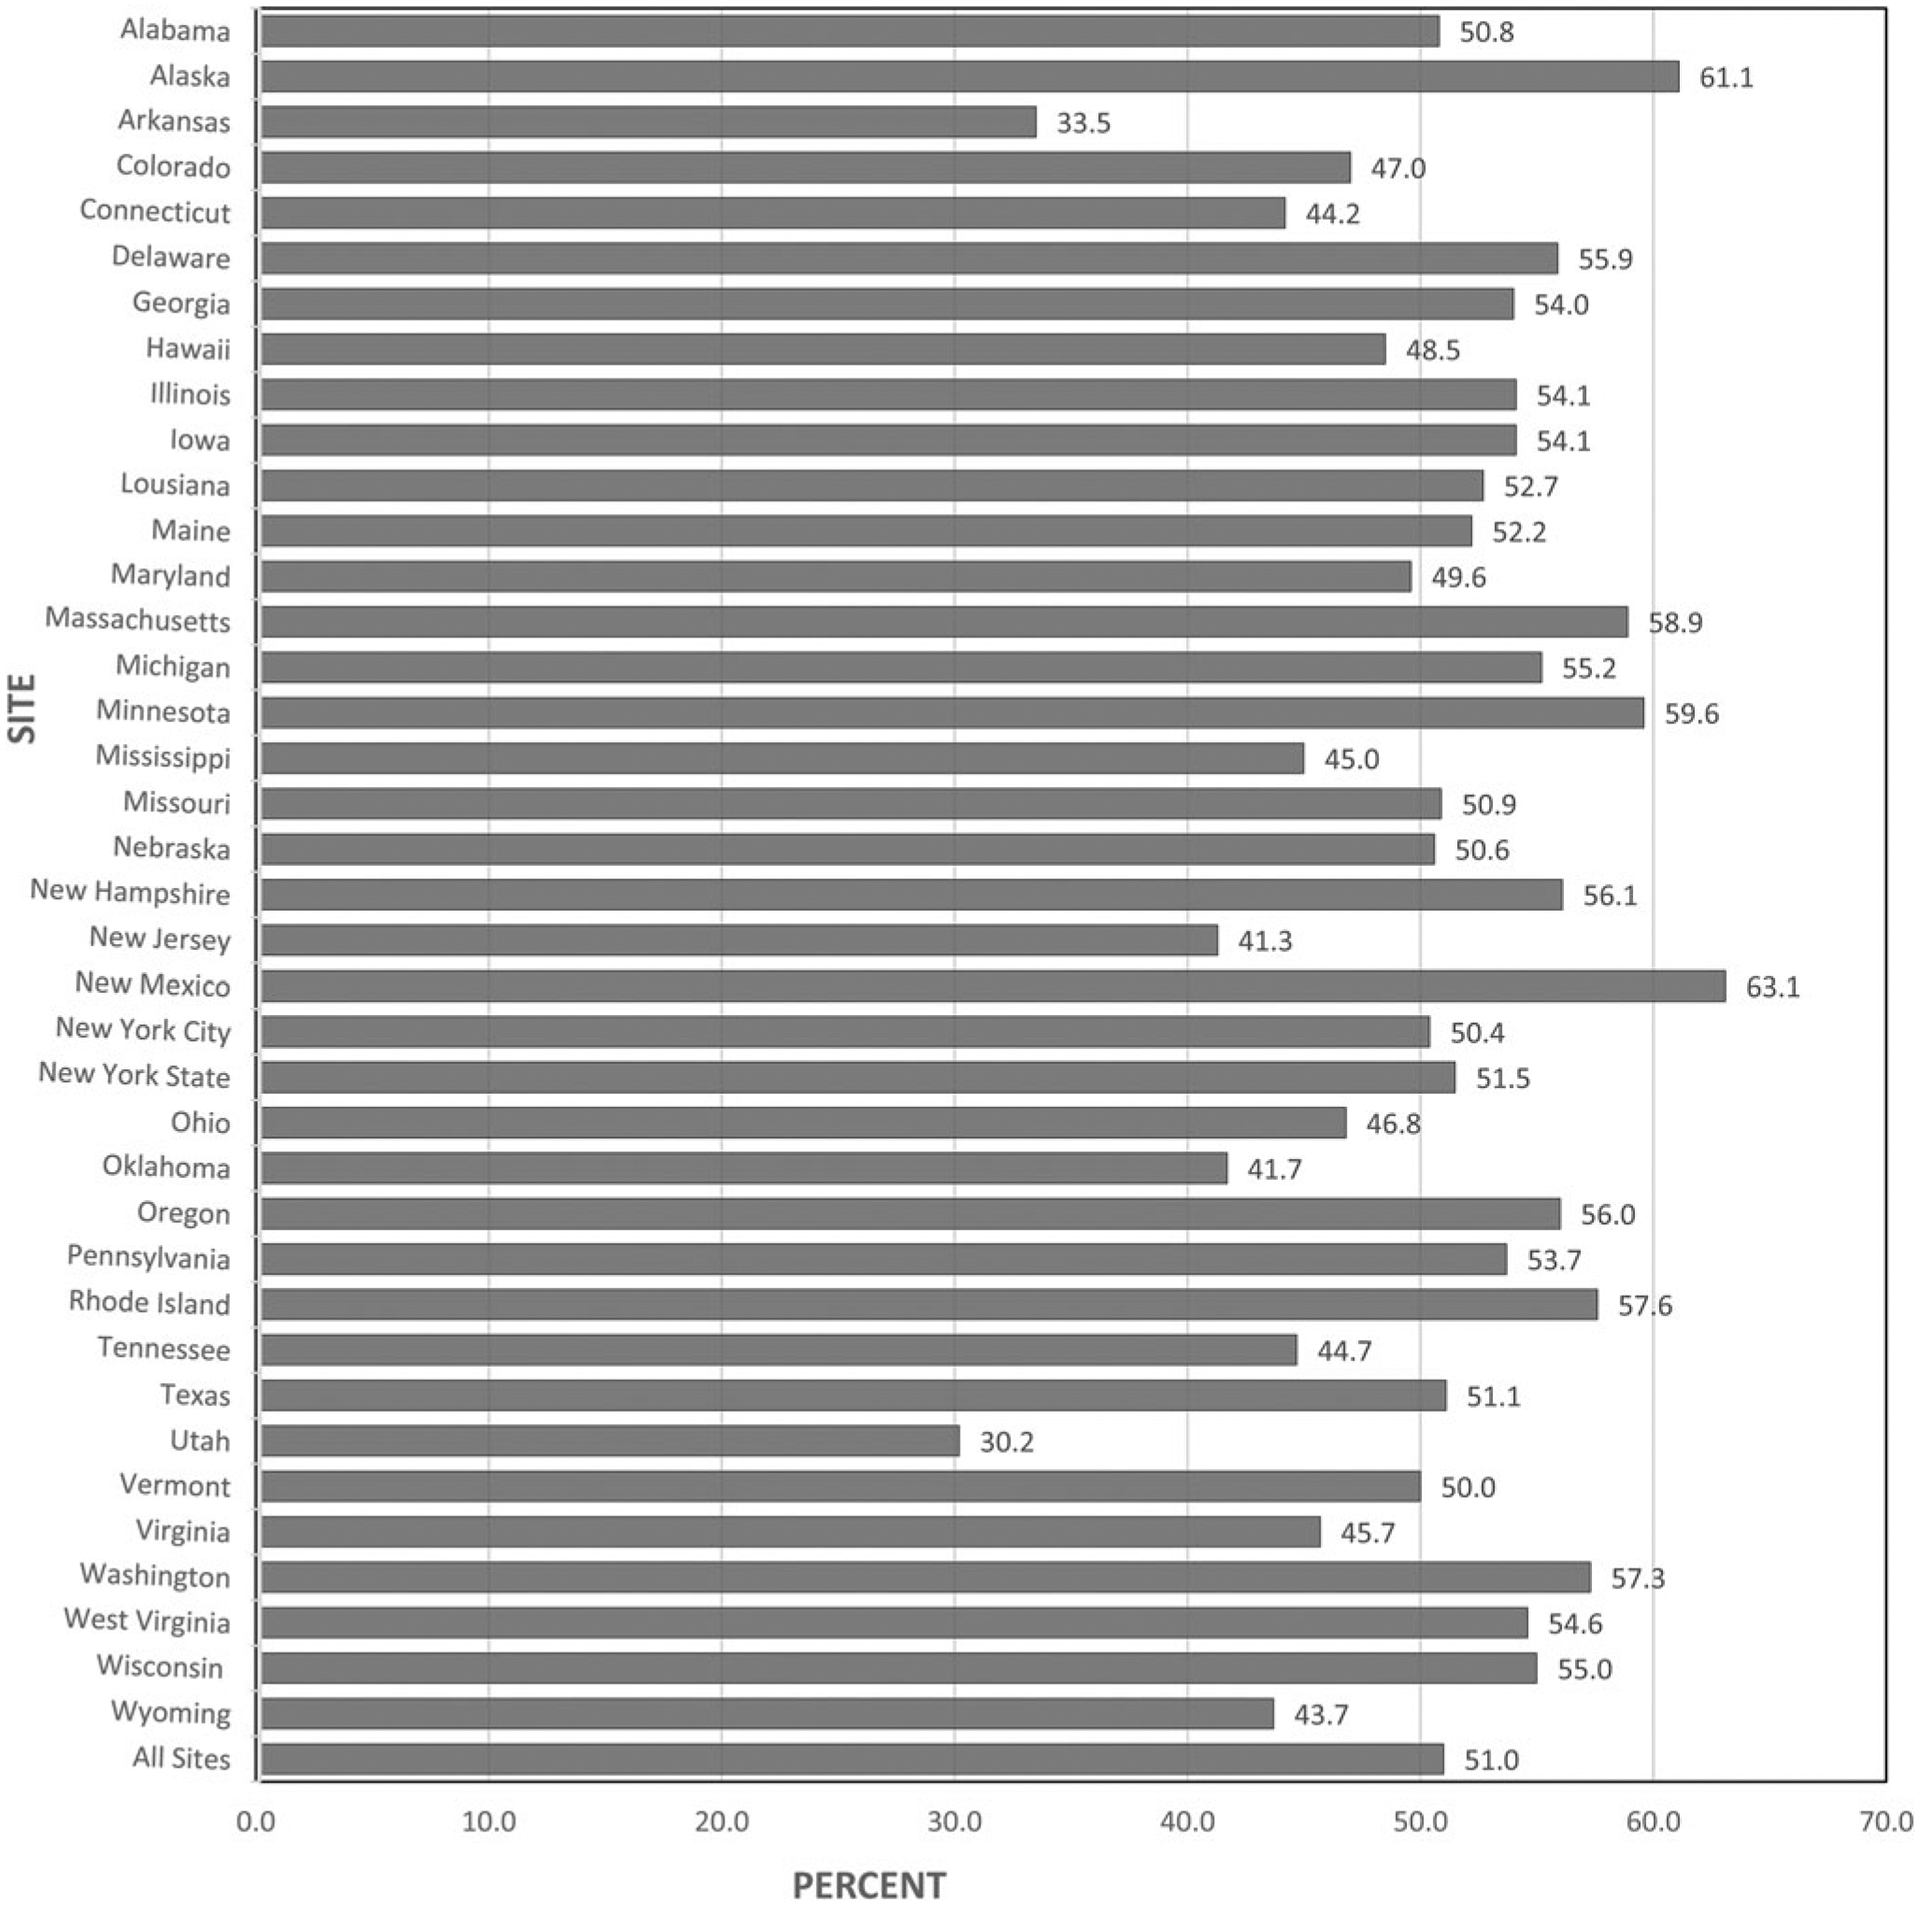
Prevalence of prenatal care provider counseling on physical IPVa among women with a recent live birth in 38 PRAMS sites, 2009–2015.b aPhysical IPV exposure: derived from a response of “Yes” to either of two questions that asked if the respondent had been pushed, hit, slapped, kicked, choked, or physically hurt in any way in the 12 months before pregnancy or during pregnancy by a husband or partner. bNot all sites had data in all years. Only data that met the response rate threshold for that year were included in the analysis. IPV, intimate partner violence; PRAMS, Pregnancy Risk Assessment Monitoring System.
Table 3.
Associations Between Selected Maternal Characteristics and Receiving Prenatal Counseling for Physical Intimate Partner Violence Among Women with a Recent Live Birth in 38 Pregnancy Risk Assessment Monitoring System Sites, 2009–2015, N = 254,462
| Maternal characteristics | Prevalence of receiving counseling for IPV % (95% CI) | Unadjusted prevalence ratio (95% CI) | Adjusted prevalence ratioa (95% CI) |
|---|---|---|---|
| Maternal race | |||
| Non-Hispanic white | 45.4 (45.0–45.8) | Ref. | Ref. |
| Non-Hispanic black | 64.0 (63.1–64.8) | 1.41 (1.39-1.43) | 1.16 (1.14-1.18) |
| Other | 57.1 (56.4–57.8) | 1.26 (1.24–0.28) | 1.11 (1.09-1.13) |
| Household income (Federal Poverty Rate) | |||
| 0%-100% | 61.4 (60.8–62.0) | 1.61 (1.58-1.64) | 1.10 (1.07-1.13) |
| 101%-200% | 52.2 (51.4–52.9) | 1.37 (1.34-1.39) | 1.07 (1.05-1.09) |
| 201%-300% | 44.6 (43.5–45.7) | 1.17 (1.14-1.20) | 1.03 (1.01-1.06) |
| >300% | 38.2 (37.7–38.7) | Ref. | Ref. |
| Maternal education | |||
| Less than high school | 63.8 (62.9–64.7) | 1.44 (1.41-1.46) | 1.11 (1.08-1.13) |
| High school | 59.2 (58.5–59.9) | 1.33 (1.32-1.35) | 1.08 (1.07-1.10) |
| Greater than high school | 44.4 (44.0–44.8) | Ref. | Ref. |
| Marital status | |||
| Married | 43.9 (43.5–44.3) | Ref. | Ref. |
| Unmarried | 62.3 (61.8–62.9) | 1.42 (1.40-1.44) | 1.07 (1.06-1.09) |
| Insurance coverage | |||
| Private/HMO | 40.7 (40.2–41.1) | Ref. | Ref. |
| Medicaid or other publicly funded | 61.3 (60.8–61.8) | 1.51 (1.49-1.53) | 1.08 (1.05-1.10) |
| Other | 57.9 (56.5–59.3) | 1.42 (1.39-1.46) | 1.11 (1.08-1.14) |
| None | 48.8 (46.7–51.0) | 1.20 (1.15-1.26) | 1.01 (0.97–1.06) |
| Enrolled in WIC program | |||
| No | 41.6 (41.2–42.0) | Ref. | Ref. |
| Yes | 62.3 (61.8–62.8) | 1.50 (1.48-1.52) | 1.11 (1.09-1.13) |
| Was homeless | |||
| No | 50.5 (50.2–50.9) | Ref. | Ref. |
| Yes | 63.1 (61.0–65.1) | 1.25 (1.21-1.29) | 0.97 (0.93–1.00) |
| Alcohol use before and/or during pregnancy | |||
| No | 55.4 (54.9–55.9) | 1.17 (1.16-1.19) | 1.06 (1.04-1.07) |
| Yes | 47.3 (46.9–47.7) | Ref. | Ref. |
| Received PNC counseling on depression | |||
| No | 14.0 (13.6–14.4) | Ref. | Ref. |
| Yes | 65.2 (64.9–65.6) | 4.66 (4.52-4.82) | 4.20 (4.06-4.34) |
Physical IPV exposure: derived from a response of “Yes” to either or both of two questions that asked if the respondent had been pushed, hit, slapped, kicked, choked, or physically hurt in any way in the 12 months before pregnancy or during pregnancy by a husband or partner. Sites refer to 37 U.S. states and New York City. Analyses were adjusted for infant year of birth to assess differences in trends over time for receipt of counseling on physical IPV.
Bold values indicate a statistically significant association.
From the study sample, a total of 217,652 women were included in this model after exclusion of women with missing information for any covariates.
In the adjusted model, postpartum women who received prenatal counseling for depression, compared to those who did not, had more than four times the prevalence of receiving prenatal counseling on physical IPV (aPR = 4.20, 95% CI: 4.06–4.34) (Table 3). Non-Hispanic black women were also more likely to receive provider counseling (aPR = 1.16, 95% CI: 1.14–1.18) compared to non-Hispanic white women. Other predictors for receipt of prenatal counseling on physical IPV were as follows: enrollment in the WIC program (aPR = 1.11, 95% CI: 1.09–1.13), having less than high school education (aPR = 1.11, 95% CI: 1.08–1.13), having insurance coverage defined as “Other” (aPR = 1.11, 95% CI: 1.08–1.14), and having income between 0% and 100% of FPL (aPR = 1.10, 95% CI: 1.07–1.13). Finally, a small increase in prevalence of provider counseling on physical IPV was detected from 2009 to 2015, but failed to reach a level of significance.
Discussion
This study extends the findings of prior studies that have examined the prevalence of physical IPV around the time of pregnancy,38,43,44 by providing more recent data on physical IPV among women with a recent live birth and reporting state-level estimates on the prevalence of prenatal counseling on physical IPV. We found that nearly 4% of postpartum women reported experiencing physical IPV before and/or during pregnancy, a finding that is consistent with other national estimates.27 Some prior studies have shown higher rates of physical IPV around the time of pregnancy38,43 depending on the population and type of IPV measured.45 Prevalence of physical IPV before and/or during pregnancy varied across states, with ~7% of postpartum women in Mississippi reporting any physical IPV compared with about 2% of postpartum women in Connecticut.
Our study also confirms findings from previous literature regarding characteristics of women with higher prevalence of physical IPV. These include teens and younger women, non-Hispanic black women, unmarried women, those with lower socioeconomic status, and those receiving Medicaid.36–38,44
This study also demonstrates that universal screening for physical IPV in prenatal care is not standard practice. We found that women who were non-Hispanic black, who had lower income, and with lower educational attainment were more likely to receive prenatal counseling on physical IPV compared to their counterparts. This could be due, in part, to physician perceptions regarding risk for IPV. Seminal work by Sugg et al. to identify primary care providers’ barriers in screening and identifying IPV found that providers were less likely to ask about abuse if they identified socioeconomically with the patient.31 Most providers surveyed admitted they were more likely to ask about IPV with patients perceived to be of lower socioeconomic status.31
We also found that women with Medicaid or other publicly funded insurance, and those with other types of insurance coverage were also more likely to report receiving counseling on physical IPV than were women with private insurance. This variation in receipt of counseling on physical IPV could be mitigated by a health care system-wide approach to preventing IPV, identifying victims, and providing appropriate interventions.27 Offering continuing education and training providers on counseling on IPV could strengthen adherence to screening guidelines by removing barriers to screening such as lack of provider self-efficacy. For example, women who reported receiving counseling on depression had the highest likelihood of reporting receipt of counseling for physical IPV. This result could mean providers who discuss physical IPV with their patients are also willing or able to discuss other “sensitive” topics.41
Other barriers to IPV screening that have been previously identified include lack of provider time for screening and a lack of clear guidance on screening.31,46,47 However, many effective screening tools exist that do not require a lot of time to administer, can be utilized during intake, and can be covered routinely during the visit.47,48 Furthermore, clear guidelines on IPV screening have been advanced by leading medical and public health bodies.5,18,24,25 The pregnancy and postpartum periods provide clinicians with multiple opportunities to establish trust with patients and elicit willingness to disclose abuse. Studies have shown that while women may not always disclose abuse the first time, most do not consider screening to be offensive or embarrassing.49,50 In some cases, newer approaches to screening, such as computerized self-administered screening tools, have been shown to be as effective as in-person screening.51 However these self-administered tools need further evaluation for accuracy, efficiency, and acceptability.5
Prevalence of provider counseling on physical IPV also varied across study sites. Overall, half of postpartum women did not receive provider counseling on physical IPV. The lowest rates were observed in Utah and Arkansas, where over two-thirds of women did not receive counseling on physical IPV, suggesting differences in health care delivery. Changes in health care legislation during the period under study led to an expansion of Medicaid to include women at 138% of FPL,52 and mandated coverage of preventive services such as IPV screening without out-of-pocket costs, even for women on private insurance plans.53 However, we found no significant trend in prevalence rates of IPV counseling between 2009 and 2015. These findings are similar to other studies that found low uptake of women’s preventive services in general, despite an increase in health care access immediately following changes in the health care legislation.26,53,54 One reason for these findings could be that the years of data included in this study were not a sufficient length of time within which to assess effects related to these changes. A prior study conducted using PRAMS data from 2004 to 2008 found prevalence rates for provider counseling on physical IPV similar to this study.27 Thus, further studies are needed, incorporating additional years of data after the changes in health care legislation. Such studies would better assess whether prevalence rates of provider counseling on IPV have significantly increased over time and if that increase can be ascribed to changes in clinical guidelines pertaining to screening for IPV.
Our findings show that almost half of women who experienced physical violence around the time of pregnancy did not receive counseling for it during prenatal care. Missed opportunities to screen reproductive age women may result in failure to assist those that at real risk of physical danger to themselves and their unborn infant. Dunn and McCartney28 found that one in six women reported that IPV (of any type) began during pregnancy, and women who experience one episode of violence are likely to experience repeated violence. This “chronicity” of IPV makes it particularly dangerous for pregnant women who are at increased risk for several maternal comorbidities, including vaginal bleeding.43 In addition, these women may face poor pregnancy outcomes such as preterm birth, low birthweight, miscarriage, and stillbirth.5,19 In the extreme cases, physical IPV during pregnancy can lead to pregnancy-related homicide.55,56 The chronicity of IPV, regardless of type, stresses the importance of applying recommended screening guidelines to all women of reproductive age presenting for care, whether it be in the preconception, pregnancy, or interconception period, to intervene at whatever point in the reproductive cycle that IPV is occurring. The prenatal period, in particular, is a time when women have multiple contacts with the health care system and provides several opportunities for physicians to intervene if necessary. In its systematic evidence review on screening for IPV, the USPSTF concluded that effective interventions can reduce physical violence and mental abuse among women of reproductive age.5
One strength of this study is its large representative population-based sample of recently pregnant women, providing reliable and stable estimates of the study outcomes. In addition, we were able to examine rates of physical IPV in the period around pregnancy when women are in regular contact with the health care system, thus providing an understanding of missed opportunities for intervention in this vulnerable population.
Among the limitations of this study is the possibility of reporting bias around receipt of provider counseling during prenatal care, given that data are collected 2–6 months postpartum. In addition, physical IPV may have been underestimated due to several factors. First, women with physical IPV exposure may be unwilling to disclose physical IPV because of shame or fear. Second, the IPV questions analyzed measured only physical abuse and did not take into account other forms of IPV, including emotional and sexual abuse, or reproductive coercion where a woman is forced to have, continue, or discontinue a pregnancy against her wishes. Nor do we report on abuse from former partners or spouses, only those who are involved in the current pregnancy. Third, these estimates do not represent the effects of physical IPV during pregnancy, resulting in outcomes other than live births such as miscarriage, stillbirth, or maternal death, which are not included in the PRAMS sample. Last, this study may not truly represent the prevalence of physical IPV among teens—a high-risk group for IPV—given that several study sites do not collect abuse data from minors. Finally, as PRAMS data do not distinguish between screening for physical IPV and counseling on physical IPV, our measure of prenatal counseling on physical IPV may not adequately capture screening for physical IPV.
Conclusion
This study confirms previous research that has shown that prenatal counseling on physical IPV is still far from universal, representing missed opportunities to link victims to needed services. Incorporating recommended IPV screening and counseling as a part of routine clinical practice for all women of reproductive age can help to ensure that those in need receive assistance. It is important to continue to facilitate provider training, and standardize quality care in health systems. Future research should include measures to distinguish between screening and counseling for those screened positive, to better assess receipt of needed services. IPV is preventable. A technical package recently published by the Centers for Disease Control and Prevention compiles the best available evidence for prevention of IPV.57 These evidence-based strategies and approaches, coupled with screening for past and or current IPV, can have a lasting impact on rates of IPV.
Acknowledgments
Brian Morrow, MA, Division of Reproductive Health, National Center for Chronic Disease Prevention and Health Promotion, Centers for Disease Control and Prevention. PRAMS Working Group: Alabama—Izza Afgan, MPH; Alaska—Kathy Perham-Hester, MS, MPH; Arkansas—Mary McGehee, PhD; Colorado—Rickey Tolliver, MPHC; Connecticut—Jennifer Morin, MPH; Delaware—George Yocher, MS; Florida—Elizabeth C. Stewart, MSPH; Georgia—Florence A. Kanu, MPH; Hawaii—Matt Shim, PhD, MPH; Illinois—Patricia Kloppenburg, MT (ASCP), MPH; Iowa—Jessica Egan; Kentucky—Tracey D. Jewell, MPH; Louisiana—Rosaria Trichilo, MPH; Maine—Tom Patenaude, MPH; Maryland—Laurie Kettinger, MS; Massachusetts—Emily Lu, MPH; Michigan—Peterson Haak; Minnesota—Mira Grice Sheff, PhD, MS; Mississippi—Brenda Hughes, MPPA; Missouri—David McBride, PhD; Montana—Emily Healy, MS; Nebraska—Jessica Seberger; New Hampshire—David J. Laflamme, PhD, MPH; New Jersey—Sharon Smith Cooley, MPH; New Mexico—Oralia Flores; New York State—Anne Radigan; New York City—Pricila Mullachery, MPH; North Carolina—Kathleen Jones-Vessey, MS; North Dakota—Grace Njau, MPH; Ohio—Connie Geidenberger, PhD; Oklahoma—Ayesha Lampkins, MPH, CHES; Oregon—Claudia W. Bingham, MPH; Pennsylvania—Tony Norwood; Rhode Island—Karine Tolentino Monteiro, MPH; South Carolina—Kristin Simpson, MSW, MPA; Texas—Tanya Guthrie, PhD; Tennessee—Ramona Lainhart, PhD; Utah—Nicole Stone; Vermont—Peggy Brozicevic; Virginia—Sara Varner, MPH; Washington—Linda Lohdefinck; West Virginia—Melissa Baker, MA; Wisconsin—Christopher Huard; Wyoming—Lorie Chesnut, PhD.
Funding Information
No funding was received for this article.
Footnotes
Disclaimer
The findings and conclusions in this article are those of the authors and do not necessarily represent the official position of the Centers for Disease Control and Prevention.
Author Disclosure Statement
No competing financial interests exist.
AK, AL AR, CO, CT, DE, GA, HI, IA, IL, LA, ME, MD, MA, MI, MN, MS, MO, NE, NH, NJ, NM, NYC, NY, OH, OK, OR, PA, RI, TN, TX, UT, VA, VT, WA, WV, WI, and WY.
Given that PRAMS surveillance includes New York City, this study will use the terms “site” and “state” interchangeably when referencing the geographic entity from which the sample was drawn.
References
- 1.Breiding MJ, Basile KC, Smith SG, Black MC, Mahendra RR. Intimate partner violence surveillance: Uniform definitions and recommended data elements, version 2.0 Atlanta, GA: National Center for Injury Prevention and Control, Centers for Disease Control and Prevention, 2015. [Google Scholar]
- 2.Black MC. Intimate partner violence and adverse health consequences: Implications for clinicians. Am J Lifestyle Med 2011;5:428–439. [Google Scholar]
- 3.Petrosky E, Blair JM, Betz CJ, Fowler KA, Jack SP, Lyons BH. Racial and ethnic differences in homicides of adult women and the role of intimate partner violence—United States, 2003–2014. MMWR Morb Mortal Wkly Rep 2017; 66:741–746. [DOI] [PMC free article] [PubMed] [Google Scholar]
- 4.Smith SG, Zhang X, Basile KC, et al. The National Intimate Partner and Sexual Violence Survey (NISVS): 2015 Data brief. Atlanta, GA: National Center for Injury Prevention and Control, Centers for Disease Control and Prevention, 2018. [Google Scholar]
- 5.Moyer VA; U.S. Preventive Services Task Force (USPSTF). Screening for intimate partner violence and abuse of elderly and vulnerable adults: U.S. preventive services task force recommendation statement. Ann Intern Med 2013;158: 478–486. [DOI] [PubMed] [Google Scholar]
- 6.Bailey BA. Partner violence during pregnancy: Prevalence, effects, screening, and management. Int J Womens Health 2010;2:183–197. [DOI] [PMC free article] [PubMed] [Google Scholar]
- 7.Alhusen JL, Ray E, Sharps P, Bullock L. Intimate partner violence during pregnancy: Maternal and neonatal outcomes. J Womens Health (Larchmt) 2015;24:100–106. [DOI] [PMC free article] [PubMed] [Google Scholar]
- 8.Gilbert L, El-Bassel N, Chang M, Wu E, Roy L. Substance use and partner violence among urban women seeking emergency care. Psychol Addict Behav 2012;26: 226–235. [DOI] [PMC free article] [PubMed] [Google Scholar]
- 9.El-Bassel N, Gilbert L, Wu E, Go H, Hill J. Relationship between drug abuse and intimate partner violence: A longitudinal study among women receiving methadone. Am J Public Health 2005;95:465–470. [DOI] [PMC free article] [PubMed] [Google Scholar]
- 10.Agrawal A, Ickovics J, Lewis JB, Magriples U, Kershaw TS. Postpartum intimate partner violence and health risks among young mothers in the United States: A prospective study. Matern Child Health J 2014;18:1985–1992. [DOI] [PMC free article] [PubMed] [Google Scholar]
- 11.Connelly CD, Hazen AL, Baker-Ericzén MJ, Landsverk J, Horwitz SM. Is screening for depression in the perinatal period enough? The co-occurrence of depression, substance abuse, and intimate partner violence in culturally diverse pregnant women. J Womens Health (Larchmt) 2013;22:844–852. [DOI] [PMC free article] [PubMed] [Google Scholar]
- 12.Bonomi AE, Thompson RS, Anderson M, et al. Intimate partner violence and women’s physical, mental, and social functioning. Am J Prev Med 2006;30:458–466. [DOI] [PubMed] [Google Scholar]
- 13.Seth P, Wingood GM, Robinson LS, Raiford JL, DiClemente RJ. Abuse impedes prevention: The intersection of intimate partner violence and HIV/STI risk among young African American women. AIDS Behav 2015;19:1438–1445. [DOI] [PMC free article] [PubMed] [Google Scholar]
- 14.Tufts KA, Clements PT, Wessell J. When intimate partner violence against women and HIV collide: Challenges for healthcare assessment and intervention. J Forensic Nurs 2010;6:66–73. [DOI] [PubMed] [Google Scholar]
- 15.Sareen J, Pagura J, Grant B. Is intimate partner violence associated with HIV infection among women in the United States? Gen Hosp Psychiatry 2009;31:274–278. [DOI] [PubMed] [Google Scholar]
- 16.Gielen AC, McDonnell KA, O’Campo PJ. Intimate partner violence, HIV status, and sexual risk reduction. AIDS Behav 2002;6:107–116. [Google Scholar]
- 17.Wingood GM, DiClemente RJ, Raj A. Adverse consequences of intimate partner abuse among women in non-urban domestic violence shelters. Am J Prev Med 2000;19: 270–275. [DOI] [PubMed] [Google Scholar]
- 18.American College of Obstetricians and Gynecologist (ACOG). Committee opinion no. 518: Intimate partner violence. Obstet Gynecol 2012;119:412–417. [DOI] [PubMed] [Google Scholar]
- 19.Shah PS, Shah J; Knowledge Synthesis Group on Determinants of Preterm/LBW Births. Maternal exposure to domestic violence and pregnancy and birth outcomes: A systematic review and meta-analyses. J Womens Health (Larchmt) 2010;19:2017–2031. [DOI] [PubMed] [Google Scholar]
- 20.Novello AC, Rosenberg M, Saltzman L, Shosky J. From the Surgeon General, US Public Health Service. JAMA 1992; 267:3132. [DOI] [PubMed] [Google Scholar]
- 21.American Public Health Association. Policy statement 9211 (PP): Domestic violence. Am J Public Health 1993;83: 458–463.8438991 [Google Scholar]
- 22.Saltzman LE, Johnson D. CDC’s family and intimate violence prevention team: Basing programs on science. J Am Med Womens Assoc 1996;51:83–86. [PubMed] [Google Scholar]
- 23.Todahl J, Walters E. Universal screening for intimate partner violence: A systematic review. J Marital Fam Ther 2011;37:355–369. [DOI] [PubMed] [Google Scholar]
- 24.Health Resources and Services Administration (HRSA). Women’s preventive services guidelines. Available at: www.hrsa.gov/womens-guidelines-2016/index.html Accessed September 12, 2016.
- 25.American Medical Association. Preventing, identifying & treating violence & abuse. AMA Code of Medical Ethics: Opinion 8.10 Available at: www.ama-assn.org/delivering-care/ethics/preventing-identifying-treating-violence-abuse Accessed September 12, 2016. [Google Scholar]
- 26.McCall-Hosenfeld JS, Chuang CH, Weisman CS. Prospective association of intimate partner violence with receipt of clinical preventive services in women of reproductive age. Womens Health Issues 2013;23:e109–e116. [DOI] [PMC free article] [PubMed] [Google Scholar]
- 27.Cha S, Masho SW. Discussions about intimate partner violence during prenatal care in the United States: The role of race/ethnicity and insurance status. Matern Child Health J 2014;18:1413–1422. [DOI] [PubMed] [Google Scholar]
- 28.Dunn D, McCartney A. Asking the tough questions: Obstetrical screening for depression and intimate partner violence. J Health Care Poor Underserved 2014;25:1496–1506. [DOI] [PubMed] [Google Scholar]
- 29.Ta Park VM, Hayes DK, Humphreys J. Disparities in intimate partner violence prenatal counseling: Setting a baseline for the implementation of the Guidelines for Women’s Preventive Services. Hawaii J Med Public Health 2014;73: 137–143. [PMC free article] [PubMed] [Google Scholar]
- 30.Clark KA, Martin SL, Petersen R, et al. Who gets screened during pregnancy for partner violence? Arch Fam Med 2000; 9:1093–1099. [DOI] [PubMed] [Google Scholar]
- 31.Sugg NK, Thompson RS, Thompson DC, et al. Domestic violence and primary care. Attitudes, practices, and beliefs. Arch Fam Med 1999;8:301–306. [DOI] [PubMed] [Google Scholar]
- 32.Rodriguez MA, Bauer HM, McLoughlin E, Grumbach K. Screening and intervention for intimate partner abuse: Practices and attitudes of primary care physicians. JAMA 1999;282:468–474. [DOI] [PubMed] [Google Scholar]
- 33.Soglin LF, Bauchat J, Soglin DF, Martin GJ. Detection of intimate partner violence in a general medicine practice. J Interpers Violence 2009;24:338–348. [DOI] [PubMed] [Google Scholar]
- 34.Borowsky IW, Ireland M. Parental screening for intimate partner violence by pediatricians and family physicians. Pediatrics 2002;110:509–516. [DOI] [PubMed] [Google Scholar]
- 35.Shulman HB, D’Angelo DV, Harrison L, Smith RA, Warner L. The Pregnancy Risk Assessment Monitoring System (PRAMS): Overview of design and methodology. Am J Public Health 2018;108:1305–1313. [DOI] [PMC free article] [PubMed] [Google Scholar]
- 36.Thompson RS, Bonomi AE, Anderson M, et al. Intimate partner violence: Prevalence, types, and chronicity in adult women. Am J Prev Med 2006;30:447–457. [DOI] [PubMed] [Google Scholar]
- 37.Vest JR, Catlin TK, Chen JJ, Brownson RC. Multistate analysis of factors associated with intimate partner violence. Am J Prev Med 2002;22:156–164. [DOI] [PubMed] [Google Scholar]
- 38.Chu SY, Goodwin MM, D’Angelo DV. Physical violence against U.S. women around the time of pregnancy, 2004–2007. Am J Prev Med 2010;38:317–322. [DOI] [PubMed] [Google Scholar]
- 39.Durant T, Colley Gilbert B, Saltzman LE, Johnson CH. Opportunities for intervention: Discussing physical abuse during prenatal care visits. Am J Prev Med 2000;19: 238–244. [DOI] [PubMed] [Google Scholar]
- 40.Bieler GS, Brown GG, Williams RL, Brogan DJ. Estimating model adjusted risks, risk differences, and risk ratios from complex survey data. Am J Epidemiol 2010;171: 618–623. [DOI] [PubMed] [Google Scholar]
- 41.Breedlove G, Fryzelka D. Depression screening during pregnancy. J Midwifery Womens Health 2011;56:18–25. [DOI] [PubMed] [Google Scholar]
- 42.LaRocco-Cockburn A, Melville J, Bell M, Katon W. Depression screening attitudes and practices among obstetrician-gynecologists. Obstet Gynecol 2003;101(Pt 1):892–898. [DOI] [PubMed] [Google Scholar]
- 43.Silverman JG, Decker MR, Reed E, Raj A. Intimate partner violence victimization prior to and during pregnancy among women residing in 26 U.S. states: Associations with maternal and neonatal health. Am J Obstet Gynecol 2006; 195:140–148. [DOI] [PubMed] [Google Scholar]
- 44.Cha S, Masho SW. Intimate partner violence and utilization of prenatal care in the United States. J Interpers Violence 2014;29:911–927. [DOI] [PubMed] [Google Scholar]
- 45.Gazmararian JA, Lazorick S, Spitz AM, Ballard T, Saltzman L, Marks JS. Prevalence of violence against pregnant women. JAMA 1996;275:1915–1920. [PubMed] [Google Scholar]
- 46.Miller E, McCaw B, Humphreys BL, Mitchell C. Integrating intimate partner violence assessment and intervention into healthcare in the United States: A systems approach. J Womens Health (Larchmt) 2015;24:92–99. [DOI] [PMC free article] [PubMed] [Google Scholar]
- 47.Waalen J, Goodwin MM, Spitz AM, Petersen R, Saltzman LE. Screening for intimate partner violence by health care providers. Barriers and interventions. Am J Prev Med 2000; 19:230–237. [DOI] [PubMed] [Google Scholar]
- 48.Deshpande NA, Lewis-O’Connor A. Screening for intimate partner violence during pregnancy. Rev Obstet Gynecol 2013;6:141–148. [PMC free article] [PubMed] [Google Scholar]
- 49.Anderson BA, Marshak HH, Hebbeler DL. Identifying intimate partner violence at entry to prenatal care: Clustering routine clinical information. J Midwifery Womens Health 2002;47:353–359. [DOI] [PubMed] [Google Scholar]
- 50.Renker PR, Tonkin P. Women’s views of prenatal violence screening: Acceptability and confidentiality issues. Obstet Gynecol 2006;107(Pt 1):348–354. [DOI] [PubMed] [Google Scholar]
- 51.Chang JC, Dado D, Schussler S, et al. In person versus computer screening for intimate partner violence among pregnant patients. Patient Educ Couns 2012;88:443–448. [DOI] [PMC free article] [PubMed] [Google Scholar]
- 52.Jones RK, Sonfield A. Health insurance coverage among women of reproductive age before and after implementation of the affordable care act. Contraception 2016;93: 386–391. [DOI] [PMC free article] [PubMed] [Google Scholar]
- 53.Arora P, Desai K. Impact of affordable care act coverage expansion on women’s reproductive preventive services in the United States. Prev Med 2016;89:224–229. [DOI] [PubMed] [Google Scholar]
- 54.Stolp H, Fox J. Increasing receipt of women’s preventive services. J Womens Health (Larchmt) 2015;24: 875–881. [DOI] [PMC free article] [PubMed] [Google Scholar]
- 55.Campbell JC, Webster D, Koziol-McLain J, et al. Risk factors for femicide in abusive relationships: Results from a multisite case control study. Am J Public Health 2003;93: 1089–1097. [DOI] [PMC free article] [PubMed] [Google Scholar]
- 56.Bianchi AL, McFarlane J, Nava A, Gilroy H, Maddoux J, Cesario S. Rapid assessment to identify and quantify the risk of intimate partner violence during pregnancy. Birth 2014;41:88–92. [DOI] [PubMed] [Google Scholar]
- 57.Niolon PH, Kearns M, Dills J, et al. Preventing intimate partner violence across the lifespan: A technical package of programs, policies, and practices. Atlanta, GA: National Center for Injury Prevention and Control, Centers for Disease Control and Prevention, 2017. [Google Scholar]